


Written by:

Reviewed by:


Bearish
Bullish
- June 25, 2026
- 32 min read
Bull Flag vs Bear Flag Trading Guide
There are many ways to analyse financial markets. Some traders focus on trend direction, others on momentum. But another practical approach is studying how price pauses after a strong price change, as if it were catching its breath, before continuing further in that same direction.
The question is how do you tell the difference between a normal pullback and a reversal?
One of the most common chart patterns built around this idea is the bull and bear flag pattern.
In this guide, you will learn how bull and bear flags work, how to identify the flagpole and consolidation phase, how these patterns behave in trending markets, and how traders use them within structured analysis to plan entries, stops, and targets.
What Are Bull Flags and Bear Flags?
Bull and bear flags are continuation patterns that appear on technical charts and indicate the direction of price. Traders usually focus on how the price breaks out from the Bull and Bear flag pattern, creating a trading opportunity.
In a bull flag pattern, the price usually remains within a specific area, signaling that enough momentum is building before providing a fresh, quick bullish move. The opposite is true for the bear flag, where a corrective flag pattern signals that the price can continue lower after a break.
In technical analysis, flags work as price continuation opportunities. Usually, this pattern appears within a trend and signals minor profit-taking or a small pause before continuing the existing trend.
However, trading bull and bear flags requires additional attention, as investors should have a clear understanding of what they look like on the chart, how to spot them, and how to enter and exit the market.
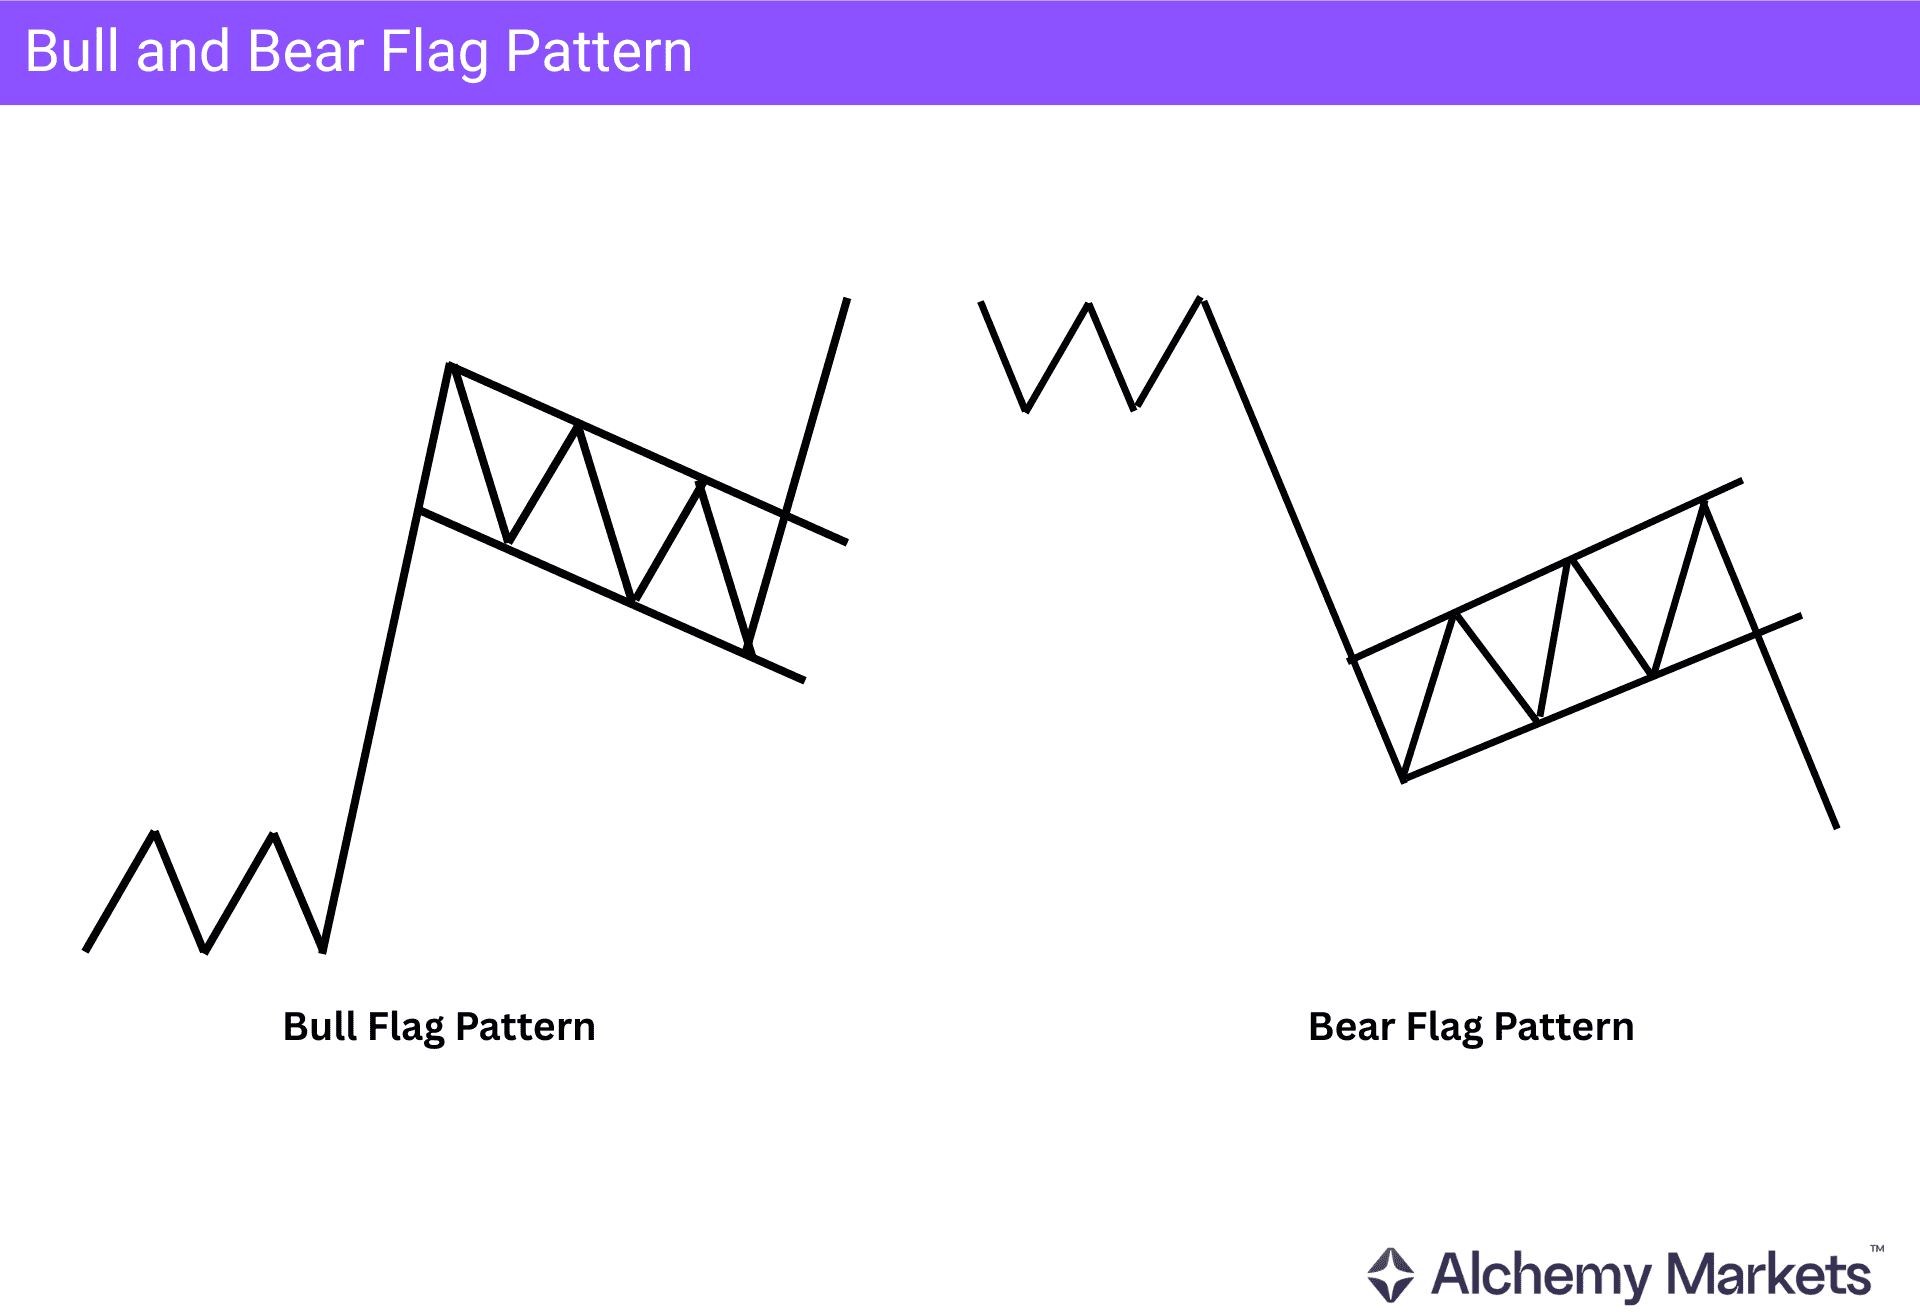
What a Bull Flag Looks Like
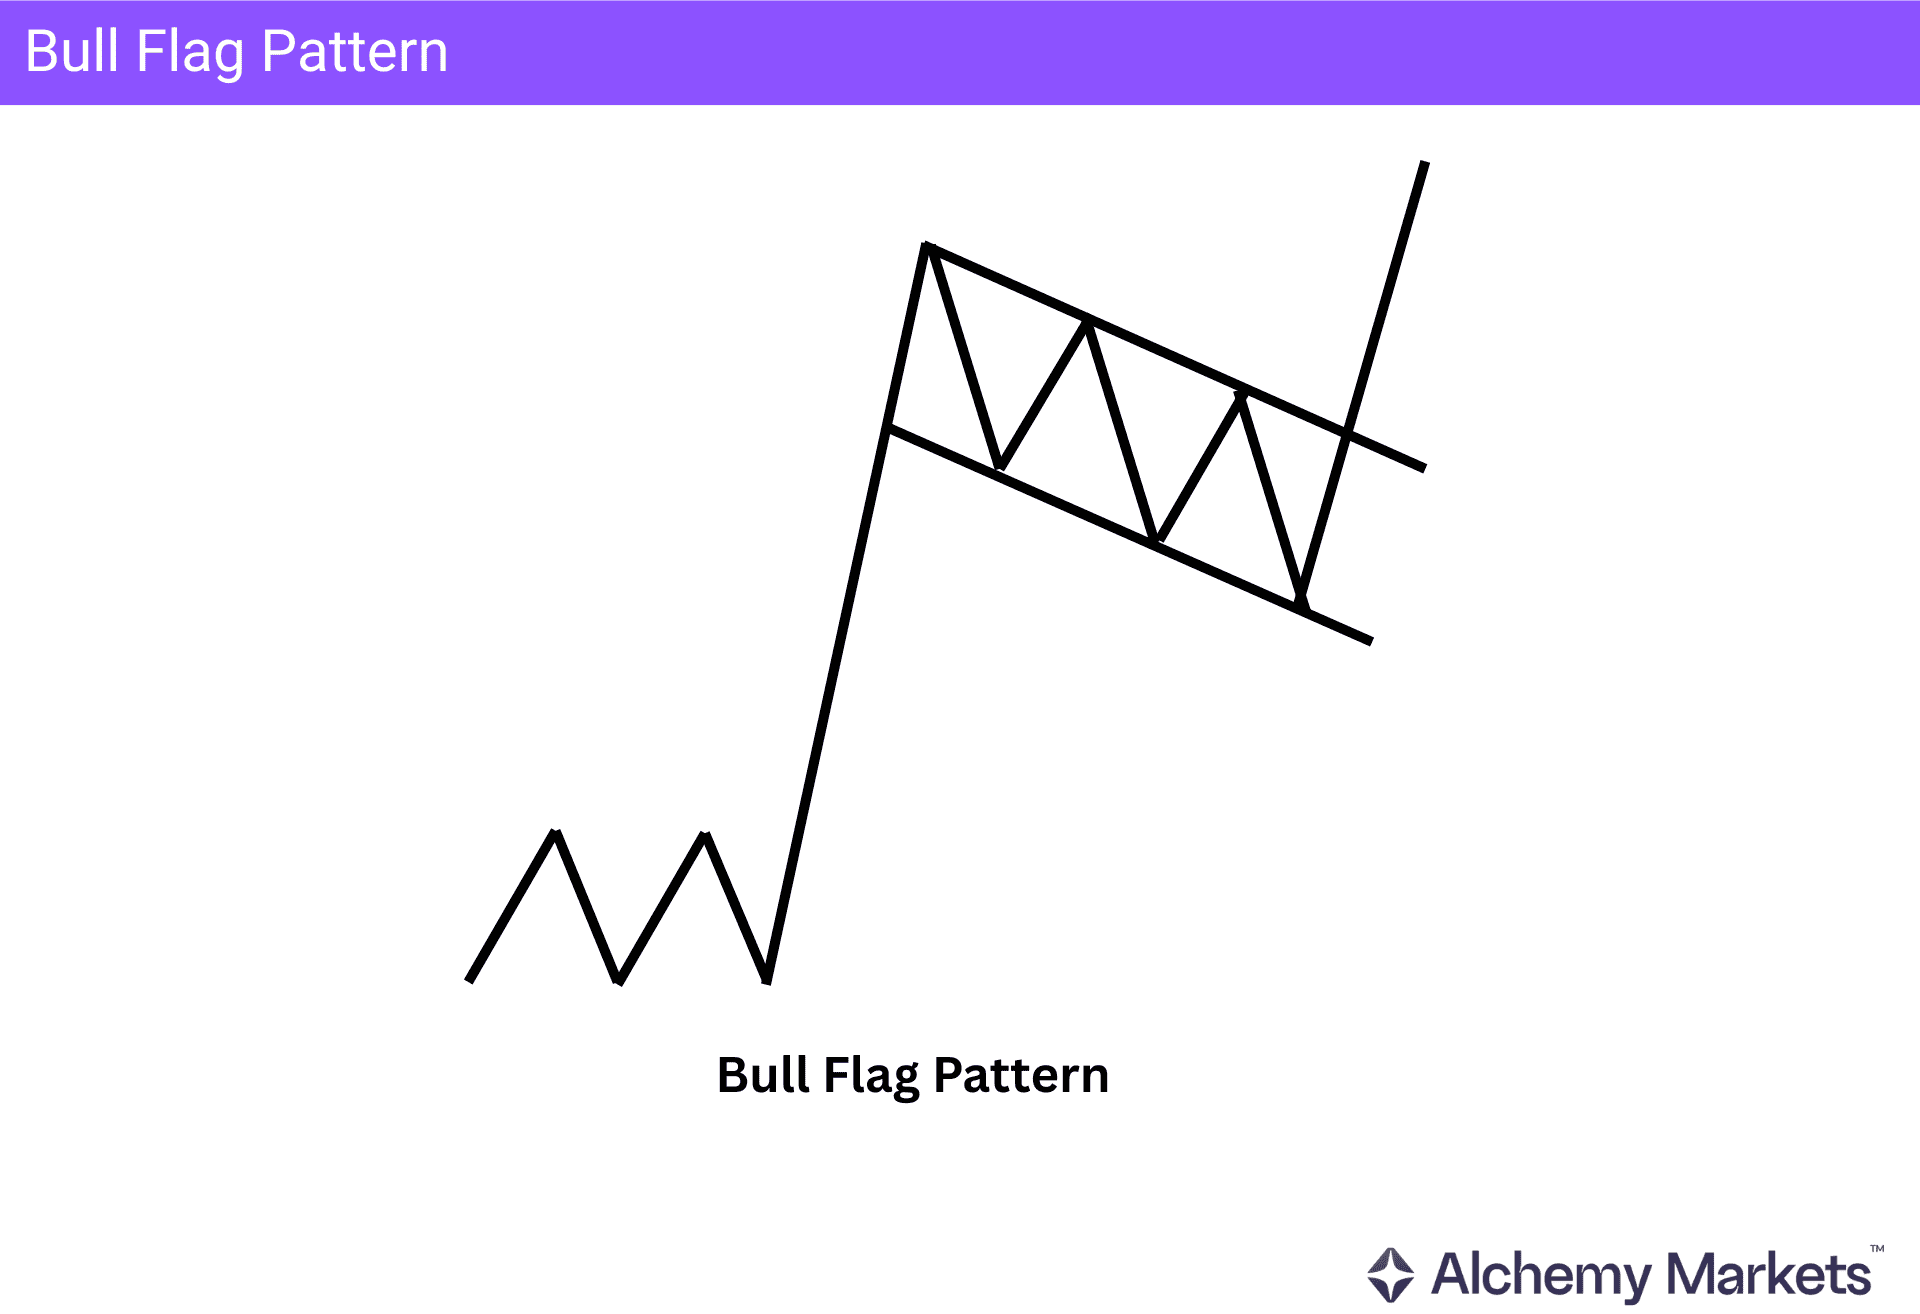
Before moving deeper, let’s have a look at the basic idea of how a bull flag forms and what characteristics it might have.
Primarily, the bull flag pattern is a corrective or sideways market momentum that comes after a strong initial up move. The pattern has several steps, but it ends with another strong push higher like the initial wave.
In a bull flag formation, you might see the following characteristics:
- A large initial price increase.
- A minor downward, sideways channel.
- A valid breakout from the range-bound phase, resulting in a price increase.
What a Bear Flag Looks Like
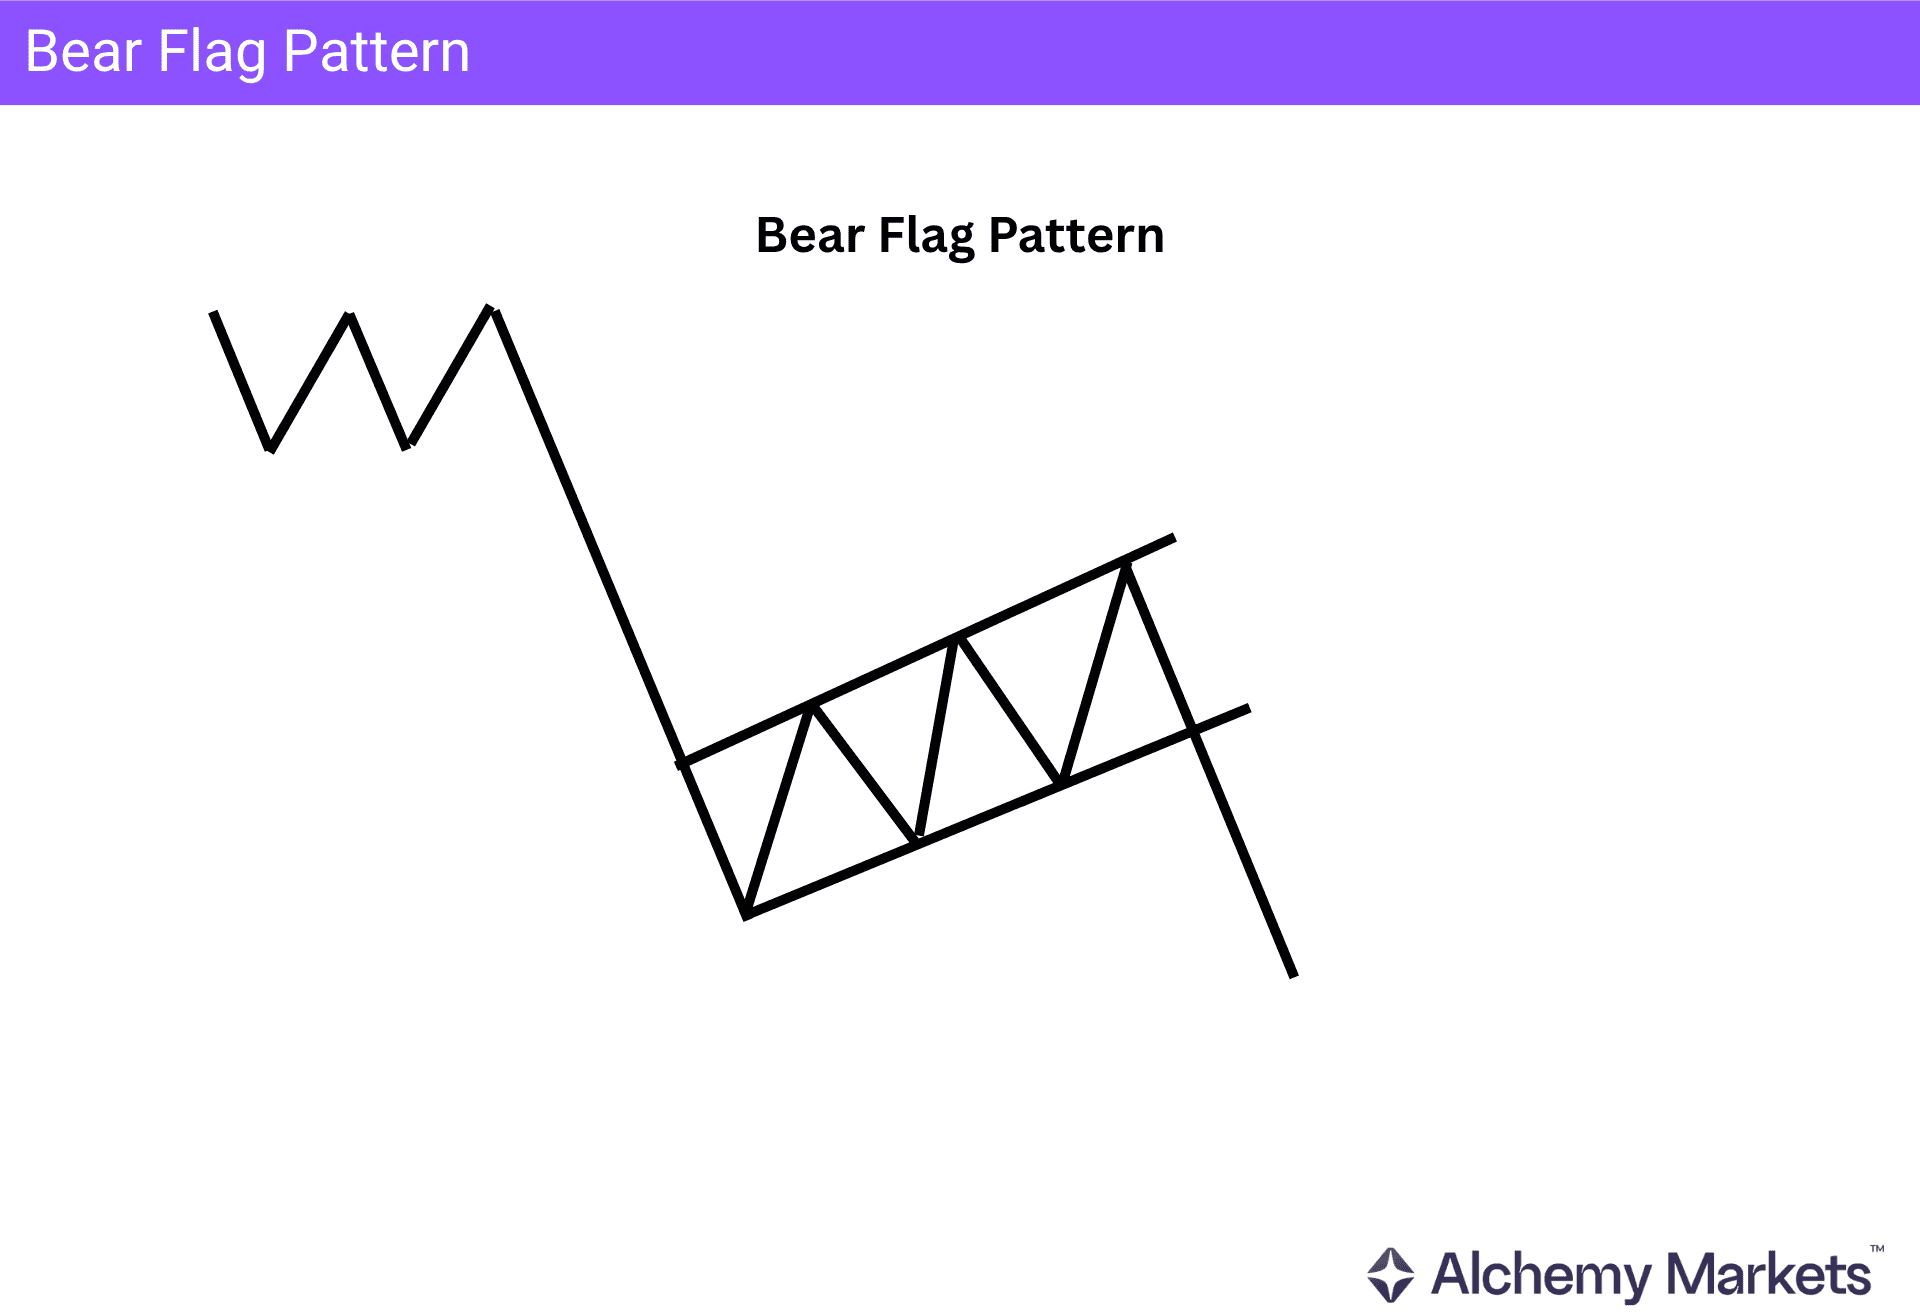
Like the bull flag pattern, the bear flag is a corrective or sideways market momentum that comes after a strong initial down move. Finally, the pattern completes with another strong push lower like the initial wave.
In trading flag patterns, you might see these characteristics:
- A large initial price decrease.
- A minor upward, sideways channel.
- A valid breakout from the range-bound phase, resulting in a price decrease.
How to Identify Bull and Bear Flag Patterns
Finding a flag pattern starts with reading how price behaves after a strong move.
A bull flag usually appears after a sharp push higher, while a bear flag usually appears after a sharp move lower. The key is to see whether price is pausing in a controlled way, or whether the pullback is starting to look more like a reversal.
A bull flag vs bear flag chart can help traders compare both setups side by side.
The bull flag usually forms a small downward or sideways channel after an upward flagpole, while the bear flag usually forms a small upward or sideways channel after a downward flagpole.
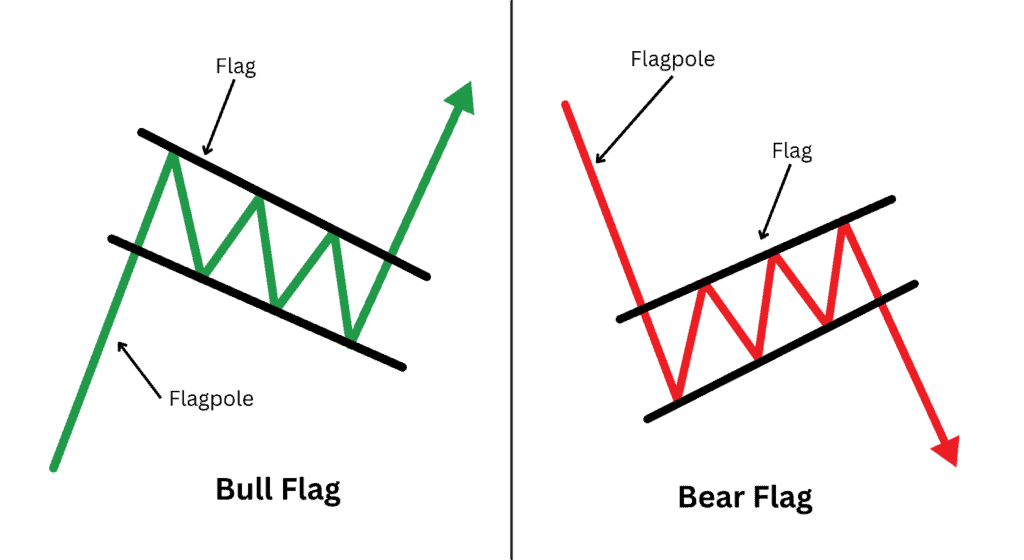
| Step 1: Identify the flagpole Start by looking for the impulsive move before the flag forms. In a bull flag, this is the strong upward move. In a bear flag, this is the strong downward move. The flagpole should stand out clearly from normal price action. Step 2: Draw the flag channel After the flagpole, price should begin to consolidate. This area is usually marked using parallel trend lines, with one trend line connecting the swing highs and another connecting the swing lows. In a bull flag, traders often watch the upper trendline for a possible breakout. In a bear flag, traders usually watch the lower trend line for a possible breakdown. Step 3: Check the depth of the pullback The flag should look like a pause, not a full reversal. As a general guide, traders often prefer the flag to stay within around 50% of the flagpole. A much deeper retracement may weaken the continuation setup. Step 4: Watch volume behaviour Volume often slows during the flagging phase. This suggests the counter-trend move is controlled, rather than showing strong reversal pressure. Breakout volume can help, but price action still matters more than volume alone. Step 5: Wait for confirmation The pattern becomes more useful once price breaks out of the flag channel. For a bull flag, this means price breaks above the upper trendline. For a bear flag, this means price breaks below the lower trend line. A successful retest of the broken level can offer extra confirmation that price is not being accepted back inside the flag. |
Bull and Bear Flag Characteristics
Finding bull and bear flags is easy if you can spot three basic characteristics of the pattern:
- Flag pole
- The flag pattern
- The pattern continuation
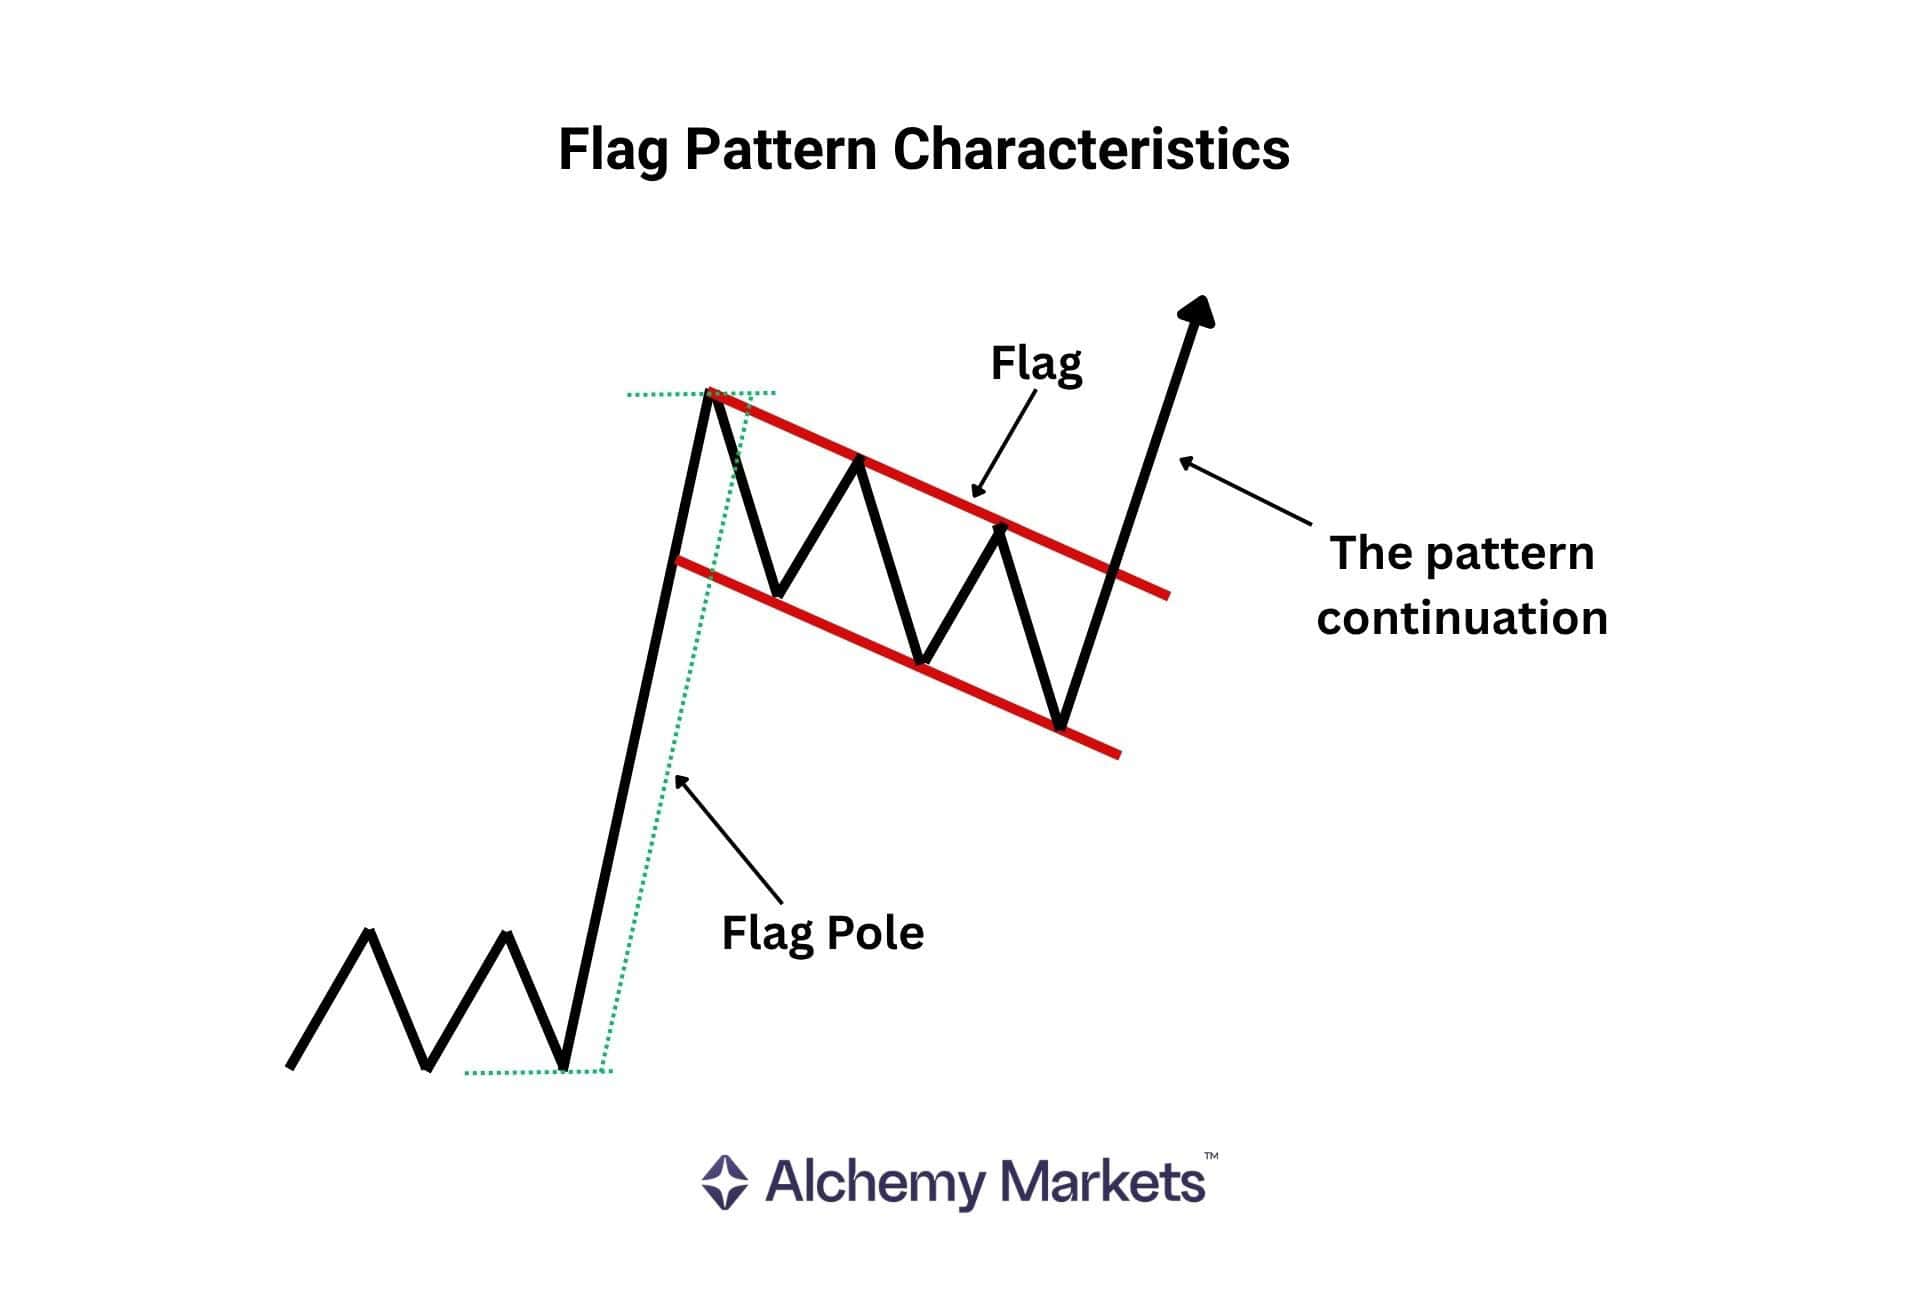
The Flag Pole
The flagpole is the beginning of the flag formation that comes with an impulse. For a buy trend, you can spot it by finding a sharp movement. Similarly, for a sell trend, it is easy to identify from a sharp sell movement.
So, if you want to identify a flag pattern, start by finding trending markets. However, finding a steeper and more aggressive price movement is often challenging in a volatile market structure.
But don’t worry!
If you don’t see any impulse in an instrument, don’t force yourself. You can simply check back later or move to another instrument.
The Flag Pattern
The flag pattern is the core area of the bull and bear flag, where a consolidative market momentum is visible. Investors should remain cautious when markets enter bull flag pullbacks.
The time spent in the consolidation phase is less important, but the price should not retrace more than 50% of the flagpole.
The Pattern Continuation
The pattern is validated when the price breaks out of the flag resistance for a bullish flag pattern or the flag support for a bearish pattern.
The price movement within the flag pattern signals a possible target point based on the breakout level.
Don’t worry too much about the target level; it is just to get an idea of the trading plan. We will discuss it in detail in a later section.
Volume Behavior in Bull and Bear Flags
Volume is a crucial element in flag patterns, as it reflects investor activity in a particular price area.
Within a bull flag pattern, volume should rise sharply in the flagpole area, signaling a strong buying trend.
However, the volume within the flag pattern should be decreasing.
This is key, as it tells us that the pullback is corrective and unlikely to follow through. It signals that selling activities are likely just people taking profits, or composed of only relatively small short positions.
A breakout with stronger volume can add confidence, but at the end of the day, price action is king. The breakout needs to hold outside of the flag to remain valid.
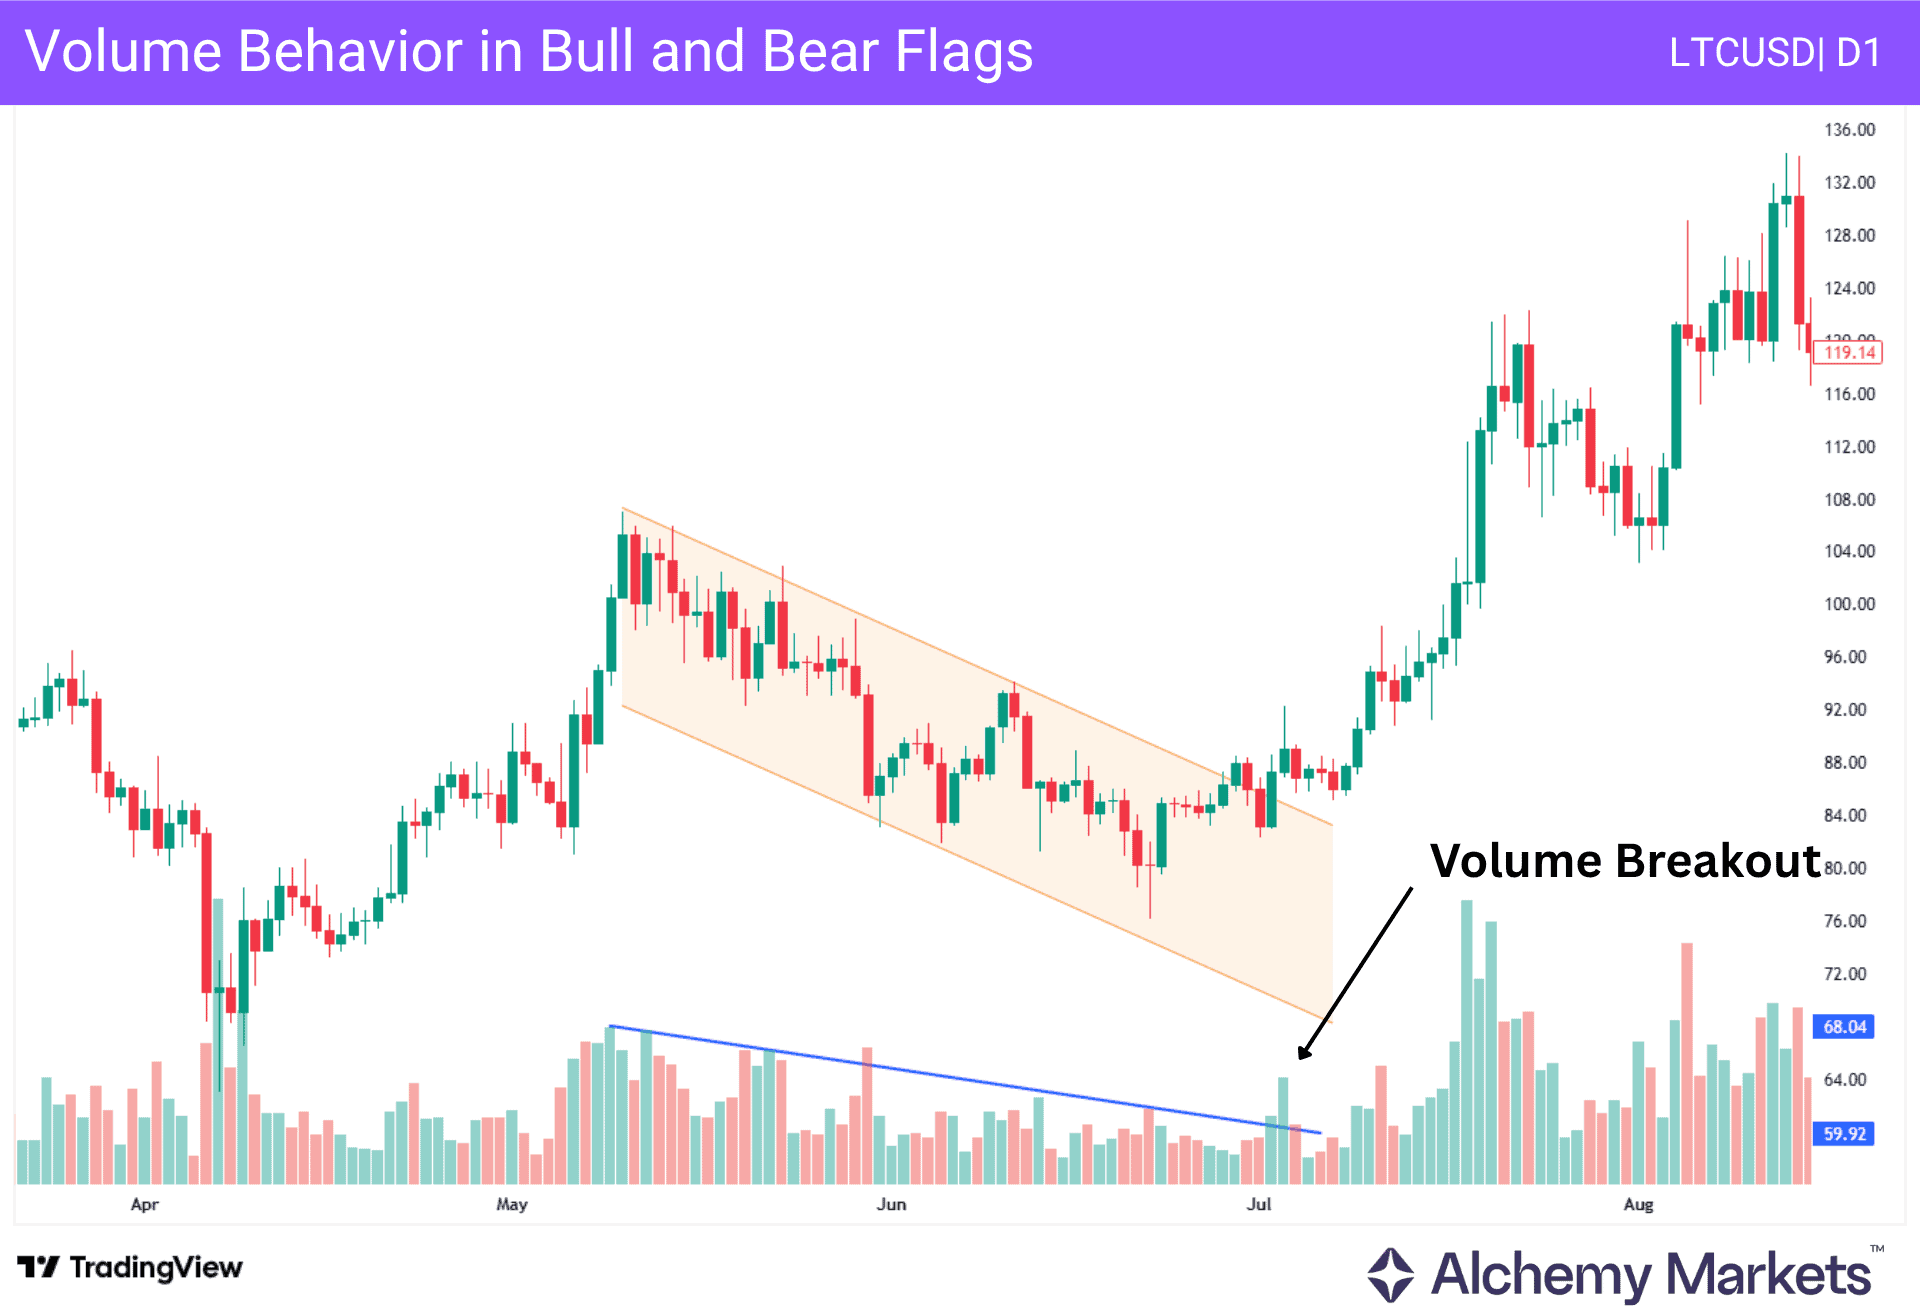
In the image above, we can see a bull flag breakout on Litecoin’s chart (LTCUSD). Notice that price flags out and price is gradually decreasing, a good signal that a flag is building.
Then, volume spikes at the breakout of the flag, giving traders more confidence that a significant bull flag break is about to occur.
Bull Flag vs Bear Flag Features Comparison Table
| Parameter | Bull Flag Pattern | Bear Flag Pattern |
| Entry type | The bull flag pattern offers a buy opportunity within a bullish trend. | The bear flag pattern offers a selling opportunity within a bearish trend. |
| How to Spot | A bullish impulse appears before forming the bull flag pattern. | A bearish impulse is visible before forming the bearish flag pattern. |
| Entry Condition | A buy entry comes when the price breaks out of the flag resistance. | A sell entry comes when the price breaks below the flag support. |
| Volume | The volume within the flag area should be low and will increase suddenly at the breakout of resistance. | The volume in the flag area should be slow, but it should rise during the break from the flag support. |
| Retracement | The maximum retracement level is 50% of the flagpole height | The maximum retracement level is 50% of the flagpole depth. |
How Does Bull Flag vs Bear Flag Trading Work?
A bull flag vs. a bear flag is a trading strategy with some conditions to follow. When this flag pattern appears on the chart, it signals trend continuation momentum only when the pattern completes.
In the bull flag versus bear flag strategy, traders need to pay close attention to price action within the flag pattern and volume structure. It is very crucial to monitor how the price reacts at the breakout time, as the price action and volume should support the move. To increase the probability, traders often use additional indicators like the Relative Strength Index or the MACD. Also, it provides a possible price movement. The ultimate success comes from following a decent risk management method.
If you are not familiar with using additional indicators with flag patterns, don’t worry. In the later section, we will see in detail with live examples.
What Does a Bull Flag vs Bear Flag Tell You
When a price pattern appears on the chart, it reflects traders’ activity. We all know the financial market is driven by larger investors or institutional activity. The price action and patterns on the chart reflect what larger investors are doing with the price. A retail trader can take the best out of the market by following the footsteps of larger investors.
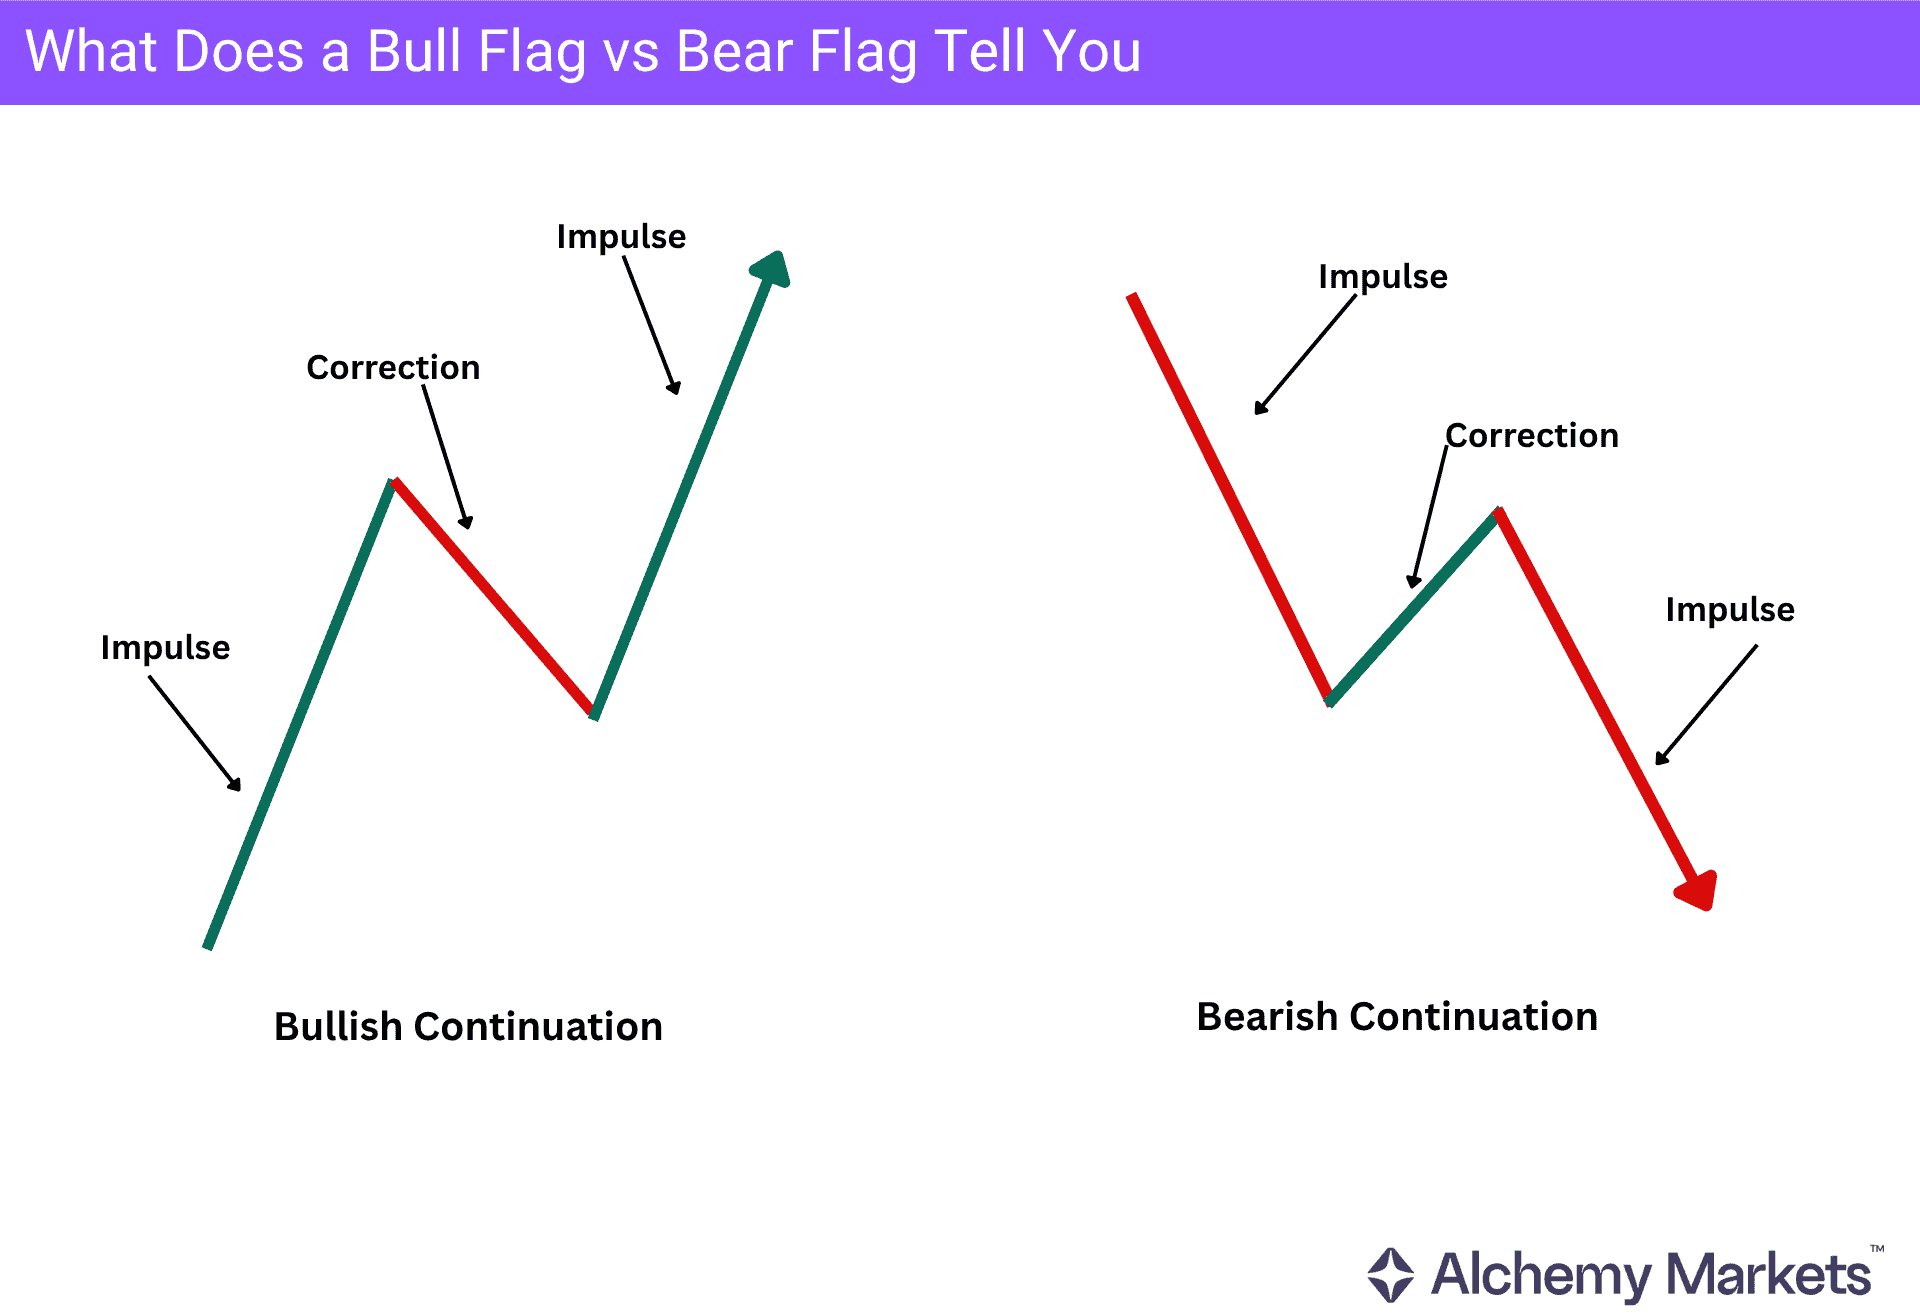
A bull flag simply tells you that an uptrend market is active. But the buy continuation will not happen instantly. Larger investors who have initiated the buy need to offload some of their orders due to profit-taking. The corrective sideways pattern within the flag area signals that investors are taking profits, but the price can resume momentum at any time.
It is very important to understand what type of price action we are seeing within the flag pattern. The corrective price section signals profit-taking and a possible trend continuation, and aggressive counter trend momentum from the flagpole could indicate a trend reversal.
Importance of Bull Flag vs Bear Flag
In technical analysis, the classical approach is to follow the market trend, as any strategy aligned with the major market momentum yields a higher success rate.
As a bull flag vs bear flag is a trend continuation strategy, it can provide better results if investors follow the conditions carefully.
Of course, proper money management and strong trading psychology are mandatory, given the financial market’s uncertainty and the fact that prices can move in any direction.
If you want to build a complete trading strategy using the bull flag and bear flag pattern, you can do it as a trend-following method. However, if you are trading with your own strategy, you can use the bull flag and bear flag patterns to understand the market context and find the market trend.
Bull Flag Chart Example
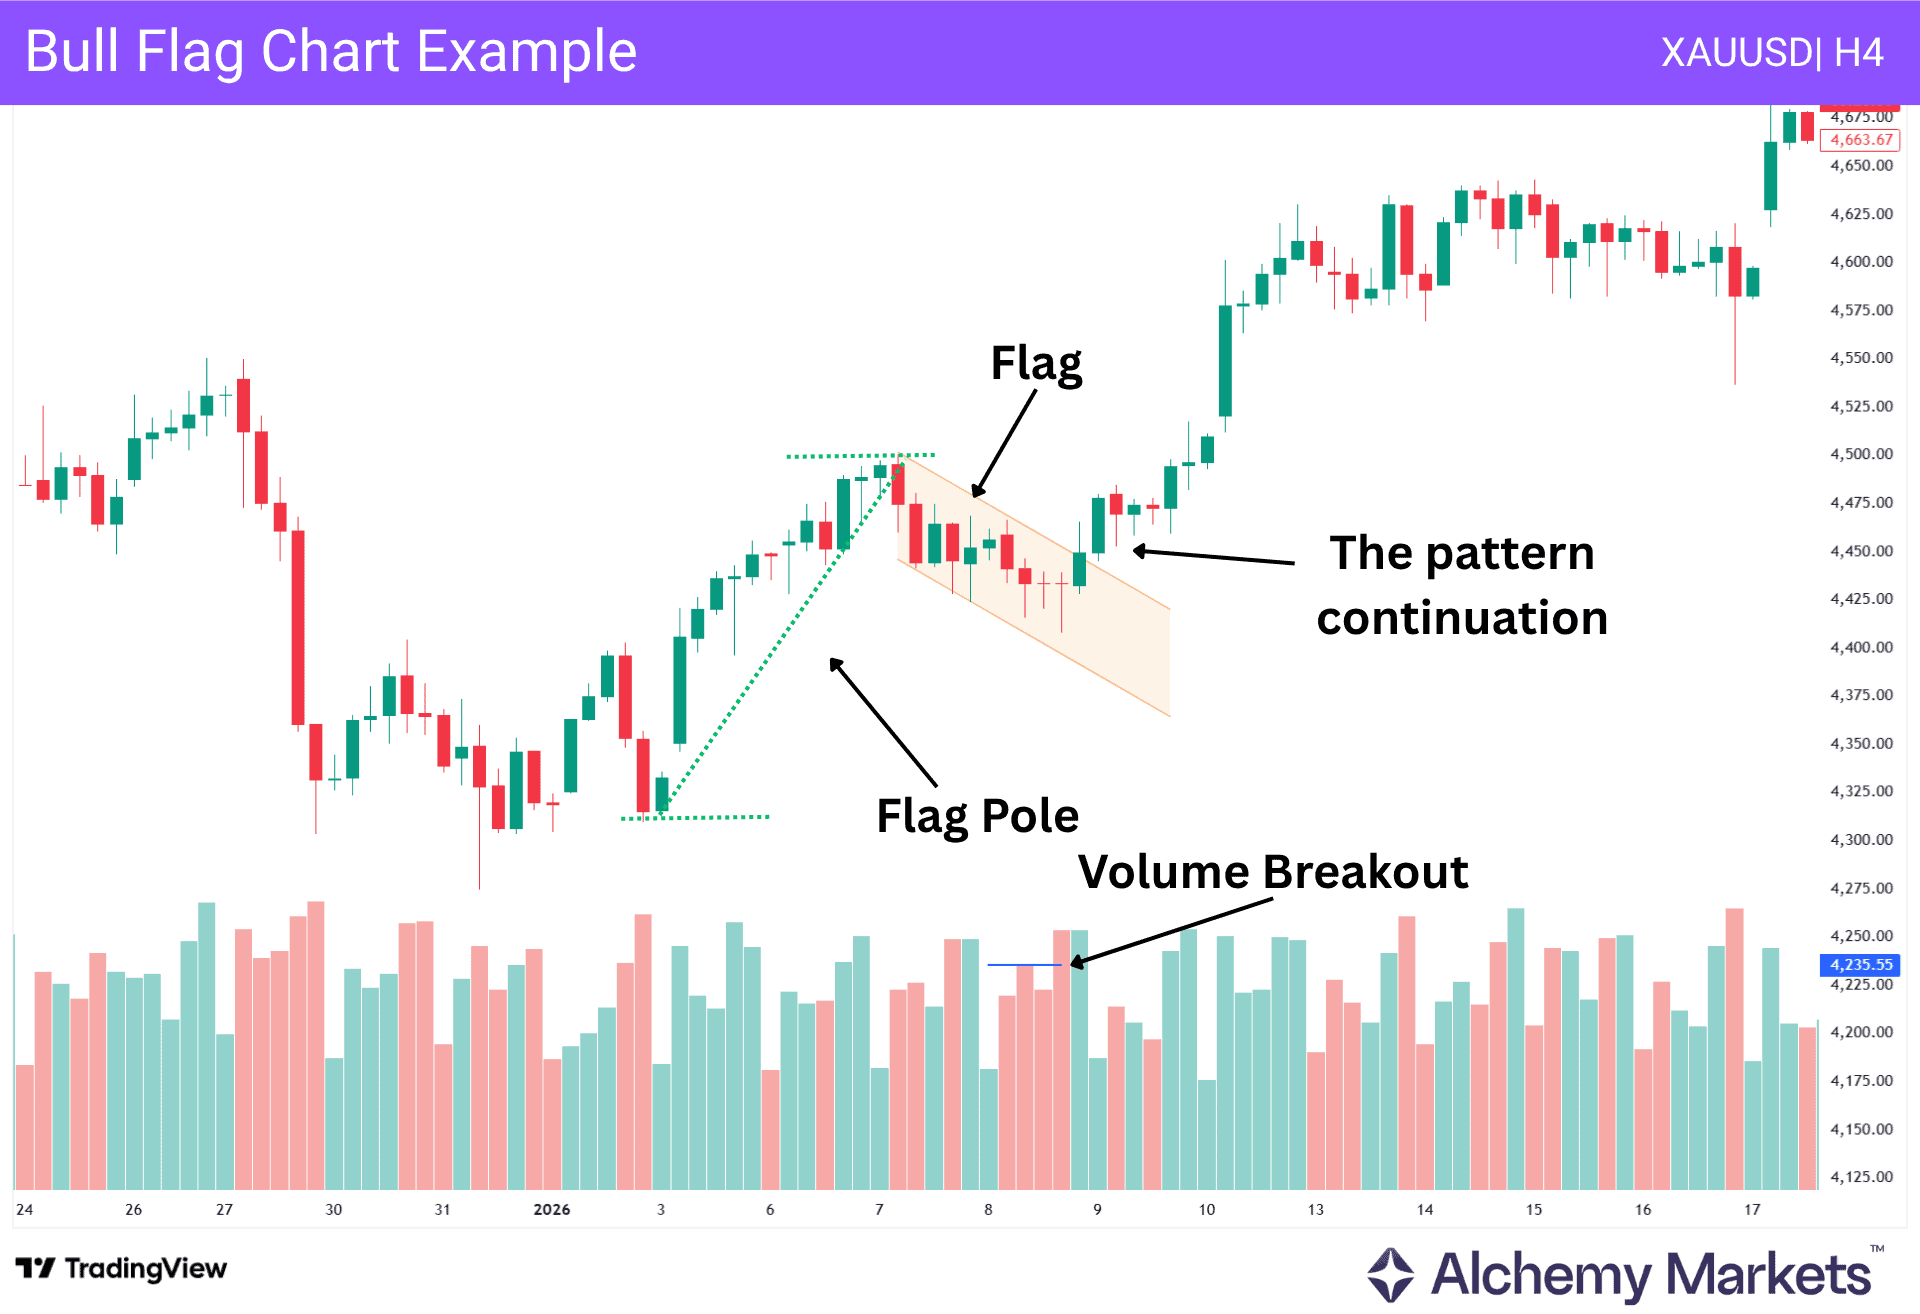
In the bull flag pattern, we can see the four-hour chart of gold, where an existing bullish trend continuation is present. The price rebounded, initiating a bullish recovery and forming a flagpole.
Later on, after finding a peak, the price continued lower within a bullish flag pattern. The corrective bearish price action is visible within the pattern.
Before forming a bullish breakout, you can see multiple doji and hammer doji candlesticks forming, signaling a higher corrective momentum. Once the breakout happens, a rise in volume is clear, as the vertical line creates a new high in the volume indicator.
After forming the breakout, the price initiated an immediate bullish continuation, pushing even higher.
Bear Flag Chart Example
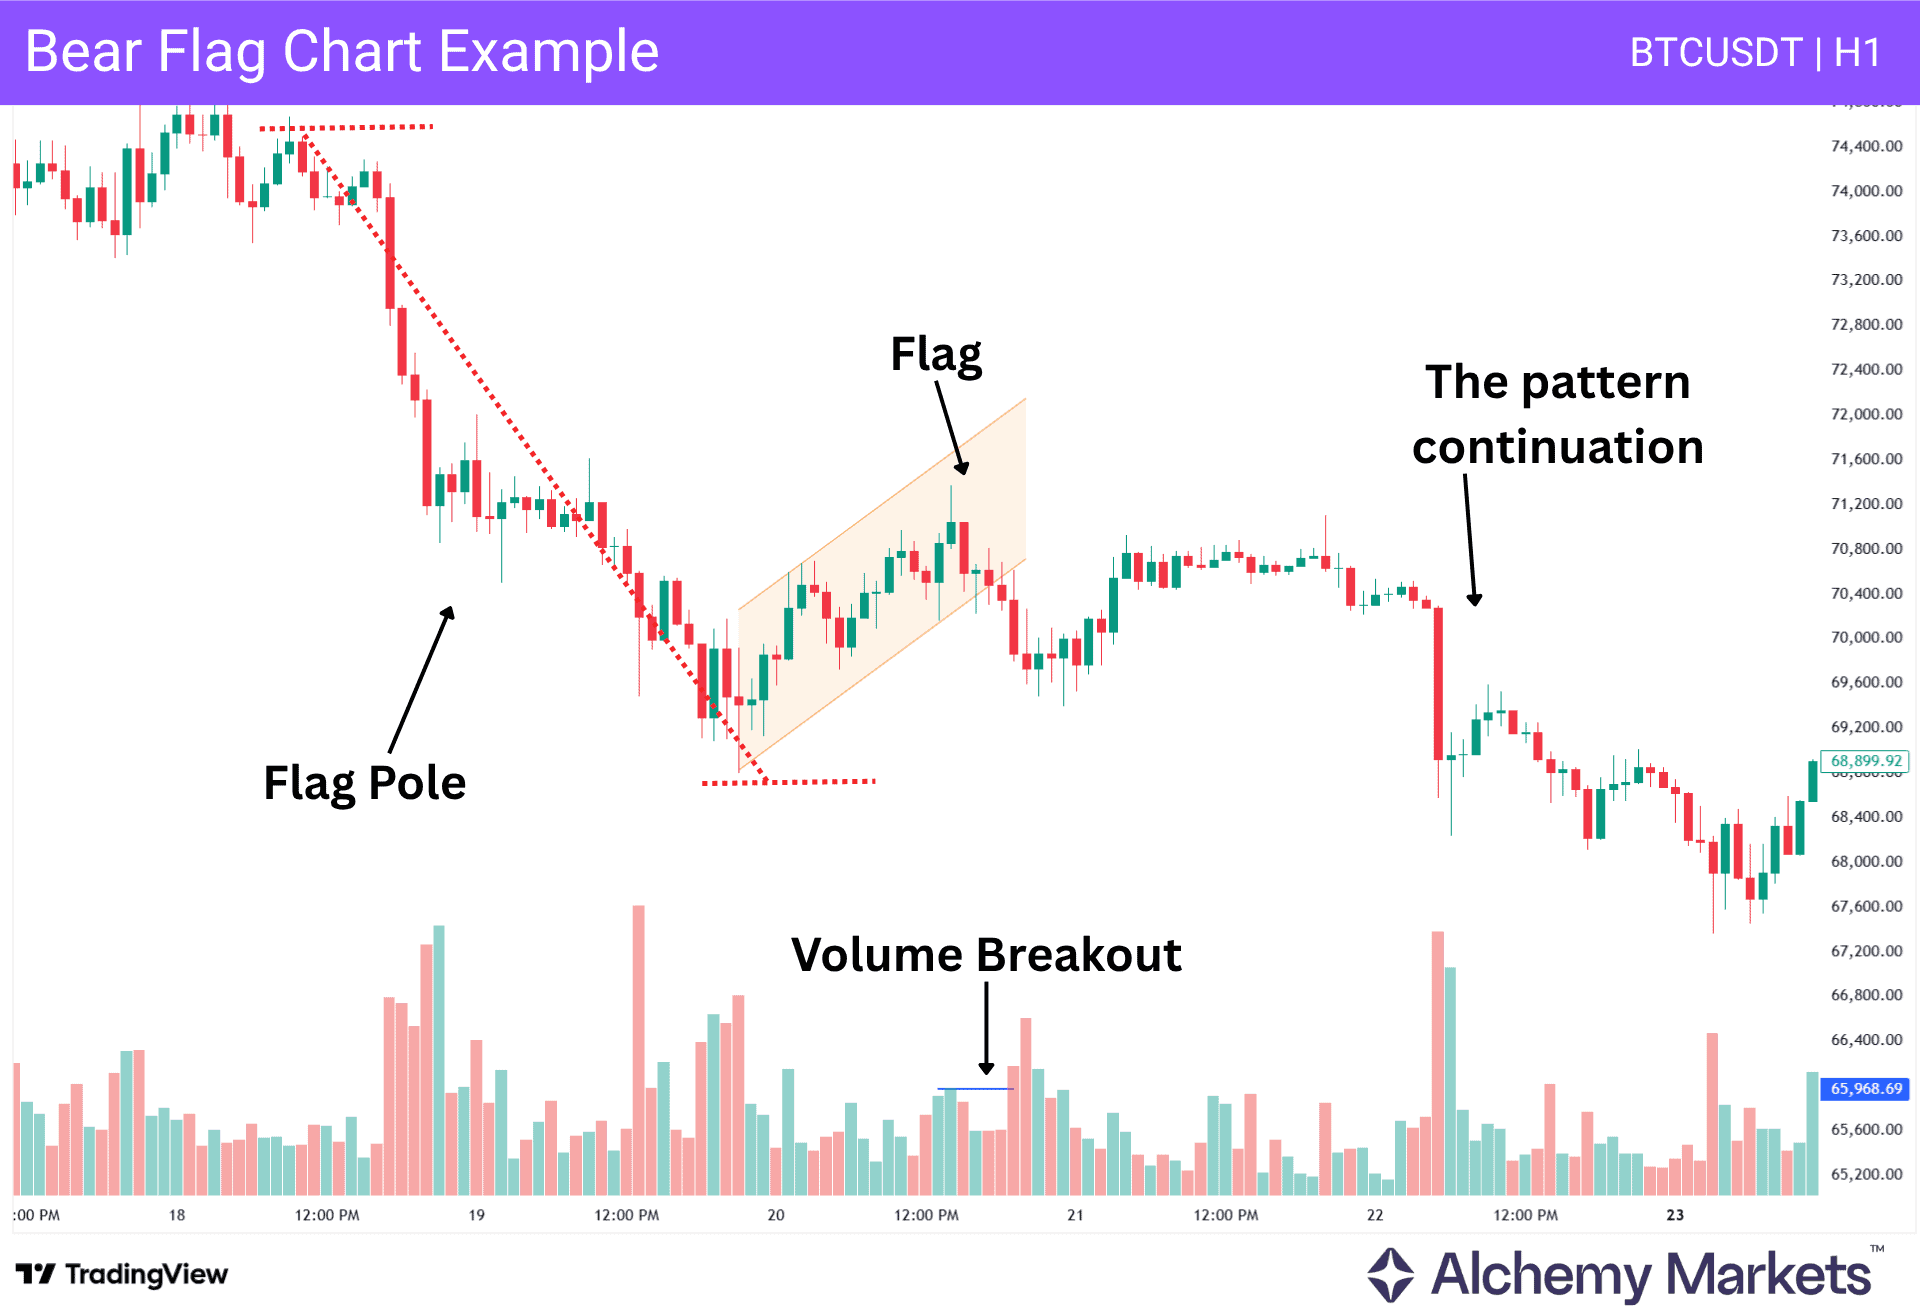
In the bear flag pattern, a strong ongoing downtrend is visible in the BTCUSD hourly chart, as the price initiated the trend with a range breakout. After finding a bottom, the price moved within a bear flag pattern with corrective momentum.
In this example, an immediate bearish reversal is visible within the flag pattern before forming the breakout. Finally, the breakout occurred, but the speed was unsatisfactory. It is assumed that sellers might need some time to continue the downside pressure. As a result, the price rebounded higher to the breakout point and offered a re-entry towards trending markets.
The volume indicator shows a clear breakout, with a sudden rise following three consecutive similar volume lines. As a result, the price continued lower and provided a decent short opportunity.
Bull and Bear Flags Trading Strategies
Flag practical trading strategies involve identifying specific market conditions and following them with sound money and risk management systems. We suggest aiming for a minimum 1:2 risk-reward ratio on flag breakouts.
In the following, investors will see real-world examples of several flag trading strategies. Investors are advised to seek out flag patterns offering better risk-reward ratios, we recommend better than a 1:2 risk-reward ratio for maximum benefit.
Entry / Exit Points for Bull and Bear Flags
Bull and bear flags are useful because they give traders a clear structure to work with. The pattern shows where price has paused, where continuation may be confirmed, and where the setup would likely be invalidated.
For bull and bear flag entry points, traders can follow either of the following models:
- Enter at the close of the breakout candle; stop loss orders on the other side of the flag channel.
- Enter at the successful retest of the flag pattern; retest candle moves in the direction of breakout. Same stop loss method.
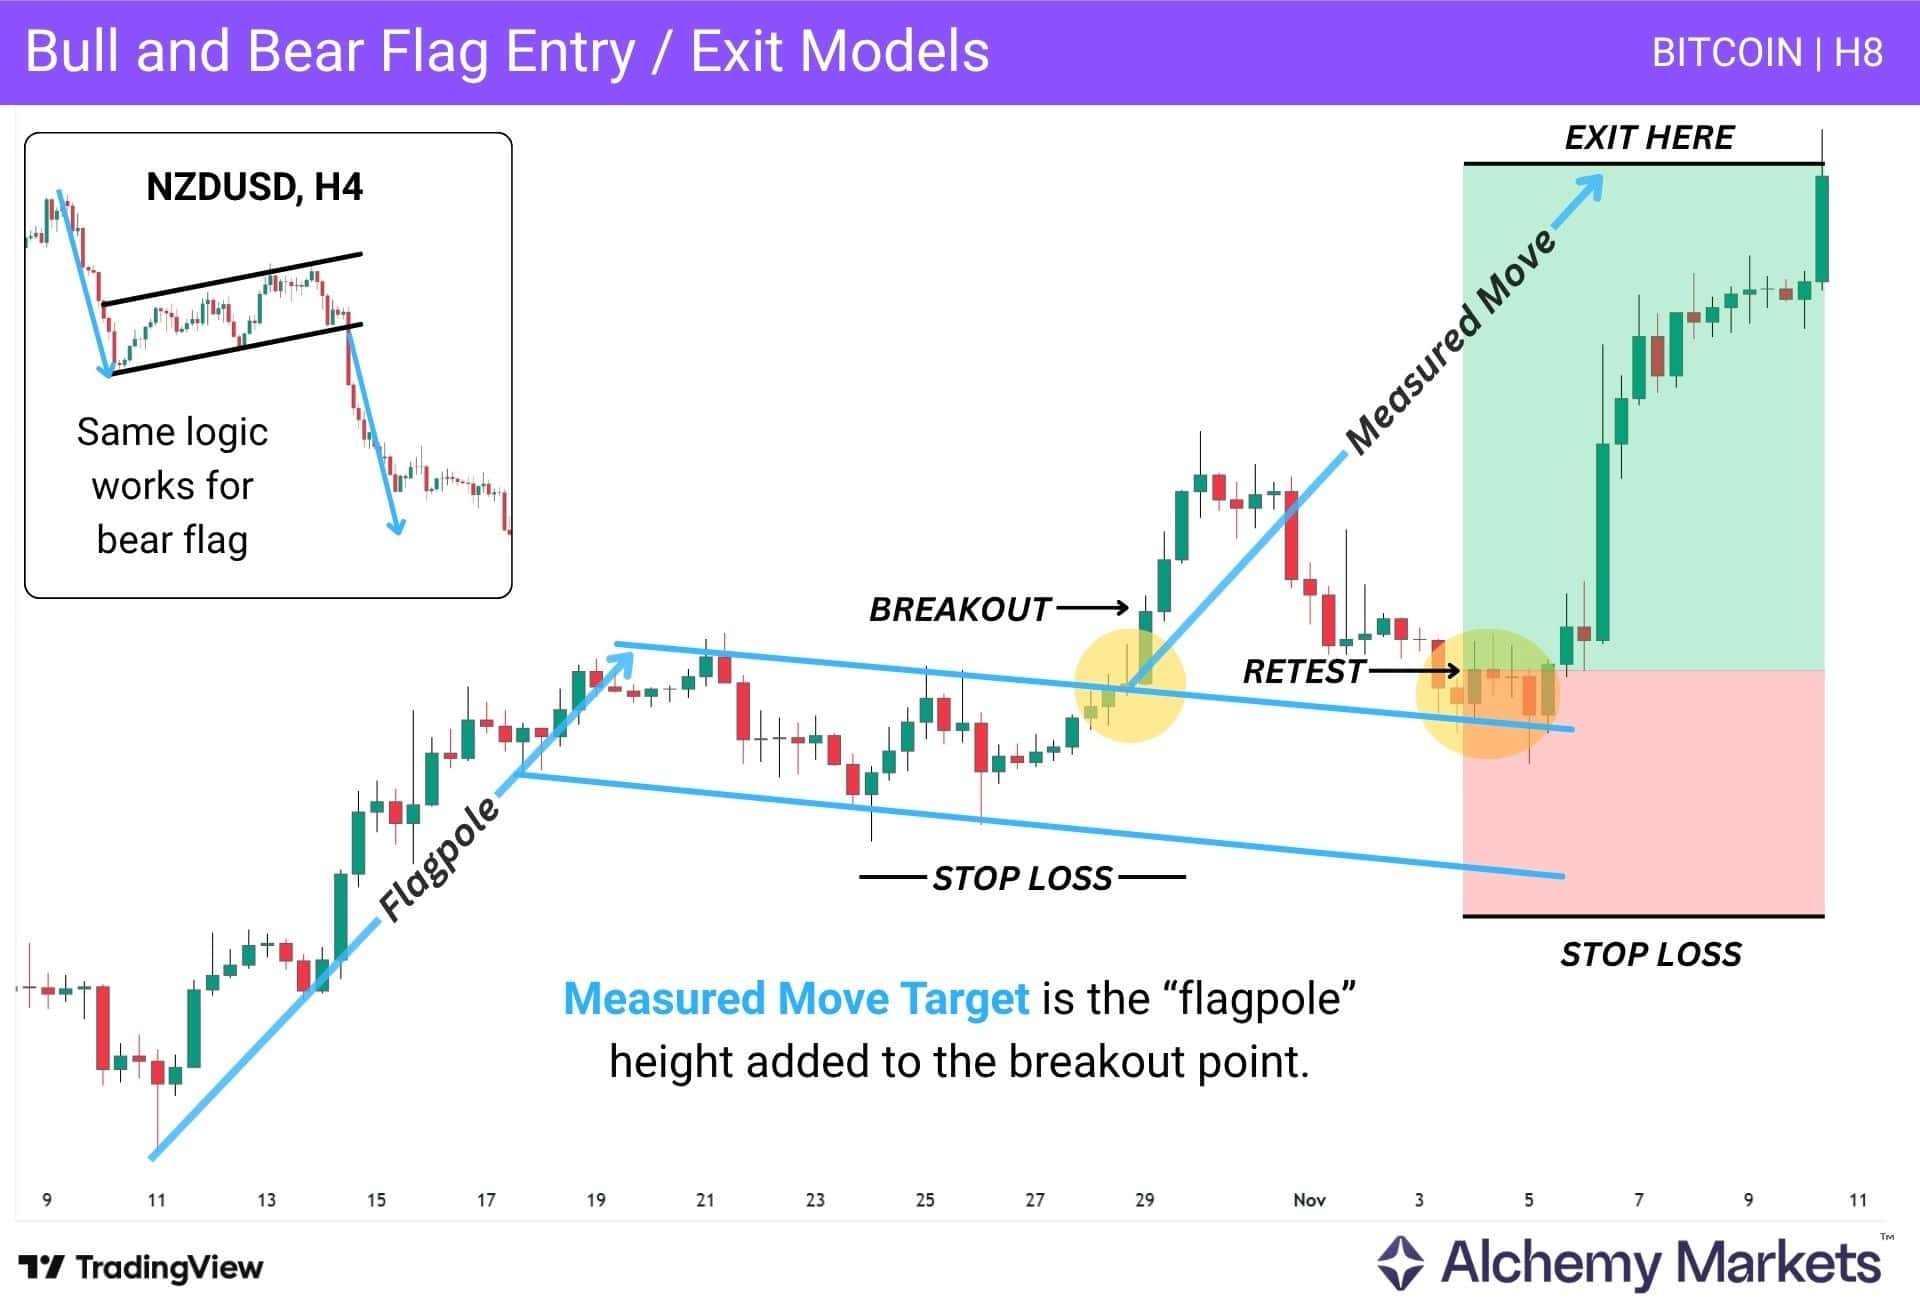
For the exit point, traders typically aim for the measured move target, which is equal to the height of the flagpole added to the exact price point of the flag breakout.
- In a bull flag, the flagpole is the bullish price swing prior to the sideways consolidation.
- In a bear flag, the flagpole is the bearish price swing prior to the sideways consolidation.
There is another exit point traders can consider, however, it is contingent on that the flag pole’s extremes (high or low) is a good distance from the entry point.
For example, in a bull flag, if a breakout occurs and the flag pole’s high is a good distance from the entry, then one could consider a partial take profit (10% – 50%) at the flag pole’s high. After that, hold the rest of the trade until the measured move target.
The purpose of doing so is simply that we recognise that previous high or low still as valid support or resistance, until they are properly broken. This helps us hedge against the possibility of a double top, or double bottom forming instead of our flag pattern idea playing out.
Flag Breakout Strategy
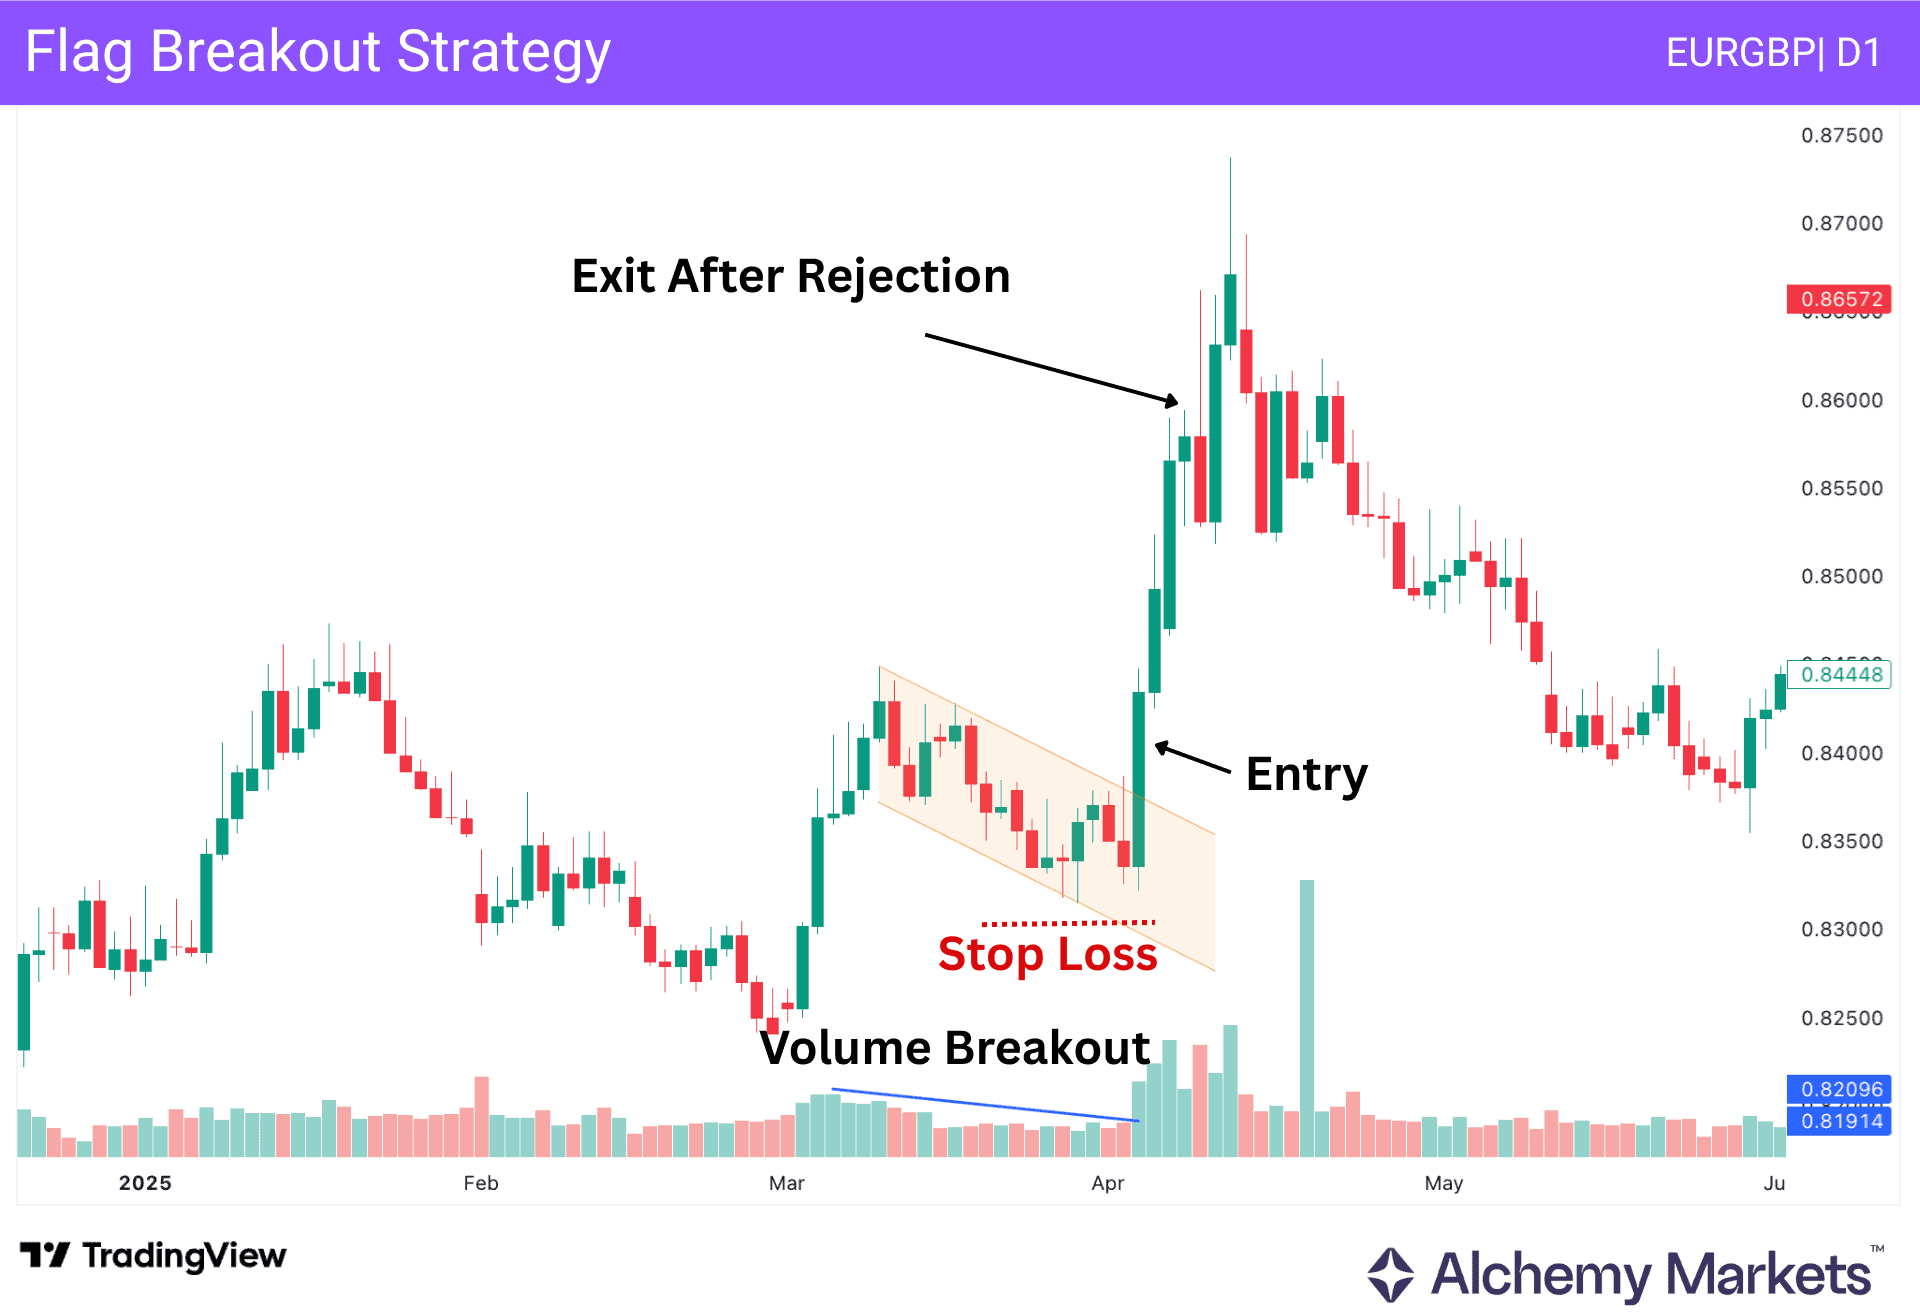
The flag breakout strategy focuses on the first clean close outside the flag channel.
For beginners, the key is not to guess inside the pattern too early. A breakout candle gives a clearer signal that price is trying to continue in the direction of the original flagpole.
Volume can add confidence, but price action should still lead the decision. If price breaks out and holds outside the flag, the setup is cleaner than a breakout that immediately falls back inside the pattern.
| Entry: Enter after price closes outside the flag channel in the direction of the flagpole. Stop Loss: Place the stop loss order beyond the opposite side of the flag, using the nearest relevant swing as a guide. Take Profit: Use the measured move target by projecting the flagpole from the breakout point. Partial profit can also be taken near the previous flagpole high or low. |
Advanced traders can hold a trade until a clear sign of exhaustion has occurred. In this example, we could exit our position after a strong bearish reversal candlestick has occurred, such as the shooting star pattern as marked on the chart.
Pullback to Flag Entry Strategy
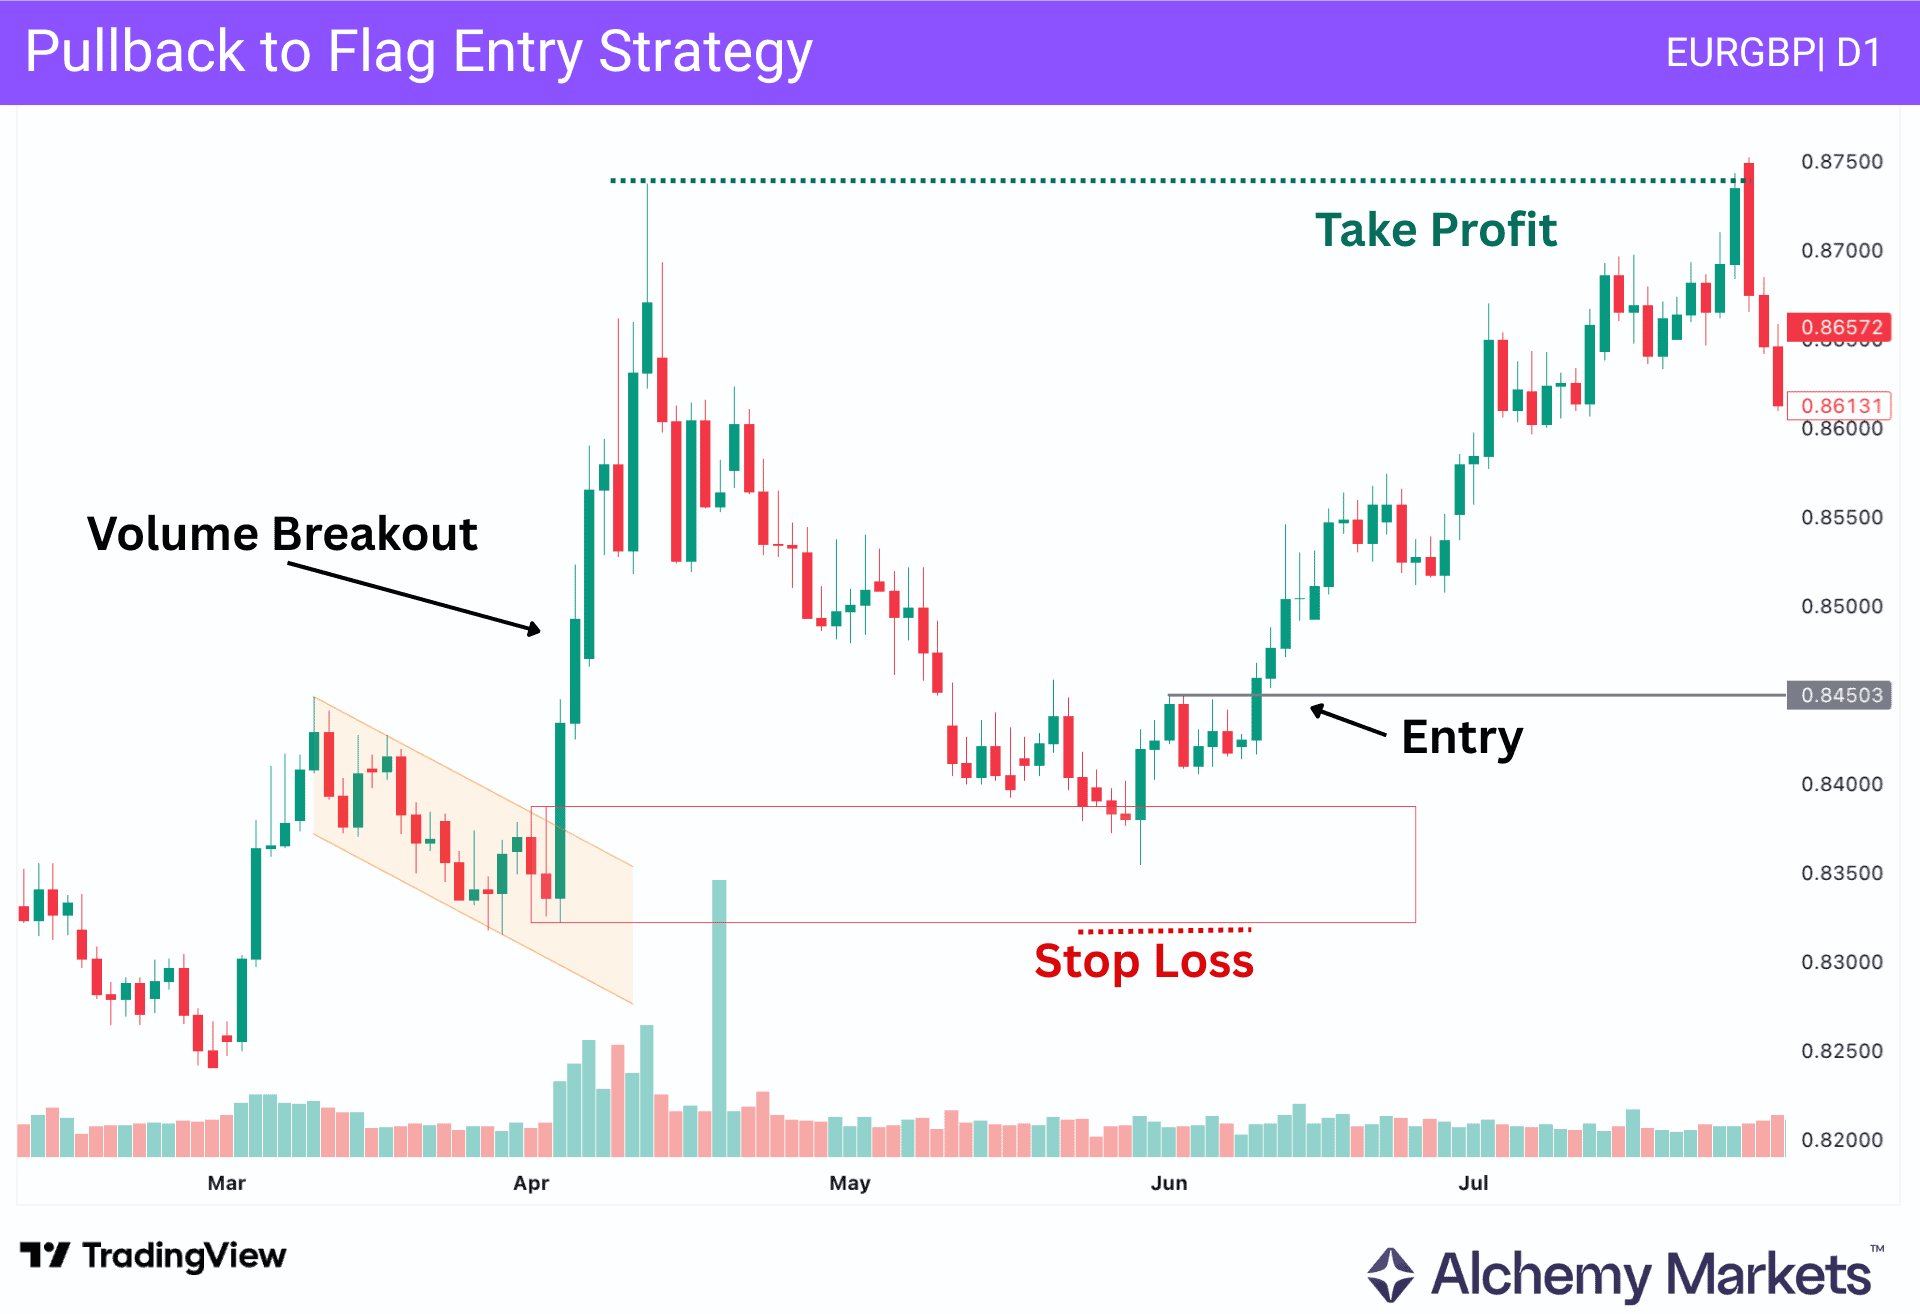
After a flag breakout, price may return to the broken flag level before continuing. This gives traders a second entry style instead of entering on the first breakout candle.
The retest matters because it shows whether price is being accepted back inside the flag or rejected from the broken level. A clean rejection suggests the breakout area is being respected.
This method is slower than a direct breakout entry, but it can help traders avoid chasing the first candle.
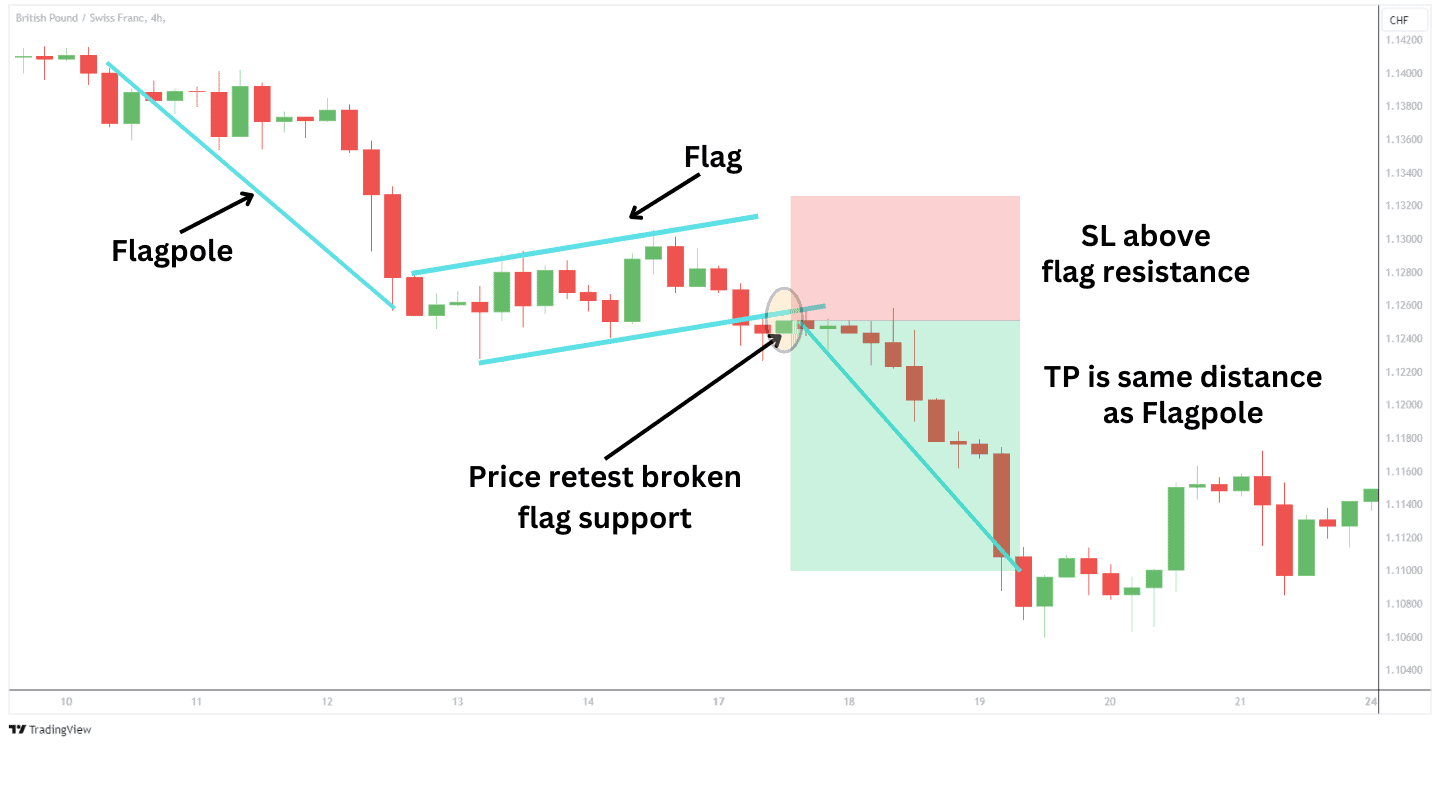
| Entry: Enter after price breaks out, returns to the broken flag level, and rejects it in the breakout direction. Stop Loss: For bull flags, place the stop loss order below the retest low or below the flag. For bear flags, place it above the retest high or above the flag. Take Profit: Aim for the measured move target. A previous high or low can be used for partial profit if it comes before the full target. |
Flag Pre-Breakout Positioning
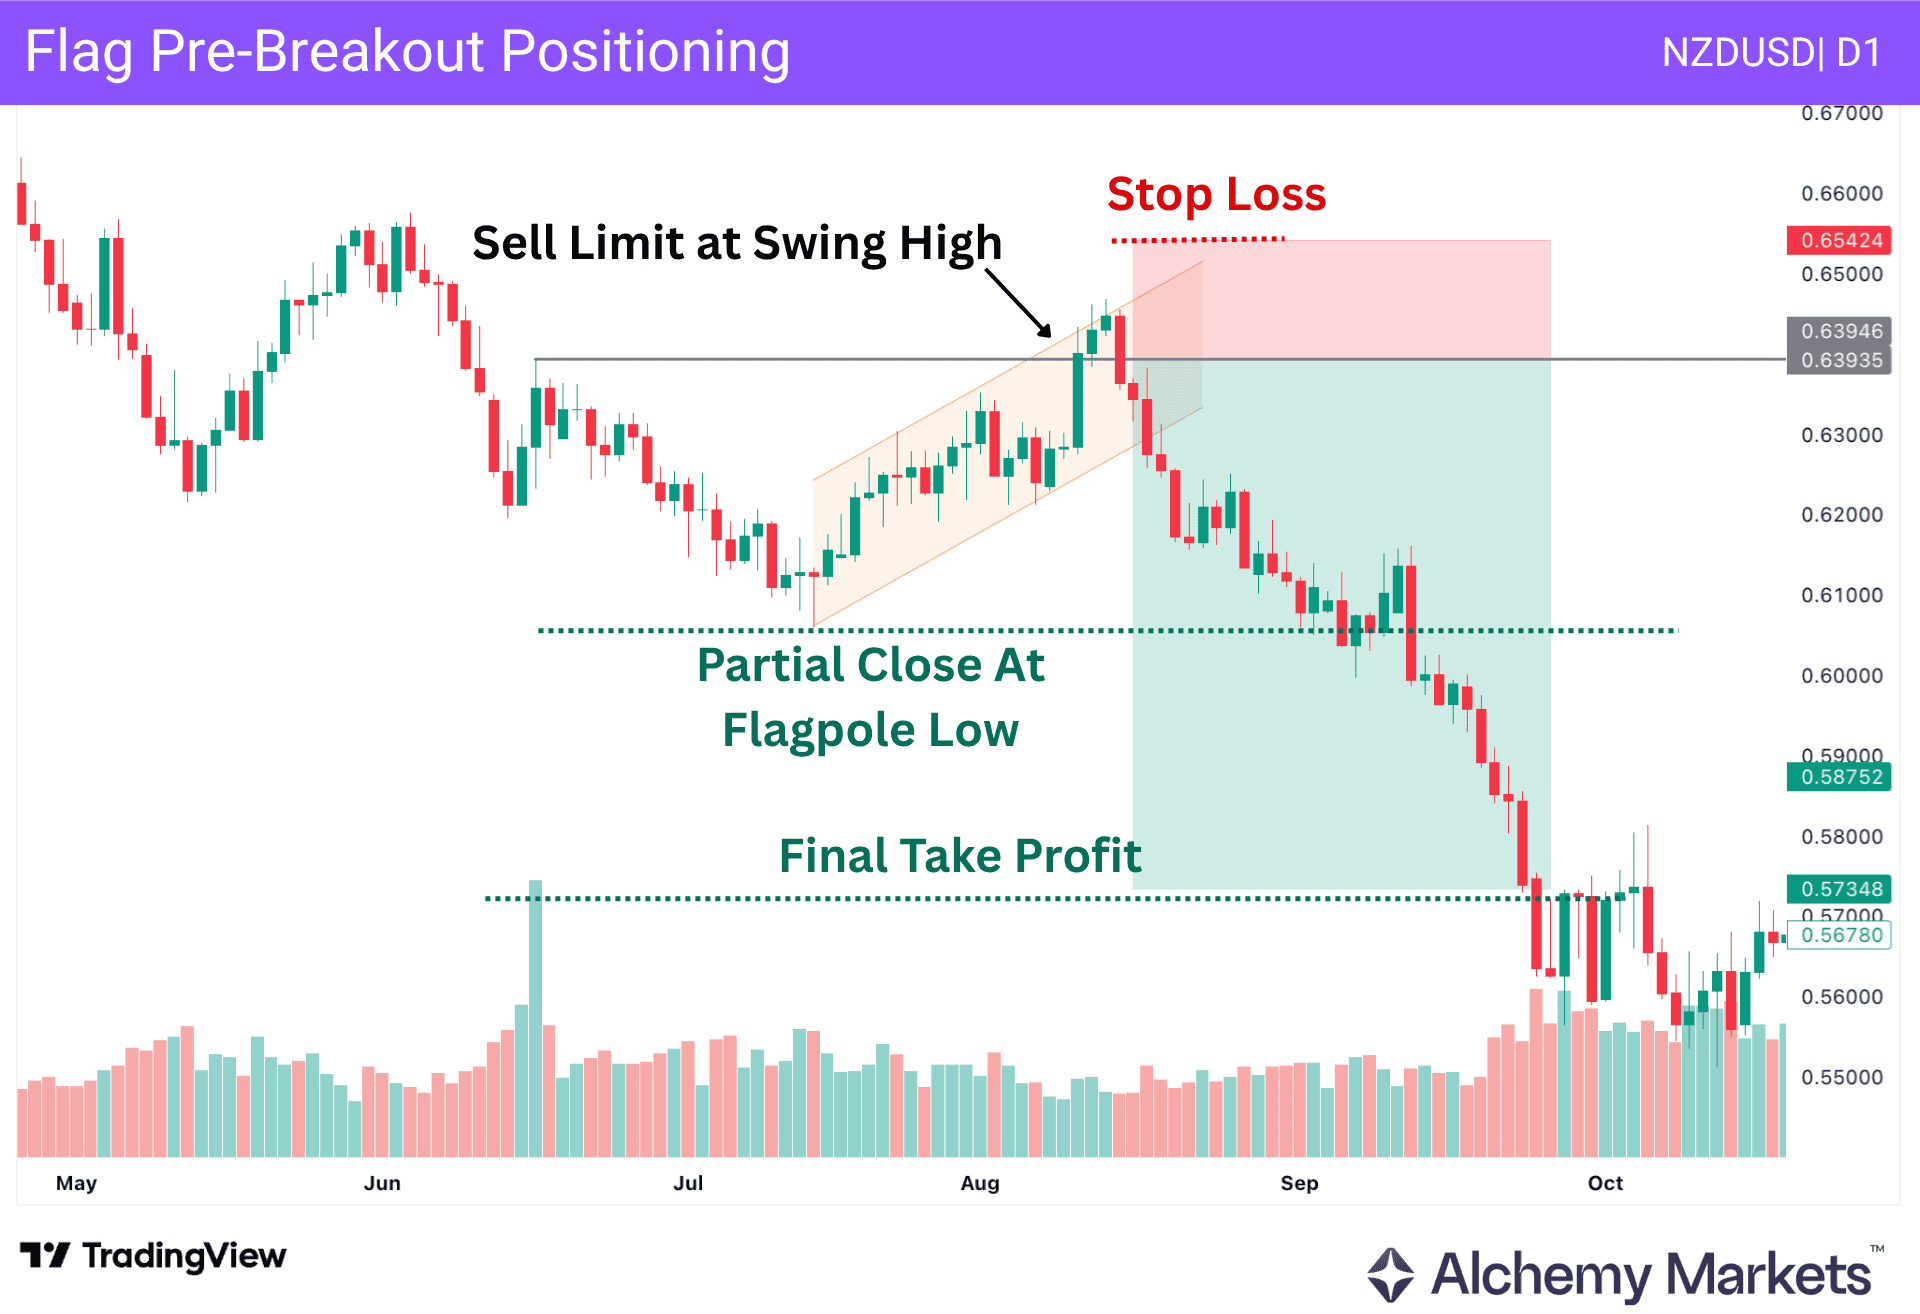
Pre-breakout positioning is the more aggressive version of flag trading.
Instead of waiting for price to break the flag, traders look for rejection near the opposite side of the flag structure. The idea is to enter before the breakout, while price is still inside the channel.
This can give a better entry price, but it also carries more risk because the breakout has not been confirmed yet. Beginners should treat this as an advanced approach, not the default way to trade flags.
| Entry: Enter before the breakout only if price rejects the opposite side of the flag and starts moving back in the direction of the flagpole. Stop Loss: Place the stop loss order beyond the flag structure, where the setup would no longer make sense. Take Profit: The first target can be the flagpole high or low. If the breakout confirms, the next target is the measured move. |
Moving Average Pullback
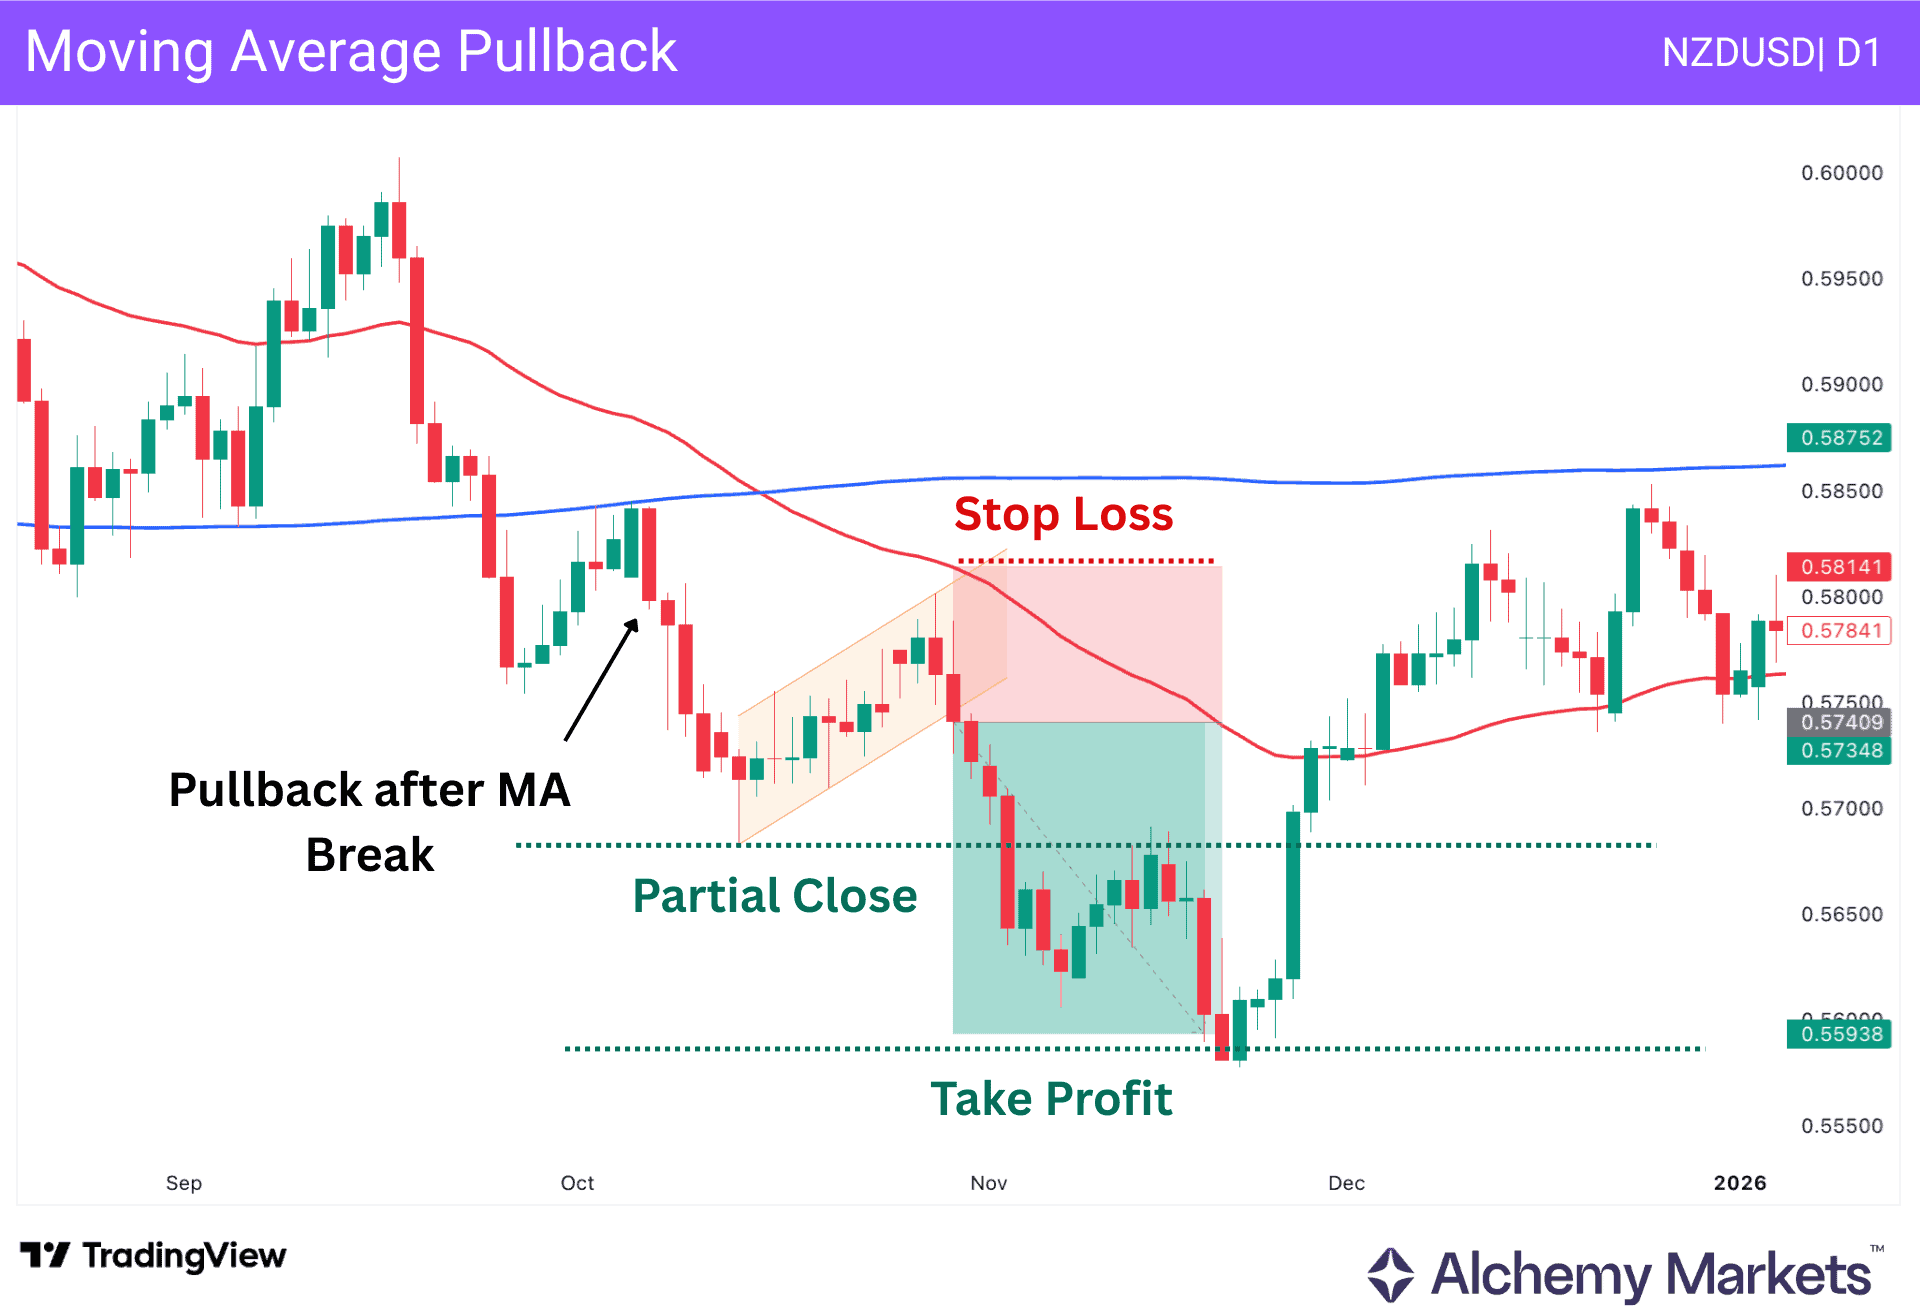
Moving averages can help traders decide whether a flag is forming with or against the broader trend.
If price is holding above a key moving average, bullish flags may deserve more attention.
If price is holding below it, bearish flags usually fit the chart better.
The moving average is not the trade signal by itself, but it helps filter which flag setups are worth paying attention to.
A 50-length moving average is often a balanced choice. Shorter lengths like 9 or 20 react faster to recent price changes, while 100 and 200 are more commonly used to judge the broader trend.
| Entry: Trade the flag only when the breakout aligns with the moving average bias. Stop Loss: Place the stop loss order beyond the opposite side of the flag, or beyond the nearest moving average if it gives the setup enough room. Take Profit: Use the measured move target. Nearby higher timeframe support or resistance can also be used to manage the position. |
Flag with Fibonacci Levels
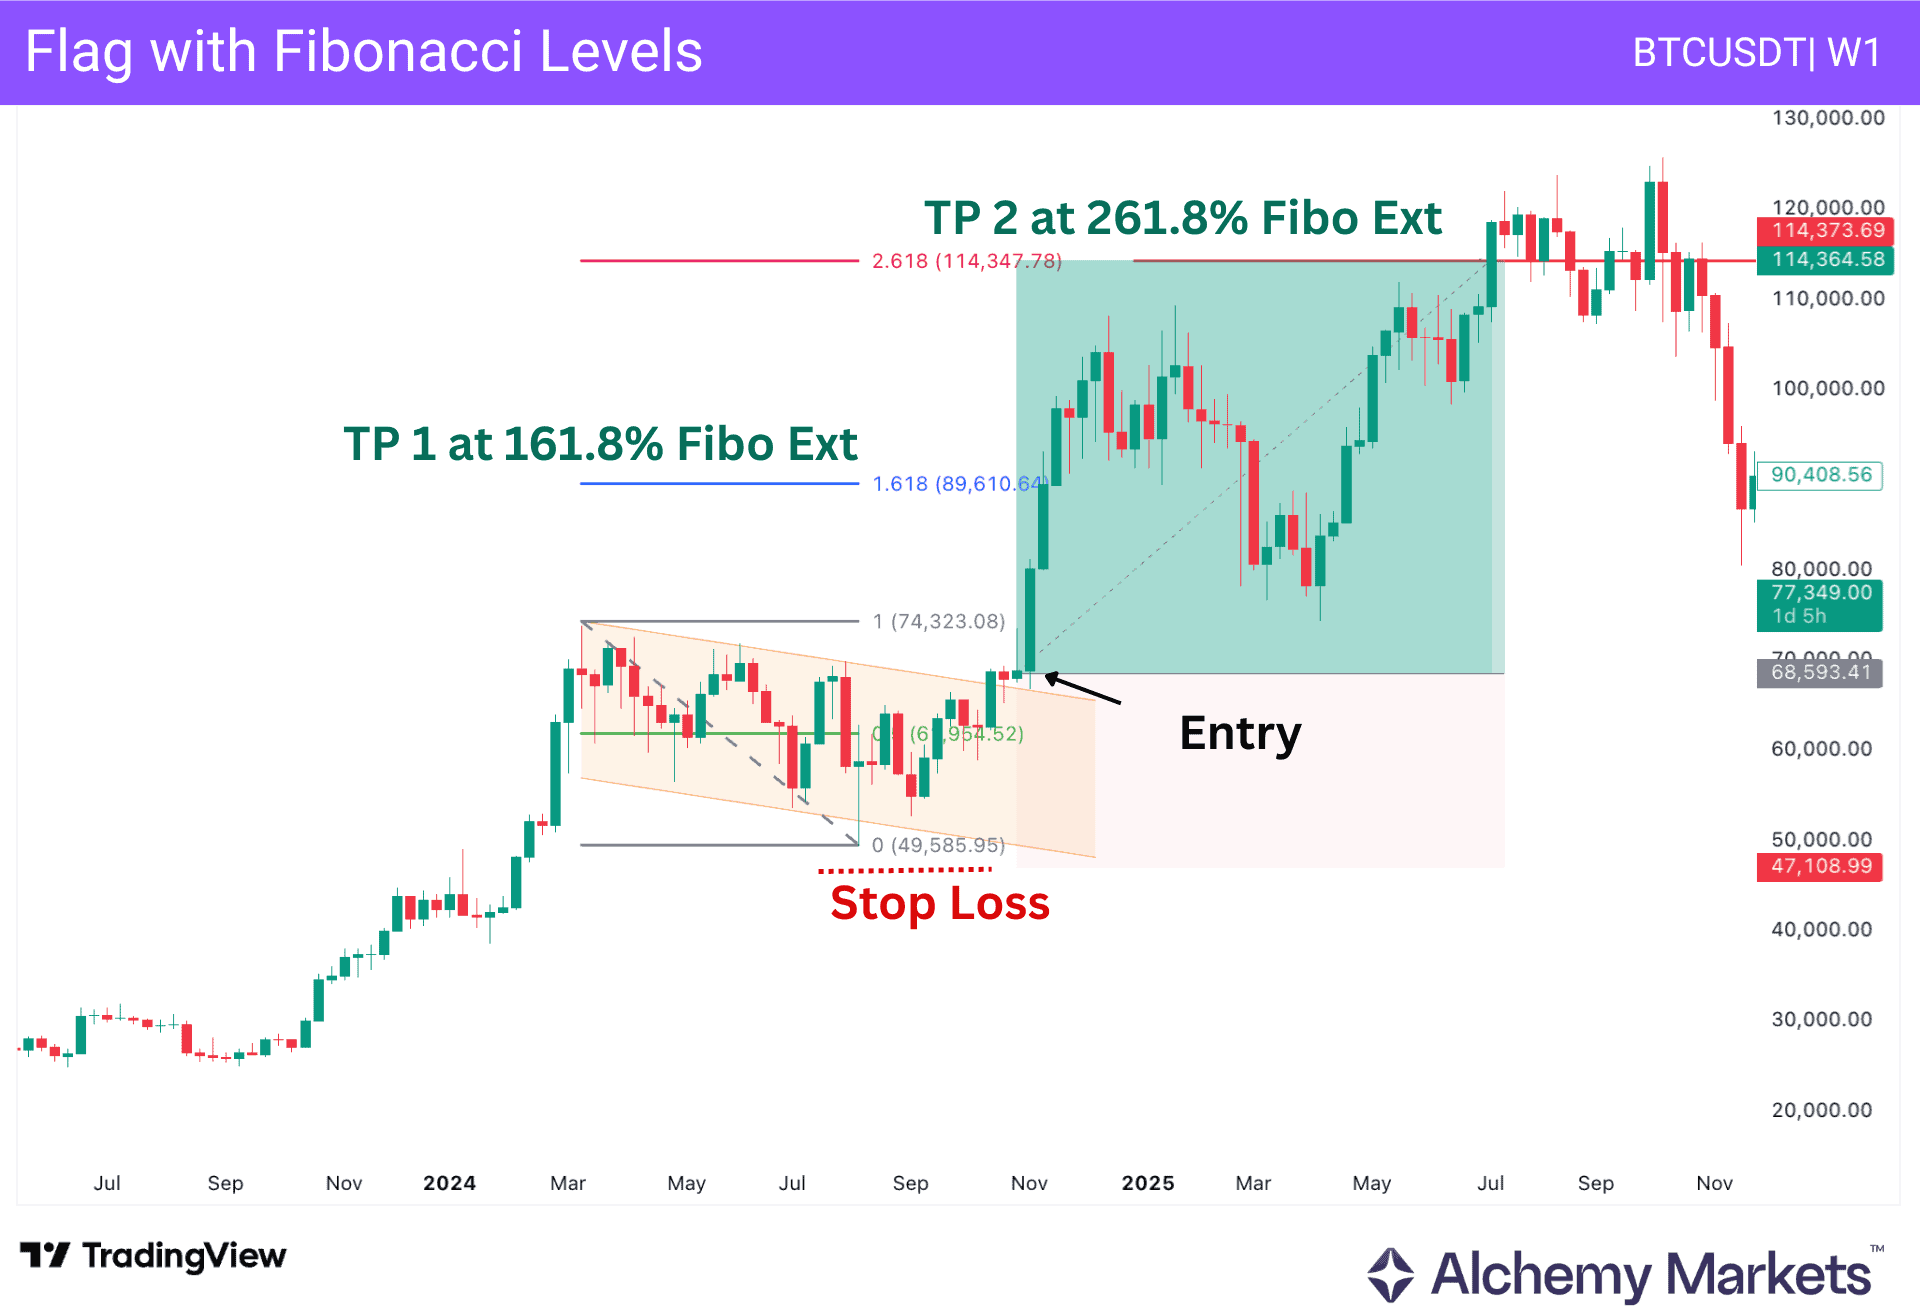
Fibonacci extensions can help traders compare the measured move target with common extension levels.
The measured move remains the main flag target. Fibonacci is mostly useful when the projected target sits near levels such as 161.8% or 261.8%.
If the measured move and Fibonacci extension point to a similar area, traders have a clearer zone to manage the exit.
| Entry: Trade the flag breakout as usual, then check whether the measured move target aligns with a Fibonacci extension. Stop Loss: Place the stop loss order beyond the side of the flag that would invalidate the setup. Take Profit: Use the measured move target first. Fibonacci extensions can help refine the exit area if they sit close to the projection. |
Flag with RSI
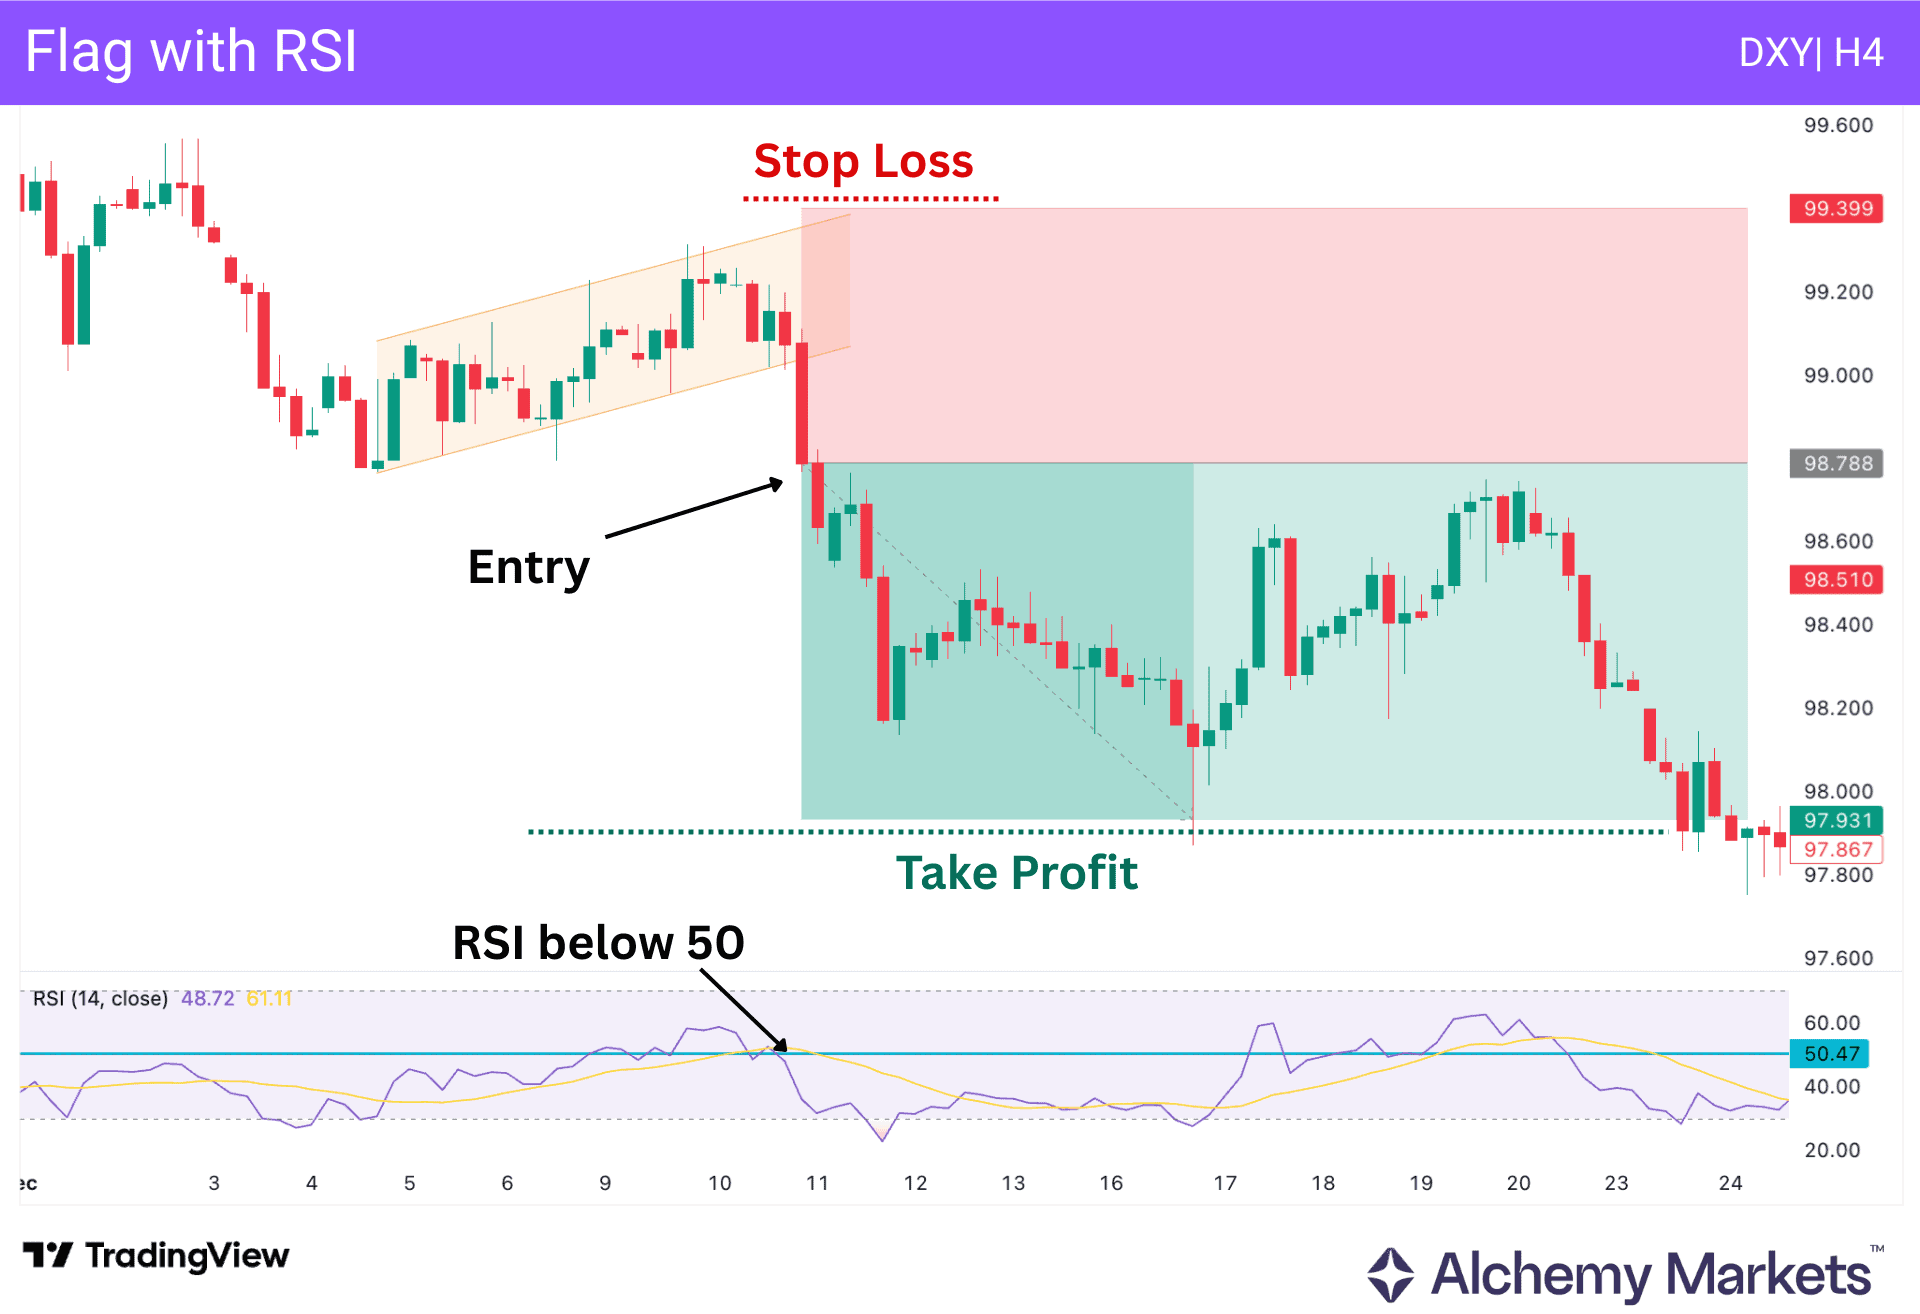
RSI helps traders track whether momentum is actually supporting the flag breakout.
The 50 line is the main reference point here. If RSI holds above 50, momentum is generally stronger on the bullish side. If RSI holds below 50, momentum is generally stronger on the bearish side.
The caveat is when RSI moves into extreme zones (outside of the RSI bands), bearish or bullish momentum could be heading into exhaustion. Readings above 70 suggest overbought conditions, while readings below 30 suggest oversold conditions.
This does not automatically mean price will reverse, but it does warn traders that the move may be stretched.
As long as RSI stays between 30 and 70, its position around the 50 line can help traders judge whether buyers or sellers have better momentum control.
RSI in this context can help you avoid flag breakouts that do not have strong momentum behind it, and therefore are more likely to fail.
| Entry: Enter when price breaks the flag and RSI supports the breakout direction from the correct side of the 50 line. Stop Loss: Place the stop loss order beyond the opposite side of the flag or the latest relevant swing.T ake Profit: Use the measured move target. A nearby higher timeframe level can be used for partial profit if price reaches it first. |
Flag with MACD
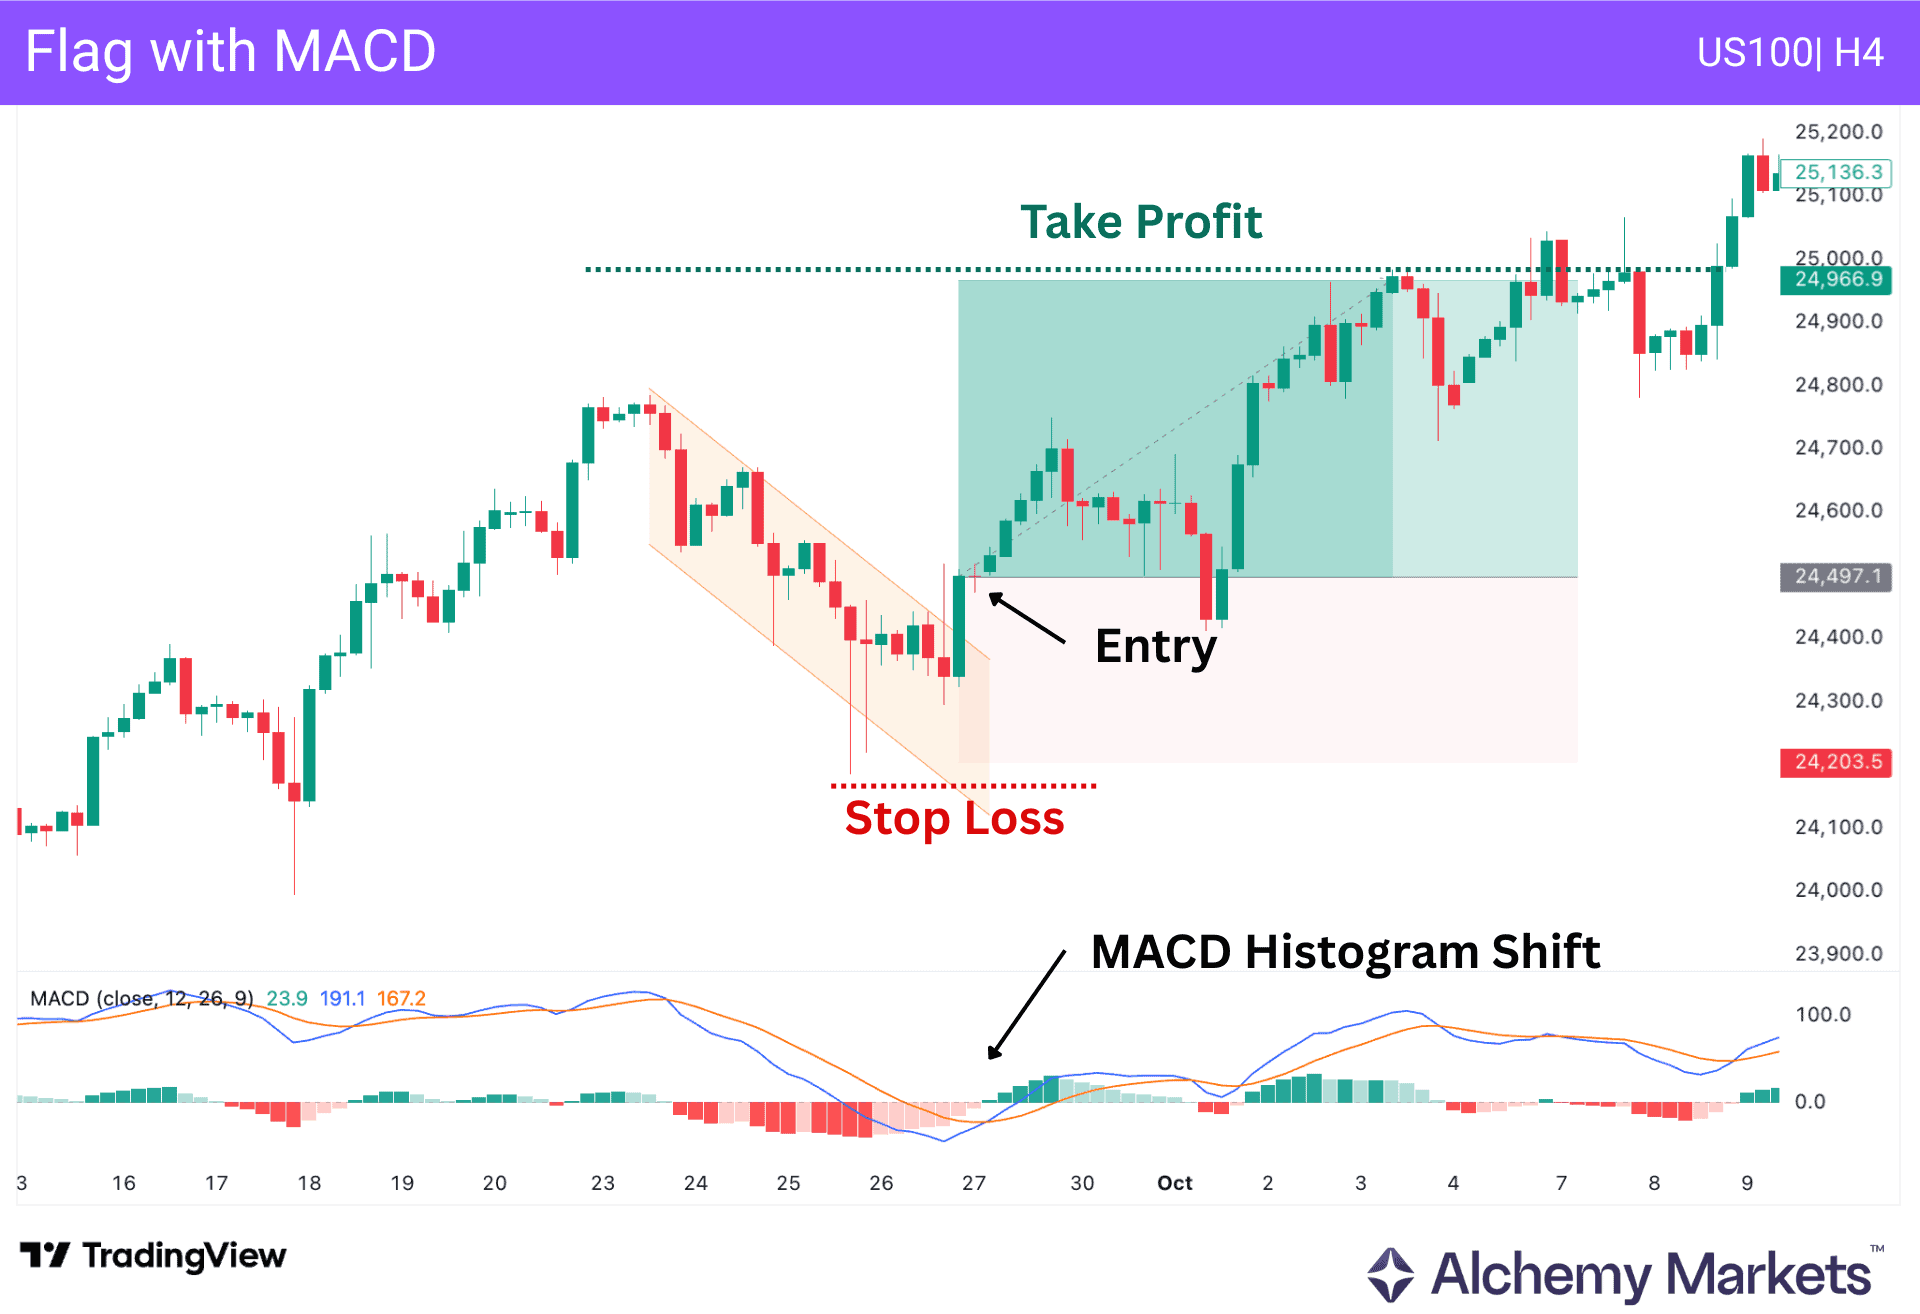
MACD can be used as a momentum filter when trading bull and bear flags.
The main thing to watch is whether the histogram supports the breakout direction. If price breaks the flag but MACD remains weak or flat, the breakout may be less convincing.
For beginners, MACD should be treated as a secondary check. The flag structure and breakout still matter more.
| Entry: Enter when price breaks the flag and MACD momentum moves with the breakout, instead of staying flat against it. Stop Loss: Place the stop loss order beyond the opposite side of the flag or the latest relevant swing. Take Profit: Use the measured move target. The flagpole high or low can be used as a partial exit if price reacts there first. |
Flag with Bollinger Bands
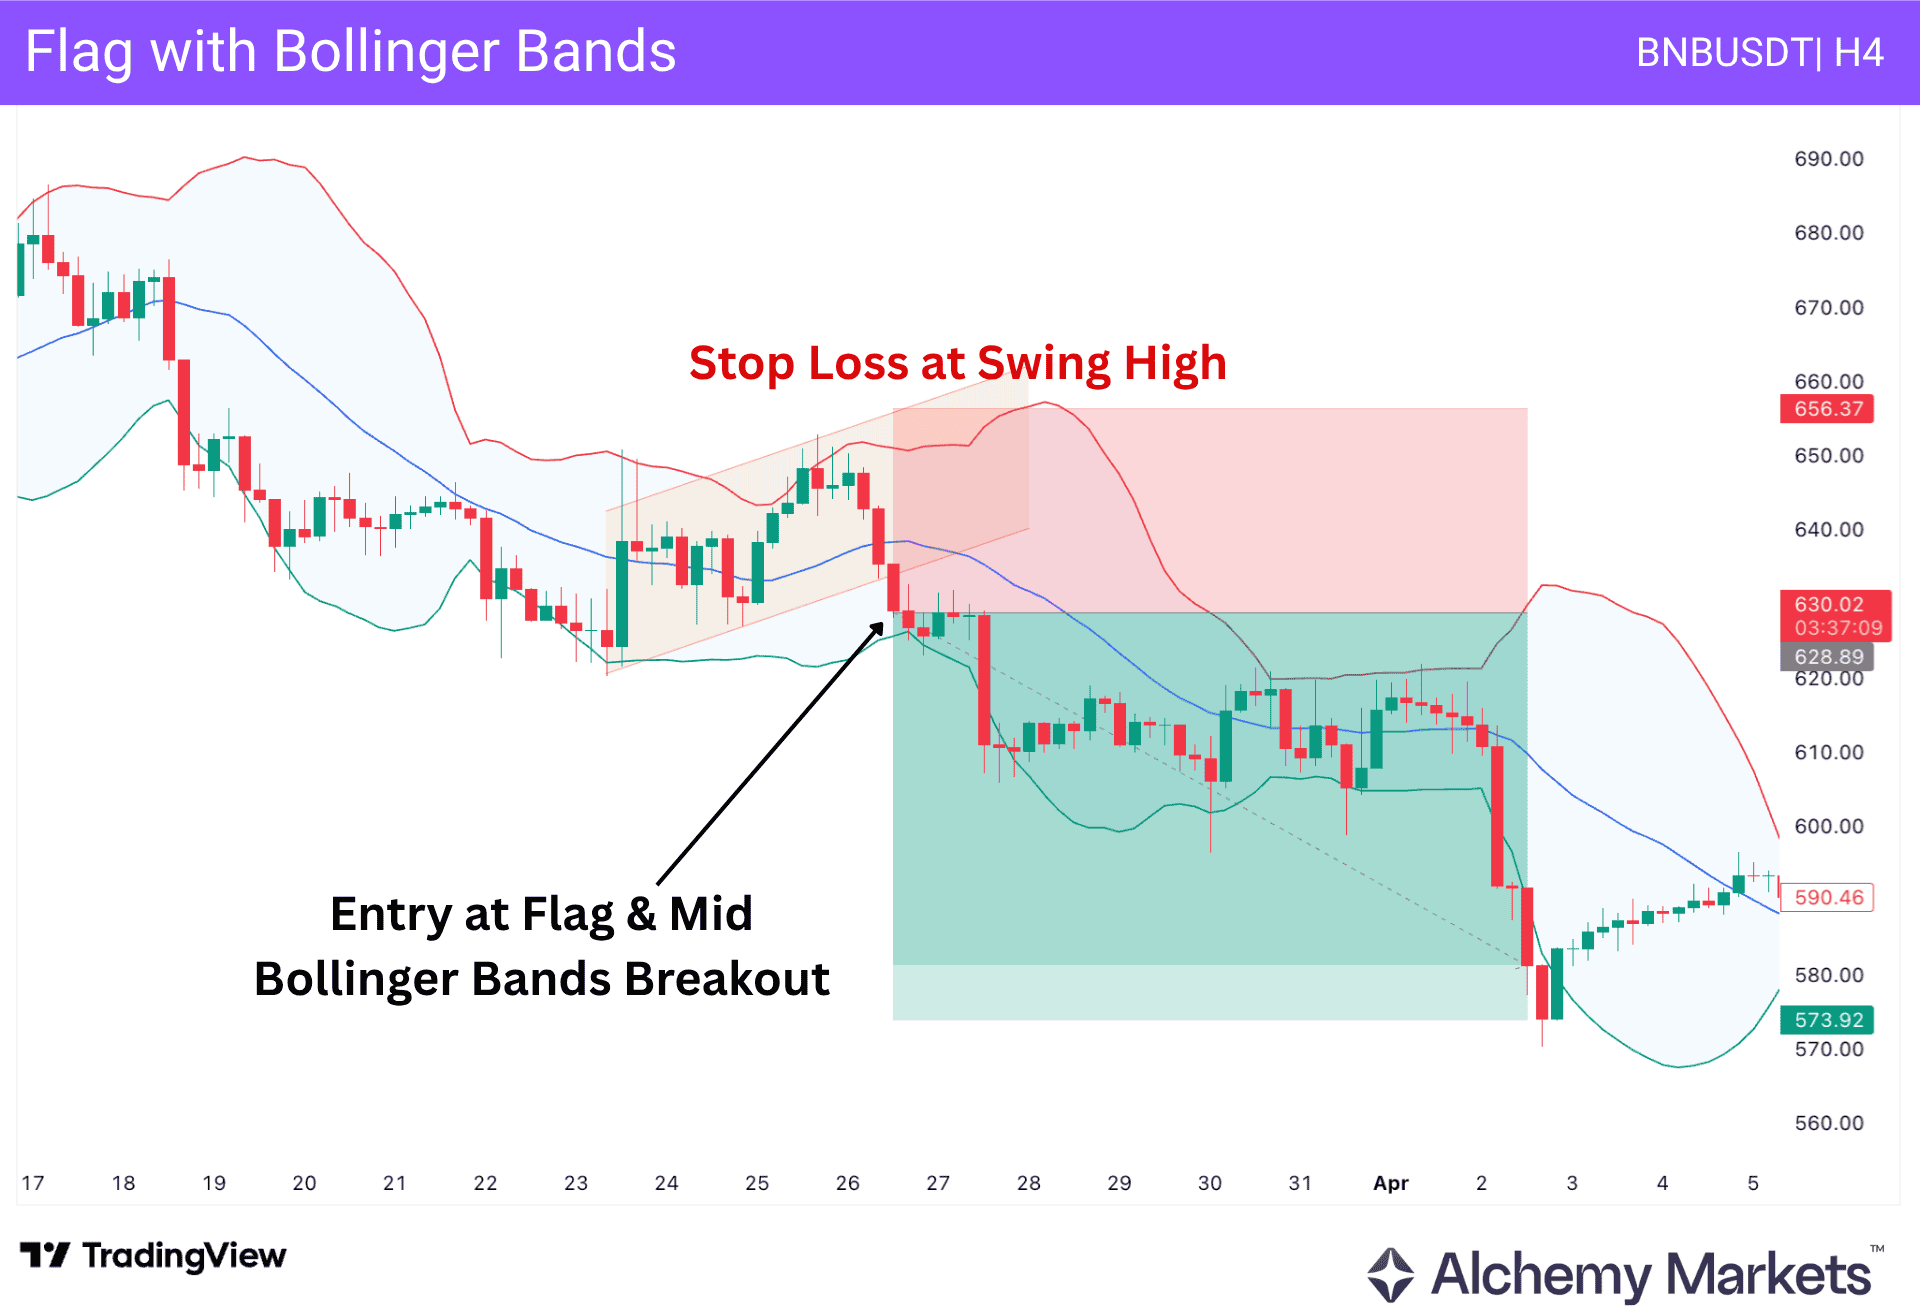
Bollinger Bands can help traders judge whether the breakout has enough momentum behind it.
The middle band is usually the cleaner reference point. If price breaks the flag and also moves through the middle band in the same direction, it suggests momentum is shifting with the breakout.
The outer bands can show when price is stretched, but they should not be treated as automatic entry or exit points.
In the flag with Bollinger Bands strategy, the trading signal needs to come from both the flag pattern and the Bollinger Bands.
The above example is for BNBUSDT on the four-hour chart, where a bearish candlestick formed below the middle Bollinger Band line and the flag support level.
| Entry: Enter when price breaks the flag and the Bollinger Band structure supports the breakout direction. Stop Loss: Place the stop loss order beyond the opposite side of the flag or the latest relevant swing. Take Profit: Use the measured move target. Higher timeframe support or resistance can be used to manage the trade if price reaches that area first. |
Multi Timeframe
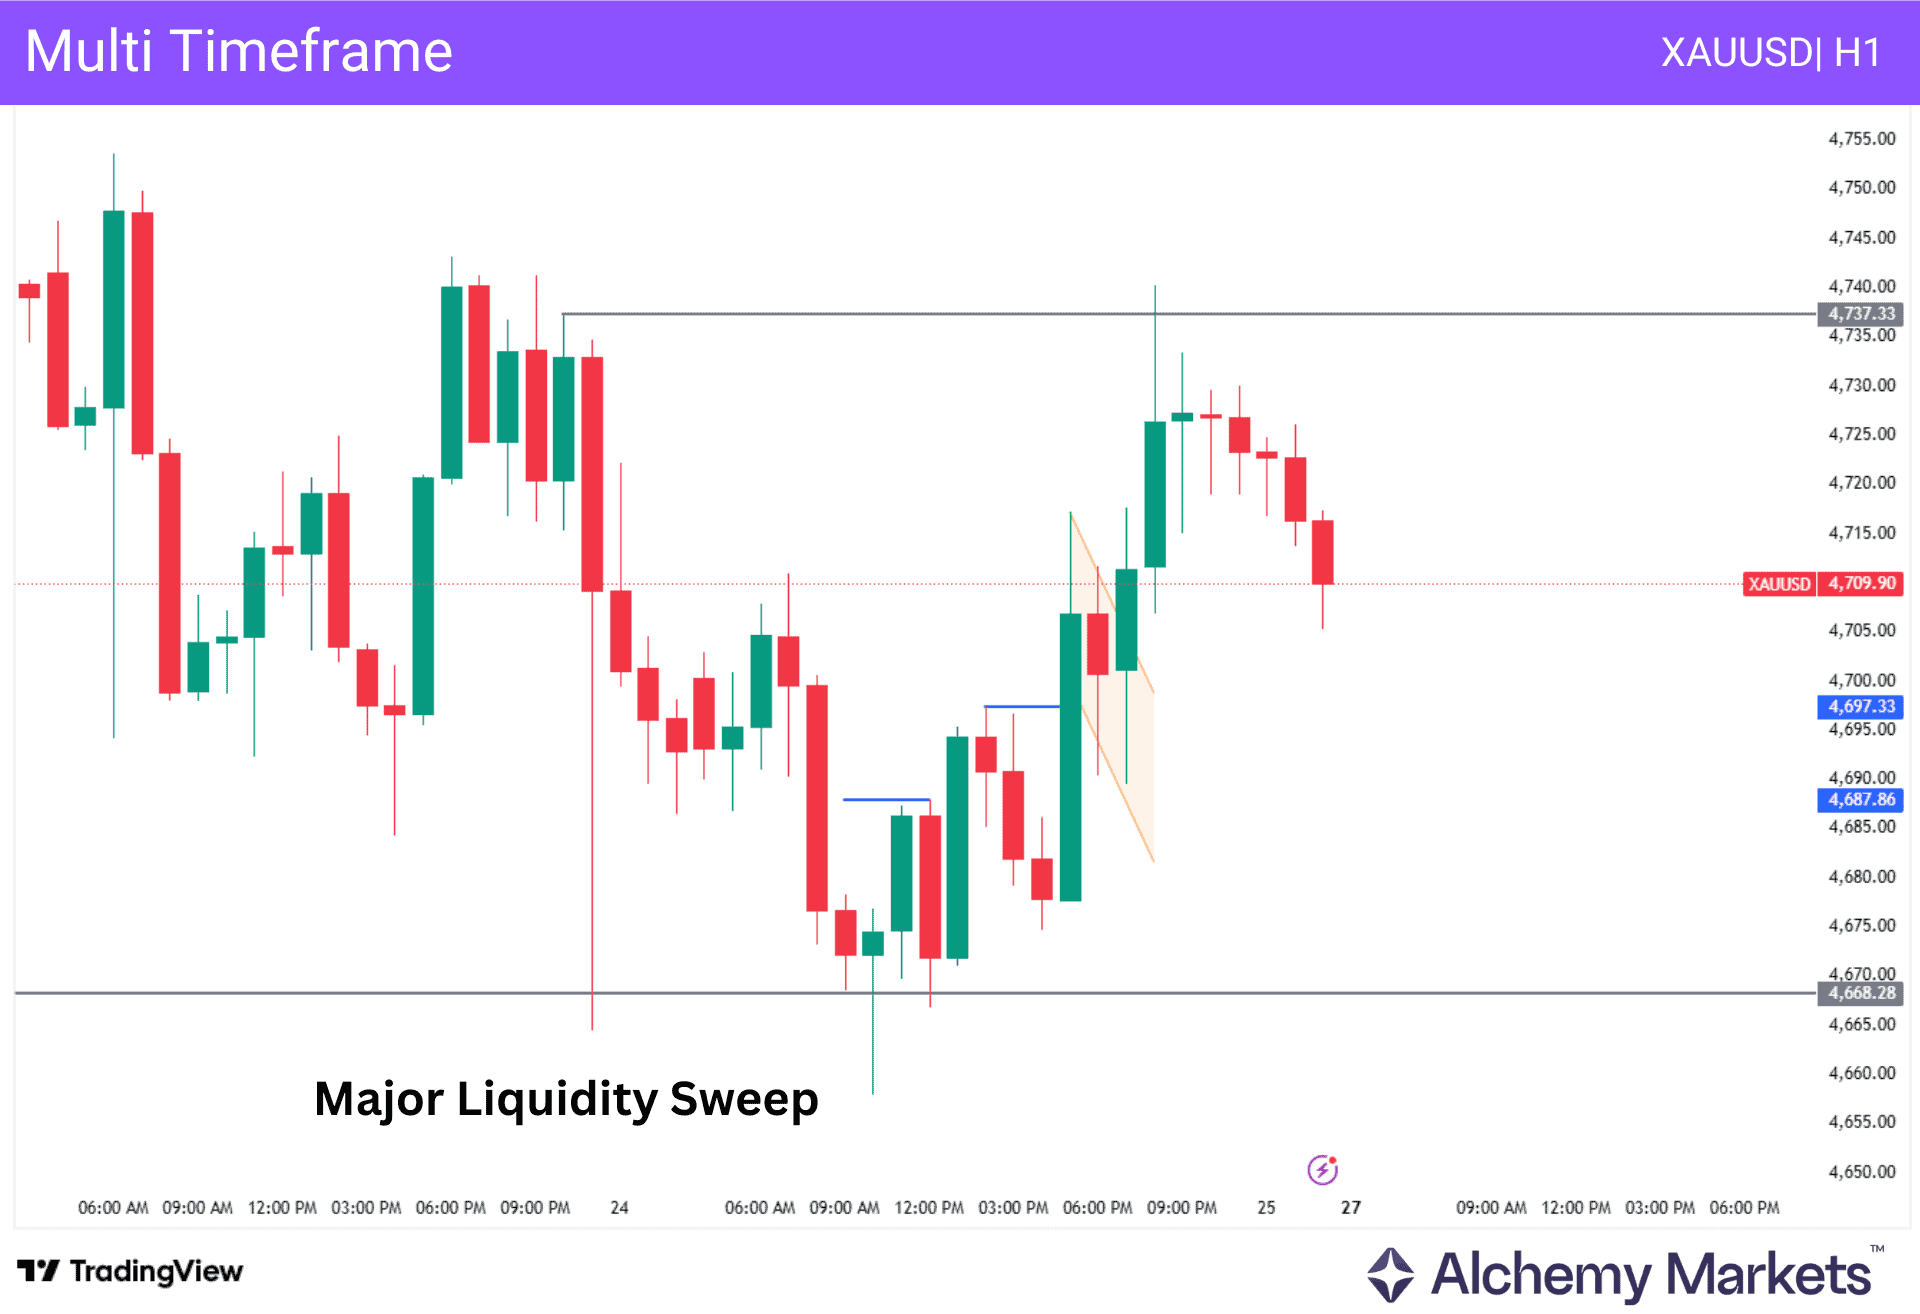
The basic idea of a multi-timeframe strategy is to understand the market direction in the higher timeframe and follow the direction in the lower timeframe using the flag strategy.
In the image above, we see the XAUUSD hourly chart, where the price rebounded after a strong liquidity sweep at the bottom. The liquidity sweep is an event in which the candlestick moves to a certain level but is unable to hold the ongoing pressure.
In this case, multiple rejection candles are seen, followed by an immediate bullish break. It is a sign of strong bullish strength after two consecutive higher-high formations.
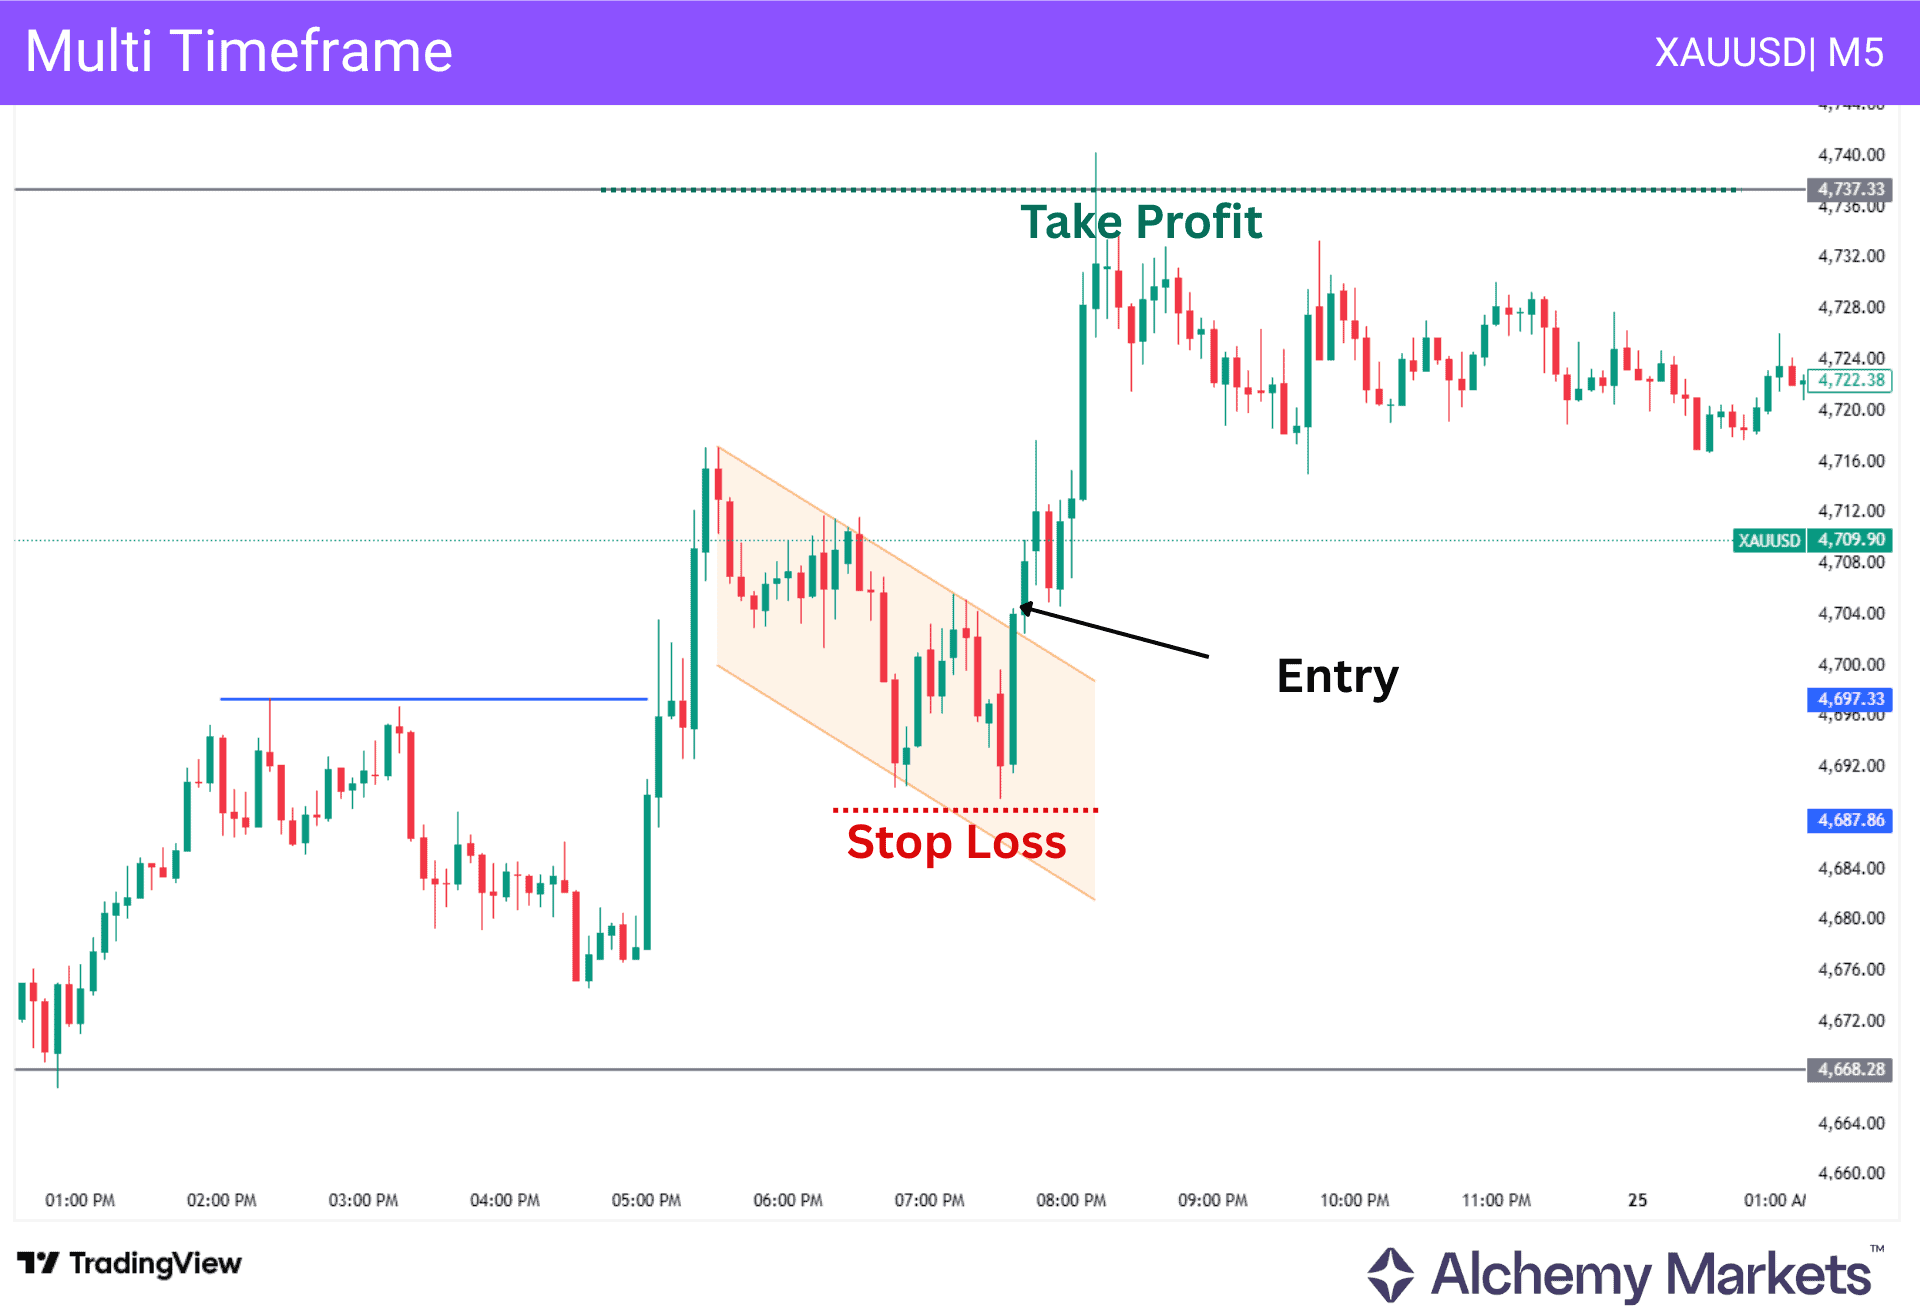
Based on this context, our aim is to look for long trades only. The image above shows the five-minute chart on the same instrument. A bullish flag pattern has formed, with a valid candle close above the channel resistance, and the major market momentum is bullish on the hourly chart.
| Entry: Use the higher timeframe to decide the trading bias, then use the lower timeframe flag for the actual entry. Timeframe Use: The higher timeframe gives context. The lower timeframe gives a more precise entry area. This helps avoid taking every flag that appears without checking the broader market direction. Stop Loss: Place the stop loss order beyond the lower-timeframe flag structure. Take Profit: Use the measured move target from the lower-timeframe flag, but check the higher timeframe for nearby support or resistance. |
Exponential Moving Averages
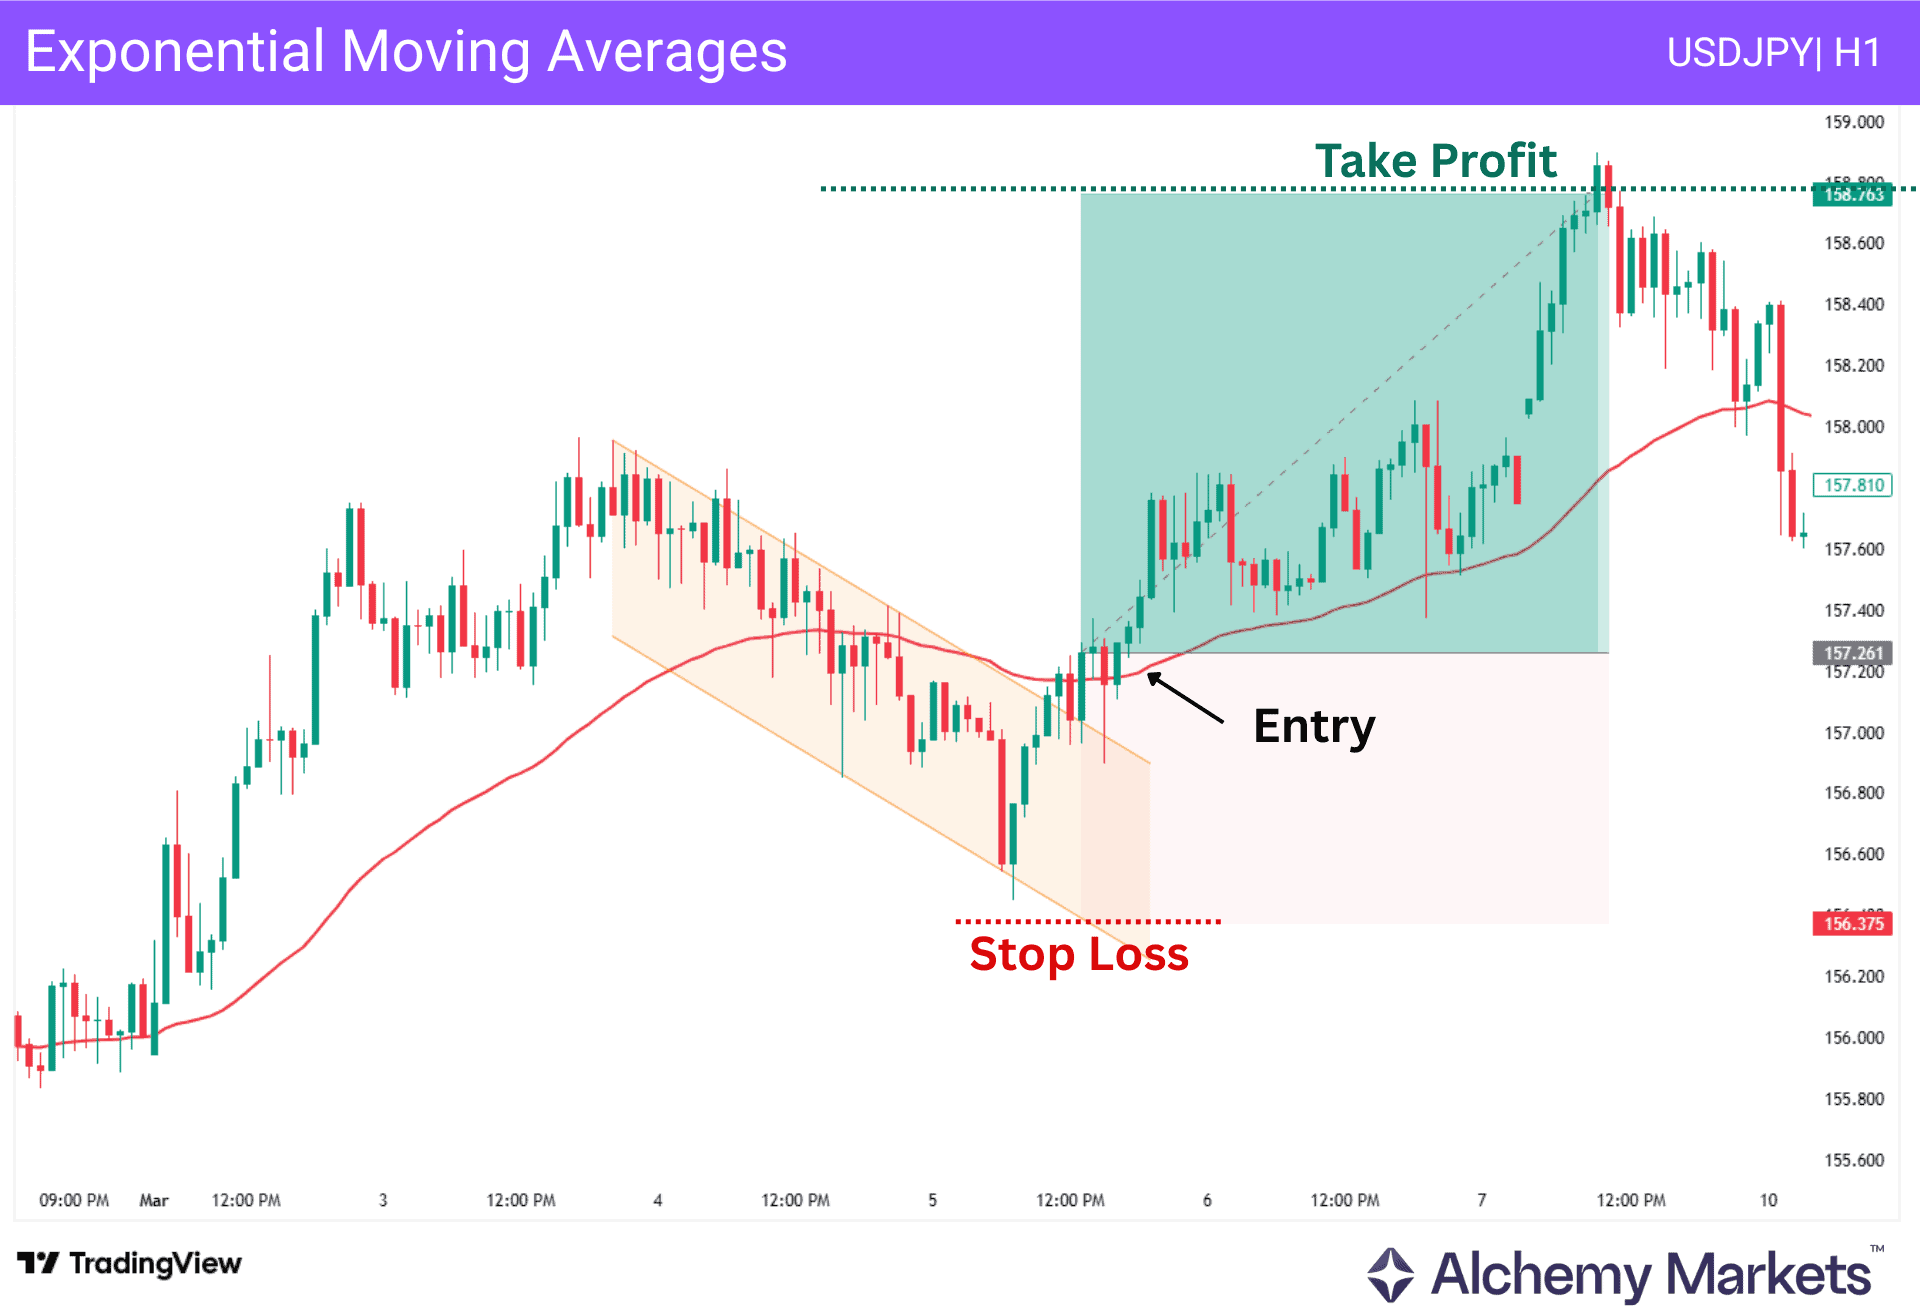
The Exponential Moving Average, or EMA, is another moving average traders can use as a trend filter for bull and bear flags.
Similar to the SMA, it tracks the average price of an asset over a selected period. The difference is that the EMA gives more weight to recent price action, making it more responsive when traders are looking for sudden breakouts or shifts in trend bias.
In the example above, the EMA shows a bullish bias close to the bull flag breakout point. When price trades above the EMA, market conditions are bullish relative to that EMA period. When price trades below it, conditions are bearish relative to that same period.
| Entry: Enter when the flag breakout aligns with the EMA bias. Stop Loss: Place the stop loss order beyond the flag structure or latest relevant swing. Take Profit: Use the measured move target. If price becomes stretched far from the EMA before reaching the full measured move, traders can consider taking partial profit or tightening risk. |
Break and Retest
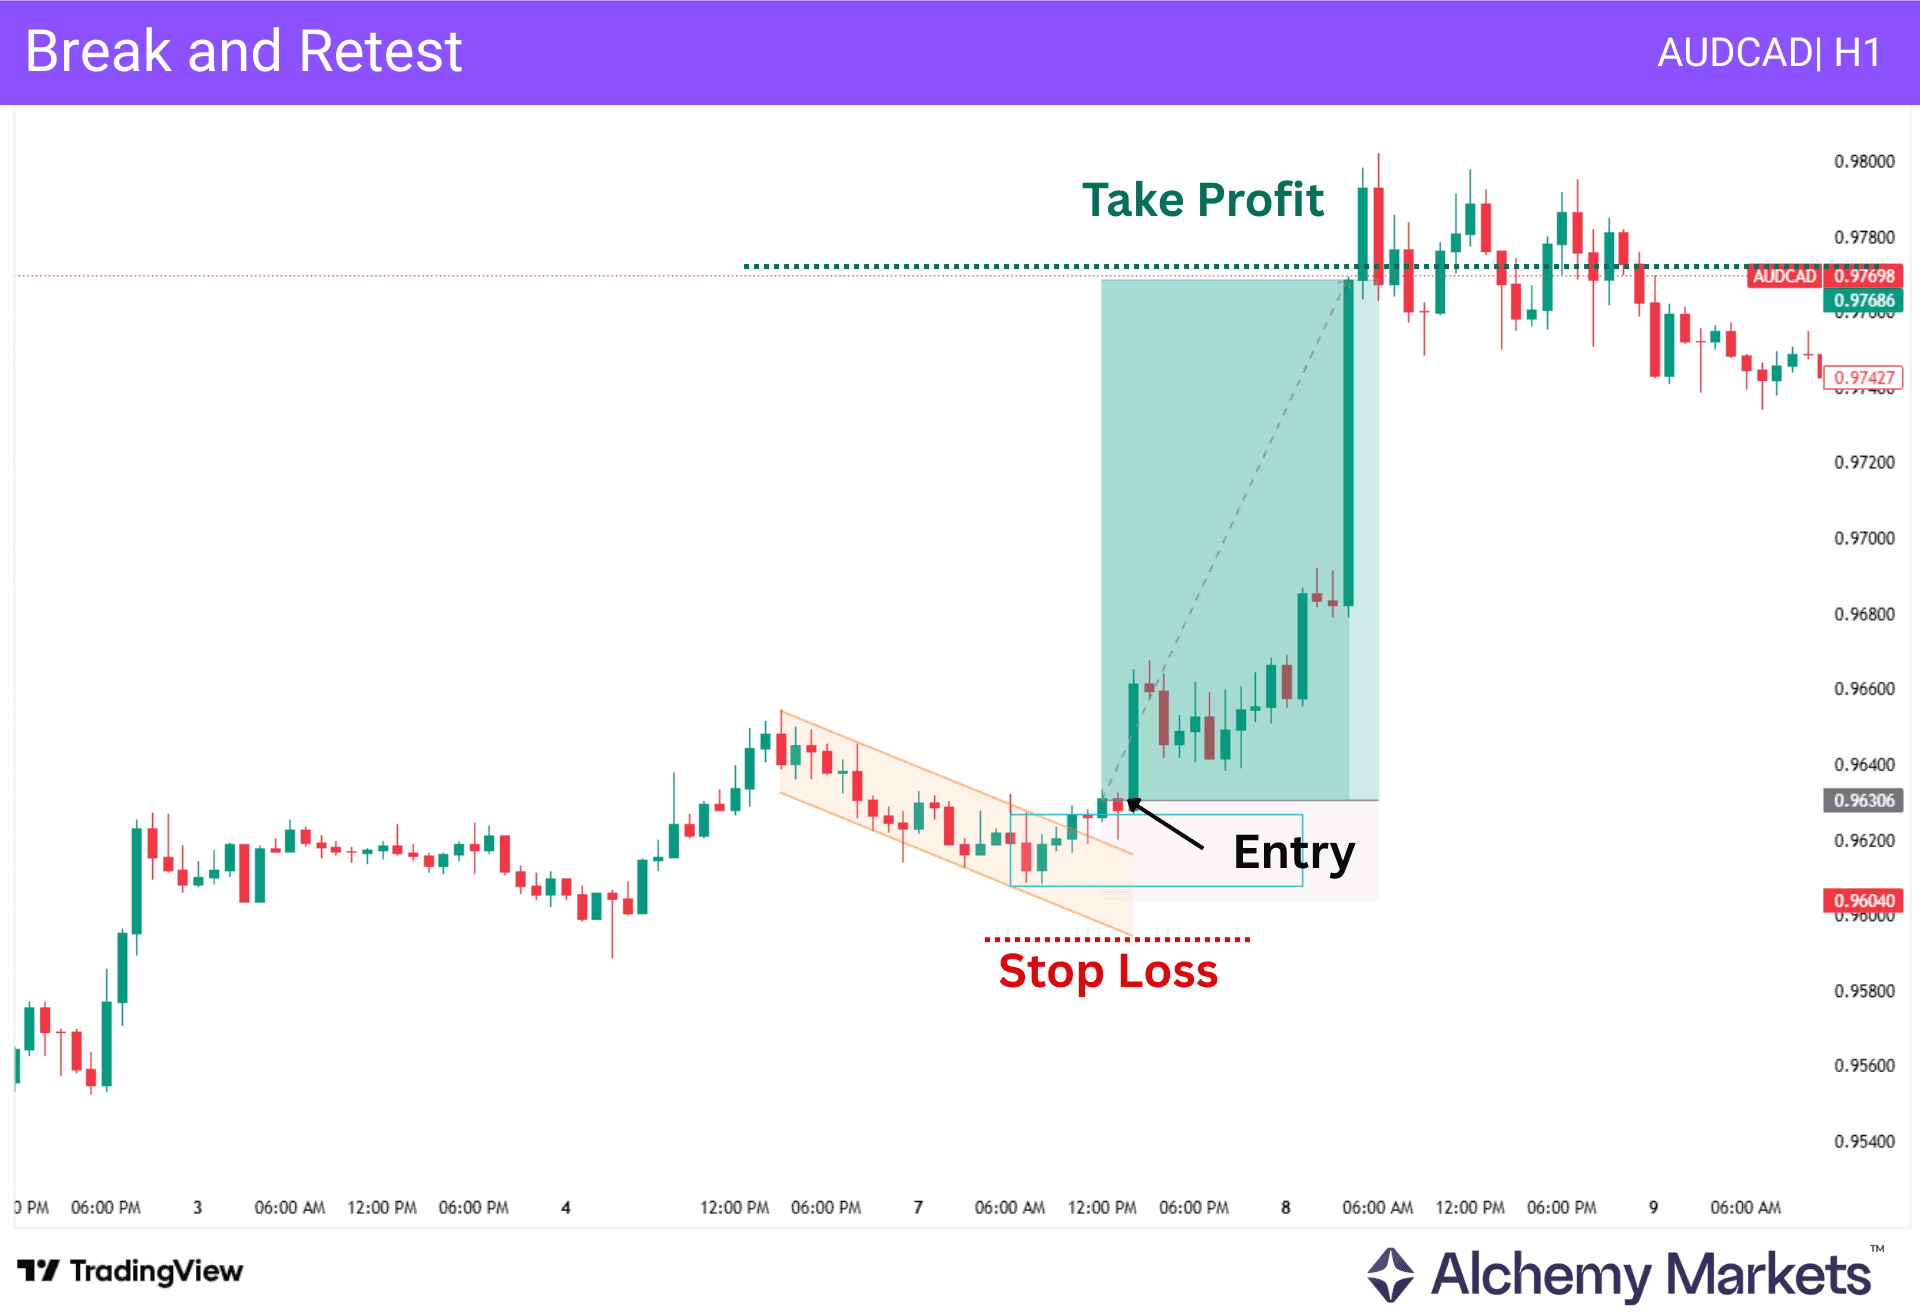
Break and retest is a more patient way to trade bull and bear flags.
Instead of entering on the first breakout candle, traders wait for price to return to the broken flag level. If that level holds, the retest can offer a cleaner entry because price is showing that it does not want to move back inside the pattern.
This method can reduce some false breakout risk, but it also means some trades will move without giving a retest.
| Entry: Wait for price to break the flag, return to the broken level, and reject it in the breakout direction. Stop Loss: Place the stop loss order beyond the retest area or beyond the opposite side of the flag. Take Profit: Use the measured move target. The flagpole high or low can be used as a partial take profit level if price reacts there first. |
Volume Confirmation
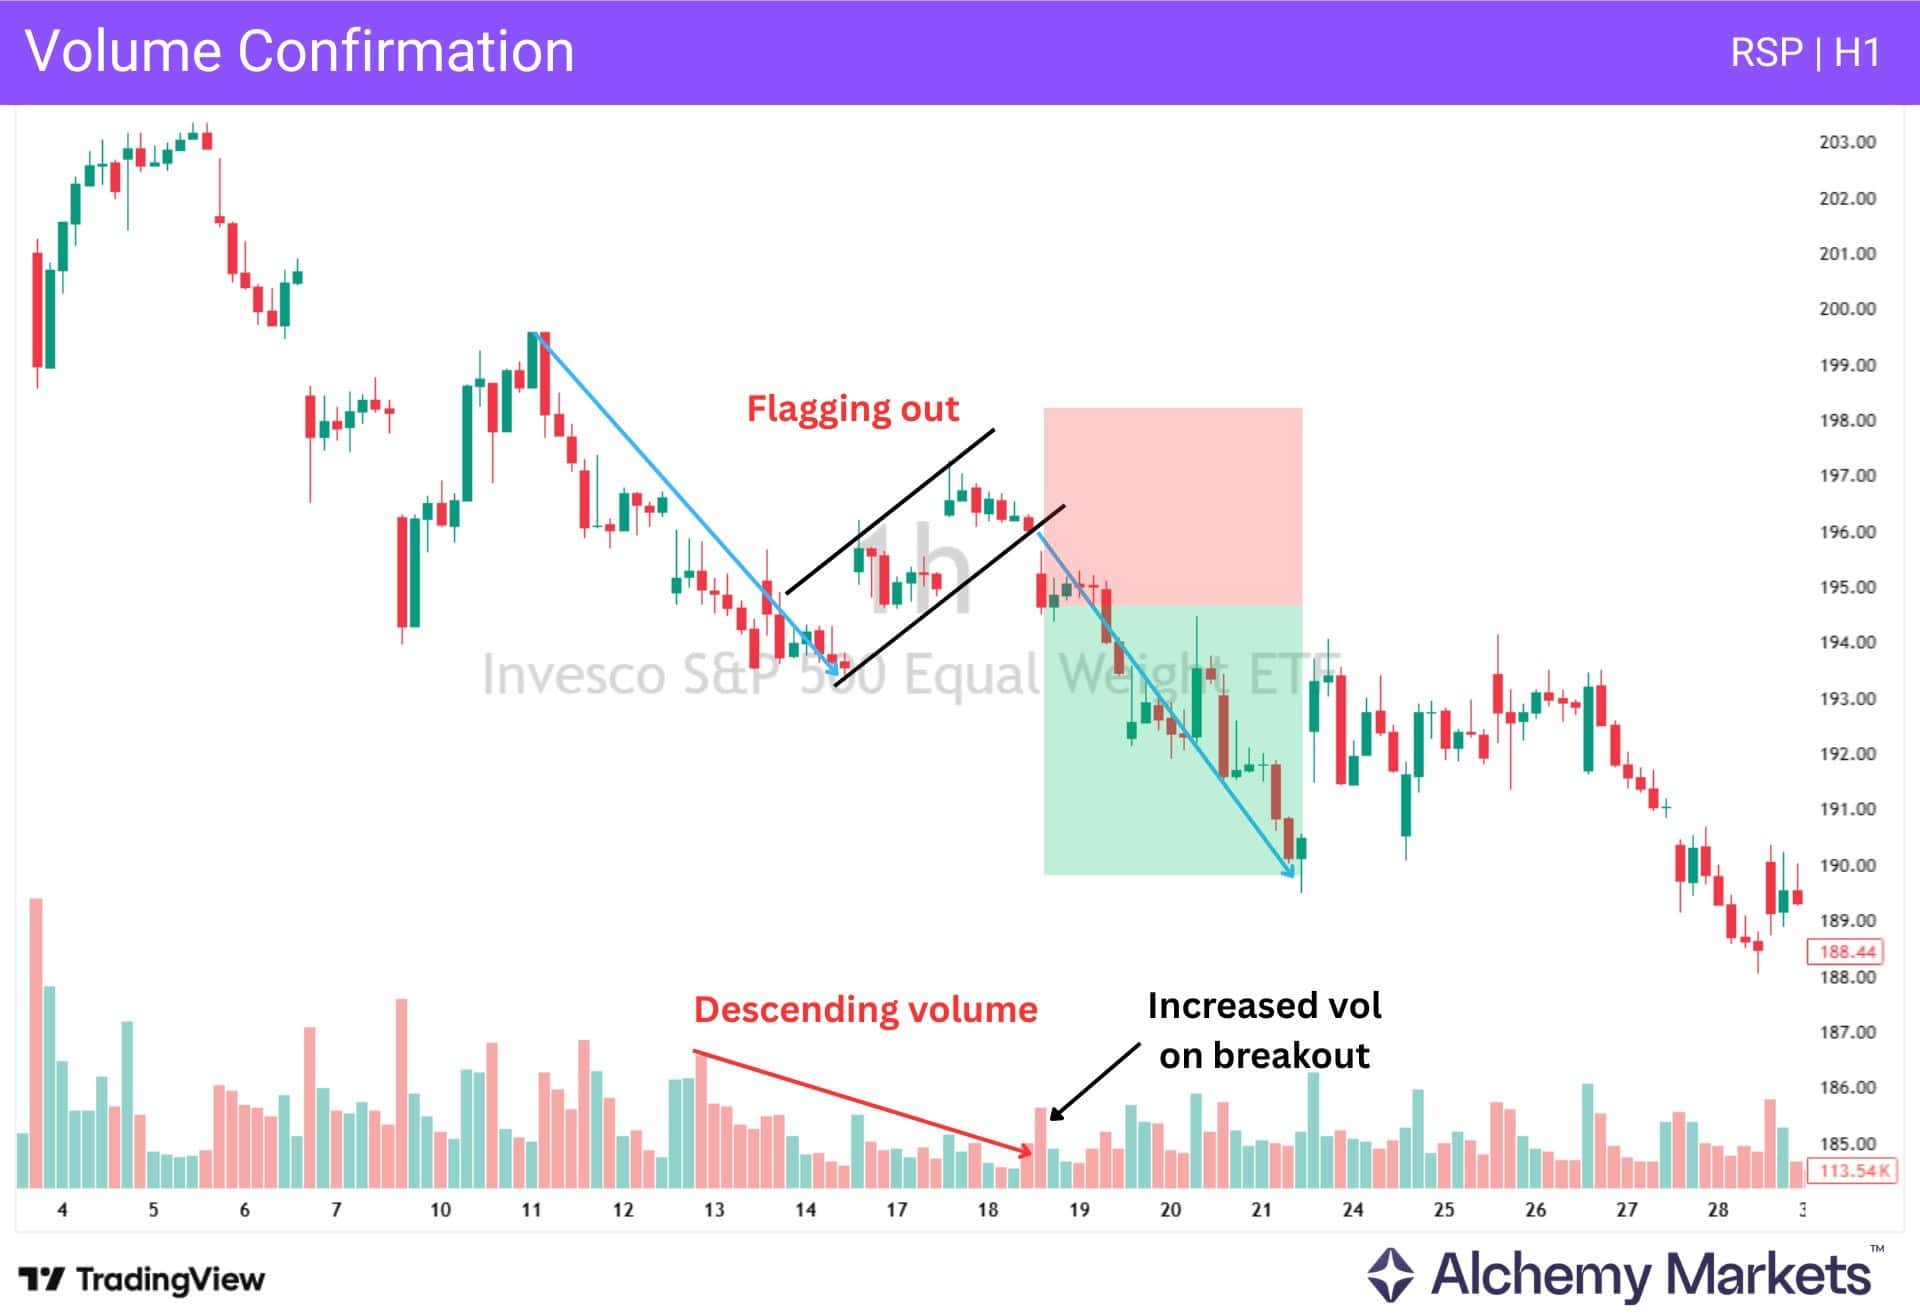
Volume confirmation is a common way to filter bull and bear flag patterns.
The first thing to watch is the volume during the flag itself. Ideally, volume should decline while price moves sideways or pulls back. This suggests the counter-trend move is controlled, rather than a strong reversal attempt.
Breakout volume can help, but it does not need to be treated as a strict requirement. In some cases, the largest volume only appears later in the move, after price has already broken out.
This is why price action still matters most. If price breaks out, retests the flag area, and fails to move back inside the pattern, it suggests the breakout level is being respected.
| Entry: Enter when price breaks the flag after lower volume during the flag phase, or after a successful retest of the broken flag level. Stop Loss: Place the stop loss order beyond the opposite side of the flag or the failed retest area. Take Profit: Use the measured move target. The flagpole high or low can be used as an earlier area to manage risk. |
Support and Resistance Levels
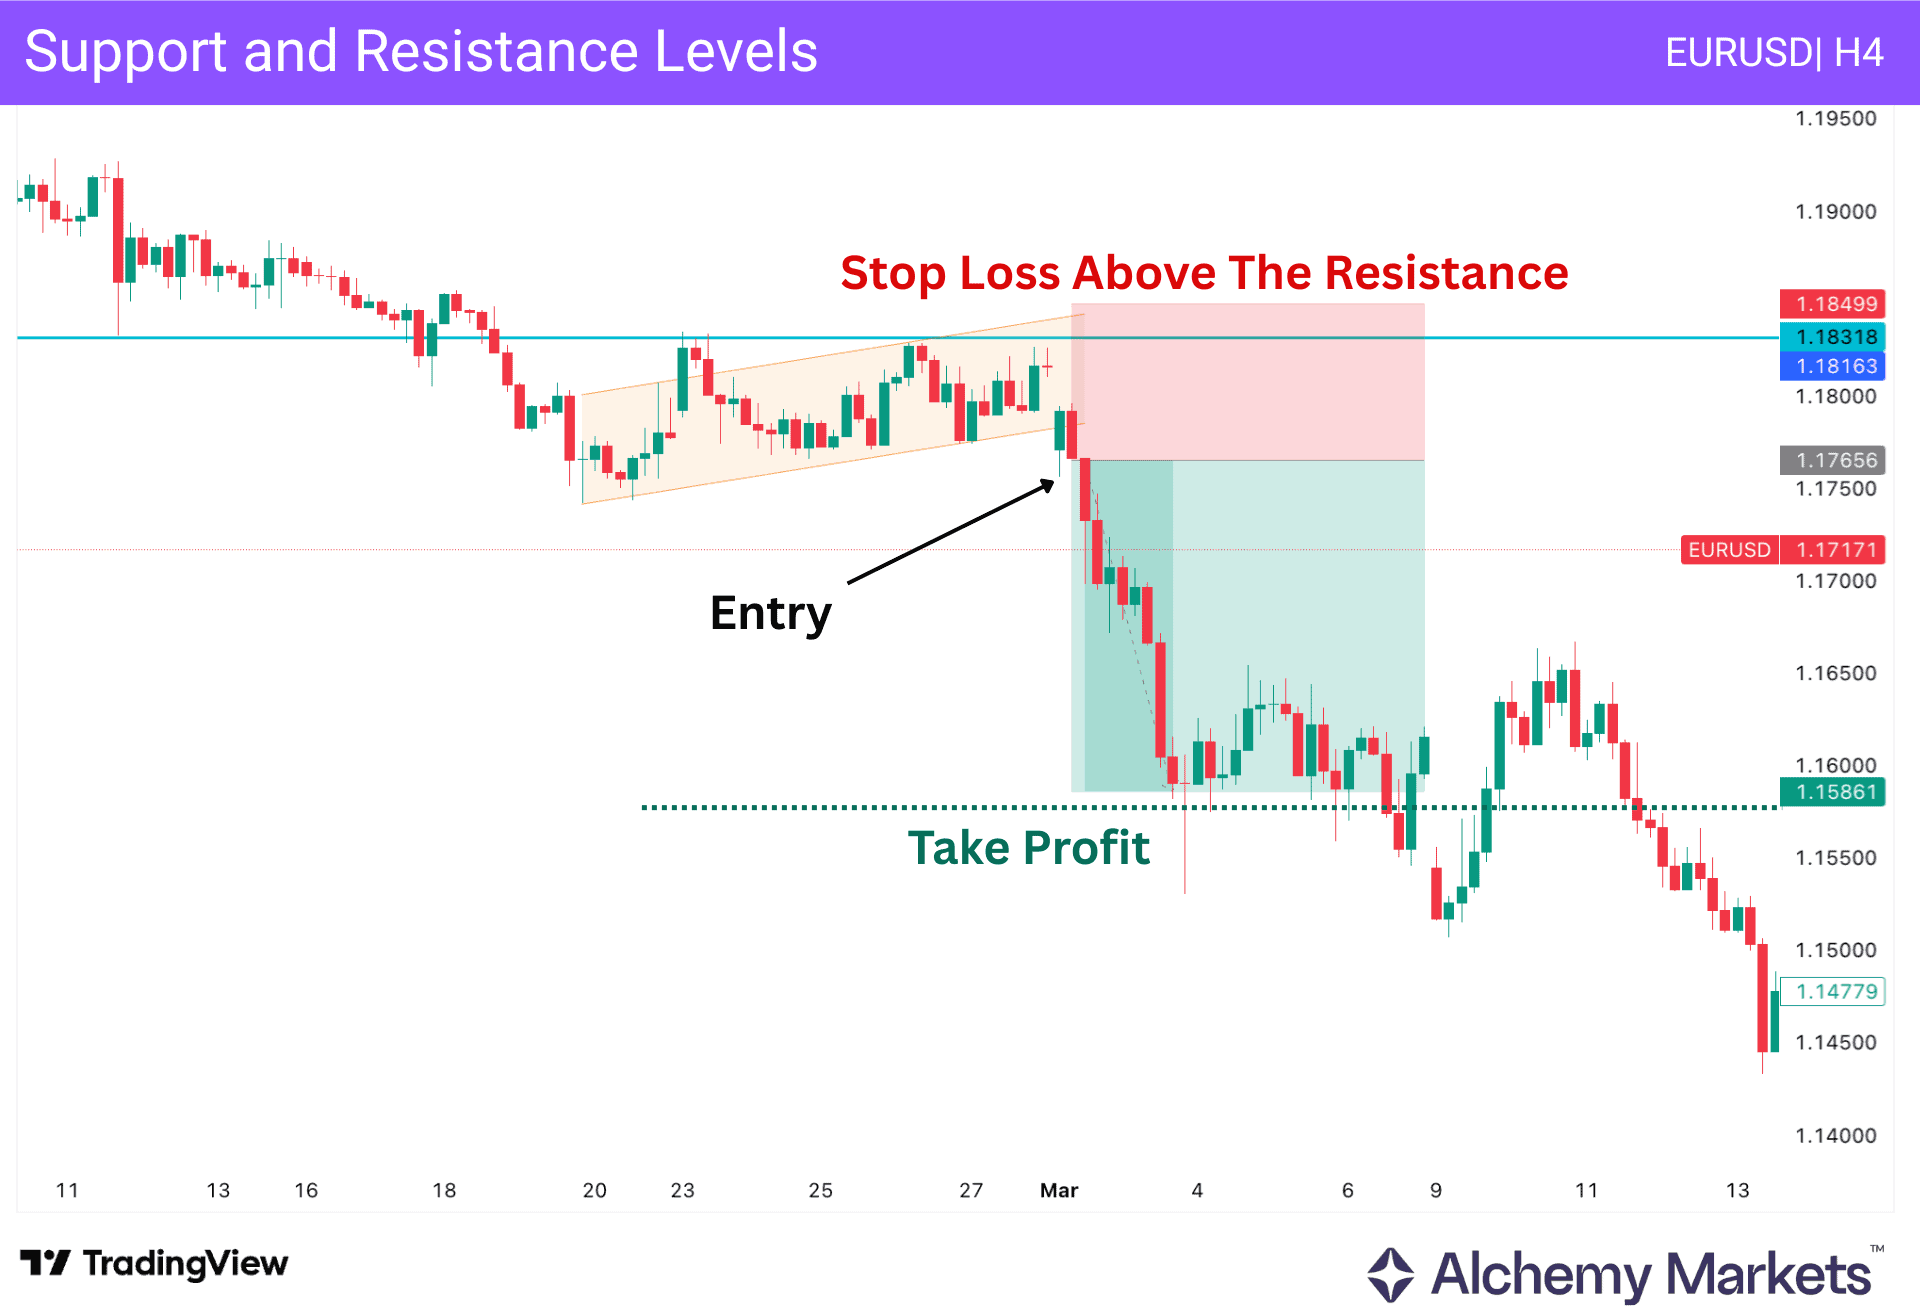
Support and resistance levels help traders judge whether a flag breakout has room to continue.
A bullish flag breakout is cleaner when there is no major resistance sitting directly above the entry. A bearish flag breakout is cleaner when there is no major support directly below the entry.
If the measured move target runs straight into a higher timeframe level, traders may use that level to take partial profit or tighten risk instead of blindly waiting for the full target.
| Entry: Enter when the flag breakout has room to move before hitting a major support or resistance level. Stop Loss: Place the stop loss order beyond the level that would invalidate the setup. Take Profit: Use the measured move target, but manage the trade around nearby higher timeframe support or resistance. |
How Big Traders Use Flags
Larger traders, such as hedge funds and financial institutions, may still watch flag patterns, but they are unlikely to trade them as simple breakout signals.
For them, the flag is less important than the broader market context.
They may be watching Treasury yields, inflation data, valuation, liquidity, volatility, positioning, or options exposure before deciding whether an asset is worth buying or selling.
Large players also cannot usually enter or exit major positions in one move without affecting price.
If they push too much volume through the market at once, they risk moving prices against themselves and getting a worse average entry. This is why they are also unlikely to trade the breakout or retest of flags.
Rather, if large players get involved within a flag pattern, it’d be during the flagging out phase. This pause in price hints that positions are being built or reduced gradually.
Still, it should be treated as a clue, not proof of institutional activity.
Advantages of Trading the Flag
The flag pattern offers valuable insights into the market that help traders understand where the price is heading. The major benefits of the flag pattern strategy are as follows:
- The flag pattern provides a higher success rate when the price remains within a stable market trend.
- The flag pattern strategy has clear and easy-to-understand entry and exit points.
- The flag pattern allows investors to understand the market context, even if the trader does not use it as a primary strategy.
- It is often useful to combine with other indicators to create an effective trading strategy.
Disadvantages of Trading the Flag
Like other trading strategies, the bullish and bearish flag pattern has some drawbacks:
- The pattern might not align properly with trendline support and resistance, making it difficult to identify and draw.
- The success rate of the flag pattern strategy depends on the strength of the trend. In a volatile market structure, the pattern may provide false trading signals.
- At the entry level, the pattern might give false signals with an immediate market reversal.
- Sometimes, the market can move early without providing a proper trading opportunity.
Flag vs. Pennant Pattern
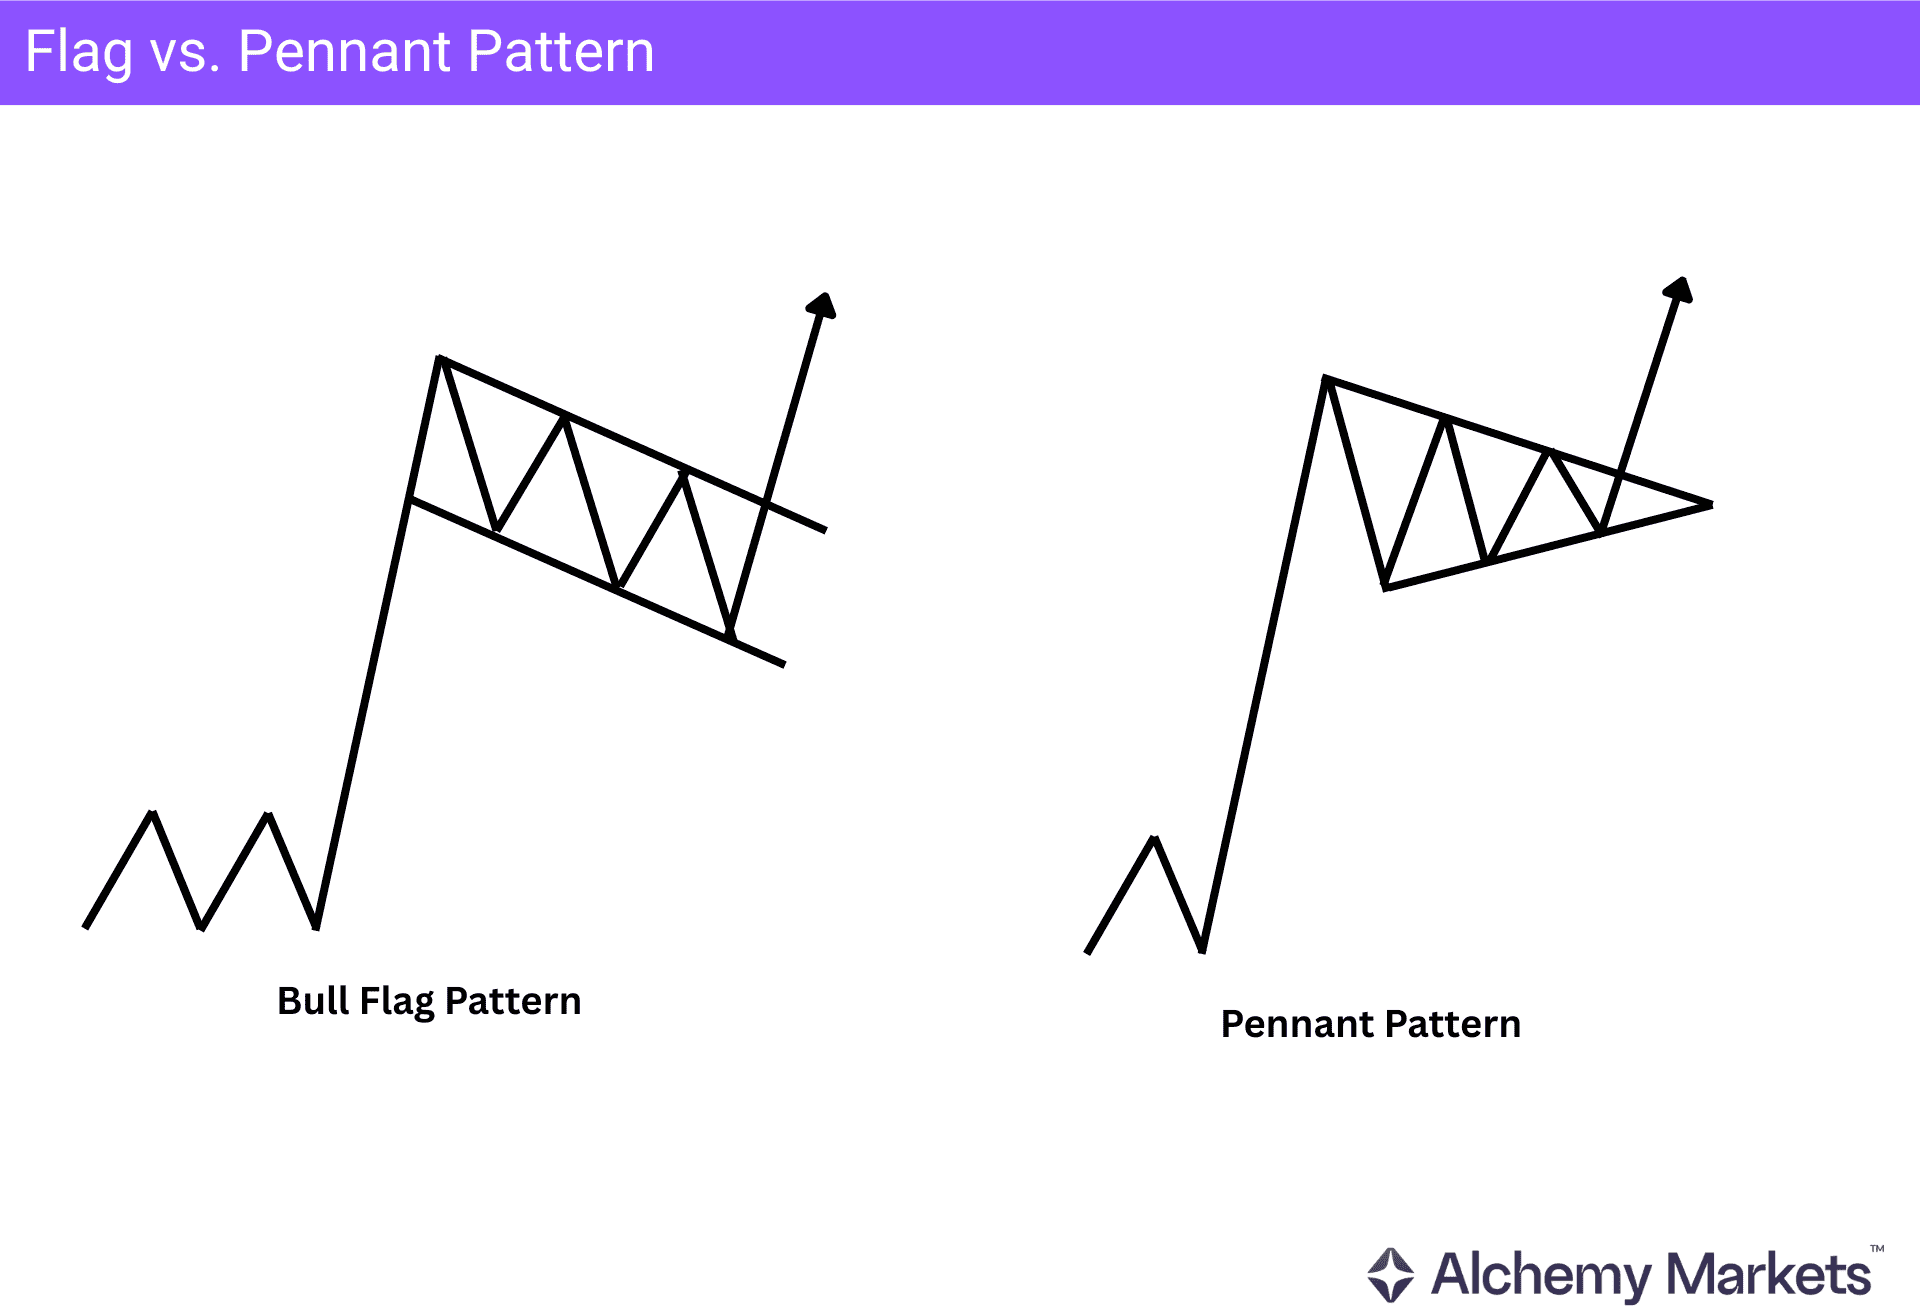
Flag patterns and pennant patterns both work for continuation trading opportunities, but they are easy to differentiate:
Both patterns start with consolidation after an impulsive move, but the price action within the consolidation differs. In a flag pattern, the trendline support and resistance move in parallel, maintaining a fixed distance. In a pennant pattern, both lines squeeze together.
In a flag pattern, the price usually moves against the major trend with a corrective momentum. However, the pennant pattern can move sideways or slightly in the direction of the trend. Finally, the flag pattern generally takes longer to form than the pennant pattern.
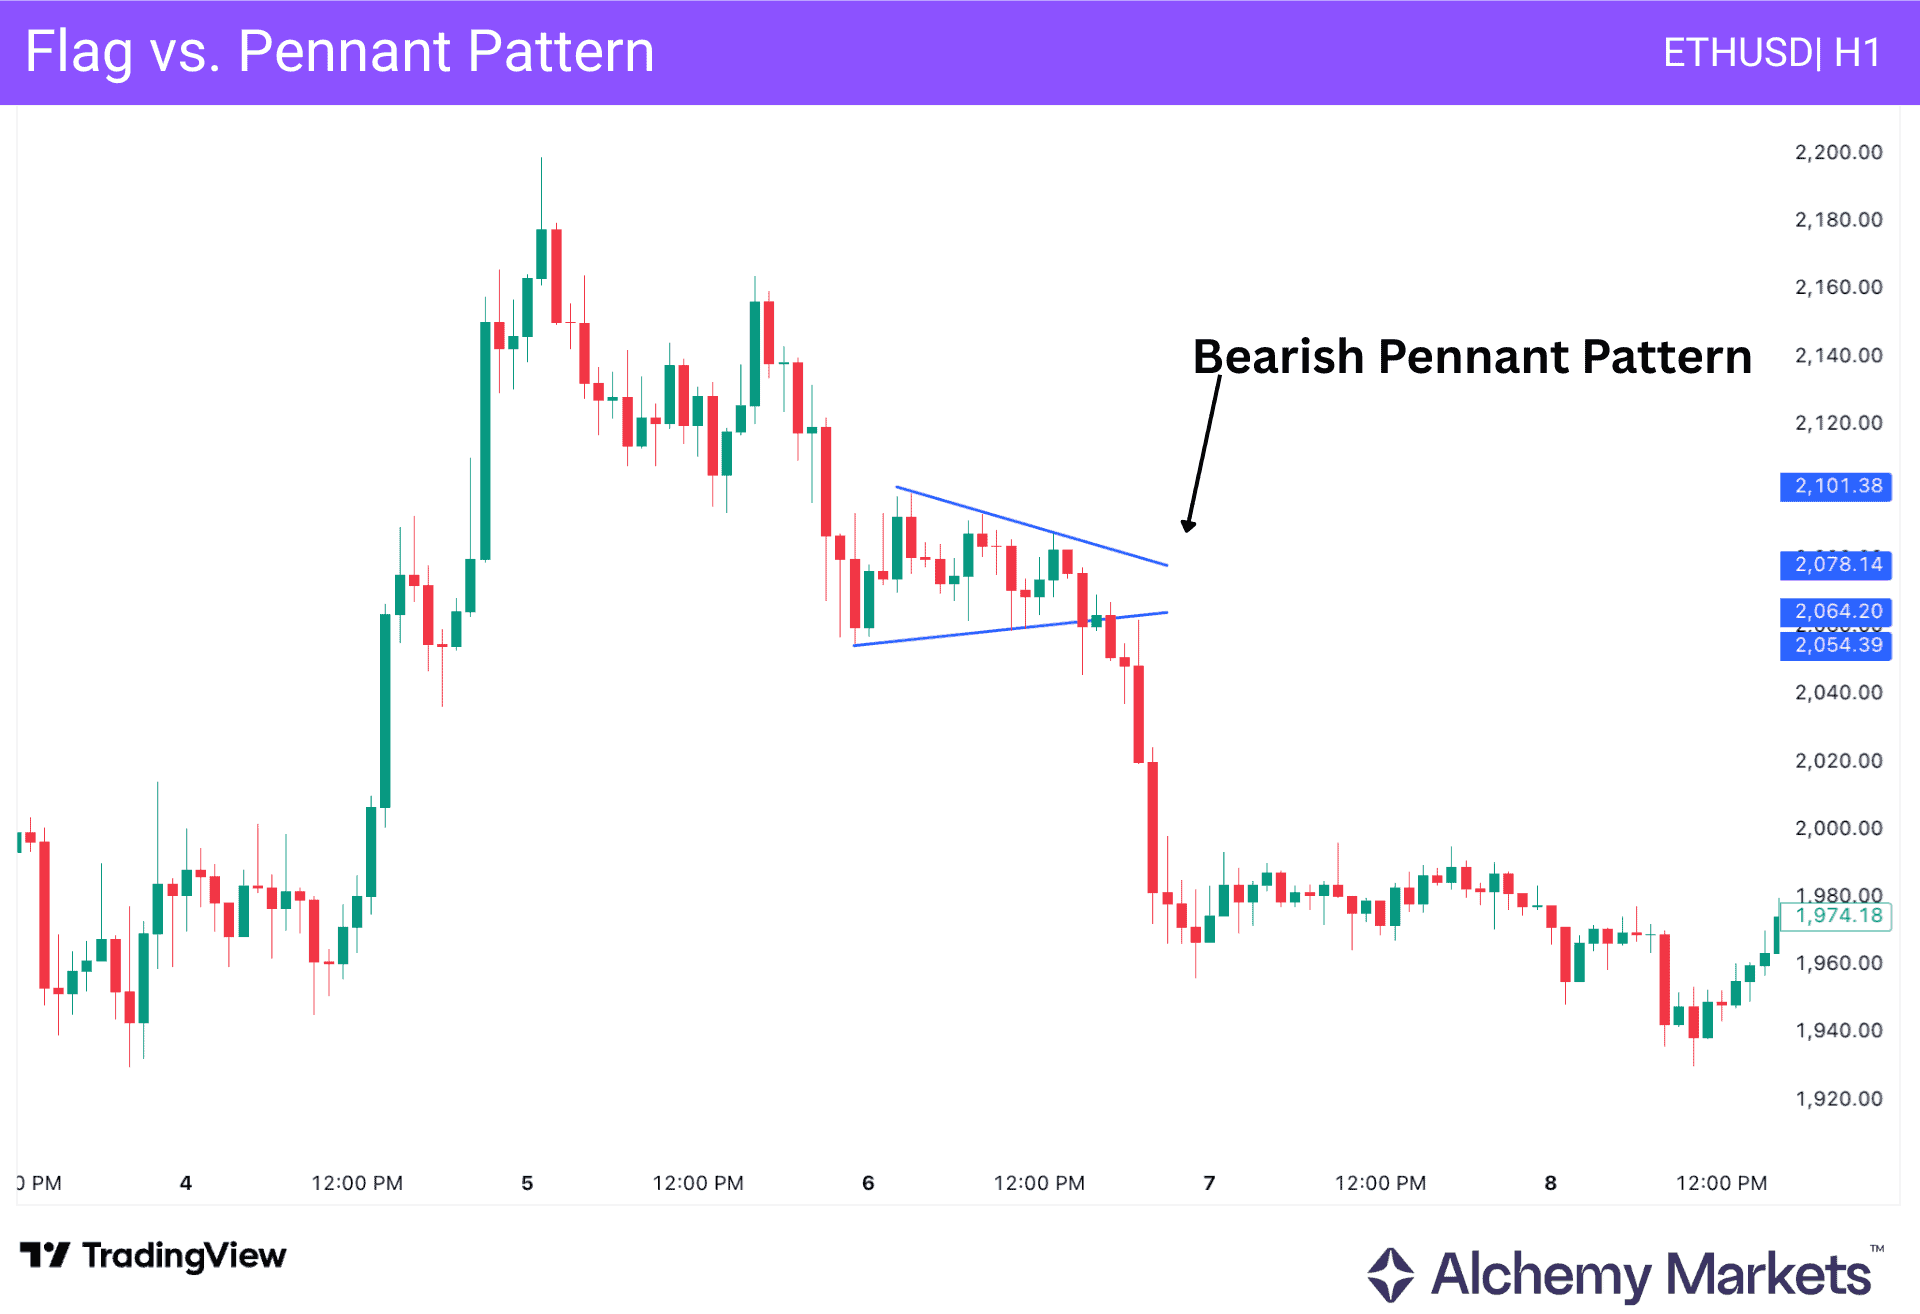
The image above shows how the pennant pattern works in a bearish market.
Flag vs. Wedge Pattern
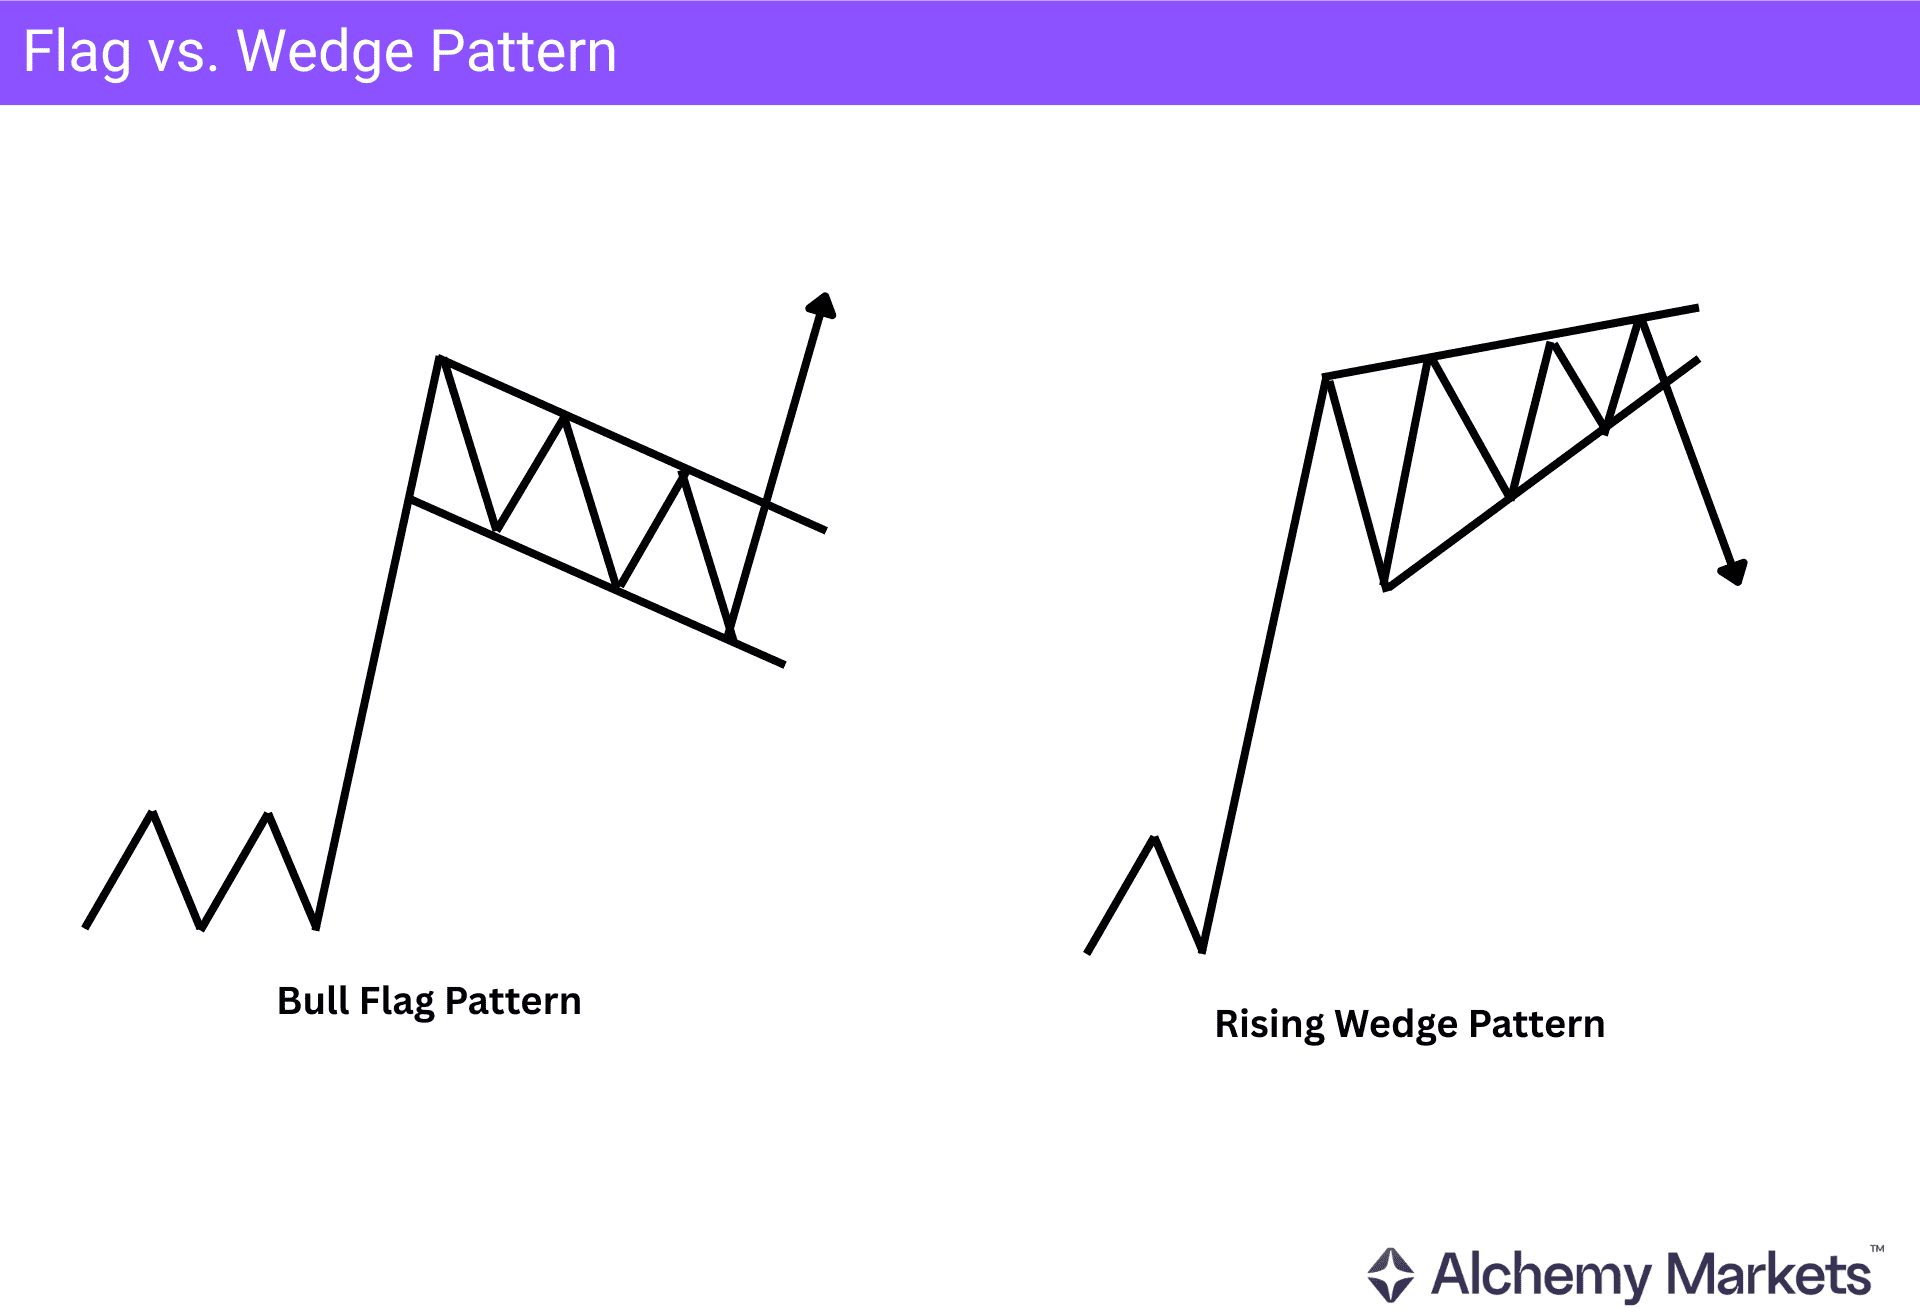
Like the flag pattern, the wedge pattern appears after an impulse. However, instead of a continuation signal, it works as a reversal signal.
In a rising wedge pattern, price moves higher and consolidates within a corrective bullish momentum, creating a wedge. Once the price breaks below the wedge support, it validates a bearish reversal opportunity.
The opposite applies to a falling wedge pattern, where the price moves within a corrective trend after a bearish move and forms a bullish breakout upon validation.
In a flag pattern, the price moves in the opposite direction within a parallel channel. However, in a wedge pattern, price forms a converging structure, creating a breakout opportunity.
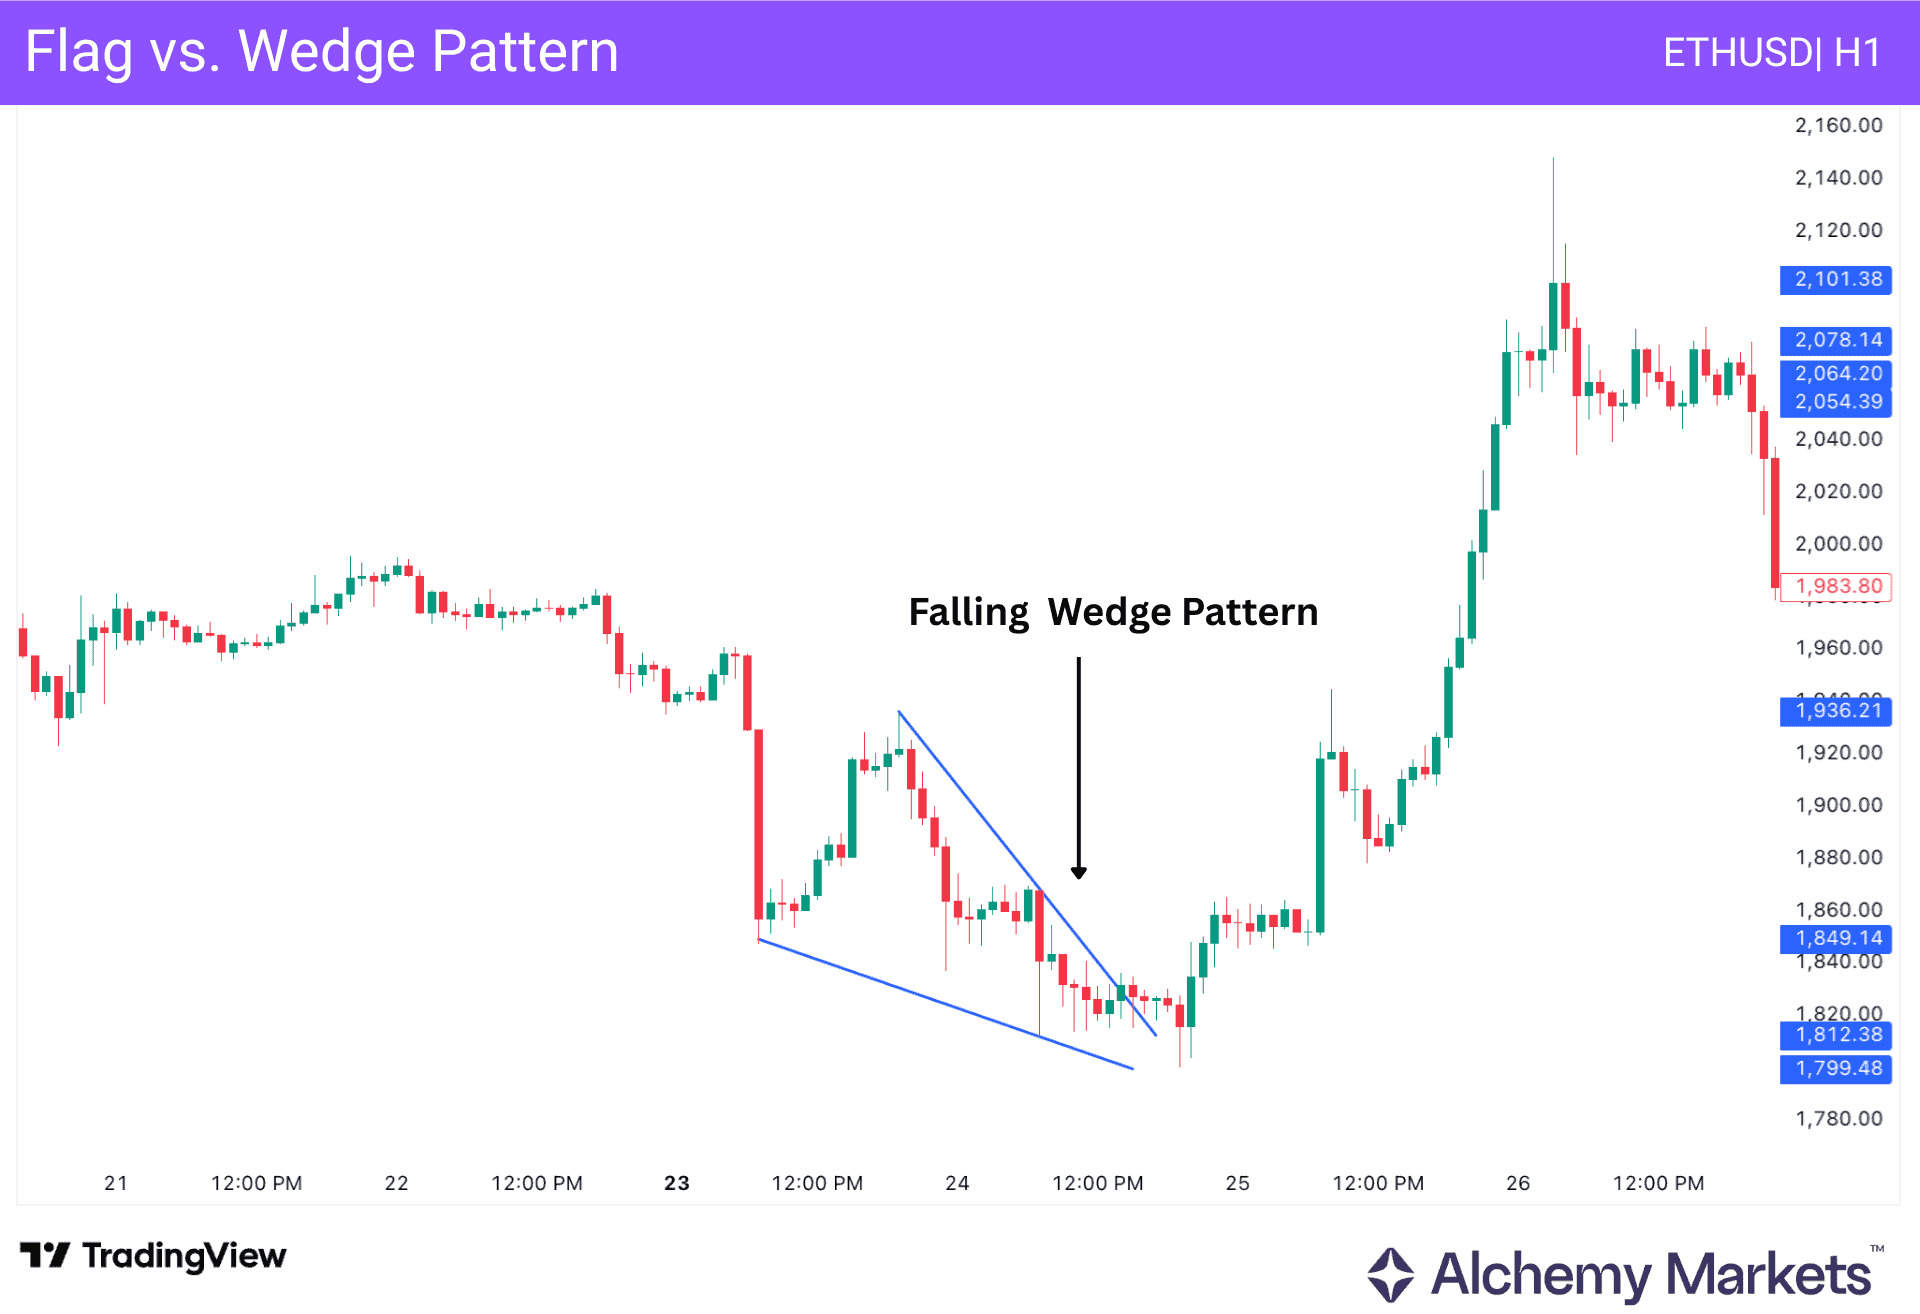
The image above shows how the Wedge pattern works in the bearish market. A bullish price break is visible from the Wedge resistance, creating a trend reversal.
Flag vs. Other Continuation Patterns
Besides the flag pattern, there are other price patterns that can also provide continuation opportunities:
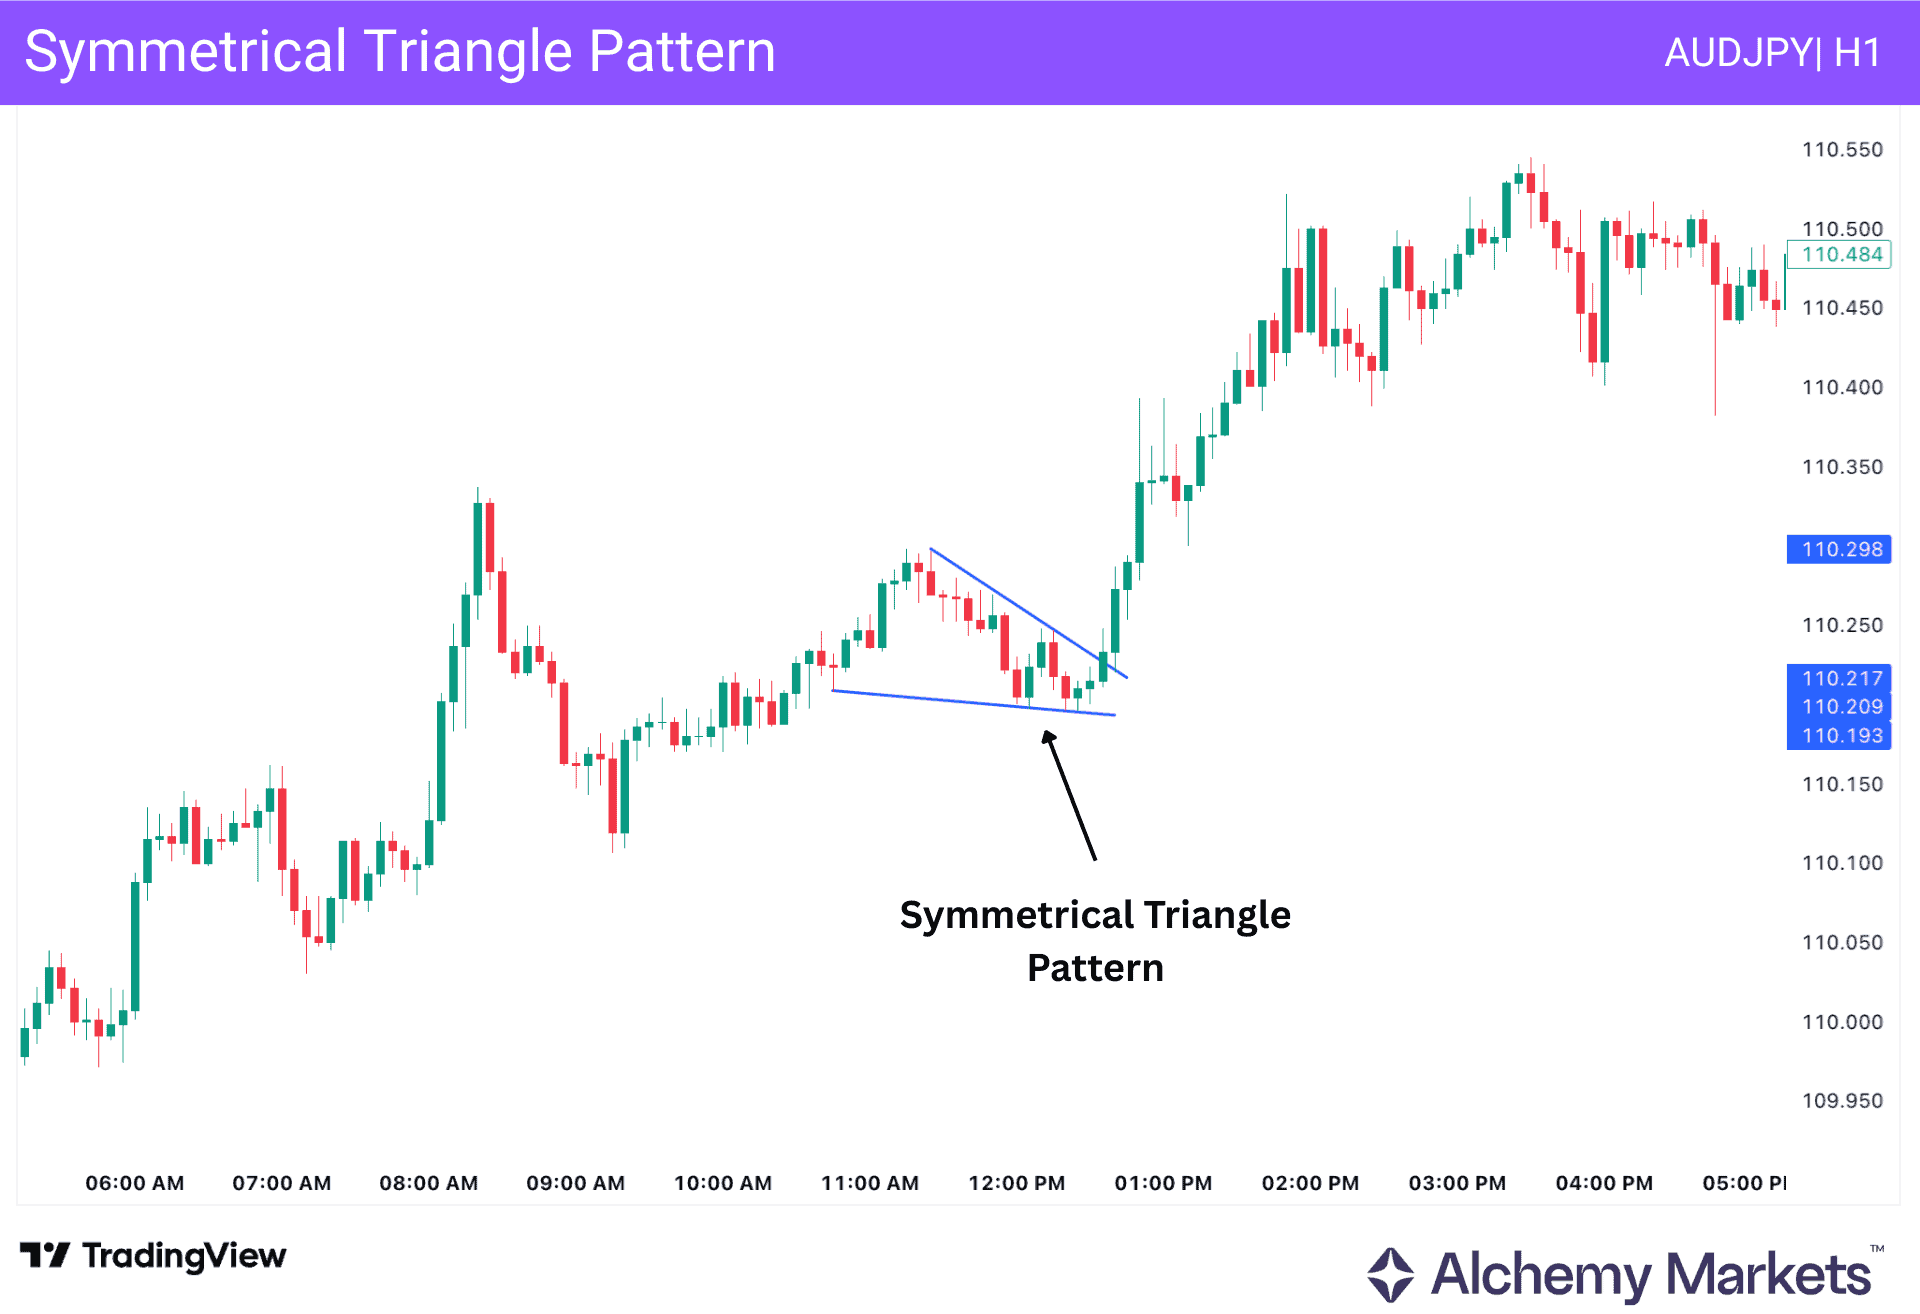
The triangle pattern is a common continuation pattern where the price consolidates before extending the trend.
The ascending triangle is a bullish continuation pattern where resistance remains horizontal. Conversely, the descending triangle acts as a bearish continuation pattern where support remains horizontal. Moreover, the symmetrical triangle occurs when both support and resistance begin to converge.
Let’s see how the Symmetrical Triangle looks like:
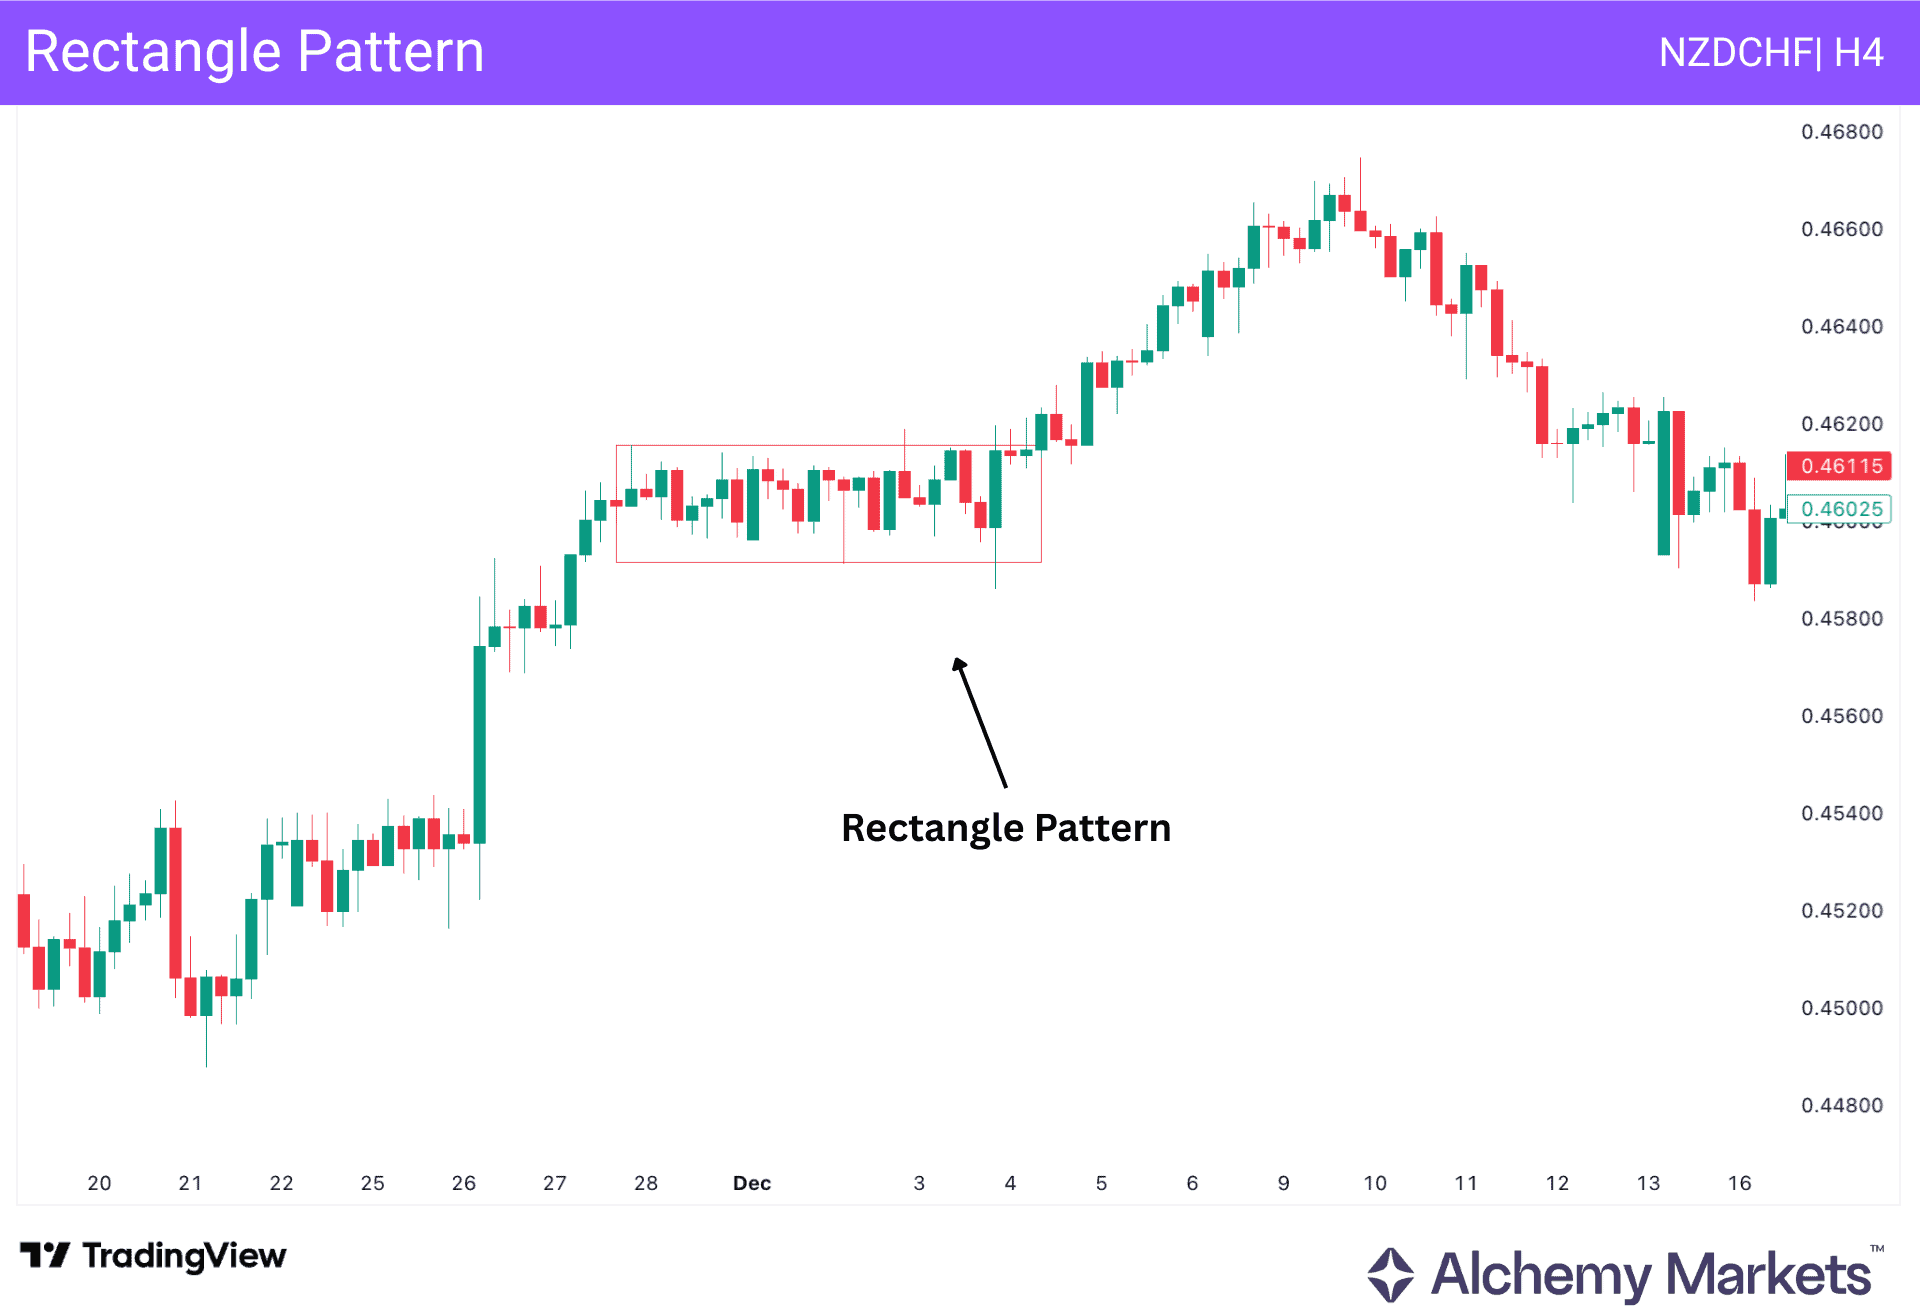
The rectangle pattern is also a continuation pattern where the price moves within a range. A breakout below support signals bearish continuation, while a breakout above resistance signals bullish continuation.
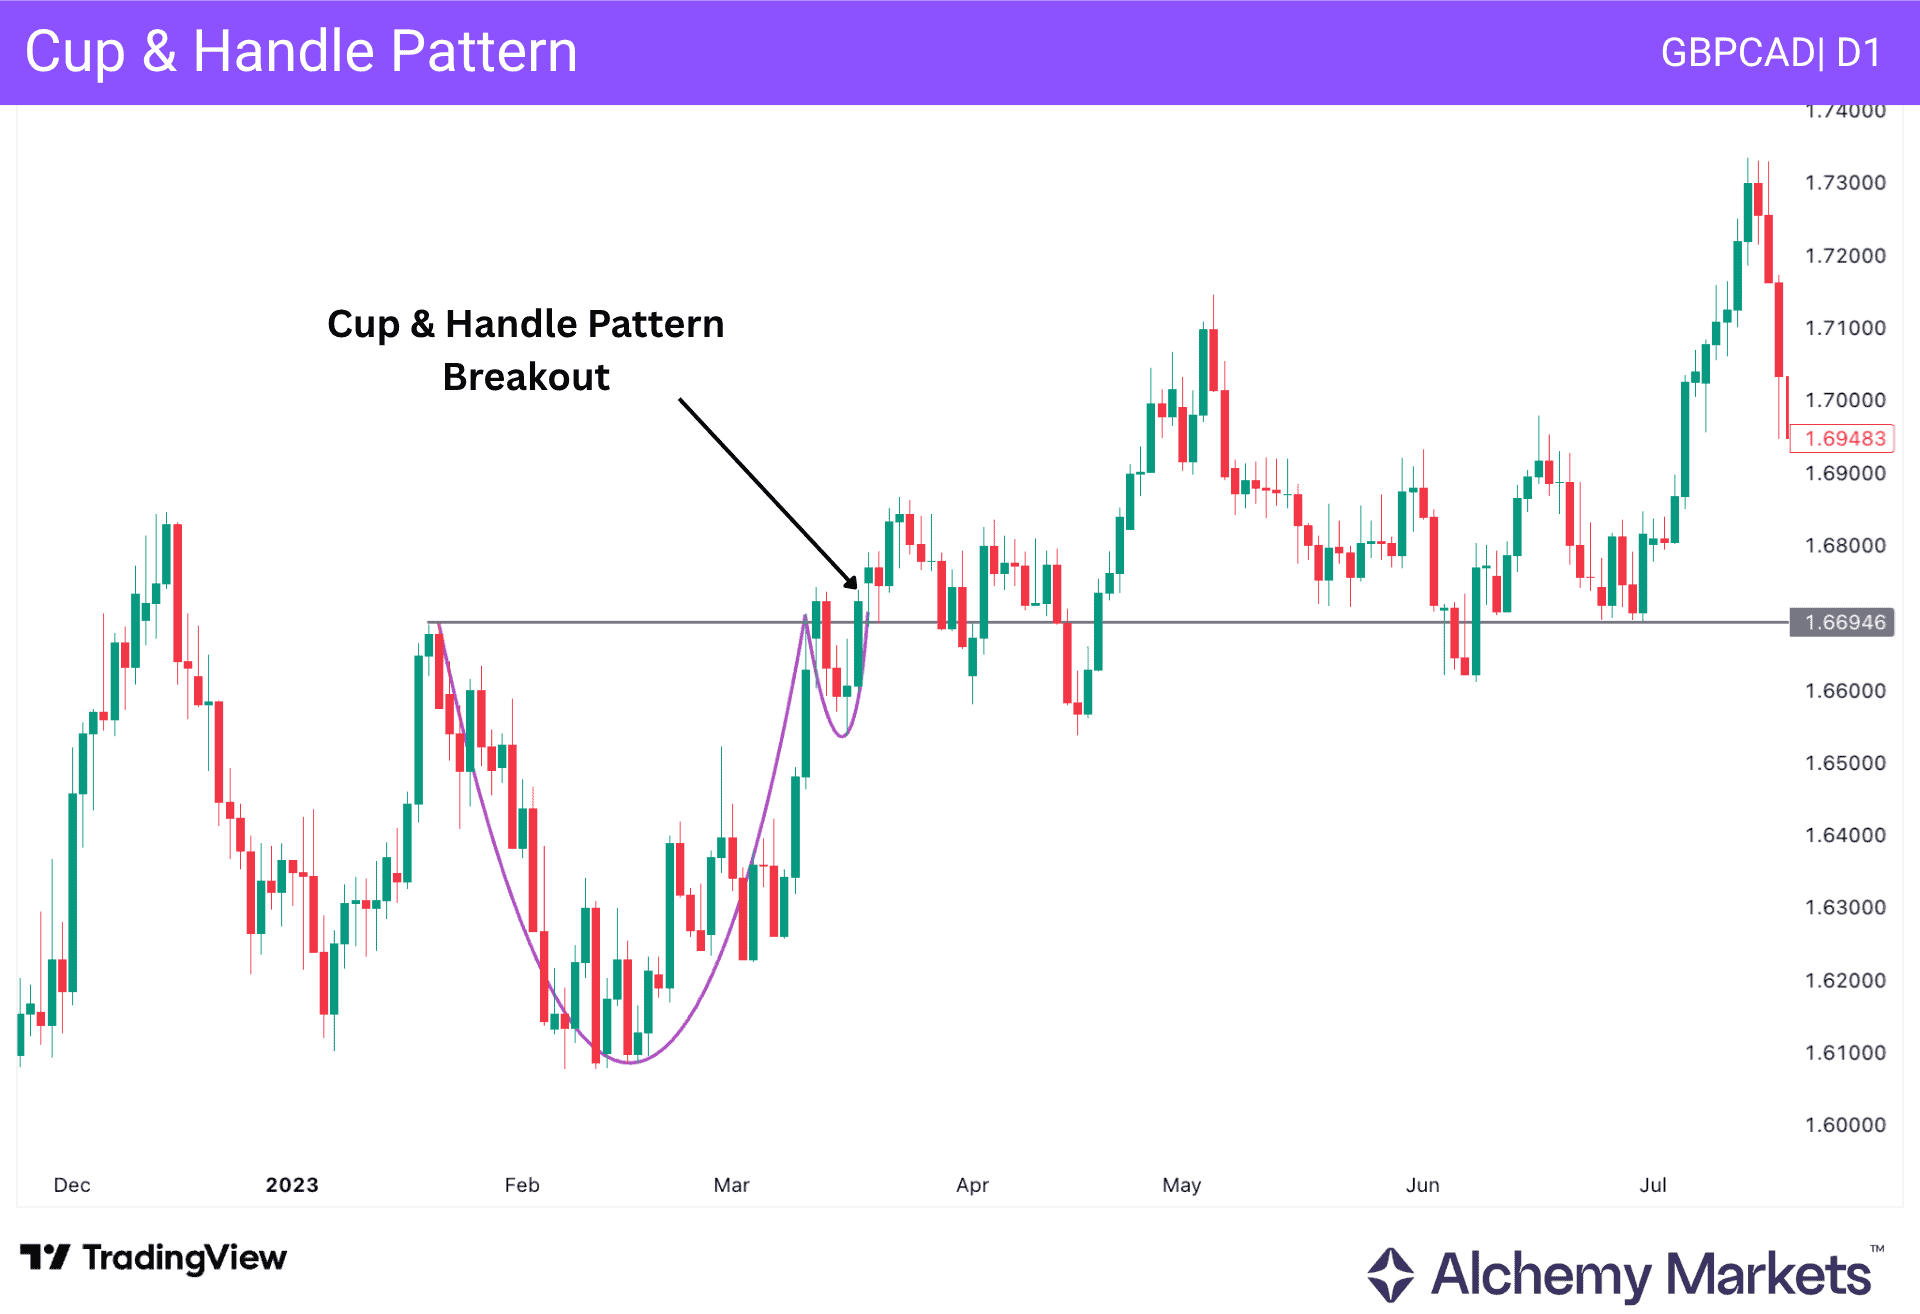
The cup-and-handle pattern is another continuation pattern in which a major correction forms a U-shaped recovery, followed by a smaller consolidation (the handle). The opposite structure can also appear in bearish trends.
FAQ
What are the Common Bull Flag vs Bear Flag Mistakes to Watch out for
- False illustration of the pattern: Verify that the flagpole is clearly visible as the pattern starts from this point. A more unpredictable and disorganised retracement may indicate a deeper correction or reversal rather than a flag pattern.
- Choppy or sideways markets: The flag trading strategy works well in the trend. The breakout may be feeble or fail if the market is erratic, drifting sideways, or losing pace during the consolidation.
- Ignoring volume: Without verifying the volume pattern, a breakout is less trustworthy.
- Incorrect entry: You risk becoming trapped in a sideways market if you open a position before the breakout confirmation.
How to Identify Fakeouts and Trap Setups?
The fakeout can happen if the price forms a flag breakout but reverses immediately. A proper confirmation is needed to avoid unexpected fakeouts.
Are flag patterns helpful for beginners and intermediate traders?
These patterns are often hard to identify for new traders as it needs patience and close price monitoring. These are usually used by intermediary traders with data on funding, volume patterns, and liquidity.
What is the difference between a bull flag and a bear flag?
A bull flag indicates a brief pause before the price rises once more. A bear flag indicates a slight increase before another price decline.
Which Time-frame is Best to Trade a Flag Pattern?
Indeed! One-minute, daily, and even weekly charts can display them. The concept remains unchanged.
Why do bull and bear flags sometimes fail?
There are several reasons. Changes in market conditions, unexpected news, and war can make the pattern at any time.
When Do Bear and Bull Flag Patterns Fail?
If the breakout occurs below the trendline support rather than resistance, the bull flag patterns may fail. The opposite can happen for a bear pattern, where multiple breaks above the resistance could signal a failure. The price action within the pattern is important as impulse against the pole could invalidate the setup at any time.
How can I spot a real bull flag or bear flag?
Identity flagpole and start observing the price. Make sure that there are at least two swings from the pole with corrective pressure. It is easy to spot using the candlestick chart.
What Is the Role of the Flag Pole in Flag Patterns?
In each bullish and bearish flag, the flag pole is the first significant price movement that precedes the consolidation stage. The flag pole moves strongly upward in a bull flag and sharply downward in a bear flag. The height of the flagpole helps identify the possible objective for the investment’s breakout or breakdown.
Is the Flag pattern a Reversal or Continuation Pattern?
A sequel chart pattern known as the Flag pattern indicates a short break before resuming the current trend. It develops following a significant price move and a brief consolidation channel. Price maintains its dominant trend after breaking the channel.
How Do Resistance and Support Levels Affect Bull and Bear Flags?
In bullish and bearish flags, both barrier and support levels are important. In a bull flag, resistance is located at the highest point of the consolidation; breaking this barrier indicates that the uptrend will continue. On the other hand, the opposition is located at the lower edge of the consolidation phase in a bear flag. In contrast, support acts at the upper limit in a bear flag and the lower limit in a bull flag.
Can bull and bear flags happen on any time frame?
Indeed! One-minute, daily, and even weekly charts can display them. The concept remains unchanged.
How Can Price Action and Candlestick Patterns Help Identify Flag Patterns?
The flag pole’s impulsive movement, accompanied by consolidation, is what traders watch for when spotting flag patterns, and price action is crucial. This consolidation’s candlestick patterns offer more information.
How Do Traders Use Distance and Levels in Flag Pattern Analysis?
The future price direction depends on the distance between the flagpole’s highest point and its lowest point. Trading decisions are guided by trendline support and resistance levels during the consolidation phase.
Should I wait for a breakout before trading a flag?
Indeed! Waiting for a price breakout with significant volume before making a purchase or sale is safer.
Do flags appear in both bull and bear markets?
Indeed. Bull flags emerge during upward movement, and bear flags during downward movement. This is the main distinction. Both may emerge when the trajectory is being tested, such as in some areas of the current market.
How reliable are flag patterns?
In conventional technical analysis, a bull flag is a well-known chart pattern that is frequently used by both novice and experienced traders to identify potential areas of consolidation in bullish momentum. One of the most frequent errors made by novice traders is to over-identify flag patterns when there isn’t a flagpole, since the flag pattern depends on an initial rise in price or volume.
What Invalidates Flag Patterns?
During a trade, a bull flag may be invalidated for a variety of reasons at different times. For example, if the flag is formed wrongly or if the early retraces are too deep, some traders might reject a bull flag setup before making a trade.
A trader would probably not view this as a possible bull flag setup if there was inadequate volume or upward momentum on the first flagpole.


