Written by:

Reviewed by:

Bearish
- May 10, 2024
- 14 min read
Double Top Pattern Explained With Examples
Traders around the world use the double top to find potential short trades and the beginnings of a bear market. Learn how to add this powerful pattern to your trading, and find new opportunities in the market.
Key Takeaways
- Double top patterns signal potential trend reversals with two highs near the same level.
- Indicators with divergence signals, such as the RSI, can often hint at the presence of a double top.
- Within long bull markets, large double tops can often signal the start of a bear market.
What is a Double Top
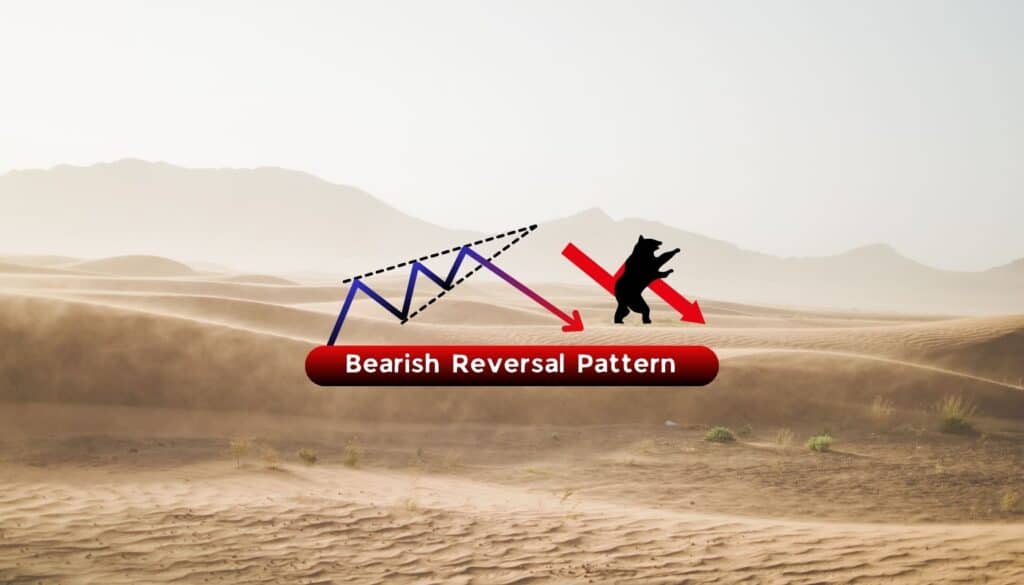
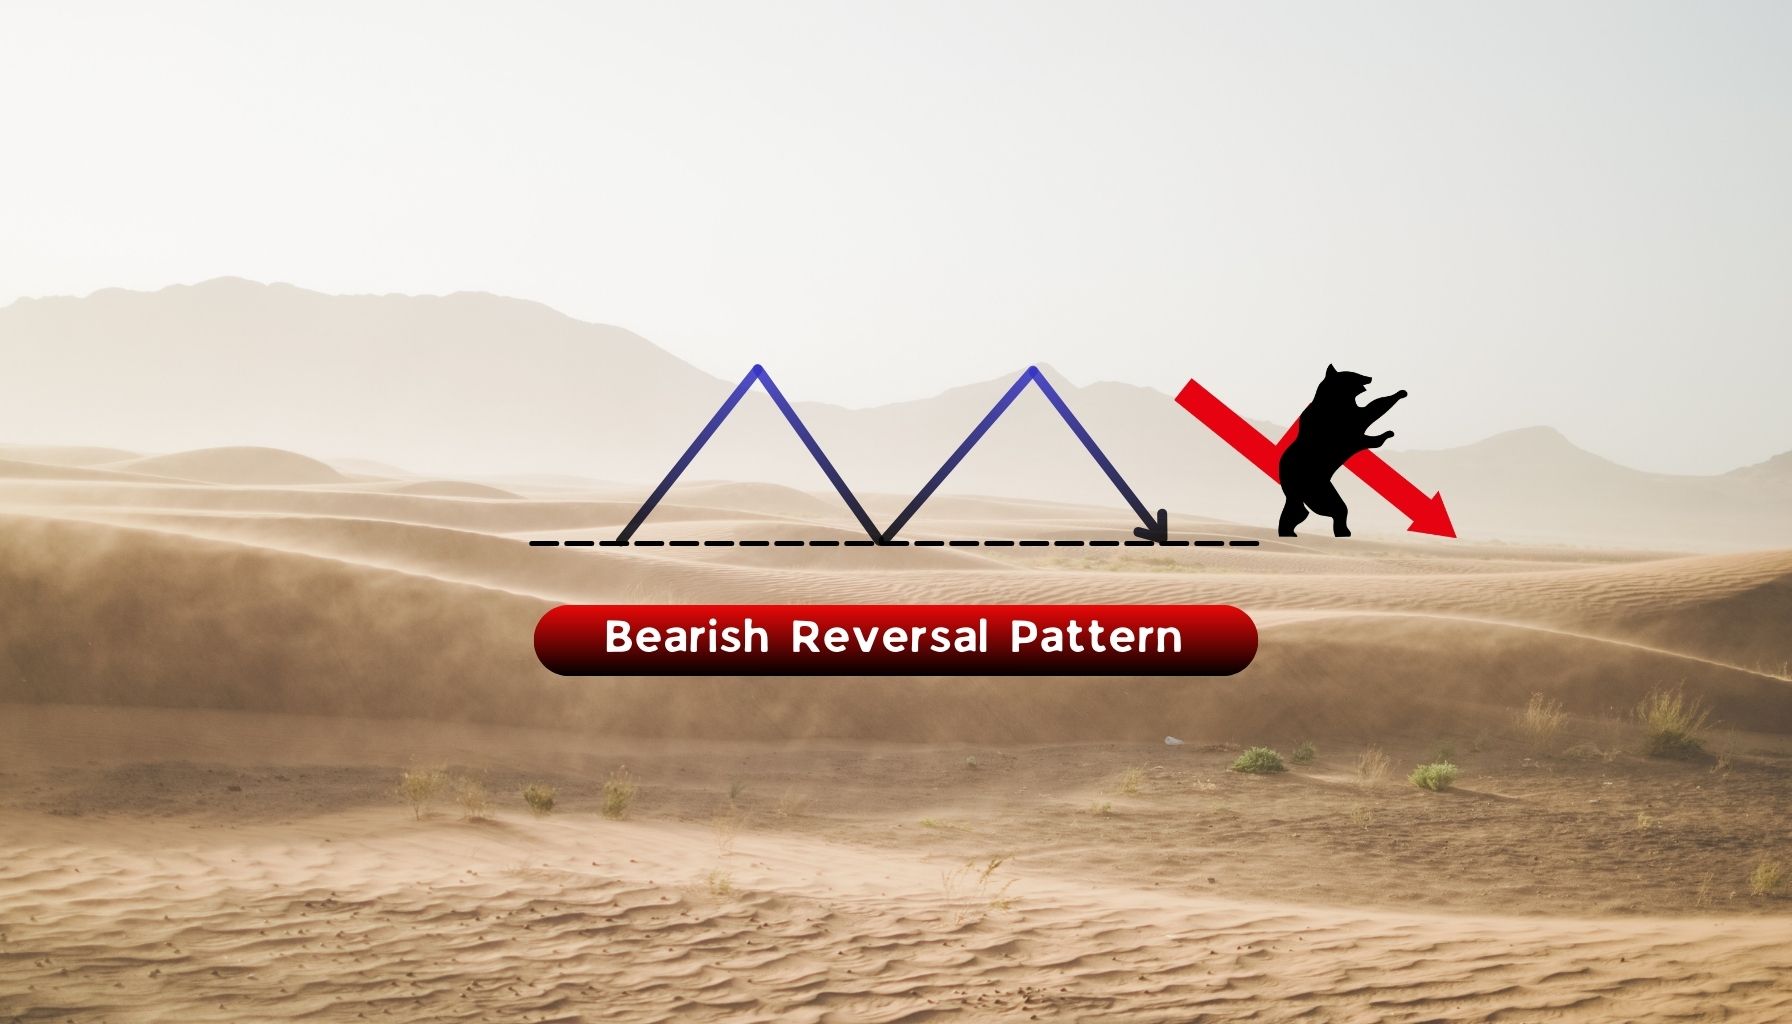
A double top is a technical analysis pattern used by traders to identify when markets are about to turn bearish. It is a bearish reversal pattern that signals a price collapse. It provides a short entry and a long exit signal simultaneously.
Double tops are versatile and can be found on any time frame. On higher time frames like 4H, daily, or weekly, the double top may indicate the start of a bear market.
| Quick tip: The double top is usually a bearish pattern, but when found on a Point & Figure chart, it is instead a bullish pattern. In this article, we’ll only be discussing the double top as a bearish pattern on line, bar, or Japanese candlestick charts. |
How to Identify a Double Top Formation on a Chart
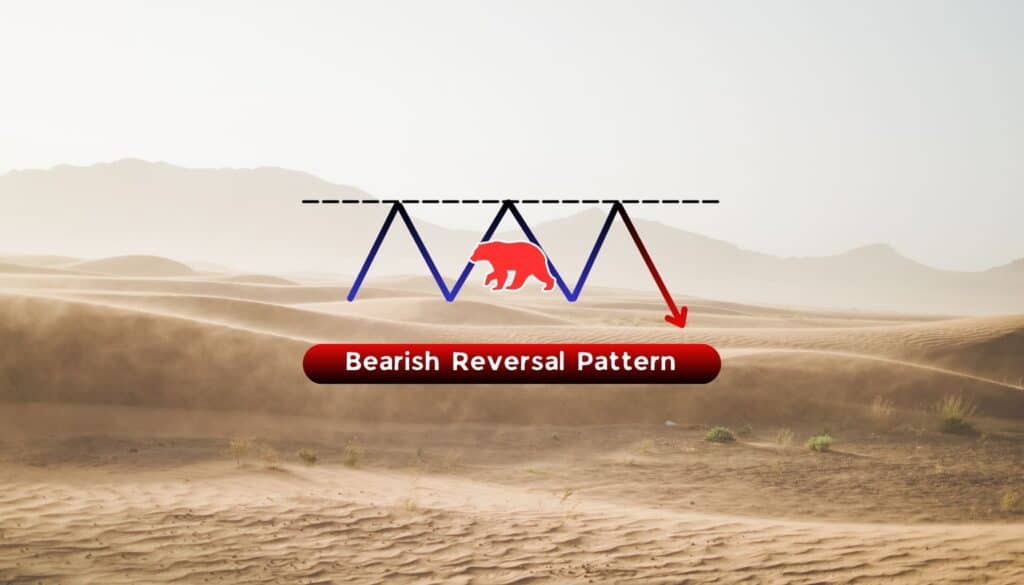
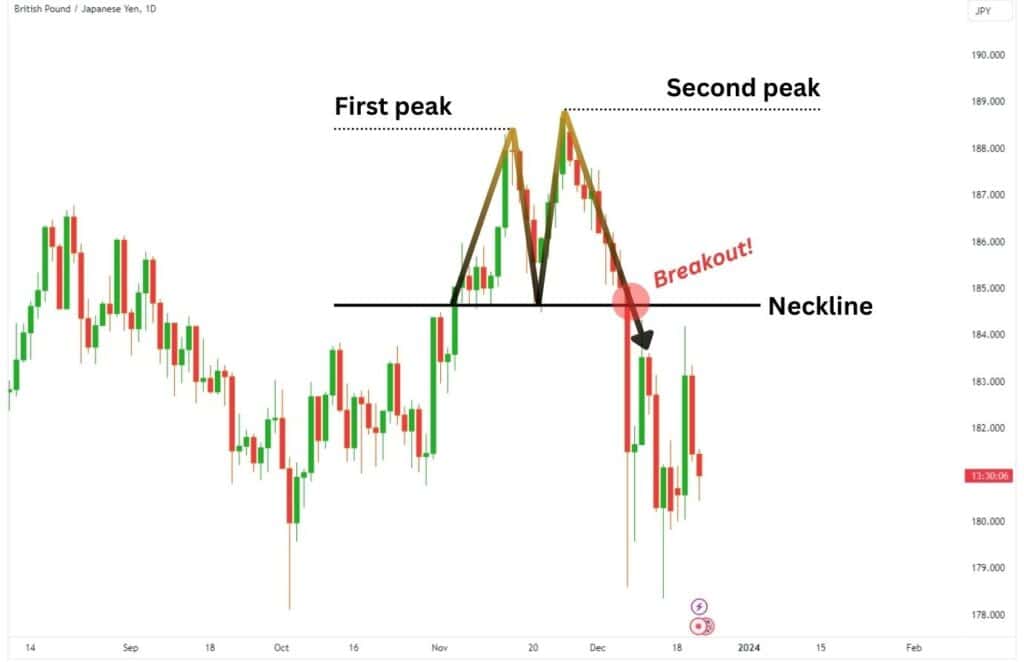
The double top appears as an “M” at the highs of a sustained uptrend. The price will move up and rejected at around the same area, forming two pivot points (peaks) at the highs.
To identify the double top, start by looking for the pattern at resistance levels. When the price rejects heavily from the first peak, the potential for a double top to form increases.
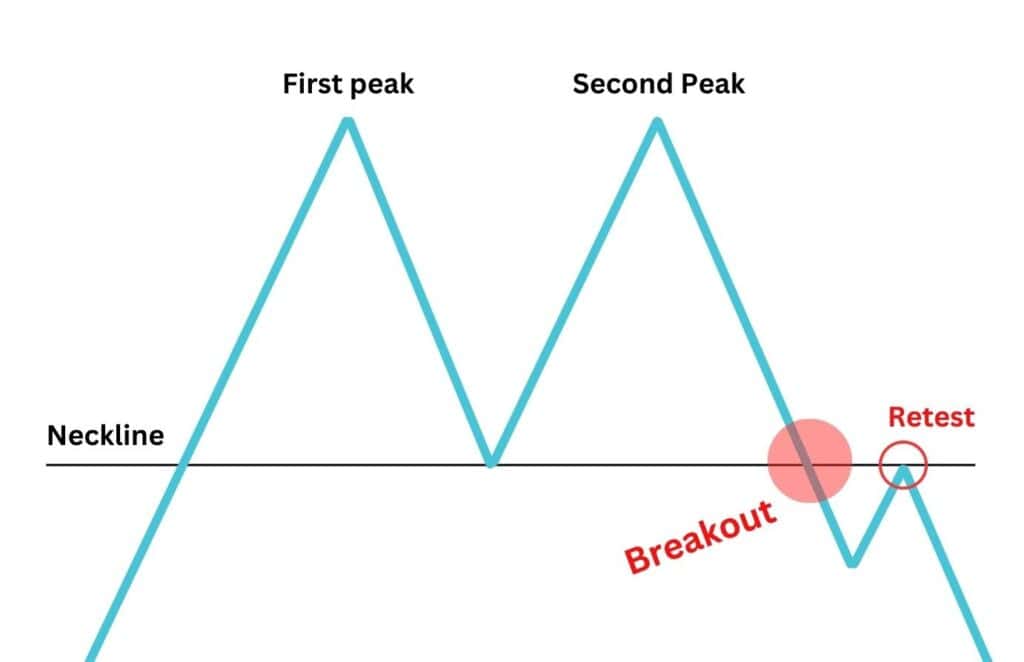
Take note of where the price pauses after the initial rejection: this will serve as the neckline of the pattern. Once the second peak forms, if the price revisits and breaks the neckline, the double top pattern is then confirmed.
Beyond that, there are three main types of double tops:
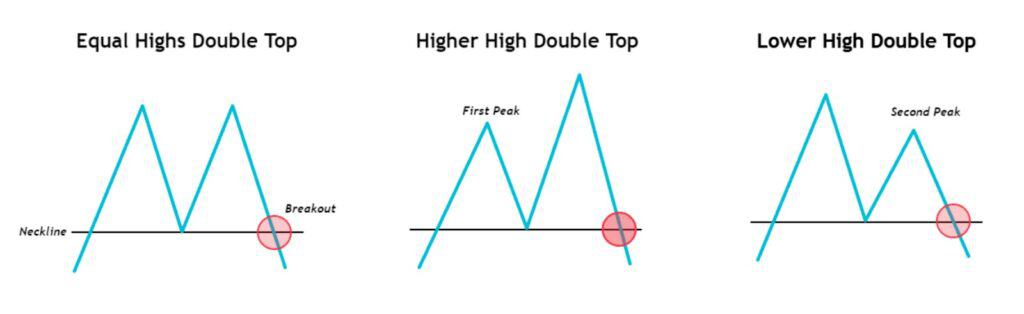
The Equal Highs, Classic Double Top
Equal highs double tops refers to the two peaks being incredibly close at similar heights. This will appear like a classic ‘M’ shape pattern.
The Unequal Highs Double Tops
The unequal highs double tops are ‘M’ patterns with forms with peaks at different highs. These unequal highs double tops are stronger reversal signals, as they often indicate a liquidity grab.
Key Components to a Double Top
| Asset is Trending Up: The asset you’re trading should be moving in a bullish trend, creating higher highs, and higher lows. |
| Identify the Two Peaks: Identify where the two peaks are in the double top. |
| Draw the Neckline: Find the horizontal which connects the lowest points in the pattern. |
| Confirm the Breakdown: Check if a candle successfully closes below the neckline. This confirms the pattern. |
| Use Other Indicators: Find bearish divergences with the RSI or other indicators to support the bearish bias of a double top. |
| Set Measured Move: The measured move predicts the price target after the pattern completes. For double top chart patterns, targets are typically the same distance from the peaks to the neckline. |
When to Trade a Double Top Pattern
So, now that you’ve learned to identify a double top pattern, when is the best time to trade it? Do we short-sell at the second peak? At the breakdown candle of the neckline? Or wait for a retest?
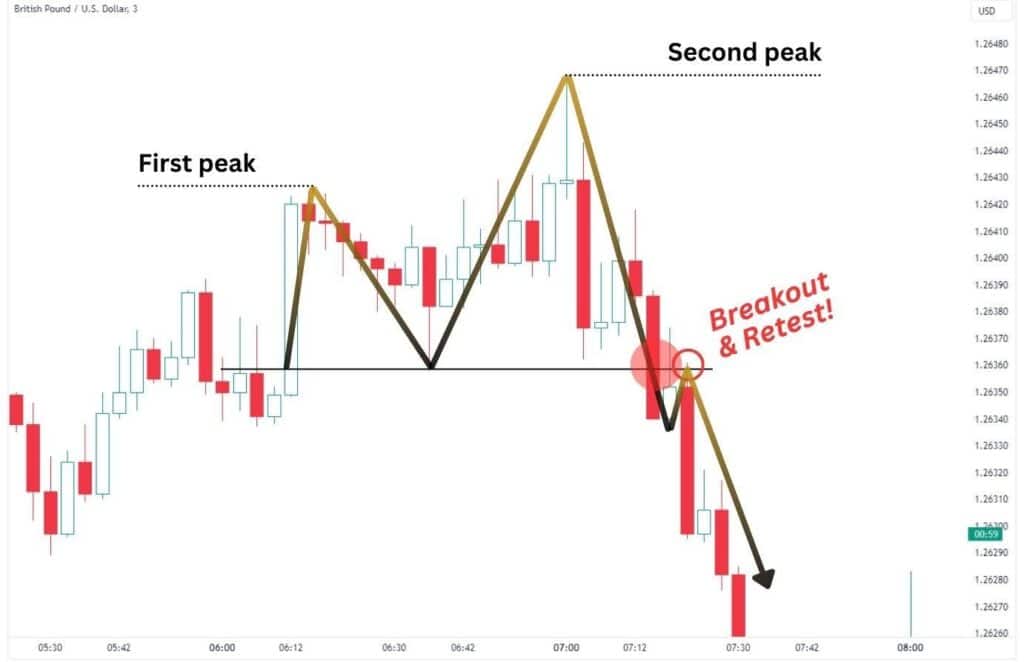
The safest approach is to wait for a confirmed breakdown of the ‘M’ formation, marked by a candle closing below the neckline. Then, initiate a short trade at the close of the candle, or wait for further confirmation on a retest of the neckline.
It’s very important to wait for the break of the neckline, because you are trading against the previous trend. The price could simply be consolidating before another trend higher.
Take a look at this example below from the GC1! chart (Gold Futures). A potential double top was forming, but the price eventually broke out upwards and continued the uptrend.

A double top is only valid when the price breaks and a candle closes below the neckline. By waiting for a confirmation of the pattern, you improve your chances of trading a double top successfully.
Remember, not every trade will be successful. You will find double tops which are confirmed, but the measured move target does not get reached. Understanding where to set additional take profits will be key to trading this pattern successfully.
To summarise, the optimal way to trade a double top is to wait for a confirmed breakdown, indicated by a candle closing below the neckline. After this, you can choose to enter the trade at the candle close or upon a retest of the neckline.
Double Top Pattern Example
Let’s look at several examples of a double top chart pattern you may spot in the markets. First, let’s look at the equal highs double top formation. This is a classic double top pattern that can be easy to spot and is identified characteristically by two peaks around the same area.
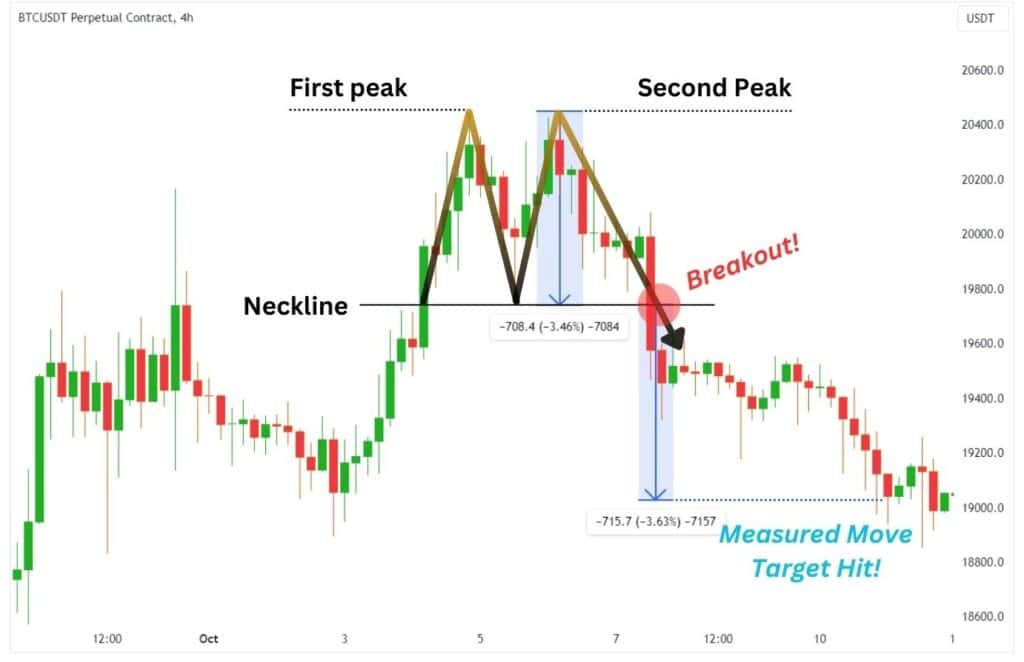
A great example would be this Bitcoin Futures chart (BTCUSDT) on the 4H timeframe. The first and second peaks are about equal in height topping at $20,448.40, and the neckline is located at $19,740.
If we take the distance from the peaks to the neckline, we can get what’s known as a measured move. The measured move is the expected distance that price would travel after breaking down from a double top’s neckline, which in this case moved 708.40 points, and played out perfectly.
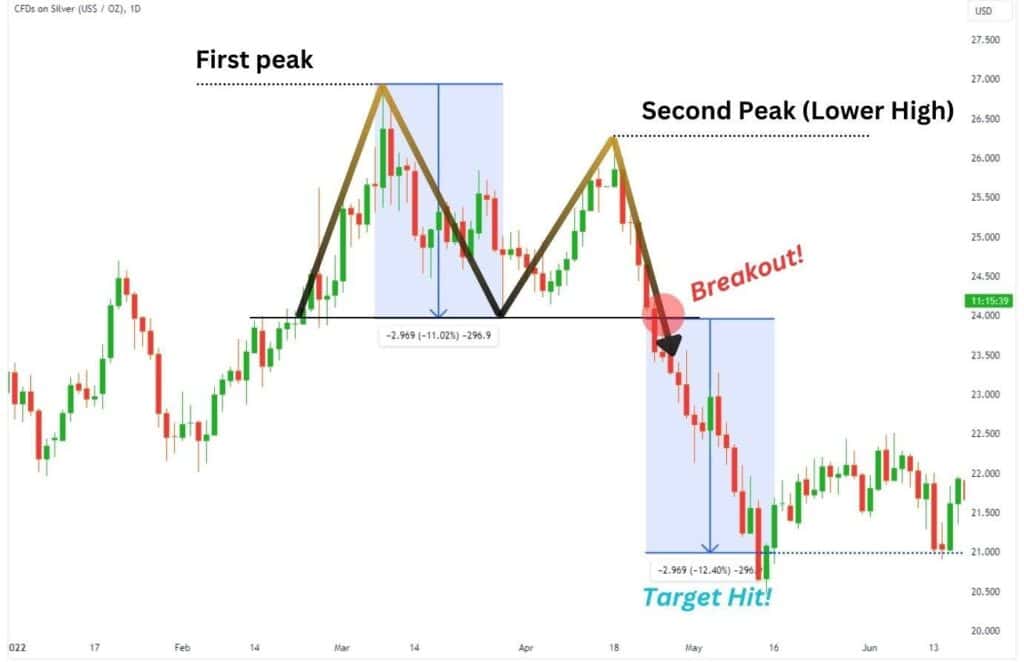
Next are the unequal highs double top formations. These patterns will see the second peak of the pattern falling short or slightly exceeding the first peak. Below, we see how the second peak in Silver Futures from 2022 fell short of the first peak.
Now let’s look at some examples of failed double top formations. This will help you understand why it is so important to only trade the double top on a breakdown confirmation.
From August to October 2023, CME was carving a potential double top pattern. Here we see a confirmed uptrend, and a classic formation of the equal highs double top. However, as there was no successful candle close below the neckline, and the price managed to break above the peaks, this would be considered an invalidated double top.
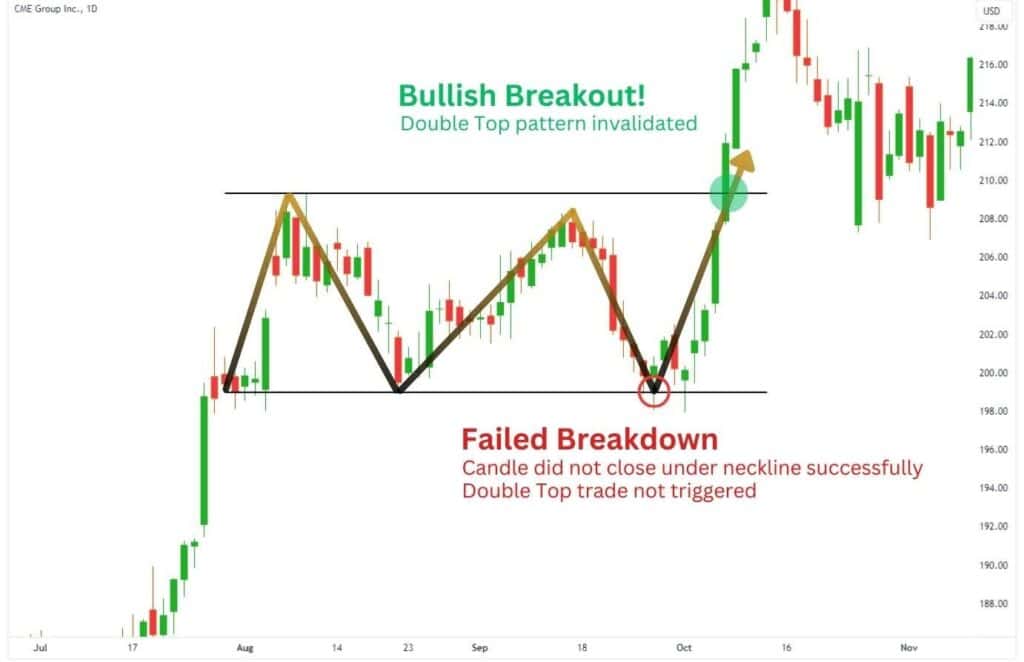
The pattern was invalid because there was no candle close below the neckline. Therefore, no trade was triggered.
What Indicator Works Best with Double Top
Double top patterns are best traded with a horizontal resistance, trend line, or momentum indicators. These TA tools will help you avoid false signals and help you time a better entry.
RSI Divergence: A bearish divergence occurs when the price forms a higher high, but the RSI forms a lower high. This indicates the buying momentum is slowing down, and that the uptrend cannot be sustained. The RSI can also identify when an asset is overbought, hinting at the end of a trend.
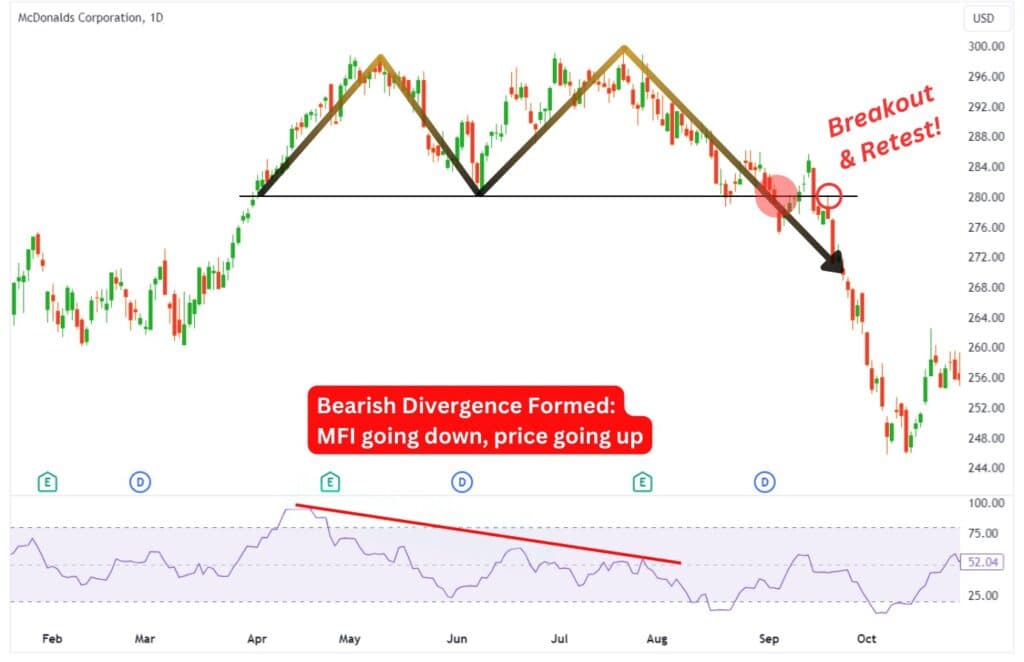
MFI: MFI stands for Money Flow Index, and represents the amount of money entering an asset. If money flow is moving lower, this indicates weakening buying power and potentially a trend reversal.
Used alongside double top patterns, the MFI can increase your confidence in price breaking down and provide you with a short trade opportunity.
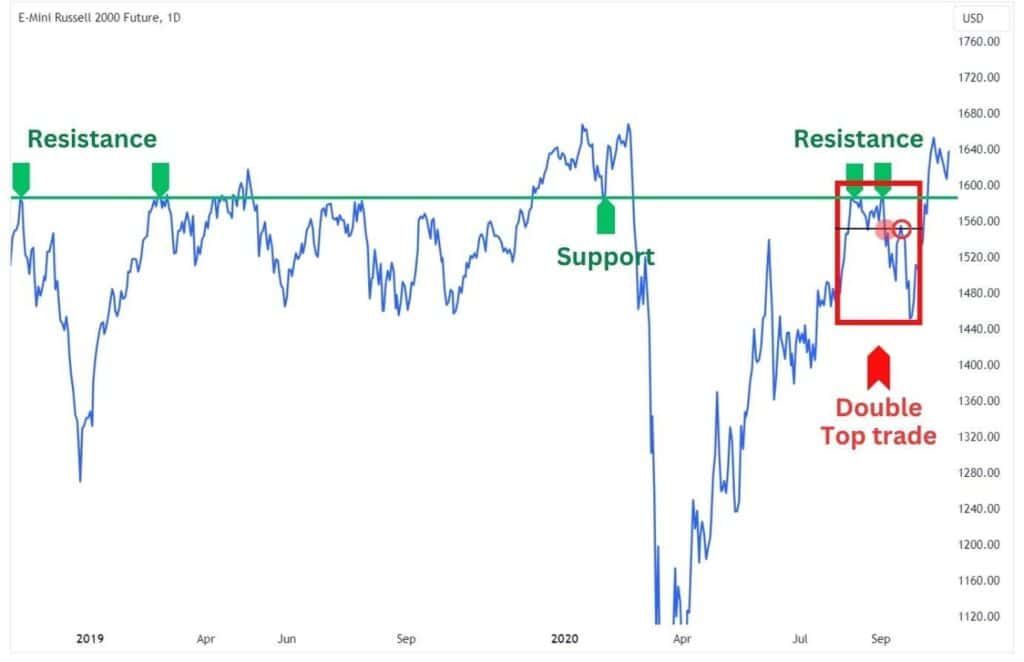
Resistance Levels: If the peaks are forming at a previously established and significant level of resistance, the probability of a double-top chart pattern forming increases.
Advantages of Trading a Double Top Pattern
The double top is a popular pattern technical traders follow. Here are some of the big advantages offered when trading this pattern:
- Available on any asset, any timeframe
- Easy to spot as it is shaped similarly to the letter “M”
- Excellent signals when paired with indicators to find huge market shifts
Disadvantages of Trading a Double Top Pattern
Every pattern has its flaws including the double top pattern. Here are a couple of disadvantages you need to be aware of:
- Potential for false signals if you are impatient and make an early short entry
- Delayed confirmation as the bulk of the new downtrend has already printed before a trader would enter short
- Can provide a low risk-to-reward ratio if you use a conventional stop loss
| Advantages | Disadvantages |
| Available on any asset, any time frame | Can be confused for other patterns as it is forming |
| Potential for big returns | Potential for false breakdowns |
| Fantastic when paired with indicators to find huge market shifts | Can provide a low risk-to-reward ratio if you use a conventional stop loss |
What The Double Top Pattern Tells Us
A double top pattern indicates that buyers are exhausted – slowing down on the buying, or sellers are simply too strong for the price to get beyond a certain point.

Imagine this, you’re pushing a rock up a hill. As you near the mountain top, your arms give out and you tumble down the hill. You regather your strength and try again.
Naturally, you’re more exhausted than before. As you push towards the peak of the hill, you come crashing down once again. This is basically what the double top is depicting – exhausting buyers who have failed to push the price higher.
Where To Take Profit For The Double Top Formation?
The conventional take profit target of the double top pattern is based on a ‘measured move’. A measured move is equal to the distance from the peak to the neckline.
Simply measure the distance between the highest peak and the neckline, and place the measured move below your neckline to find your ultimate take profit target.
Despite that measured move calculation, it is important to also identify support levels above the measured move target. As a standard risk management practice, it’s a good idea to set take profit orders at support levels before the measured move target.
Sure, your overall profits will decrease, but this ensures you earn a little bit of profit in case the trade does not follow all of the way to the measured move.
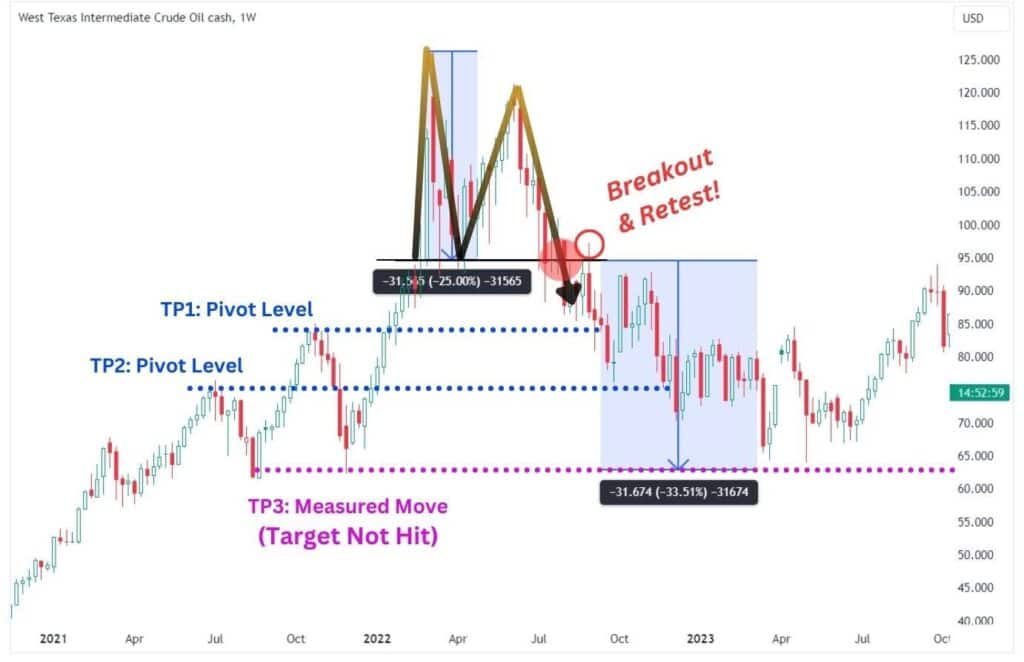
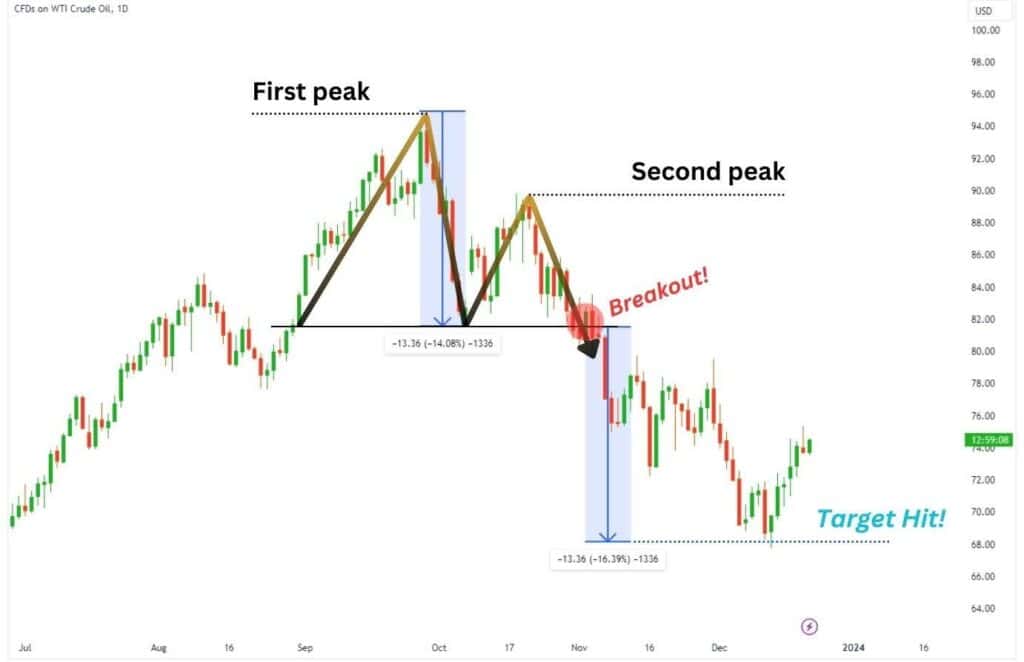
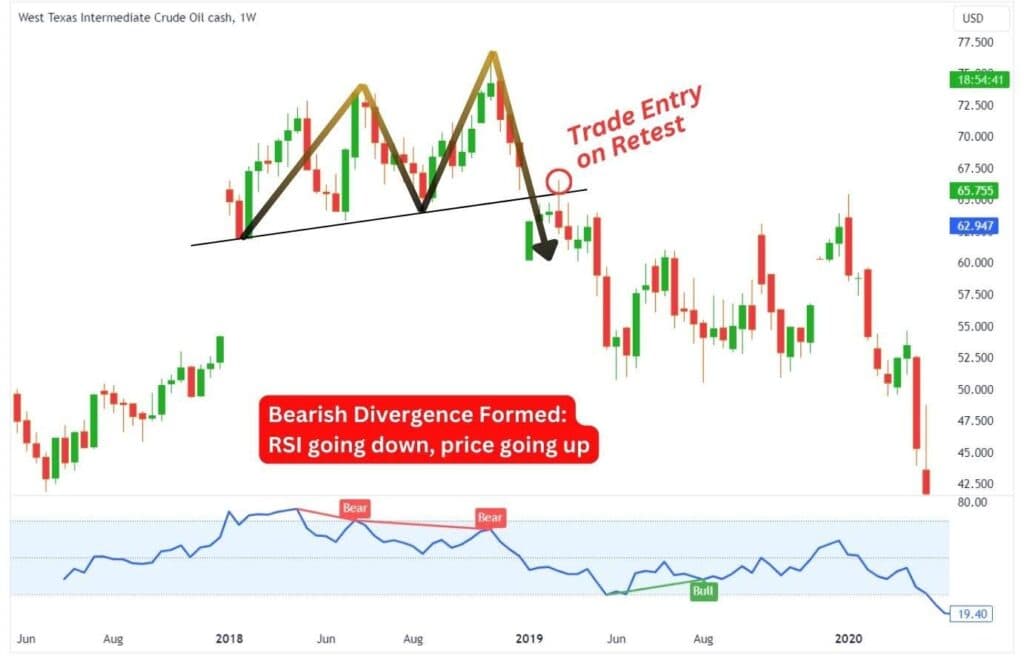
Here we see the WTI Crude Oil chart on the 1-week timeframe in 2022. After creating an M formation, WTI successfully breached its two previous highs (TP1 and TP2) but has not reached its measured move target.
However, if WTI reverses higher, the trade is still profitable because profit levels were set at support levels where the price could reverse.
Protecting your trade with a Stop-Loss Placement
Generic advice you hear when trading double tops is to set your stop loss (SL) above the entire pattern. However, your risk-to-reward ratio will be compromised as it will always be less than 1. Successful traders tend to take trades with better than a 1-to-1 risk-to-reward ratio so they do not have to be profitable on each individual trade.
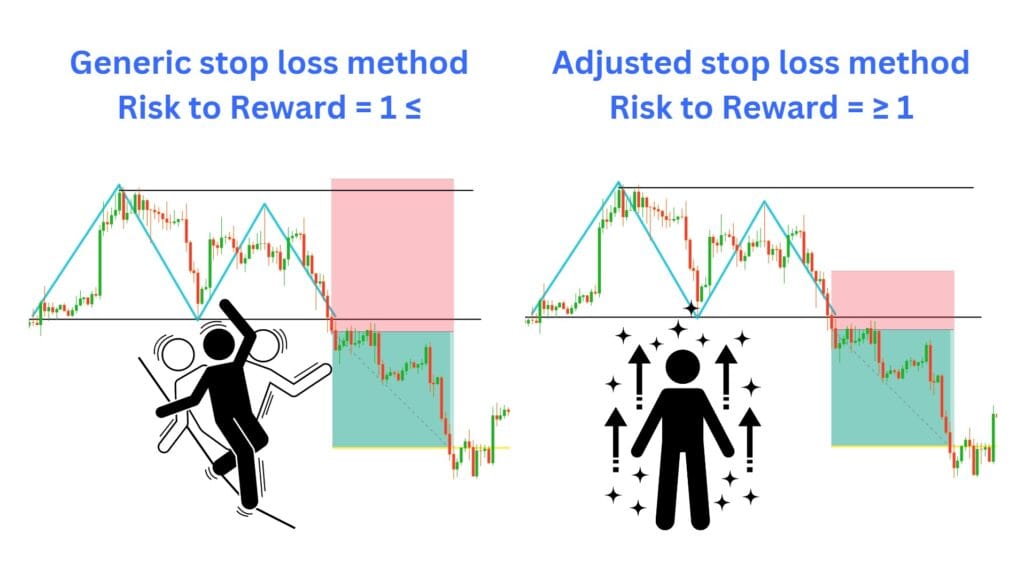
Fortunately, there are alternative methods for setting your stop loss which will adjust your risk-to-reward ratio to 1 or above. Here are some suggestions:
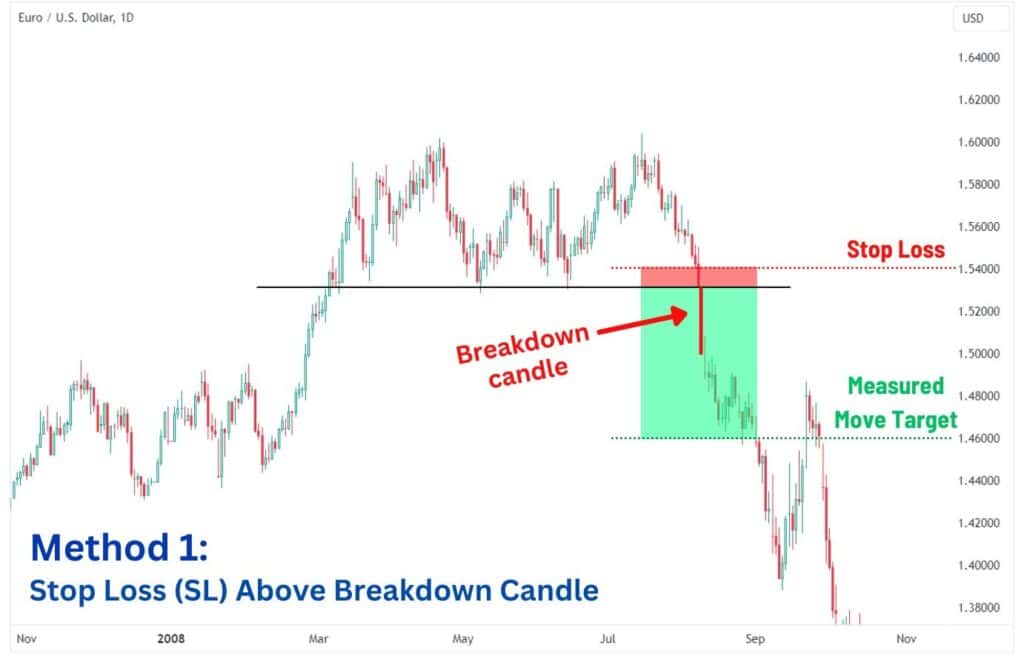
Set stop loss above the breakdown candle: This method allows you to have a fantastic risk-to-reward ratio in your trade, but risks being stopped out in the event of a deep retest of the neckline.
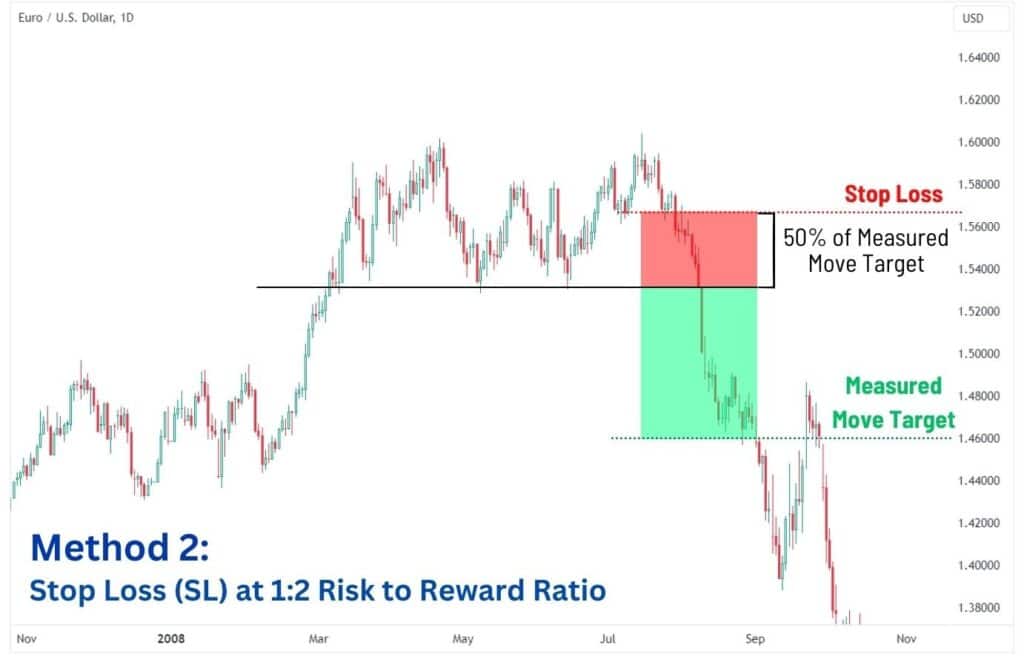
Adjust the stop loss to a 1:2 ratio: This method ensures that your target is set at twice the amount you’d lose, and strikes a balance between having good returns and lower risk of being stopped out. The target risk-to-reward ratio is flexible so long as you keep it better than one-to-one. This means you can adjust the stop loss to fit ratios such as 1-to-1.5 or even 1-to-3 risk-to-reward ratio to test which one works best for the asset you are trading.
With that being said, there is no right or wrong method to set your stop loss. It’s up to you to test and decide which stop loss to employ, as the win rate can vary depending on the asset you’re trading.
Common Mistakes When Trading Double Tops
When you trade double tops, it’s important to wait for the pattern’s confirmation. Rushing into a short trade is extremely dangerous during an uptrend as you are trading against the trend.
So many traders rush into a trade when they anticipate a double top to form, but then the chart pattern does not complete and the price continues its uptrend instead.
To call back to a previous example shown in this article, take a look at this CME 1D trade. Now, you could try to short the neckline or even the second top. However, you would have lost this trade. This is because you did not wait for a confirmation signal of the candle closing below the neckline.
Here are the common mistakes to avoid when trading double tops:
| Front running the neckline: The pattern is developing well and traders like to anticipate the break of the neckline. However, without the price breaking and the candle closing below the neckline, the price is at higher risk of invalidating the pattern. |
| Guessing where the second peak will top out: Shorting at the first peak’s high in anticipation of a second peak leads to inconsistent results. |
| Not looking for confluences: A double top that shapes without other resistance in the area is prone to a higher risk of failure. If resistance is absent, look for a bearish divergence to form to better support the idea of price exhaustion. |
| Not looking left: When examining a potential double top pattern, it’s important to look left on the chart to look for significant support and resistance levels. For example, one must proceed with caution if the neckline is directly aligned with a yearly support level, as there is a high likelihood that the price would be supported instead. |
FAQs
Is a double top pattern bullish?
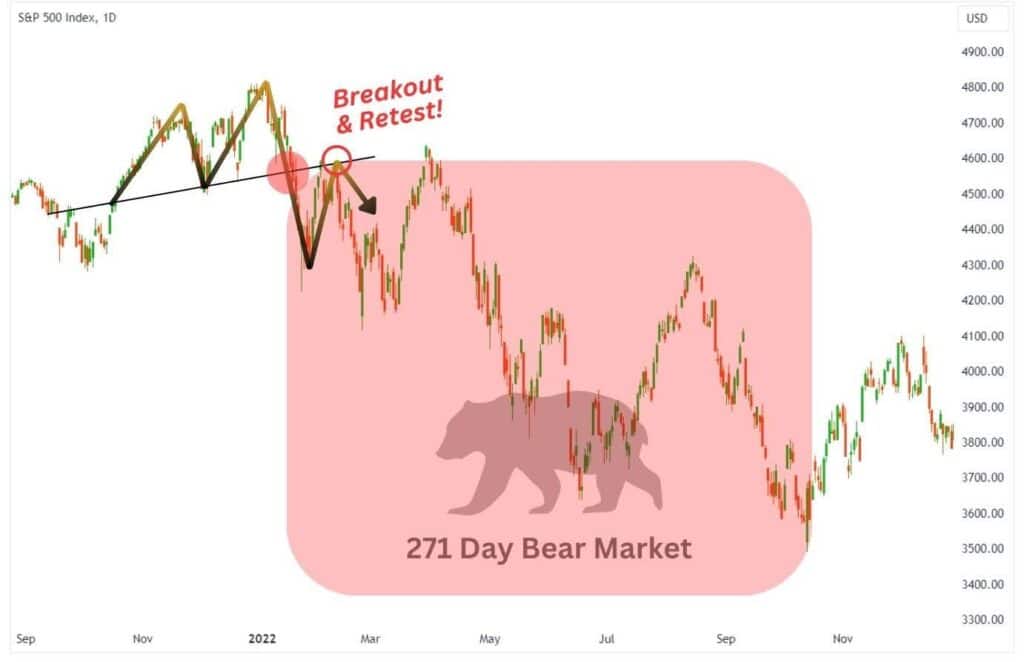
A double top pattern is not a bullish pattern when spotted on a candlestick, line, or bar chart, but it is bullish when spotted on a point-and-figure chart. On a candlestick chart, the double top indicates an uptrend is exhausted and there is potential for a trend reversal. If spotted on a higher time frame like the daily or weekly timeframe, a double top can be a powerful signal of an impending bear market.
Just look at what happened to the S&P 500 back in January 2022. After forming a double top pattern, the S&P 500 went into a bear market lasting 271 days and dropped 25%!
Double Top vs. Double Bottom Chart Patterns
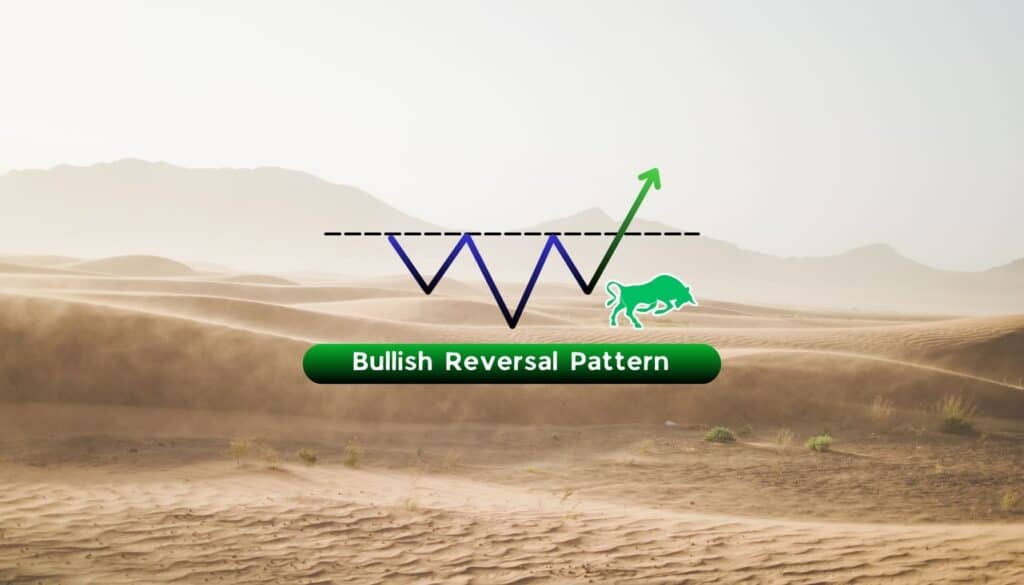
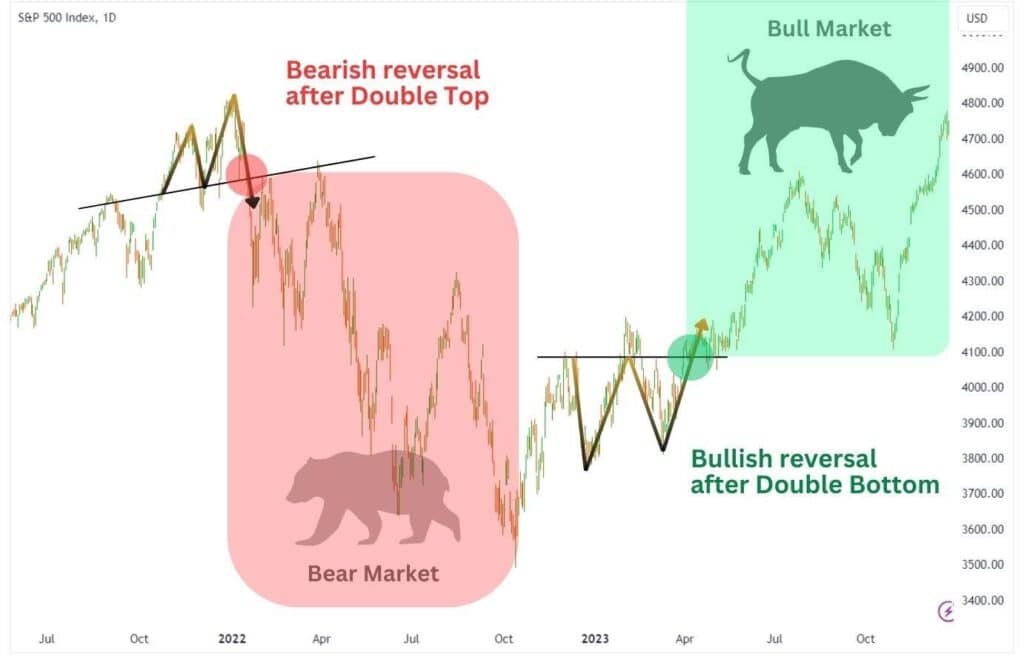
Double tops and double bottoms are formations that signal a potential trend reversal. They are direct opposites, in that a double top looks like an ‘M’ and indicates a bearish trend reversal, while a double bottom looks like a ‘W’ and indicates a bullish trend reversal.
In 2022, the S&P 500 entered a bear market for 271 days after a double top formation, then in 2023, a double bottom formation was created and now the S&P 500 is potentially entering a bull market!
When observed on higher chart time frames like on the 1D or 1W charts, both patterns tell a compelling story of an imminent reversal which can last for months.
By incorporating these chart patterns into your market analysis, you gain extra insights on whether you should be optimistic or fearful about your investments. It’s no wonder that double tops and double bottoms are both favourites used by traders all over the world.
What factors contribute to the reliability of the double top pattern?
The double top pattern works best when the right peak barely breaks the left peak causing bullish traders to get trapped into the bull trend. While prices reverse and trend lower from the second peak, those bullish traders are caught long and therefore need to sell to minimize their losses. The sellers overwhelm the buyers and pricing keeps readjusting lower to confirm the pattern.