Reviewed by:
Bearish
- June 16, 2024
- 13 min read
Bearish Flag Pattern – Comprehensive Guide for Traders
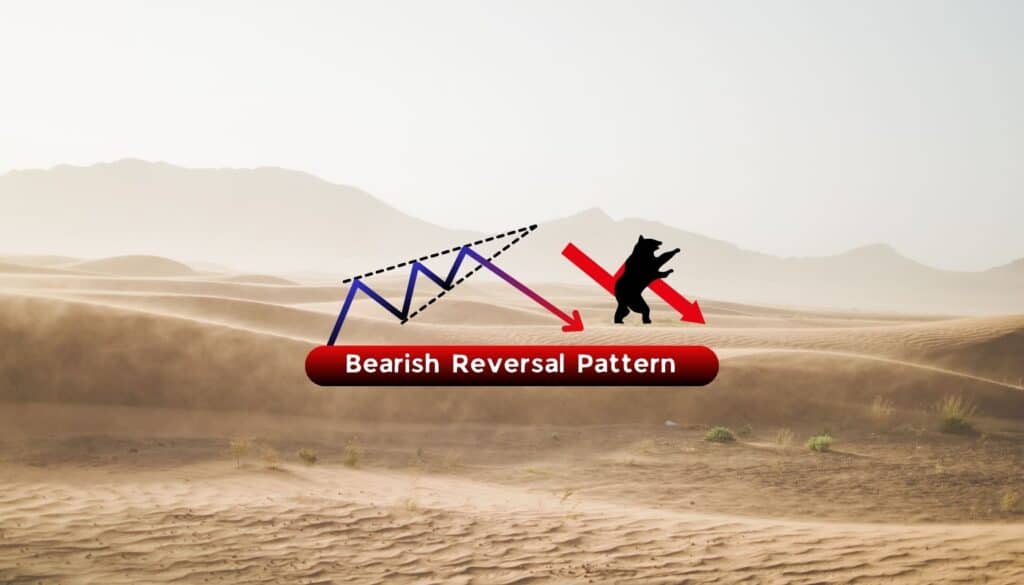
The bearish flag pattern is a popular chart formation used in technical analysis to forecast a decline in asset prices. This article discusses how to identify this pattern, its key features, and strategies for trading effectively when the financial markets show indications of a bearish trend.
What is a Bearish Flag Pattern
A bear flag pattern signals when the price is experiencing a corrective bounce and is likely to decline further. This pattern typically emerges during a major downtrend and consists of distinct cycles; strong downtrend and consolidation.
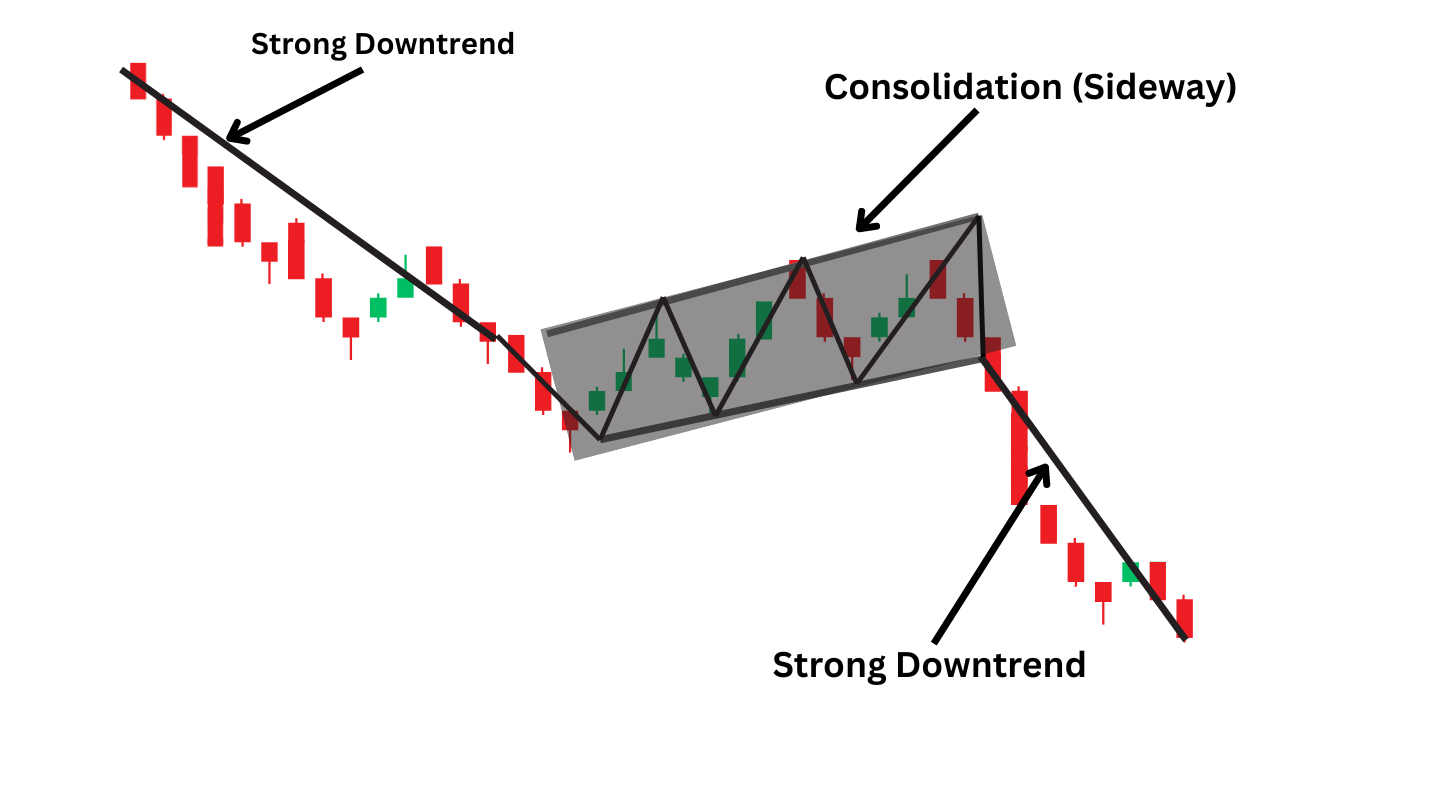
It begins with a significant price drop due to the strong selling pressure. This steep fall demonstrates the overwhelming control of sellers over buyers where prices are being pushed lower quickly.
Following the sharp decline, prices undergo a cooling period without any major movements. They begin to consolidate and edge higher, representing a sense of indecision among traders. Traders may take profits following the rapid drop while others might wait for a potential reversal. However, this phase is generally short-lived, with the rally proving temporary as the trend returns to its downward trajectory.
A breakout below the lower boundary of the consolidation period marks the completion of this pattern. This is often confirmed by an increase in trading volume indicating that the downward trend is likely to continue.
How to Spot a Bearish Flag
Recognizing a bear flag chart pattern involves understanding that its formation applies to all time frames and assets. Each phase of this pattern has distinct characteristics, which traders can identify on candlestick charts.
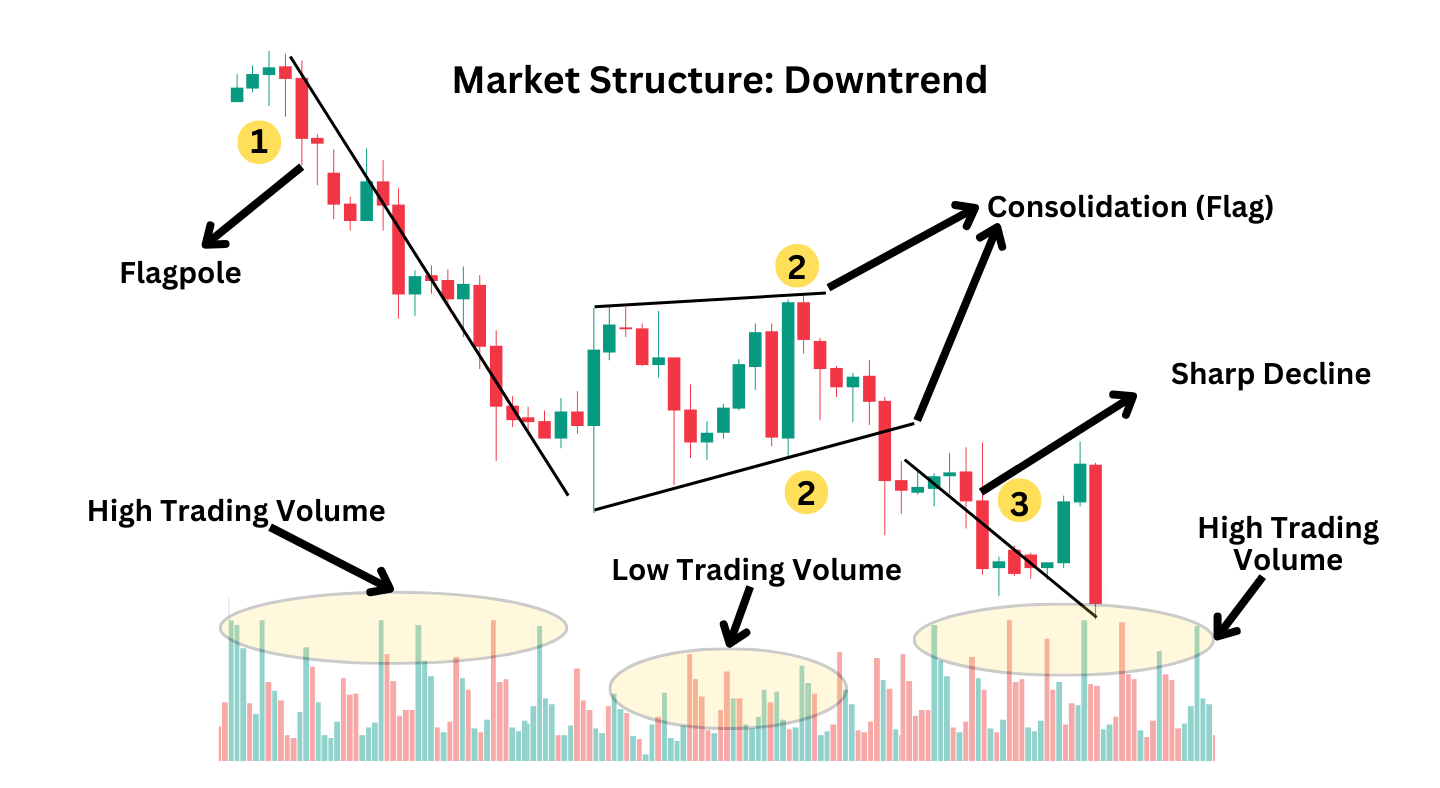
Phase One: This phase of the bear flag pattern is a clear display of a downtrend marked by a significant drop in prices. This sharp decline is identified as the ‘flagpole’, a visual representation of sellers taking control of the market. Trading volume generally spikes during this phase as a confirmation of the preceding downtrend.
Phase Two: Following the “flagpole”, the market enters a consolidation phase known as the “flag”. This is where prices start to reverse and move upwards in a channel-like shape within a relatively narrow range. Trading volume might start strong but generally decreases during the flag formation reflecting a temporary slowdown and indecision in the market.
Phase Three: The last phase of the pattern is the breakout. Prices drop below the lower boundary of the consolidation range, resuming the initial downtrend. This phase often sees an increase in trading volume, confirming the bearish trend resurgence with the sellers returning in the absence of buyers.
When to Trade Bear Flag Pattern
A bear flag pattern thrives in a market experiencing a sharp downward trend, typically emerging from sudden news or shifts in sentiment that cause strong sell-offs. Buyers are forced to retreat as the intense selling pressure signals a continuation of the downtrend.
A bear flag pattern emerging amid a ‘risk-off’ environment often signals a deepening downtrend. Global economic uncertainties prompt investors away from riskier assets like stocks or commodities, leading to sudden price drops in these markets and creating conditions conducive to developing bear flag price patterns.
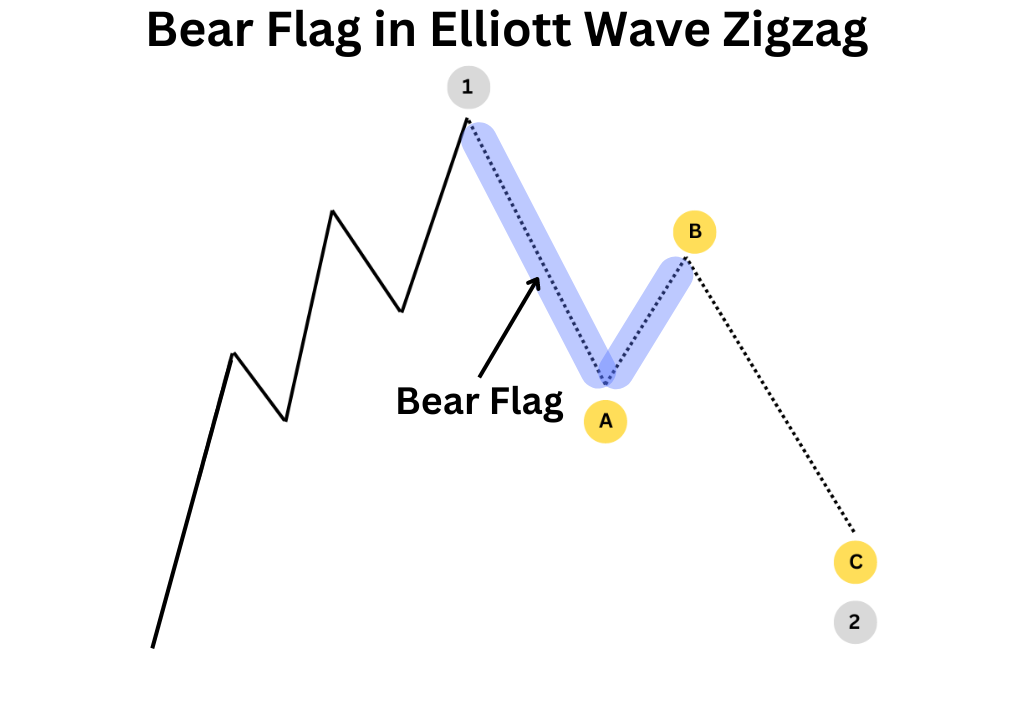
From an Elliott Wave perspective, a bear flag pattern can resemble a declining zigzag. The flag may be present when anticipating a Wave 2 correction in a larger pattern or Wave A of an Elliott wave triangle.
For example, after a strong Wave 1 rally, a bearish flag would represent waves A & B of the A-B-C zigzag. The breakdown of price in a successful bearish flag pattern would represent wave C of the zigzag aligning with the larger Wave 2.
Bearish Flag Pattern Example
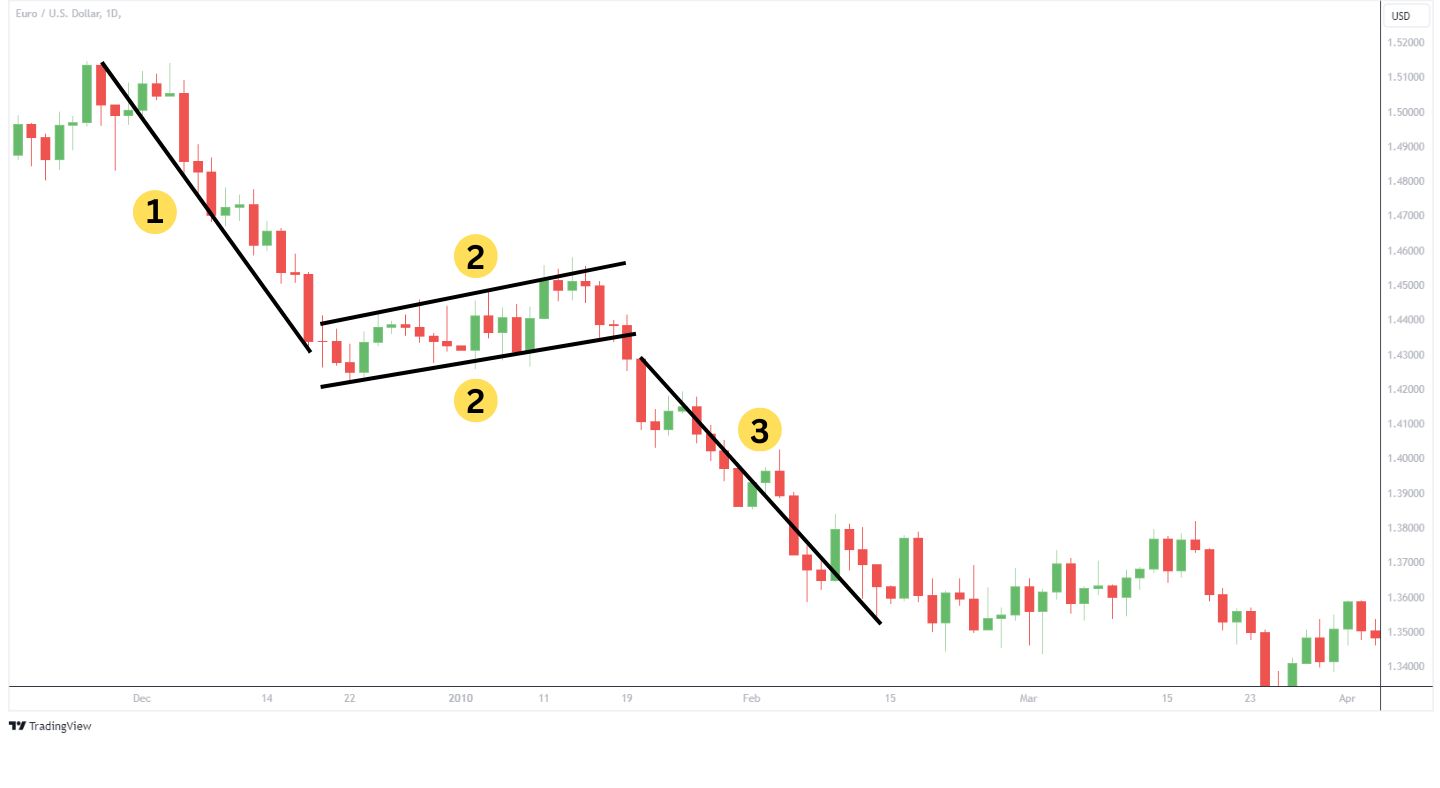
The above is a daily chart of EURUSD, that shows clear formation of the bear flag. After a sharp decline in phase 1, EURUSD channeled higher in a shallow rally for phase 2. Notice how the support of the flag was broken by a bearish candle that closed below. That signals a strong bearish sentiment that drove the price even lower in phase 3.
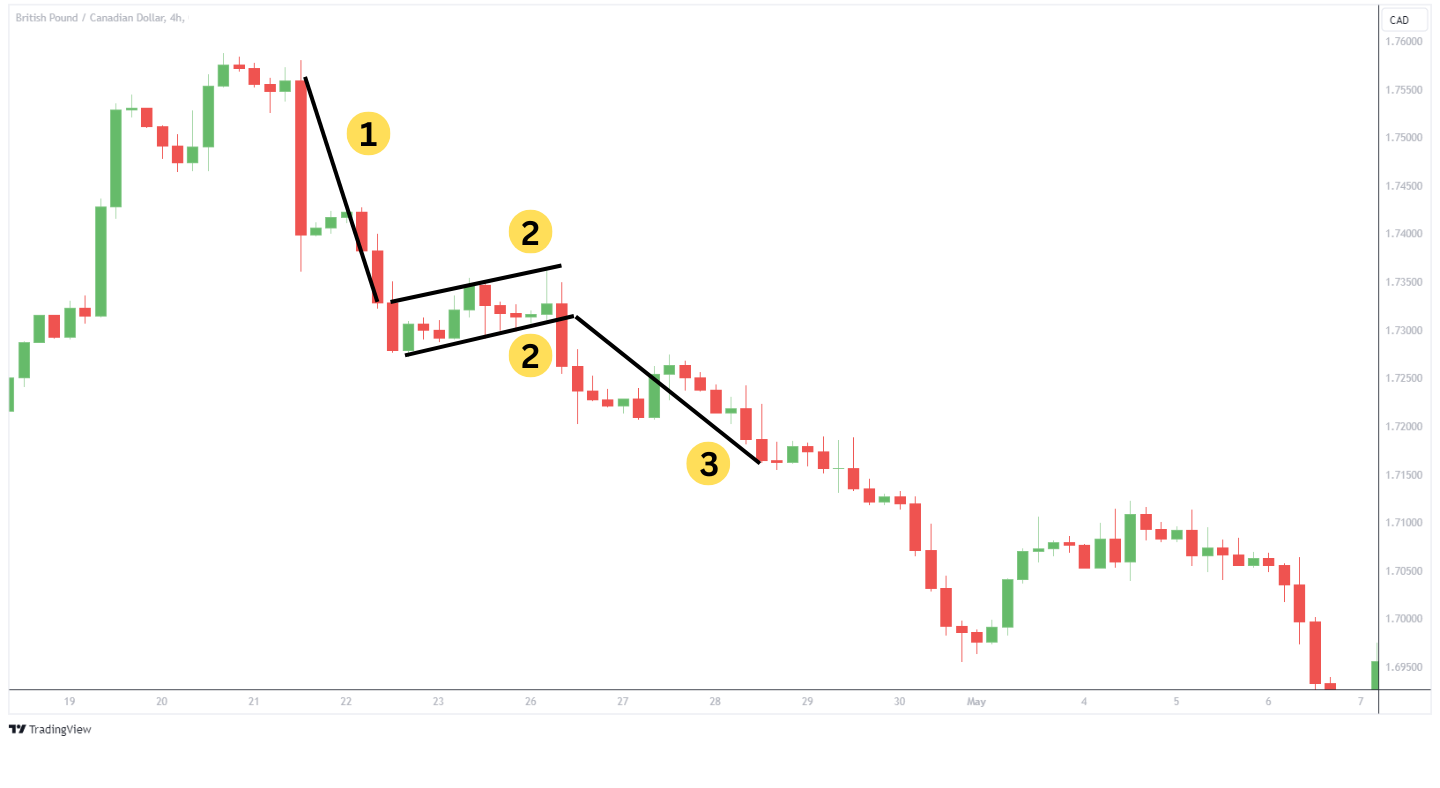
A bear flag pattern can emerge on any asset and time frame. Above, we see the GBPCAD 4-hour chart carving a bearish continuation pattern. The price rallied in a channel pattern to consolidate the previous losses. This was where the price tried to recover but there simply were not enough buyers to make meaningful headway. The rally lost and the sellers once again drove the price lower in phase 3.
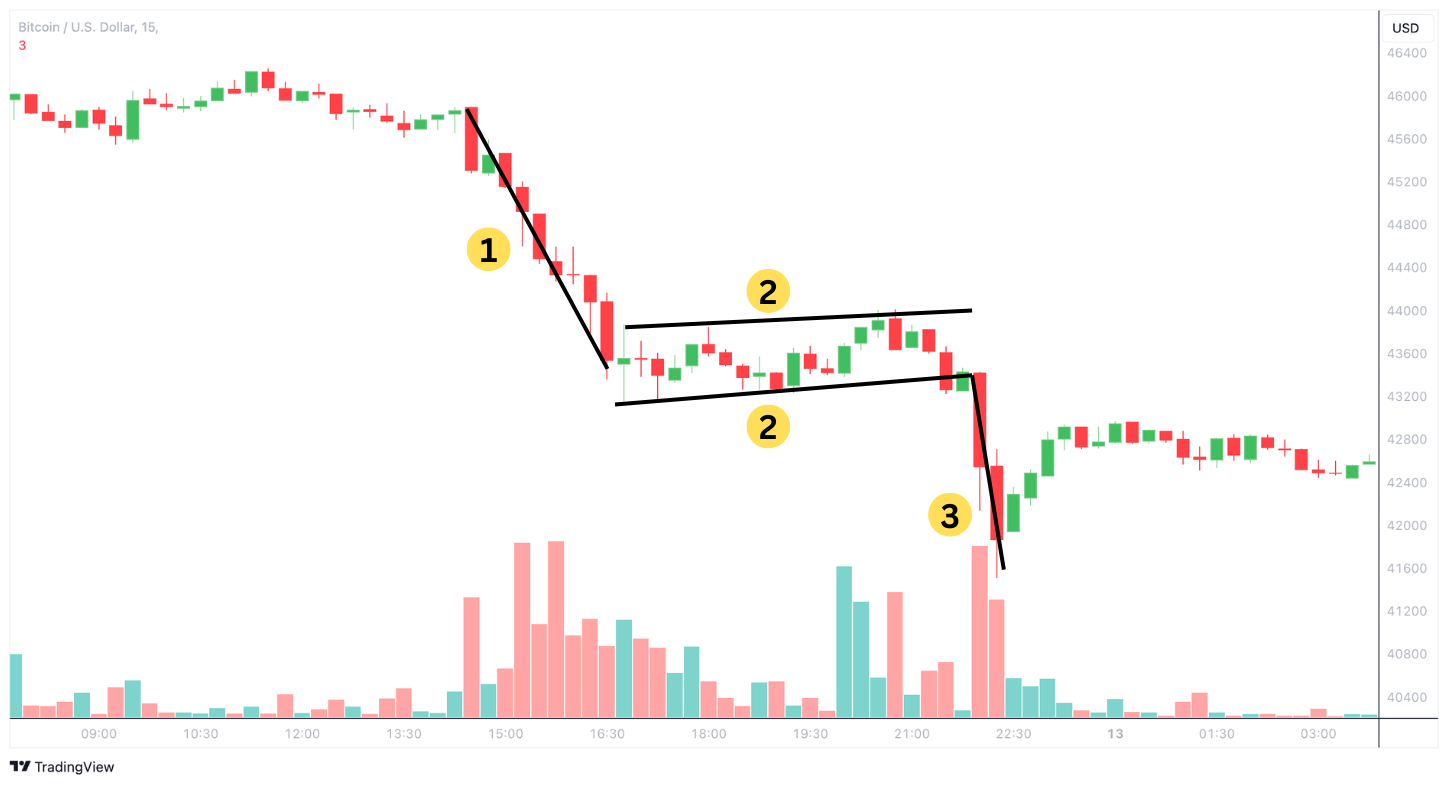
The 15-minute Bitcoin chart above shows the price making a retest after breaking below the flag support. A strong bearish candle formed right after the retest to drive the prices lower. Notice how volume was strong during the phase 1 flagpole, weakened during the phase 2 flag, and then increased again during the phase 3 decline.
Bear Flag Strategies
Several bear flag trading strategies have been commonly practised. Below, we will review two of the easier strategies to implement.
Breakout Below Flag Support Strategy
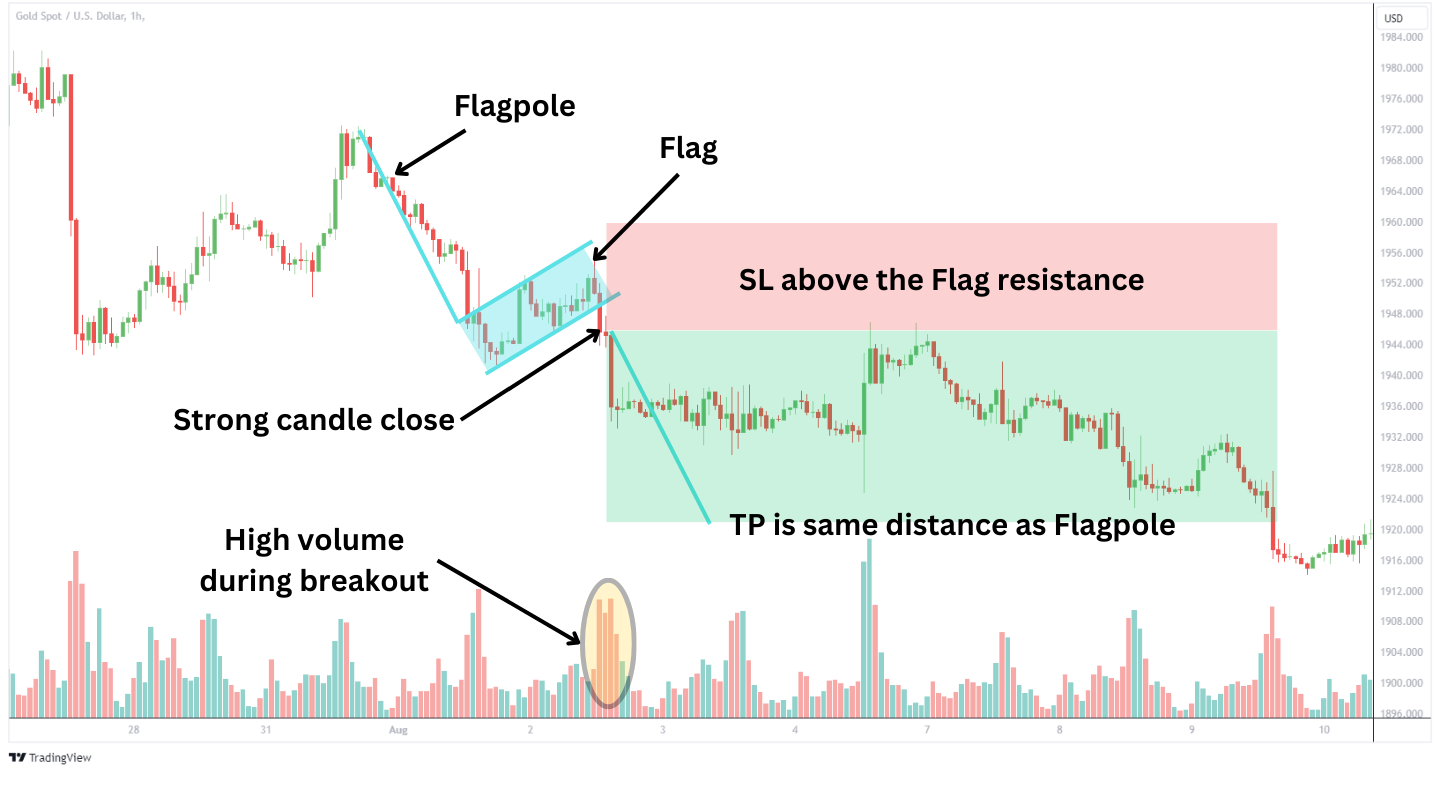
Above, is a 1-hour price chart for gold. As the flag develops, an upward-sloping support trend line at the bottom of the flag will take shape. Wait for the price to break below the flag’s support trendline. This breakout should include a closing candle below the support line, ideally with increased trading volume. This combination of price action and volume serves as a green light, indicating the sellers are taking over and they’re trying to push the price further down.
Placing a stop-loss just above the flag’s resistance or the most recent high within the flag limits potential risks. It acts as a safety net to manage risk effectively against an unexpected reversal.
The take-profit level is the length of the flagpole extended downward from the breakout point. This method helps in achieving a balanced risk-reward ratio of around 1:2, ensuring the potential gain justifies the risk.
Retest of Broken Support Strategy

The 1-hour AUDUSD chart above effectively illustrates the Retest of Broken Support Strategy. This strategy starts when the support trendline is broken and the price retests the level which now serves as resistance. This resistance level is capable of pushing the prices further below.
The pair undergoes bearish rejection at the retested level indicating the market’s inability to reverse the preceding trend. Traders may execute a trade once the price retests the resistance level. To protect against the possibility of price heading the opposite direction, set the stop-loss just above the flag resistance level or the highest point of the pullback.
To set the take-profit target, measure the initial flagpole’s distance and extend it from where the price retests the resistance. Using a 1:2 risk-reward ratio can provide a reasonable estimate of the price target.
Advantages of a Bearish Flag Pattern
The bearish flag candlestick pattern offers several advantages for traders such as:
| Entry and Exit Points | The bear flag pattern offers clear and easily identifiable entry and exit points. The breakout point below the flag is a precise entry signal for traders. At the same time, the projected downward length of the flagpole provides a straightforward method for determining take-profit levels. |
| Short Trade Duration | Bear flag pattern typically retraces less than 38%, ideally staying below 50% of the pole. This limited retracement helps illustrate the overall weakness in the market as it simply does not have the energy to rally higher. As a result, when the sellers re-emerge, the price moves swiftly to the downside and can reach measured targets quickly. |
| Easy Identification | Traders can spot bear flags conveniently due to the pattern’s distinctive feature, a long and visible flagpole, followed by an upward corrective parallel price channel for the flag. |
Disadvantages of a Bearish Flag Pattern
As with any chart pattern, they are not foolproof. Here are some disadvantages of the bear flag pattern:
| Unreliable Volume Data | Markets like crypto and forex often lack reliable volume data which can be used to confirm the pattern. Traders must then evaluate the pattern’s strength without this indicator which may complicate the analysis. |
| Deep Retracements | The pattern risks losing its reliability if the flag retraces more than 50% of the flagpole. Traders must stay vigilant for such deep retracements, as they can lead to the pattern’s invalidation and increased trading risk. |
| Risk-Off Markets | Sudden drops in market volatility can lead to abrupt trend reversals. Oftentimes, the bear flag is a product of risk-off market sentiment. That sentiment can fade and cause prices to reverse making for an invalid pattern. |
Trading Bear Flags with Volume Confirmations
Volume plays an important role in deciphering a good bear flag pattern and one that might fail.
Initially, there is high volume during the major price decline forming the flagpole. This is followed by a significant drop in volume as the flag develops, typically seen right after the flagpole’s formation. The high volume during the flagpole indicates strong selling pressure, while the subsequent reduced volume during the flag suggests a temporary pause in the downtrend, not a reversal.

As the bear flag pattern nears completion and the price breaks below the flag’s lower boundary, there would be a visible increase in volume. This surge in volume confirms the sellers’ return to dominance and the likely continuation of the downtrend. A breakout accompanied by increased volume validates the bearish flag. In contrast, a breakout without a volume increase might signal a false breakout and must be approached with skepticism.
It’s important to note that in some markets like forex, volume data might not be as reliable. In such cases, even if volume indicators are less clear, bearish flag patterns can still form. Traders should then focus more on price action and the location of the flag to confirm the chart pattern.
Bear Flag vs. Bull Flag
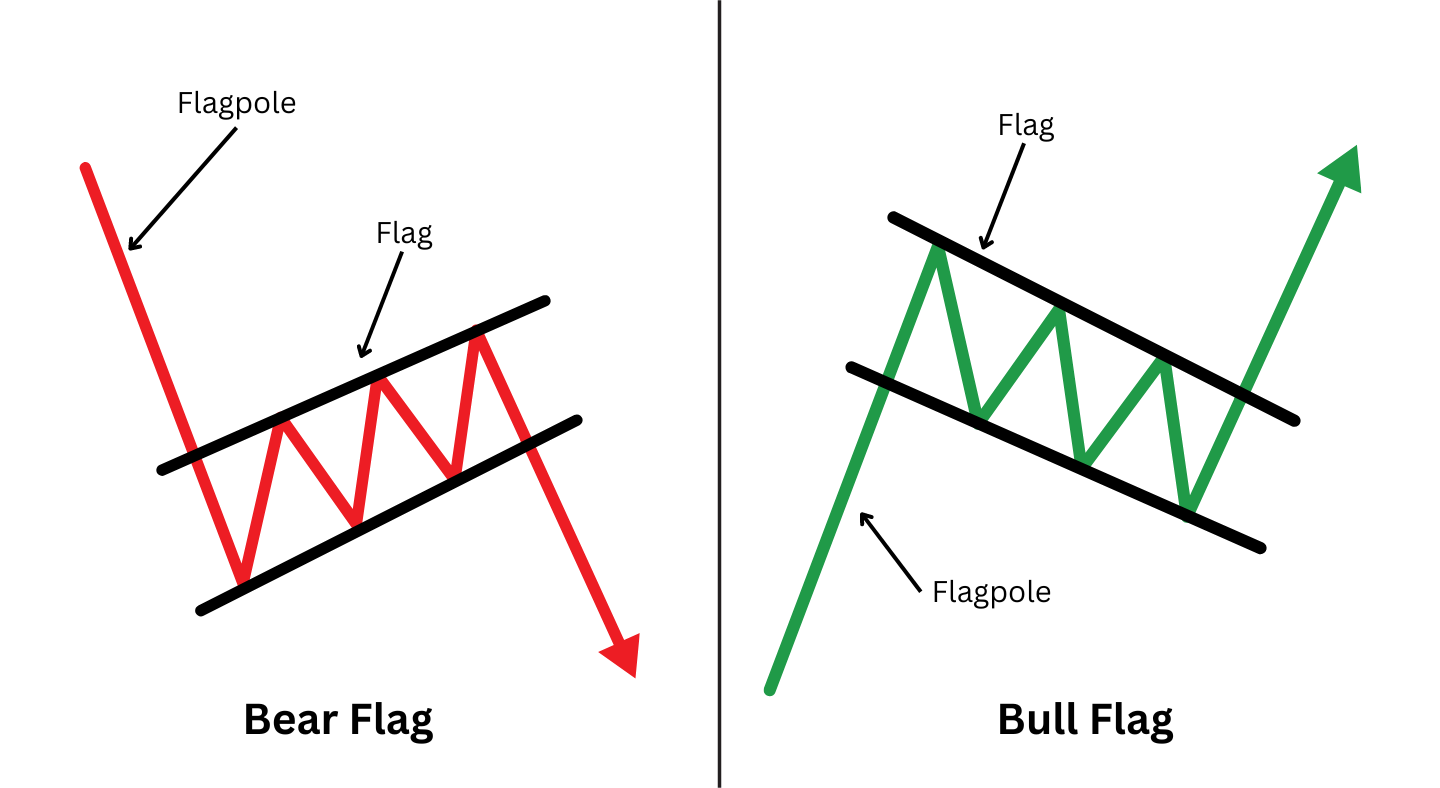
Understanding the distinction between bull and bear flag is important for traders analysing market trends. Both are continuation chart patterns that signal movements in opposite directions.
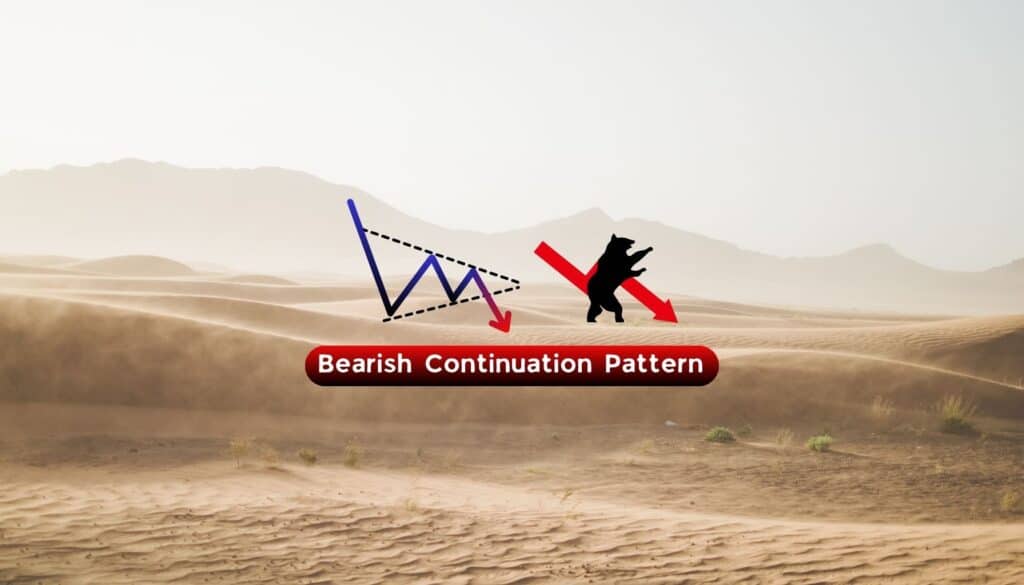
A bear flag pattern occurs during a downtrend. It begins with a strong downtrend known as the flagpole. This is trailed by a slight upward or horizontal consolidation, referred to as the flag. This consolidation typically slopes slightly upwards, resembling a small rising channel. During its formation trading volume usually declines, then increases notably when the price pushes downwards from the flag. Traders would often enter a short trade when the price manages to break below anticipating the continuation of the downtrend.
Conversely, a bull flag pattern occurs during an upward trend. It starts with a significant upward price movement (flagpole), followed by a downward or horizontal consolidation known as the flag. This phase often slopes slightly downwards, mirroring a small descending channel. Like the bear flag, trading volume in bull flag pattern decreases during formation and increases as the price rally upwards. Price fluctuations above the flag is a cue for traders to take a long position, expecting the uptrend to continue.
Common Bear Flag Pattern Mistakes to Watch out
Deep Retracement Level: Traders engage in trades when the flag’s retracement level is too deep, such as at the 60% mark. This can significantly diminish the chart pattern’s reliability and increase the risk of unsuccessful trades.
Ignoring Volume Indicators: Many traders need to pay more attention to volume during the flag’s formation. Generally, the volume should decrease during the consolidation phase of the flag and then increase significantly when the price breaks downward. If you enter a trade without considering this volume confirmation, you may receive false signals.
Stop Loss levels: Setting the stop-loss just above the flag’s upper boundary is important to limit potential losses from an unexpected upward price reversal. Traders should avoid placing it too tight to prevent premature stop-outs.
Bear Flag vs Bear Pennant

The bear flag pattern consists of a sharp price decline called a flag pole, followed by a flag portion indicating price consolidation, which moves slightly upwards in a rectangular manner.
In contrast, the bear pennant is also a bearish continuation pattern. It is identified with a flag pole, but instead of the bear flag formation, a pennant is formed instead, resembling the shape of a small symmetrical triangle. The consolidation phase of the bear pennant is identified by converging trendlines that take a faster time to form when compared with the bear flag.
Volume trends in a bear pennant show high volume during the initial decline, tapering off during the formation of the pennant. A decline below the pennant formation confirms the breakout and indicates a downward trend continuation. Traders can opt for a short-term sell position but be wary as the pattern is susceptible to false signals unless traded with additional confirmations.
What is the psychology behind the bear flag pattern?
The psychology behind the bear flag pattern revolves around the bearish market sentiment. The flagpole which is formed as a result of the initial sharp decline, signals a bearish response where traders collectively drive the price down. This move reflects a strong consensus that the asset’s value is set to decline further, initiating a focused sell-off.
The flag phase that follows is where the market experiences a brief pause leading to a temporary halt in the downward momentum. However, this pause is typically not a sign of a trend reversal but a momentary break in an otherwise bearish market. The initial bearish sentiment is reinforced as the consolidation phase is broken below, indicating a strong bias in continuing the initial decline.
FAQ
How reliable is the bear flag pattern in predicting future price movements?
The bear flag pattern’s reliability is strengthened when a volume increases during the breakout, indicating strong market consensus. Furthermore, a bearish trend reading on the Relative Strength Index (RSI) confirms the continuation of the downtrend.
What is a failed bear flag?
A failed bear flag also known as a bear trap, is when the market starts to trend lower but prices immediately reverse higher. It traps the short traders who now have to buy at a higher price.
Is the bear flag bullish?
Bear flags can sometimes give off a bullish trend appearance during the upward slope where the price consolidates. However, this consolidation phase is usually just a brief pause in a preceding downtrend, indicating that the overall trend is still bearish and a price breakdown may be around the corner.
How long does a bear flag last?
A bear flag pattern is a short-term chart pattern that typically lasts a few days to a few weeks on a daily chart and only a few hours on even shorter time frames.
What technical analysis indicators are used with bear flags?
When analyzing bear flags, two primary technical indicators are commonly used:
Volume: A decrease in volume is observed during the flag’s formation, with an increase as the price breaks below the flag’s lower boundary.
Fibonacci Retracements: For a bear flag pattern to be considered valid, its upward retracement should be contained within the lower half of the flagpole. Oftentimes, the retracement is 38% or less and the Fibonacci tool assists traders in determining the validity of the retracement.