


Written by:

Reviewed by:

Bearish
Bullish
- June 25, 2026
- 29 min read
Liquidity Grab Explained with Examples
A liquidity grab happens when price briefly moves beyond an obvious high or low, triggers orders around that level, then quickly reverses.
This is why it can help traders separate a genuine breakout from a potential trap. Let’s look at one of the clearest ways to identify a fake-out or a real breakout.
In this guide, you will learn what a liquidity grab is, how it works, why price often sweeps key highs and lows before reversing, and how traders use liquidity grabs within structured analysis to plan entries, stops, and targets.
What is a Liquidity Grab?
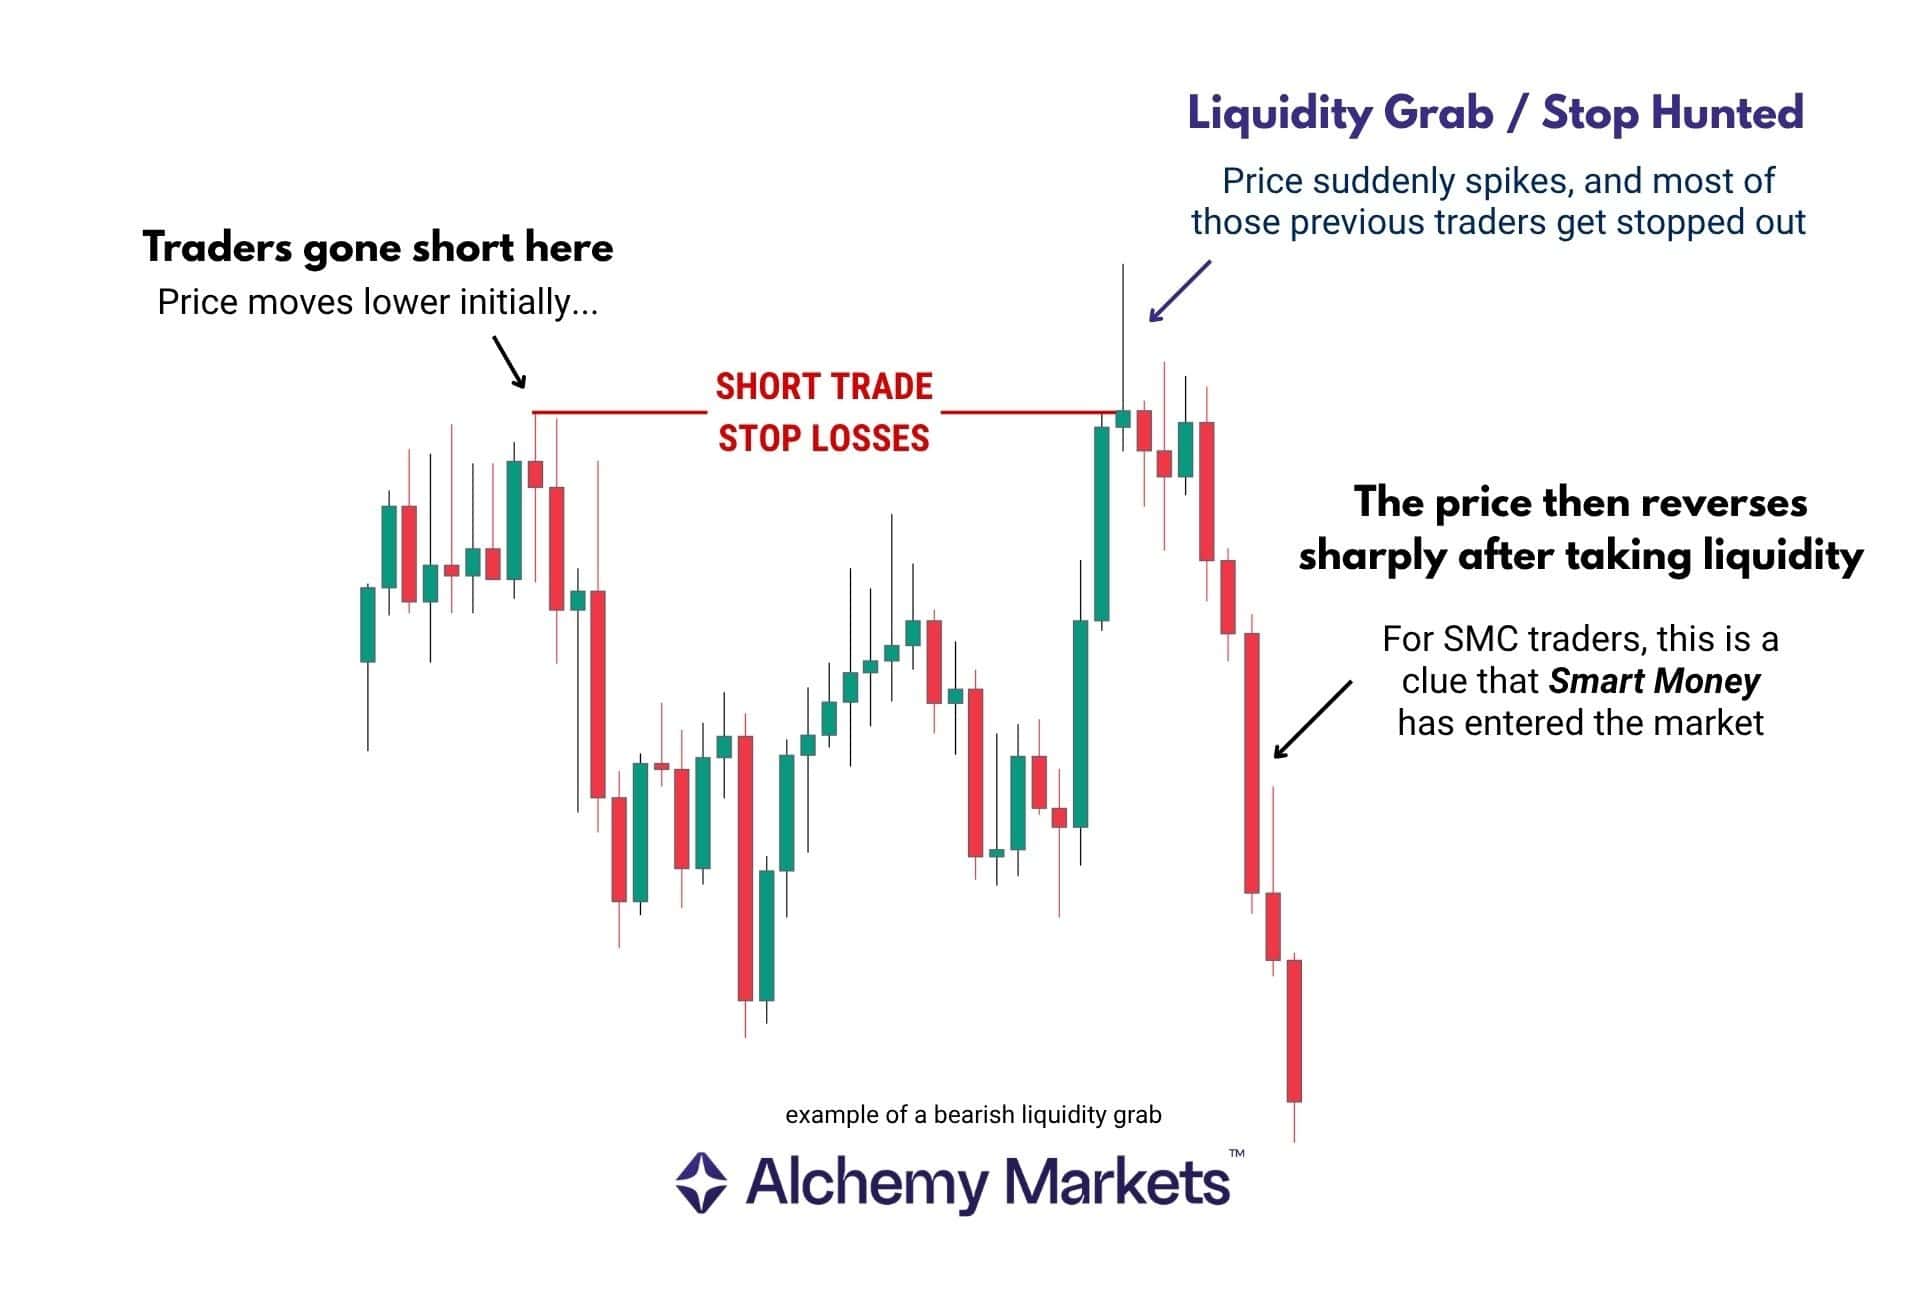
A liquidity grab, also known as a “stop hunt”, is a failed breakout where price briefly spikes beyond a key support or resistance level, triggers resting orders, then quickly reverses.
Smart Money Concept traders believe this is an engineered move by large market players, in order to intentionally trigger a number stop losses, liquidations, and breakout orders, to create a perfect buy or sell opportunity.
Visually, it is a one or two-candlestick rejection at a liquidity level, specifically at swing highs or swing lows.
- A swing high is the highest point before price pivots lower, while a swing low is the lowest point before price pivots higher.
The rejection is defined by the candlestick closing below the swing high, or above the swing low. However, if price only closes slightly beyond the level, then immediately reclaims it on the next candle, it can still be treated as a liquidity grab.
What is a Liquidity Run?
Liquidity runs are the opposite of a liquidity grab, they are a successful breakout of a key level.
Basically, a liquidity run refers to when an order block, or support / resistance has failed to hold, and price continues to travel further.
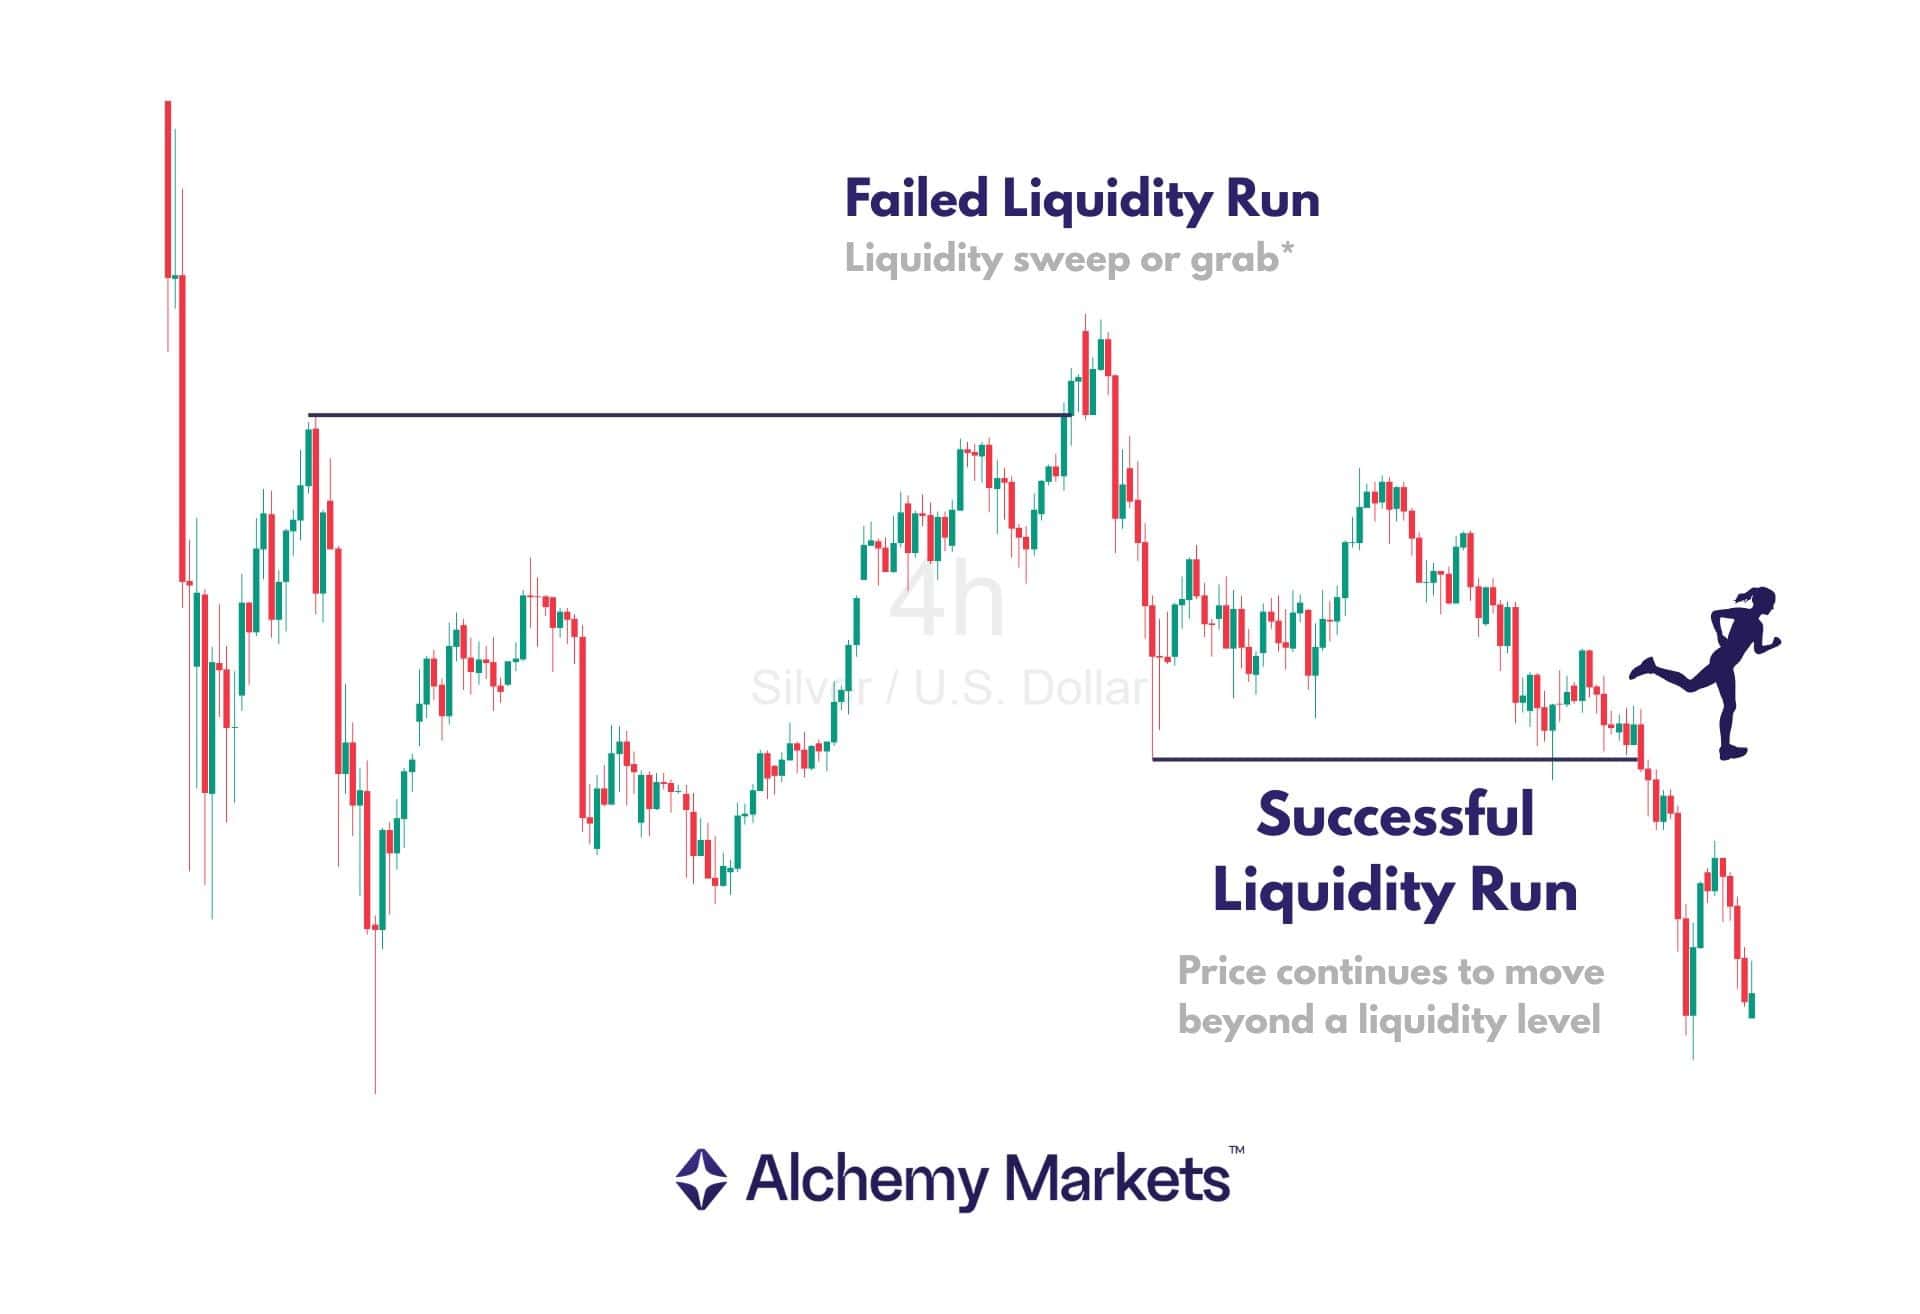
Your goal as a trader is to tell whether price is making a true liquidity run or only grabbing liquidity before reversing.
This can happen through a single-candle rejection, known as a liquidity grab, or through multiple extended closes beyond a key level, known as a liquidity sweep.
How Does the Liquidity Grab Work?
A liquidity grab works by targeting the liquidity zone beyond a swing high, swing low, or order block.
When price enters a liquidity zone, it can trigger stop losses, breakout orders, and liquidations.
In theory, those orders should help prices continue in the breakout direction. If price breaks above a swing high, buy-side liquidity should help push price higher. If price breaks below a swing low, sell-side liquidity should help push price lower.
So when price triggers a liquidity zone but fails to continue, SMC traders treat it as a sign that larger players (Smart Money) came in and absorbed those orders. Let’s illustrate using an example:
| i. A liquidity grab occurs as price breaks into new highs. ii. Buy-side liquidity gets triggered at the highs. iii. An injection of new buy orders flood the market, pushing prices higher. iv. As prices push higher, large players use this opportunity to sell at premium prices. v. After the buy-side liquidity was exhausted, prices plummet as the sells outweigh the buys. |
Traders can also use order blocks as liquidity reference zones. However, for this article, we recommend just looking at the absolute swing high and lows as the reference point.
The key difference is that swing highs and swing lows mark the absolute extremes of a price swing, making them cleaner for identifying where liquidity zones may form.
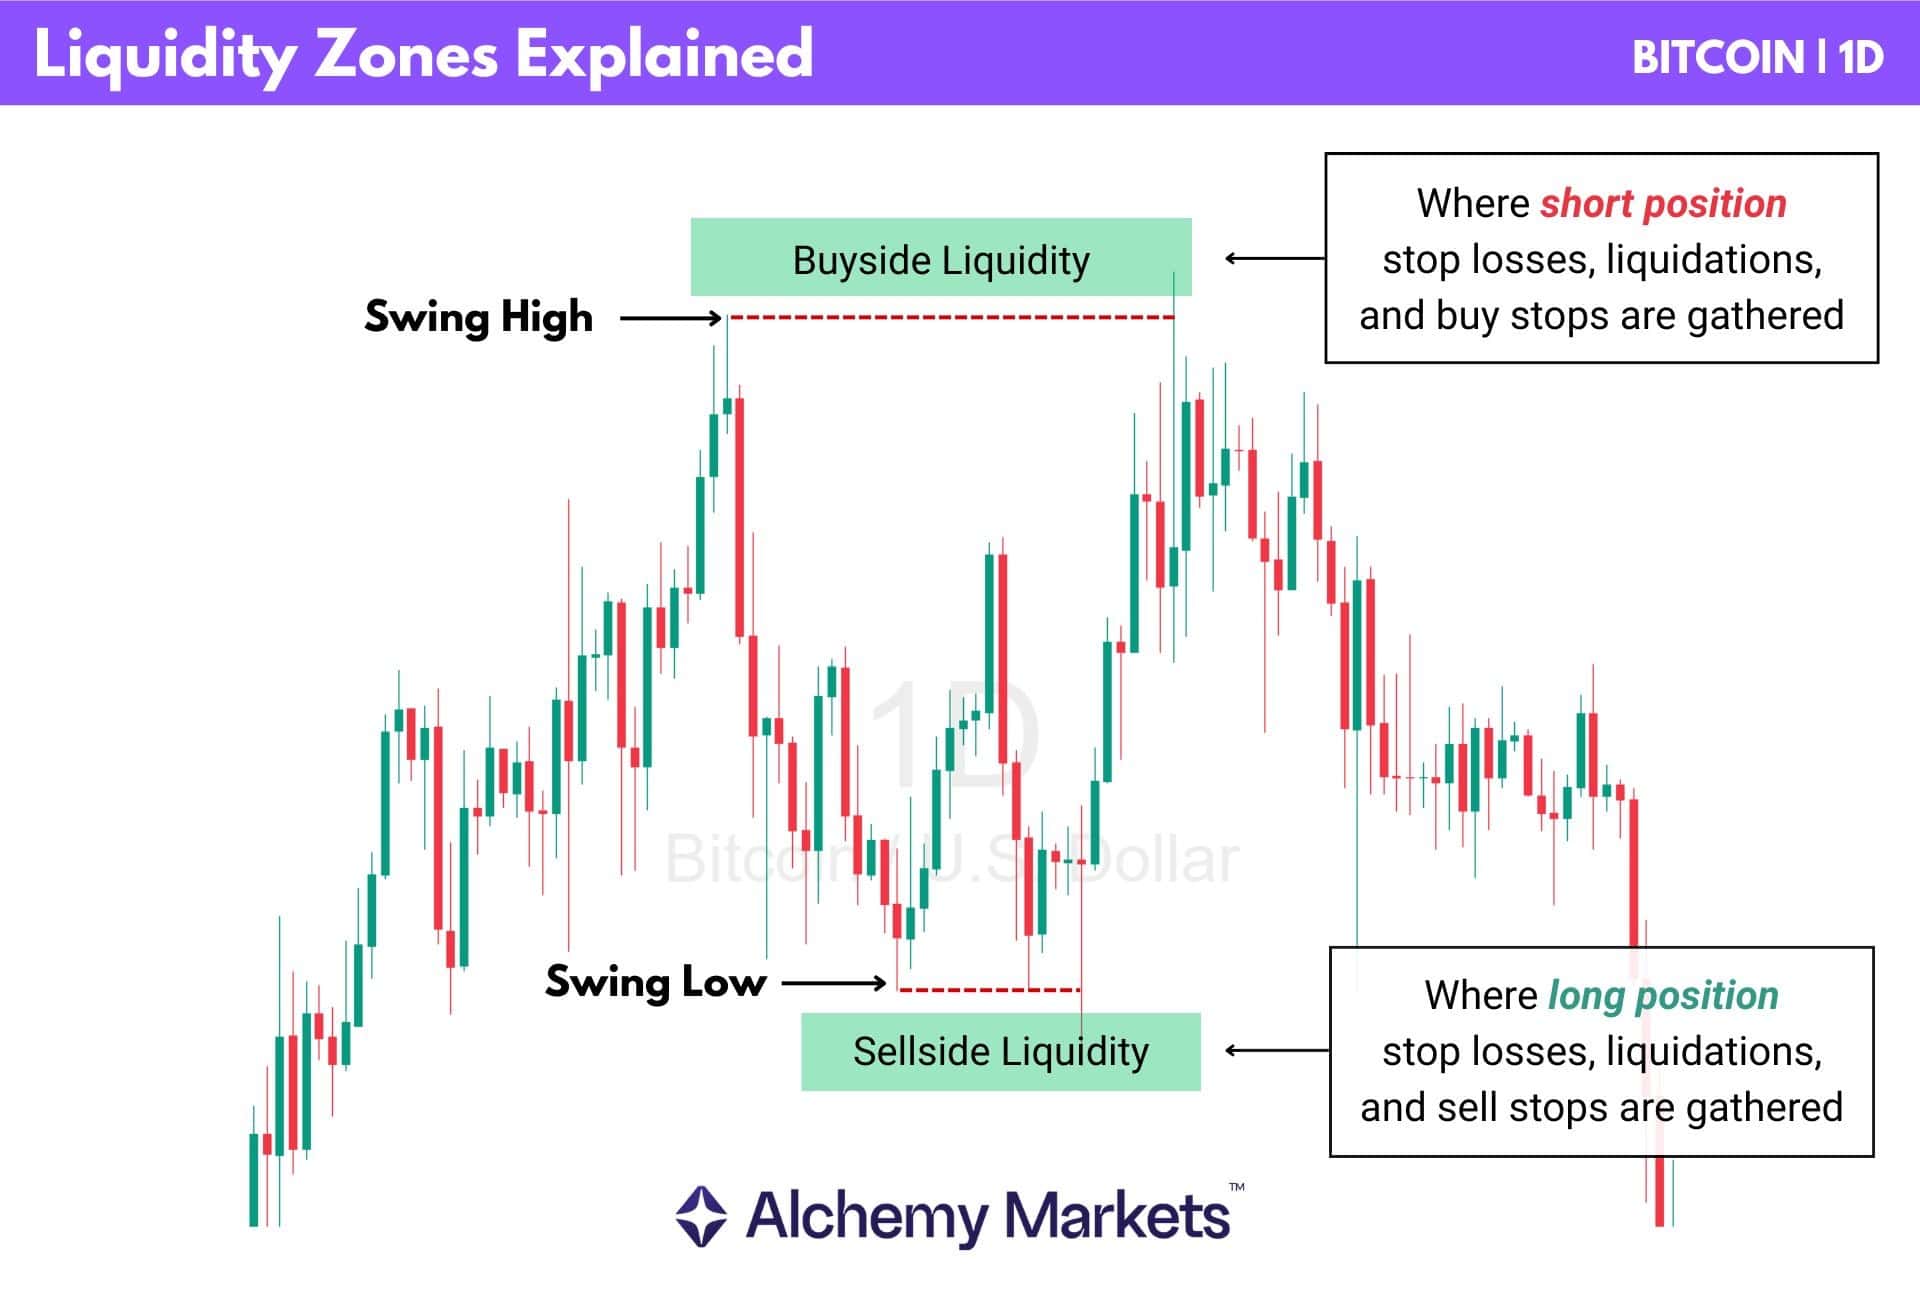
What are Liquidity Zones?
Liquidity zones are educated guesses of where clusters of pending orders are usually sitting.
Most of the time, these zones are found above a swing high or below a swing low. This is because conventional trading wisdom teaches traders to place their stop losses beyond obvious highs and lows to protect their trades.
Breakout traders may also place buy stop orders above swing highs or sell stop orders below swing lows, which adds even more liquidity around these same areas.
These pending orders include:
| i. Stop losses from traders protecting positions. ii. Buy stops and sell stops from breakout traders. iii. Liquidations from leveraged positions that fail. |
At a swing high, the liquidity zone above it is called buyside liquidity, as they are technically buy orders.
- For example, a short position must be closed by buying back the asset.
At a swing low, the liquidity zone below it is called sellside liquidity, as they are technically sell orders.
- For example, a long position must be closed by selling the asset.
See chart below for visual clarification:
How to Identify a Liquidity Grab
Liquidity grabs can be identified when price revisits a liquidity zone, but immediately creates a wick and reverses.
As seen in the liquidity zones example in the previous section, these quick wicks into the zones have produced strong reversals.
How To Find a Bullish Liquidity Grab
| A bullish liquidity grab can be found when price revisits a swing low, pushes below it to form a lower low, then quickly closes back above the swing low. The cleanest version is a wick below the swing low, followed by a close back above that level. But it does not always need to happen in one candle. Sometimes, price may slightly close below the swing low first, only for the next candle to immediately reclaim the level. | 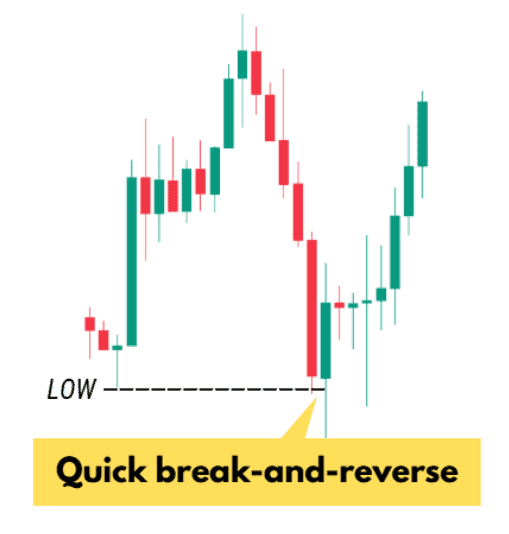 |
Here’s what you’re looking for on a technical level:
① Price moves below a swing low, triggering sell-side liquidity.
② The breakdown attempt stalls, with price failing to hold below the level.
③ A second candle confirms the reversal by closing bullish or continuing higher.
In this case, sell-side liquidity is triggered, which can create short-term selling pressure that can be absorbed by large buyers, resulting in a powerful upside reversal.
How To Find a Bearish Liquidity Grab
| The bearish version works the other way around. Instead of price raiding a swing low, price revisits a swing high, breaks above it to form a higher high, then quickly closes back below the swing high. This is usually seen as a wick above the swing high, followed by a close back under the level.In some cases, though, the rejection can take two candles. Price may slightly close above the swing high, but if the next candle immediately pushes back below it, the move still shows rejection rather than true acceptance. | 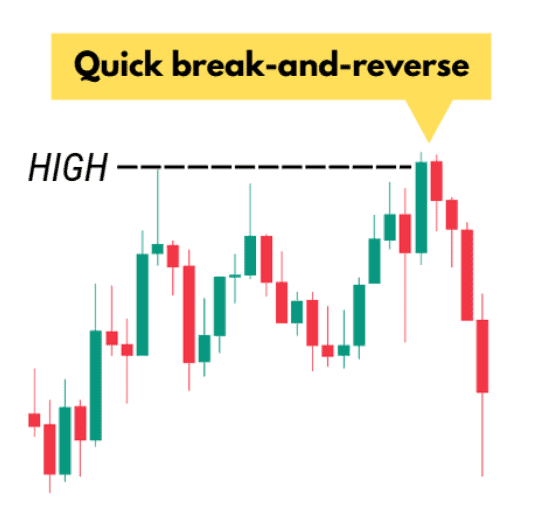 |
Here’s what you’re looking for on a technical level:
① Price moves above a swing high, triggering buy-side liquidity.
② The breakout attempt stalls, with price failing to hold above the level.
③ A second candle confirms the reversal by closing bearish or continuing lower.
In this case, buy-side liquidity is triggered, which can create short-term buying pressure that can be absorbed by large sellers, resulting in a powerful downside reversal.
Importance of Liquidity Grab in Smart Money Trading
Think of liquidity grabs as stronger retests of a support or resistance.
In doing so, you can recognise them as more reliable reversal signals in the very short term. This boils down to the psychology behind a liquidity grab in trading: it is a divergence between what is expected to happen (breakout), and what is reflected in the price charts.
The clear rejection candle shows that the liquidity zone has not acted as fuel for a continued breakout. Instead, the retail traders’ stop losses, breakout entries, and liquidations have likely been absorbed by larger players, creating the fuel for a reversal.
These larger players, often called Smart Money, include asset managers, hedge funds, pension funds, large prop trading firms, and major institutional desks. Since they trade with much larger capital, they actually need this liquidity from retail stop losses, breakout entries, and liquidations to enter or exit positions more efficiently.
For context, BlackRock reported around $13.89 trillion in assets under management as of 31 March 2026. That does not mean BlackRock trades that full amount every day, but it shows the scale difference between large institutions and typical retail traders.
In short, a liquidity grab is important because it gives the context that Smart Money has potentially gotten involved in a reversal.
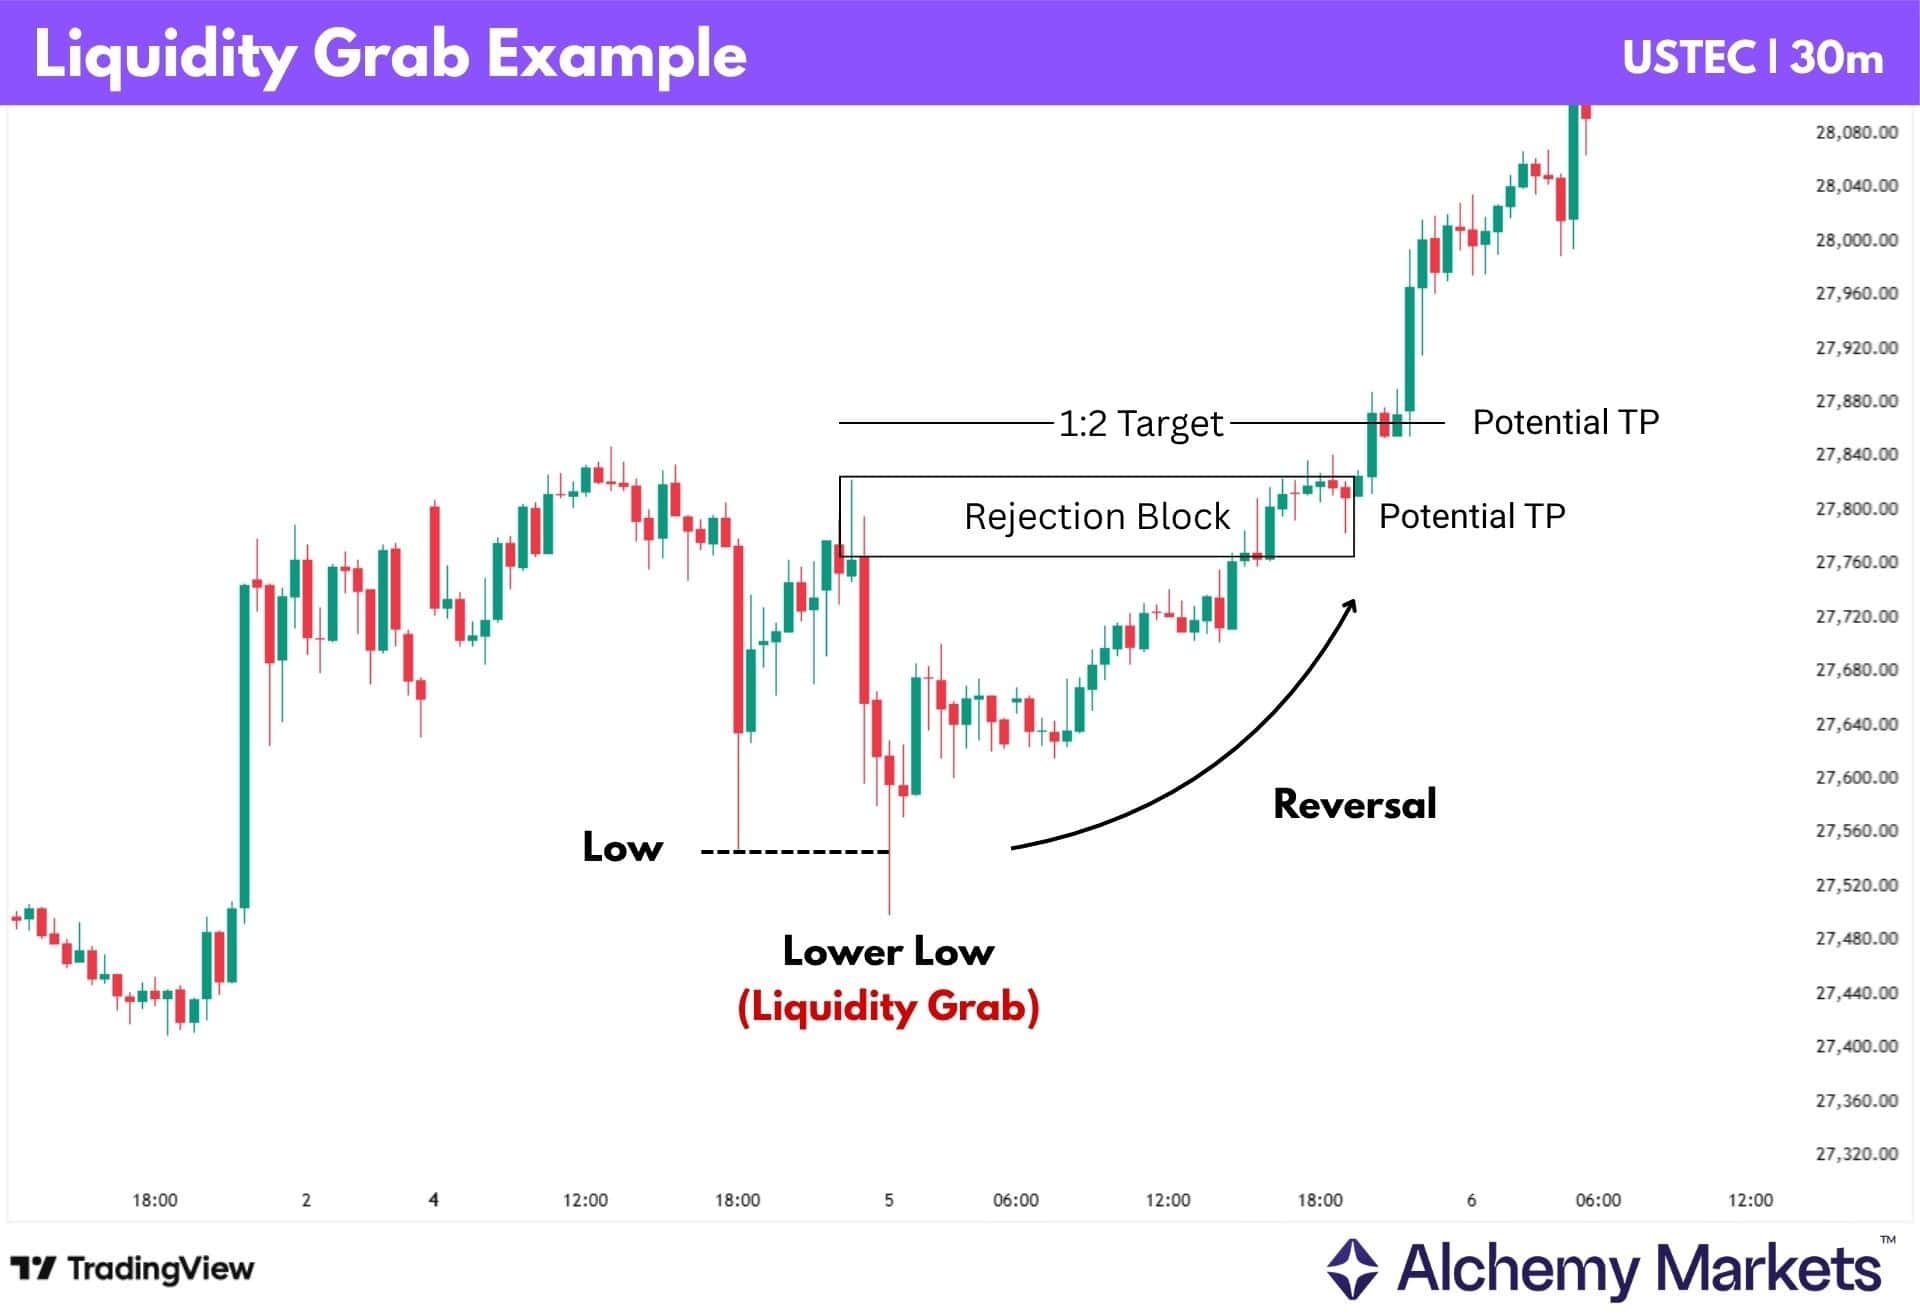
Liquidity Grab Example
In this Nasdaq 100 chart (CFD ticker as USTEC), price first forms a swing low, then breaks below that level to create a lower low. However, instead of continuing lower, price quickly recovers and reverses to the upside.
This is a bullish liquidity grab, and as such, traders can consider a long position. Take profit targets can include:
- Support / Resistance Zones like Order Blocks, Rejection Blocks, Fair Value Gaps etc.
- Or mechanical 1:2 risk-to-reward ratio, with stop loss below the wick.
Liquidity Grab Trading Strategies
Liquidity grabs can’t really be traded “right out of the box” as it can be risky if you take a trade at a less significant liquidity level.
If you want long-term consistency, it’s recommended to combine liquidity grab with other indicators, or Smart Money Concepts such as PD arrays to define better entry and exit conditions.
| What are PD Arrays? Support and resistance zones defined by SMC rules, such as Fair Value Gaps, Order Blocks, Breaker Blocks, Mitigation Blocks, Rejection Block, and Vacuum Blocks. Even the swing high/low are PD arrays. |
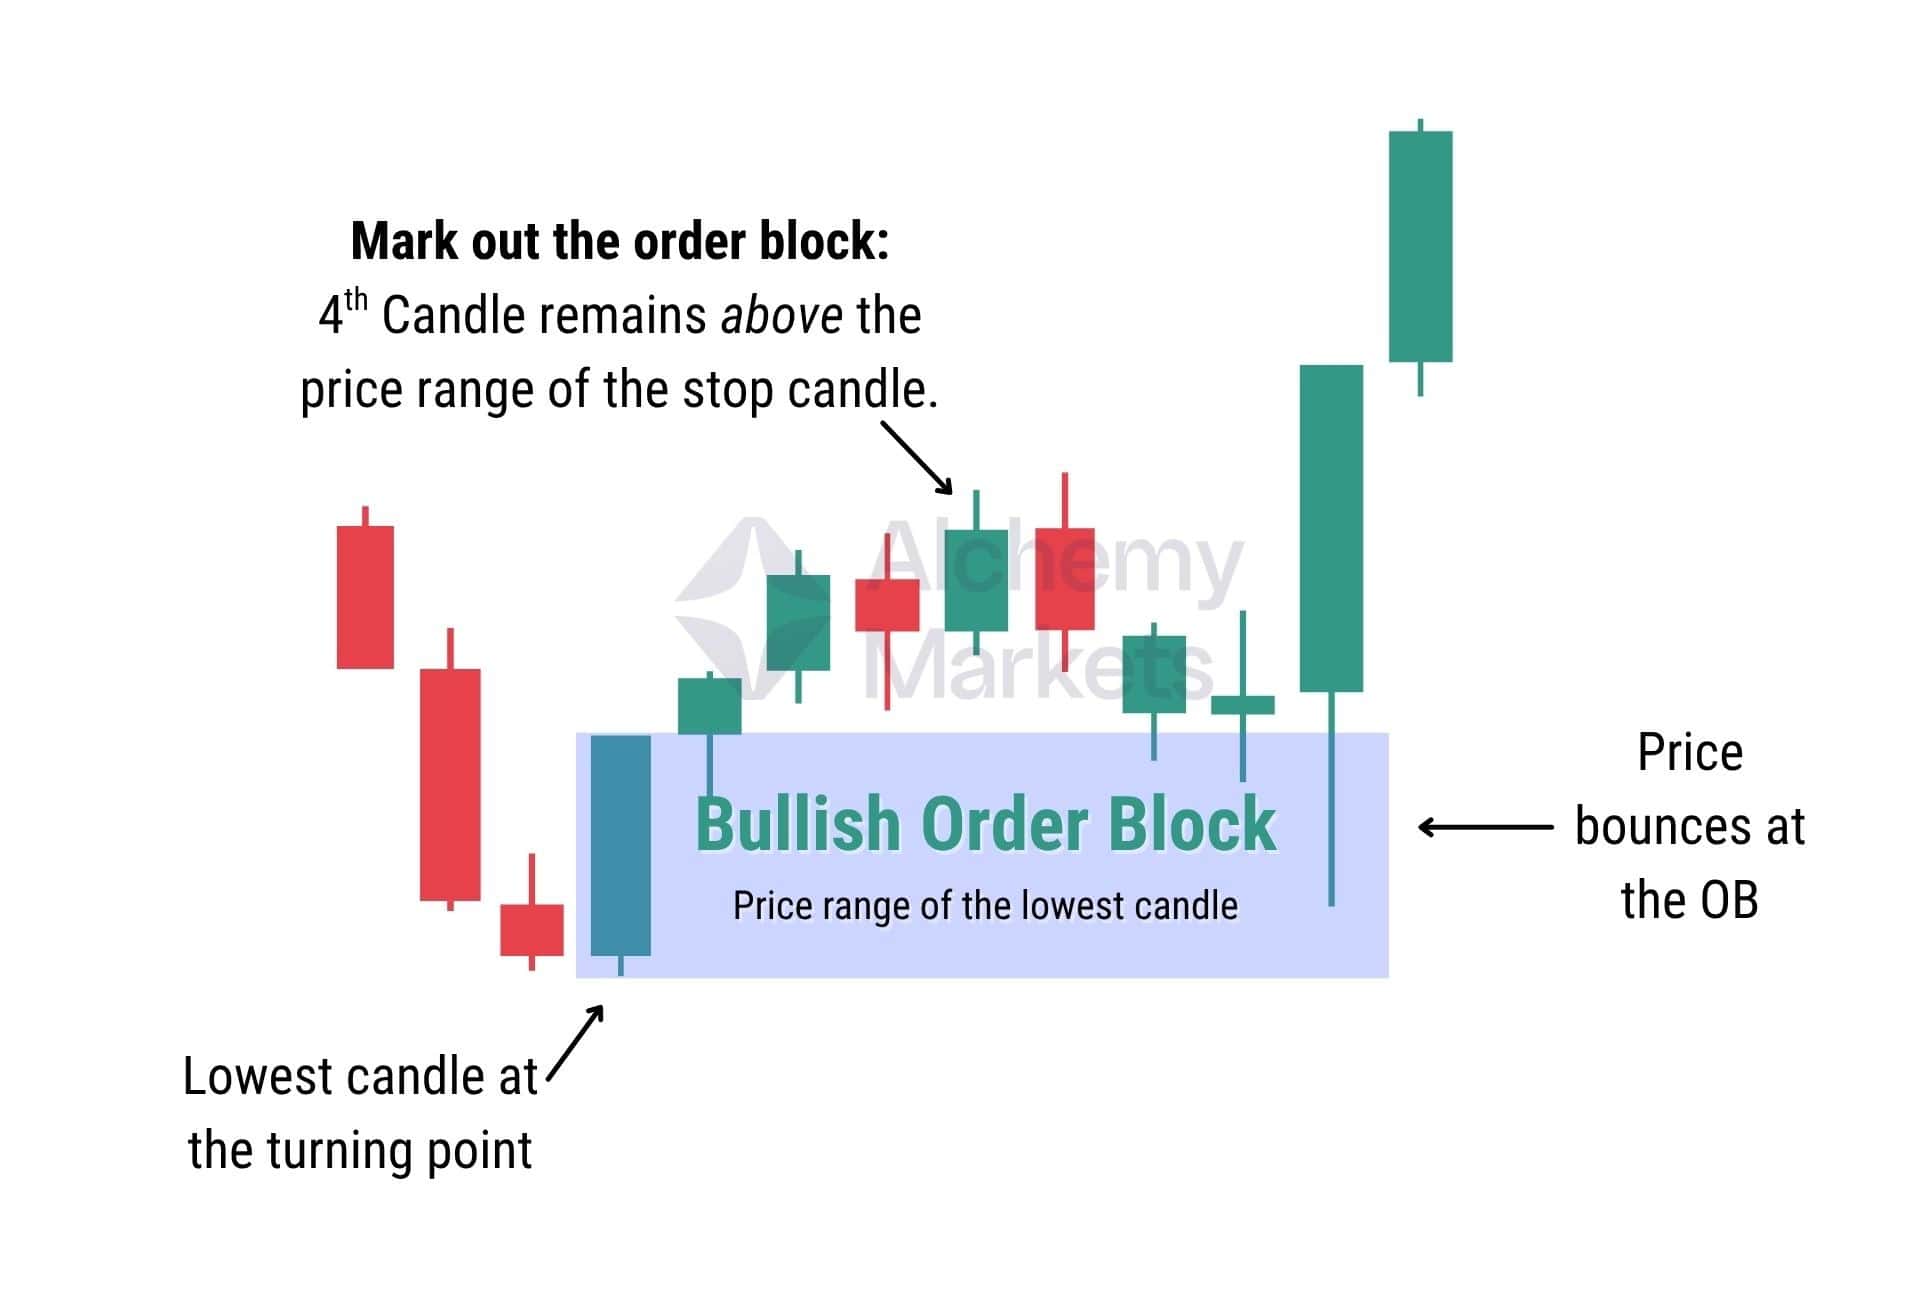
Other than swing highs/lows, the most PD array to understand is the order block (OB). This is the price zone equal to the range of the last swing high, or swing low candle before a significant price pivot.
We apply a 4 candlestick follow through rule to validate order blocks. It tells us if price has moved away significantly enough to be considered a valid swing point. The 4th candle after the “Stop Candle” or “Pivot Candle” must be closed outside the OB’s range.
They set the basis for breaker blocks, mitigation blocks, and rejection blocks as well. All of these PD arrays can be used as potential entry or exit points; but mostly as exit references.
Support or Resistance Levels (Smart Money Concepts)
Understanding support and resistance is important when trading liquidity grabs, because these levels can act as potential take-profit targets after entering a long or short position.
You could simply target the opposing swing high or swing low, but that is not always the most effective method. Price does not move perfectly, and may front-run those obvious highs or lows before reversing.
This is where PD arrays, or Smart Money Concepts-based support and resistance zones, can offer a more structured approach.
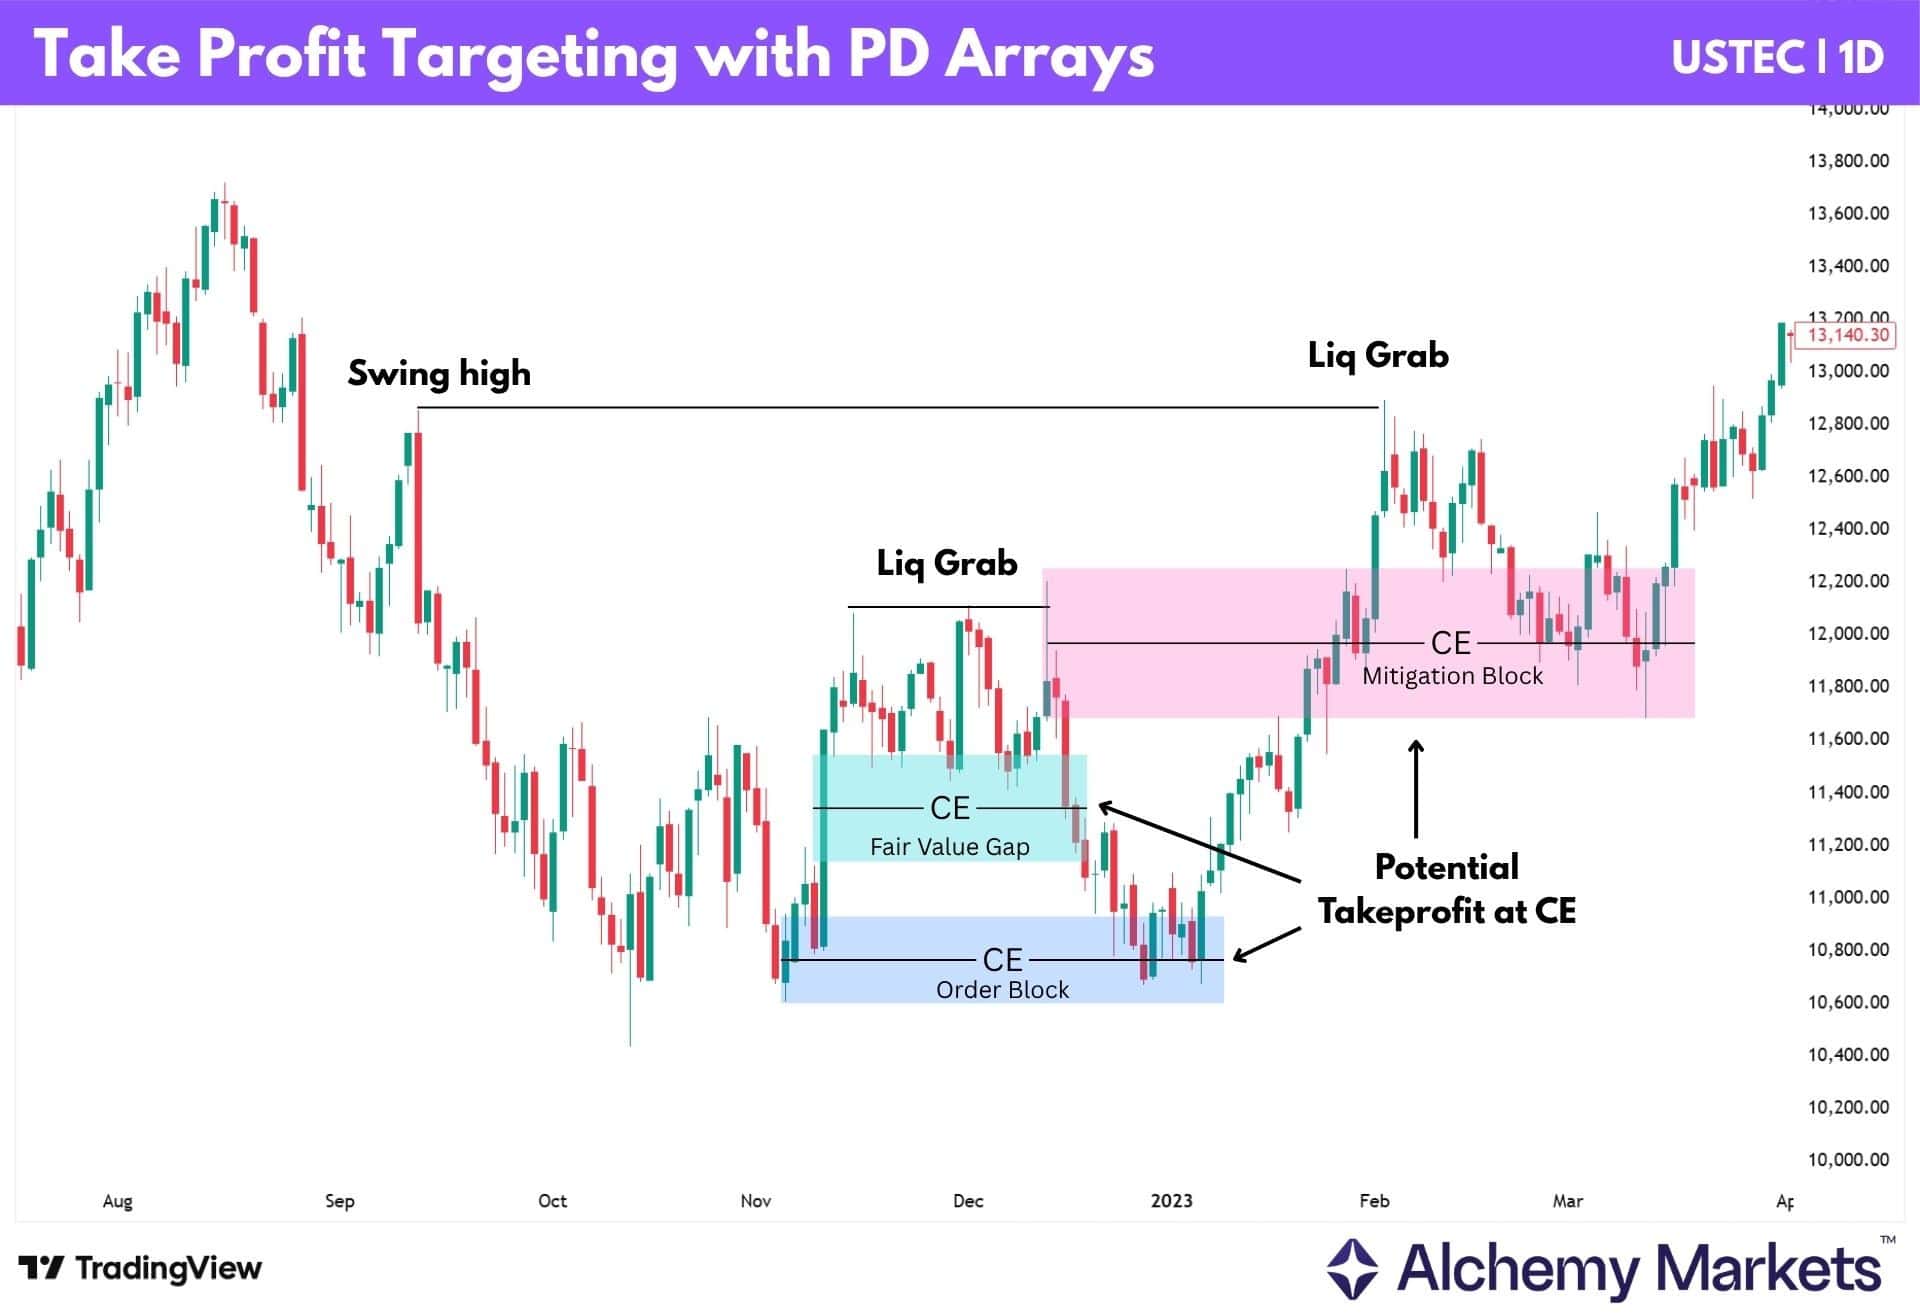
After identifying a liquidity grab at a former swing high or low, mark out opposing PD arrays as potential take profits:
| i. Order Blocks: The last candle before a major pivot, based on our 4th candle follow-through rule. ii. Rejection Blocks: A refined order block using only the wick range as support or resistance. iii. Fair Value Gaps: A three-candle pattern where price moved too quickly, leaving a gap in the center with no overlap. iv. Breaker and Mitigation Blocks: Broken order blocks that flip roles. Breakers involve a prior liquidity grab or sweep; mitigation blocks do not. |
Then, mark the Consequent Encroachment (CE), the 50% midline of each zone, which SMC traders often use as a potential entry area or take-profit target.
Notice how the CE or the zone edges can act as clean take-profit areas, sometimes hitting to the dot before a reversal.
Fade the Move Approach
To “Fade the move” means to aggressively trade a reversal once a liquidity grab occurs. However, this can be highly risky, so it’s best to combine this with a momentum oscillator divergence.
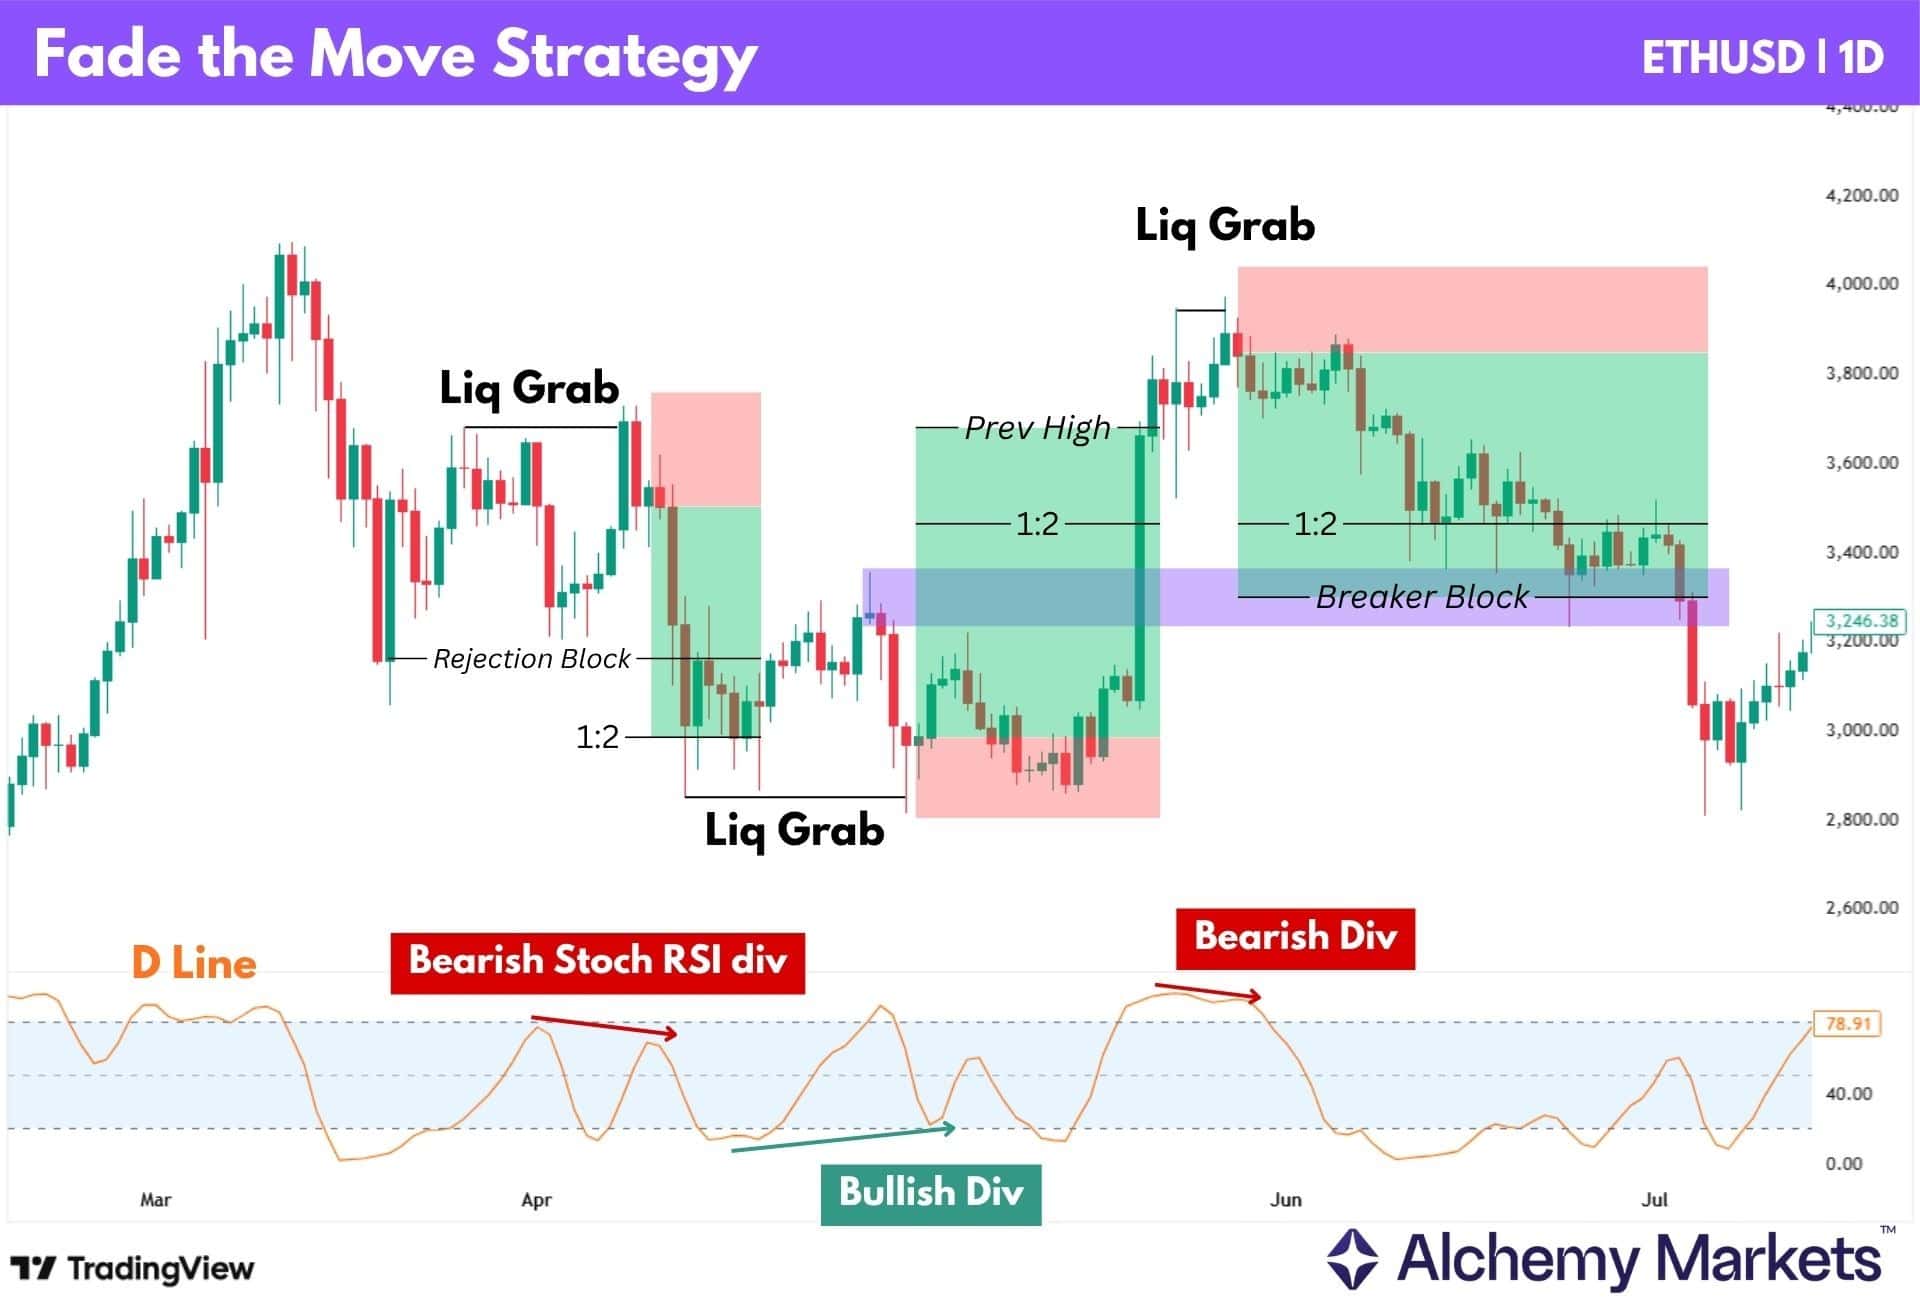
For this example, we chose the Stochastic RSI, removed the K line, and used only the D line for finding regular and hidden divergences. But, any momentum oscillator of your choice will serve just fine.
If a regular divergence is observed as a liquidity grab happens (or right after), this can give us the confidence to enter a reversal.
| What are Regular Divergences? Regular divergences are when price moves in a more extreme manner, but the momentum oscillator can’t keep up. They signal favourable conditions for a reversal. For example, a bearish divergence is when the price forms a higher high, but the momentum fails to keep up and forms a lower high instead. A bullish divergence is when the price forms a lower low, but the momentum fails to keep up and forms a higher low instead. |
Take profits can be 1:2 mechanical risk-to-reward, with the stop loss placed behind the liq. grab’s highest or lowest point.
For more advanced traders, consider taking profit only at key PD arrays, such as order blocks, breakers, mitigation blocks, or others.
Price Action Confirmation
Price action confirmation means waiting for price to prove that the liquidity grab is turning into a real reversal, instead of entering immediately after the wick.
The issue with entering right after the liquidity grab is that price can still spend a long time chopping around the same area. The grab may be valid, but the move has not been fully confirmed yet.
A cleaner approach is to mark the nearest opposing PD array outside of the liquidity grab. This could be an order block, mitigation block, breaker block, rejection block, or FVG.
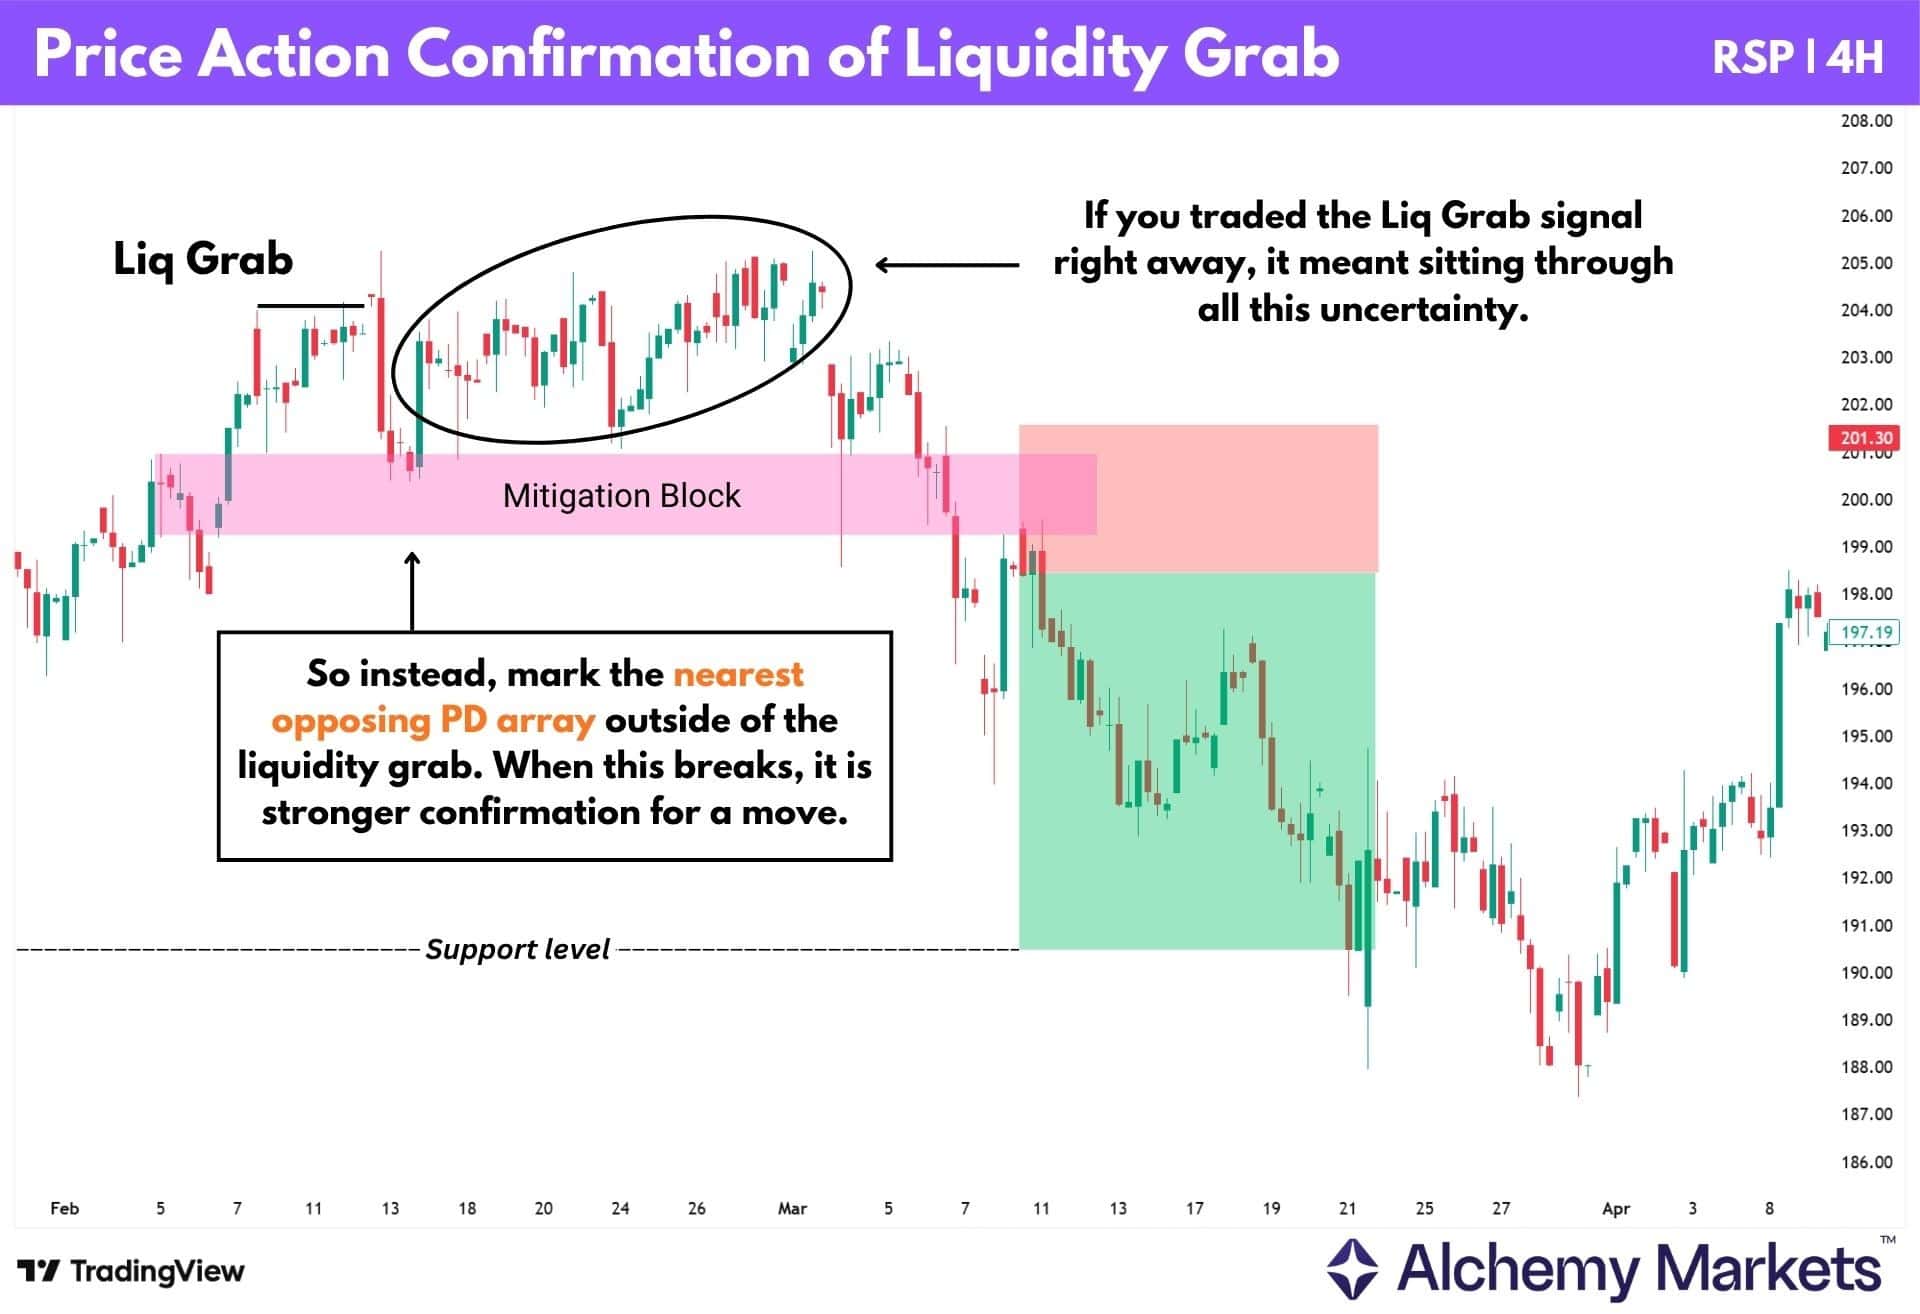
For a bearish liquidity grab above a swing high, look for price to break below the nearest support-based PD array. For a bullish liquidity grab below a swing low, look for price to break above the nearest resistance-based PD array.
The sequence is:
| i. Price grabs liquidity above a swing high or below a swing low. ii. Instead of entering immediately, mark the nearest opposing PD array. iii. Wait for price to break that PD array. iv. Enter at the point of breakout, or a successful retest of the same zone. |
This helps traders avoid sitting through unnecessary uncertainty. Instead of treating every liquidity grab as an instant reversal signal, price action is used to confirm that the market is actually reversing from a price zone.
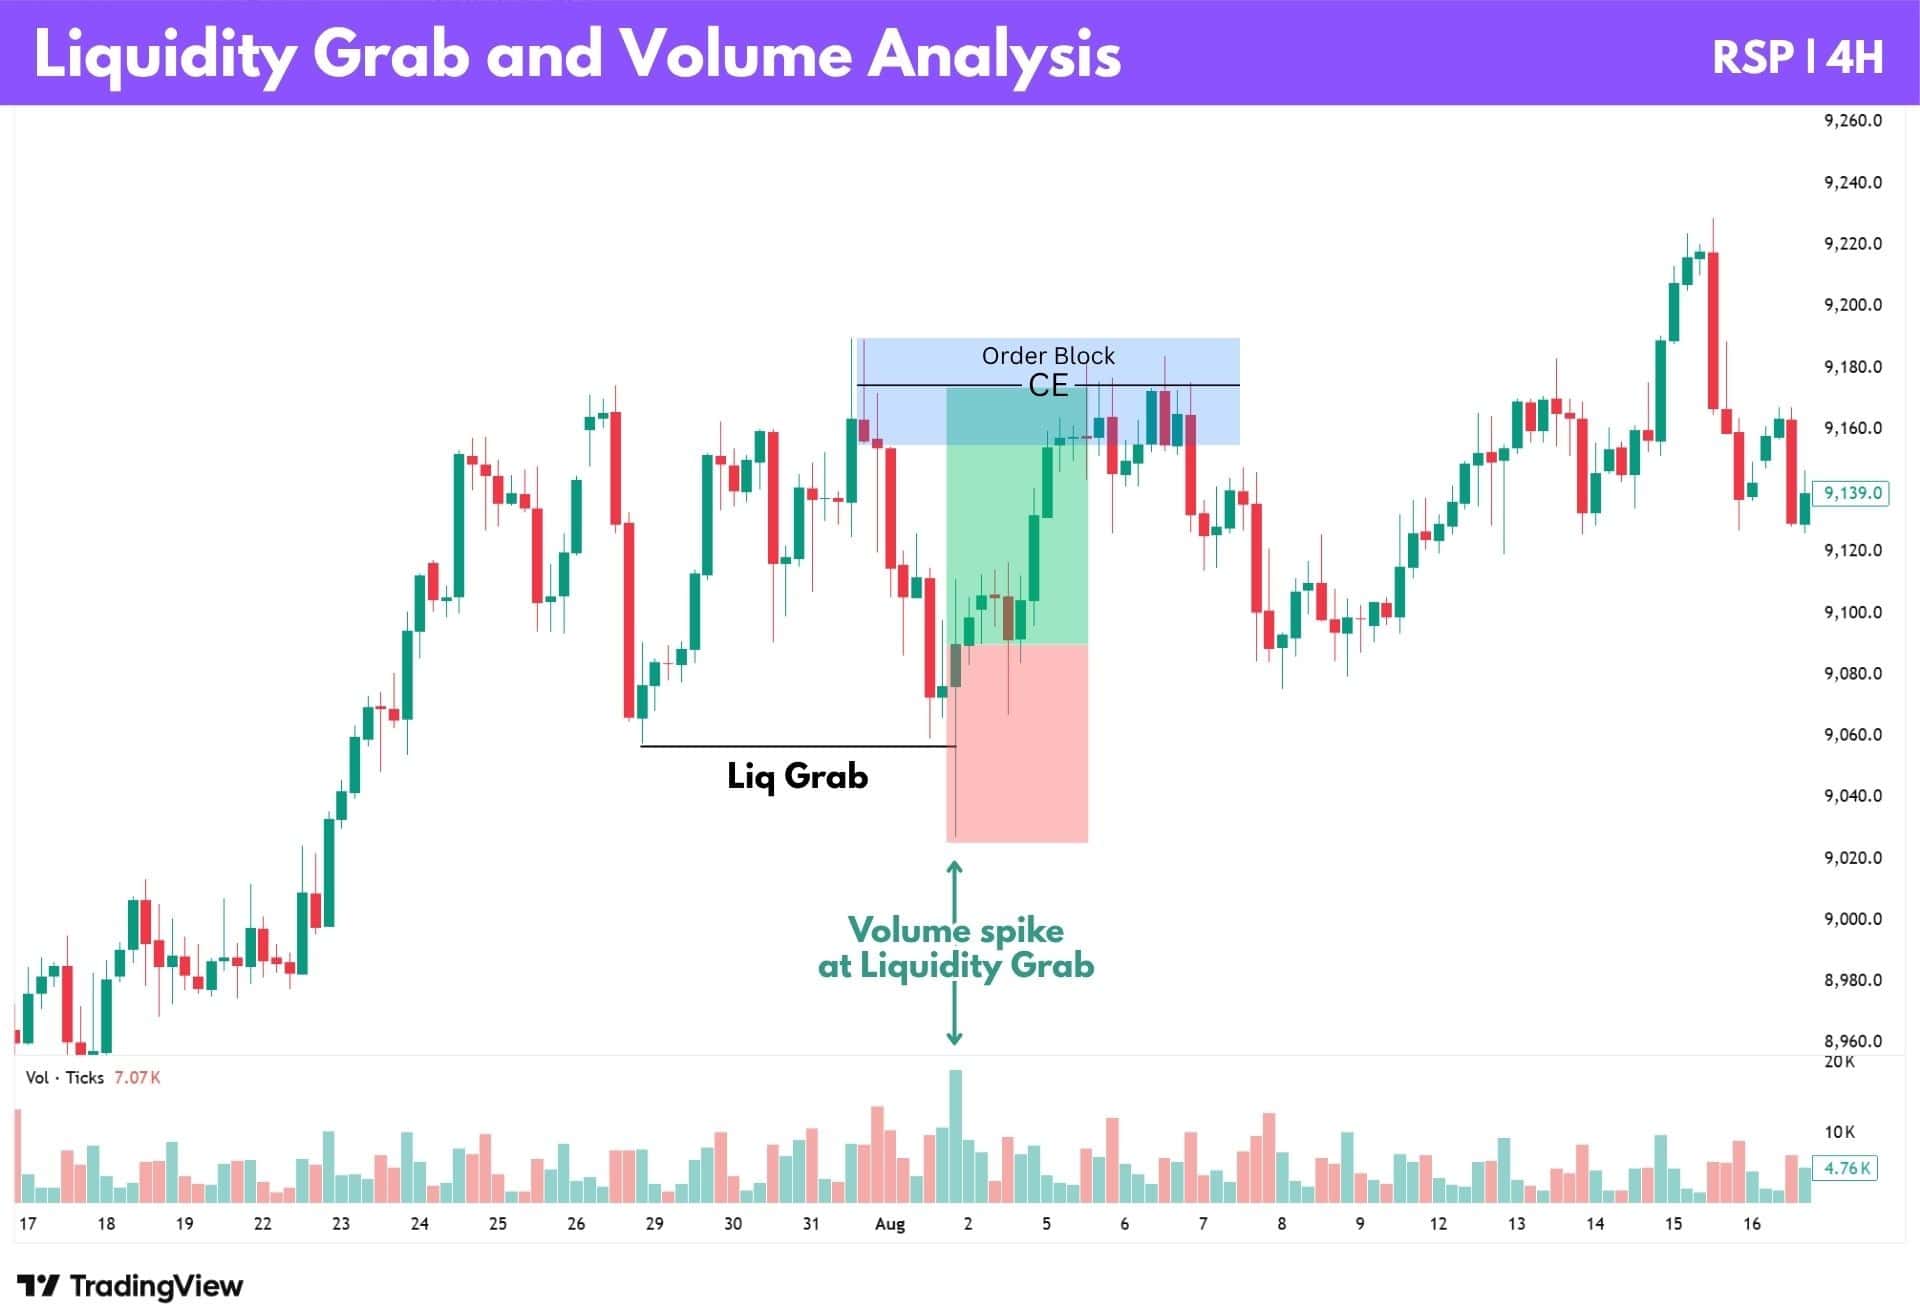
Volume Analysis
We can analyse the validity of a liquidity grab signal by looking for increased volume at the point of rejection.
A “volume spike” like this confirms that a liquidity zone has been triggered, and that a reversal is likely to follow after.
Notice in the RSP 4H chart below, that a large green volume bar occurs at the same time the price forms a liquidity grab pattern. From there onwards, price makes way to the upside, tapping perfectly into the CE of an order block.
Volume Weighted Average Price (VWAP)
The vWAP maps out the average price of an asset, but with volume included in the calculation. This makes it different from a normal moving average. If more volume was traded at a certain price, the vWAP naturally pulls closer to that area.
For intraday trading, traders often use the session vWAP. This resets at the start of each new trading day, making it useful for trading smaller timeframes, such as the 1H, 30m, 15m, or even lower.
Many traders have observed that price often returns to the vWAP during the trading session.
With this tendency in mind, we can use the vWAP as a dynamic support and resistance:
- If the price is above the vWAP, it can act as support.
- If the price is below the vWAP, it can act as resistance.
So when price returns to the vWAP and forms a liquidity grab, the signal becomes more interesting.
Price is not just reacting around a random level. It is reacting around the average price where trading activity has actually been recorded. That makes it more likely for valid liquidity zones to be nearby.
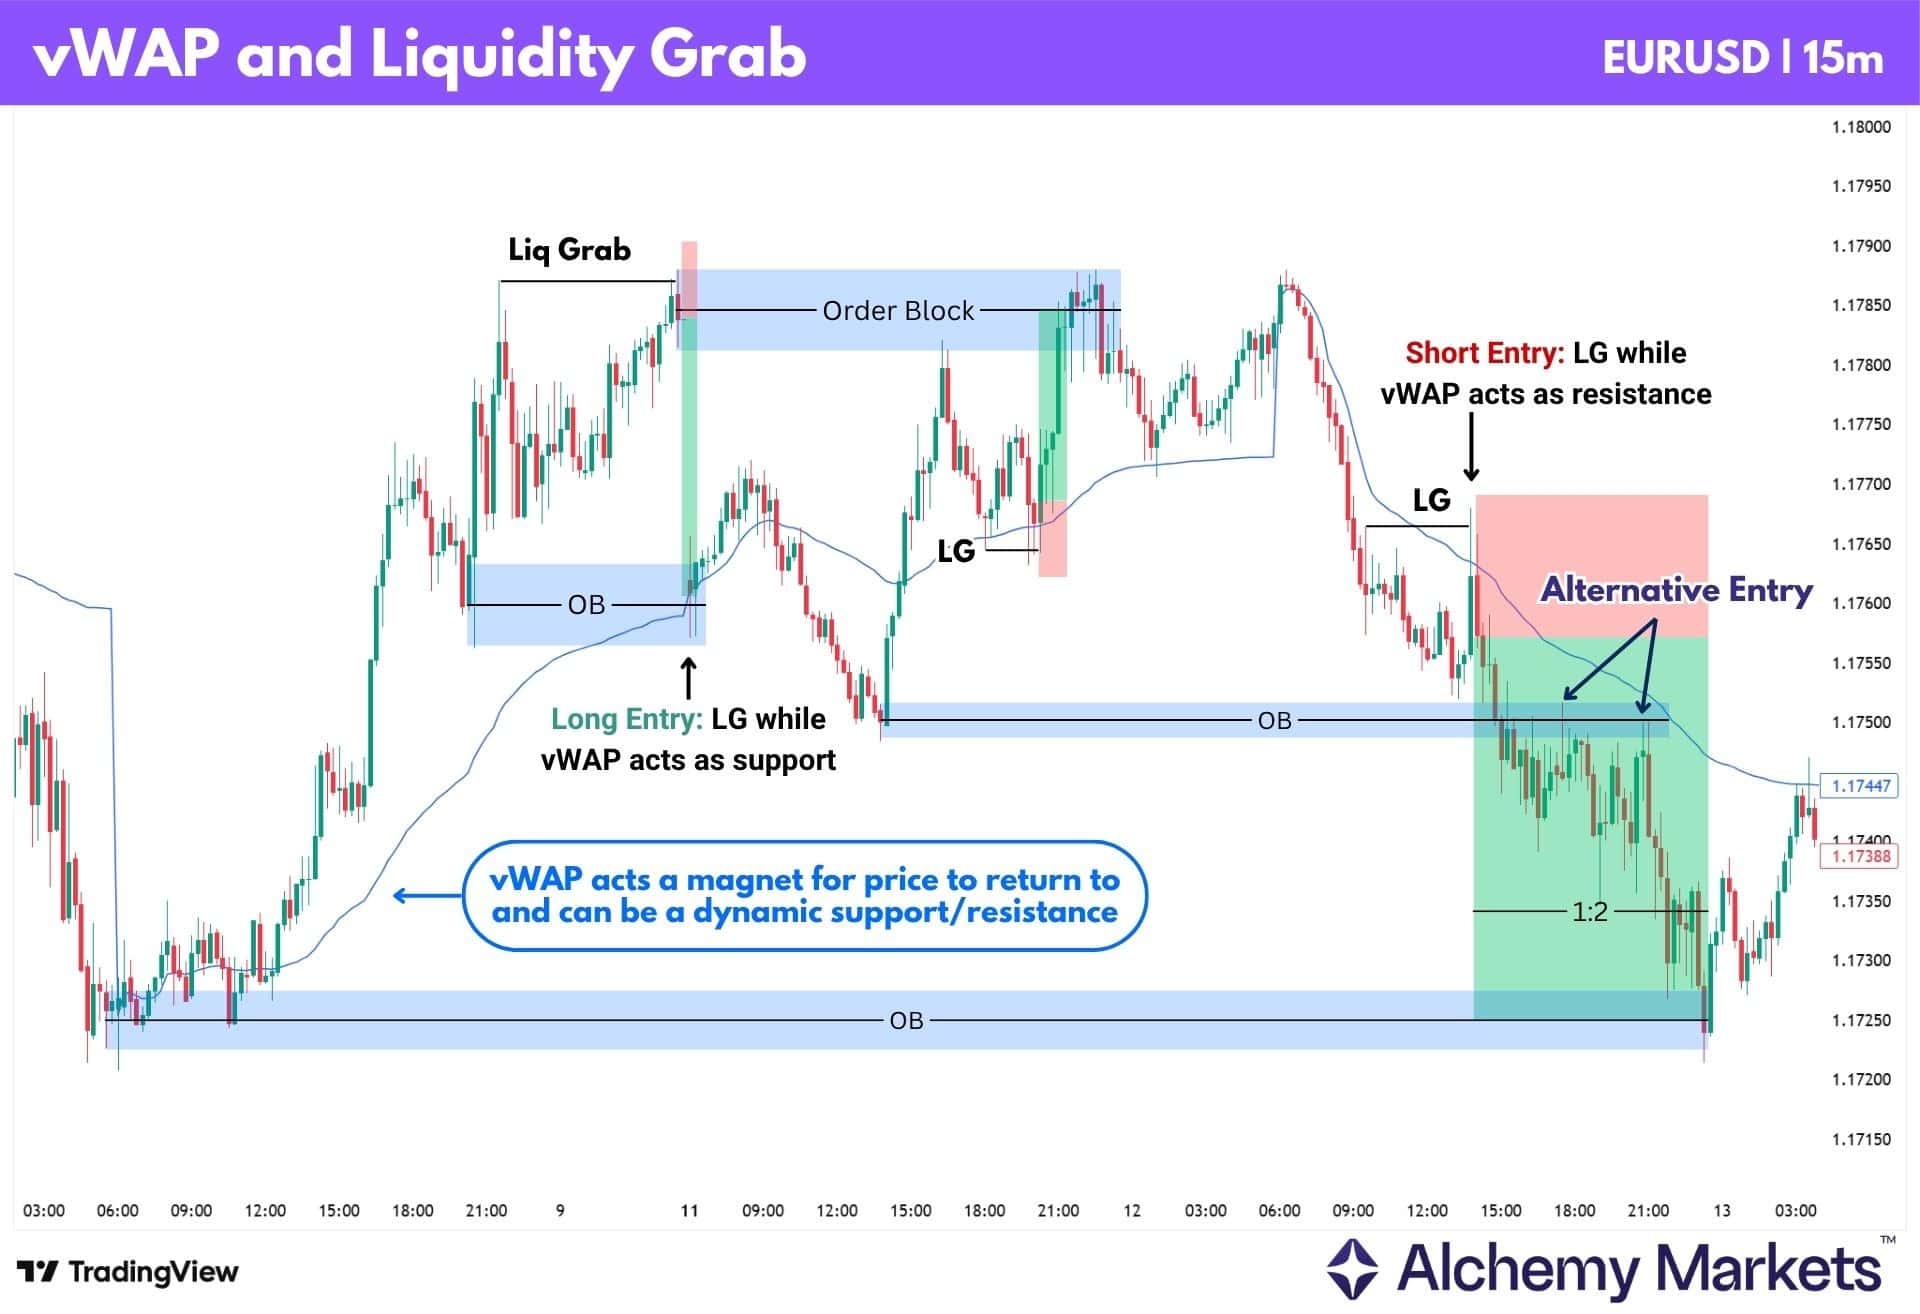
There are four main ways to use vWAP with liquidity grabs:
| i. Use it to confirm a liquidity grab when the grab forms directly around the vWAP. ii. Enter long when price tests the vWAP as support and forms a bullish liquidity grab. iii. Enter short when price rejects the vWAP as resistance and forms a bearish liquidity grab. iv. If price breaks through the vWAP to form a liquidity grab, wait for price to reclaim or reject the vWAP again in the direction of the liquidity grab. |
For take-profit targets, you can use the same support and resistance rules mentioned earlier. You can also use a mechanical 1:2 risk-to-reward setup, or take profit when price returns to the vWAP.
Relative Strength Index (RSI)
The RSI is a popular momentum indicator that shows how quickly price has been moving over the last 14 measured periods.
Since it is a momentum indicator, RSI can also be used to find divergences. This is shown in the “Fade the move” strategy section, which may add more strength to a liquidity grab signal.
However, that isn’t the focus for this section. Instead, let’s focus on another way traders can use RSI: by observing which extreme the indicator last touched. These extremes act as overstretched signals.
They tell us whether price may have moved too aggressively in one direction, creating better conditions for a possible reversal:
| Oversold: When RSI moves below 30, selling pressure may be stretched. This does not guarantee a reversal, but it tells us to start favouring bullish setups if price later grabs sell-side liquidity. Overbought: When RSI moves above 70, buying pressure may be stretched. Again, this does not guarantee a reversal, but it tells us to start favouring bearish setups if price later grabs buy-side liquidity. |
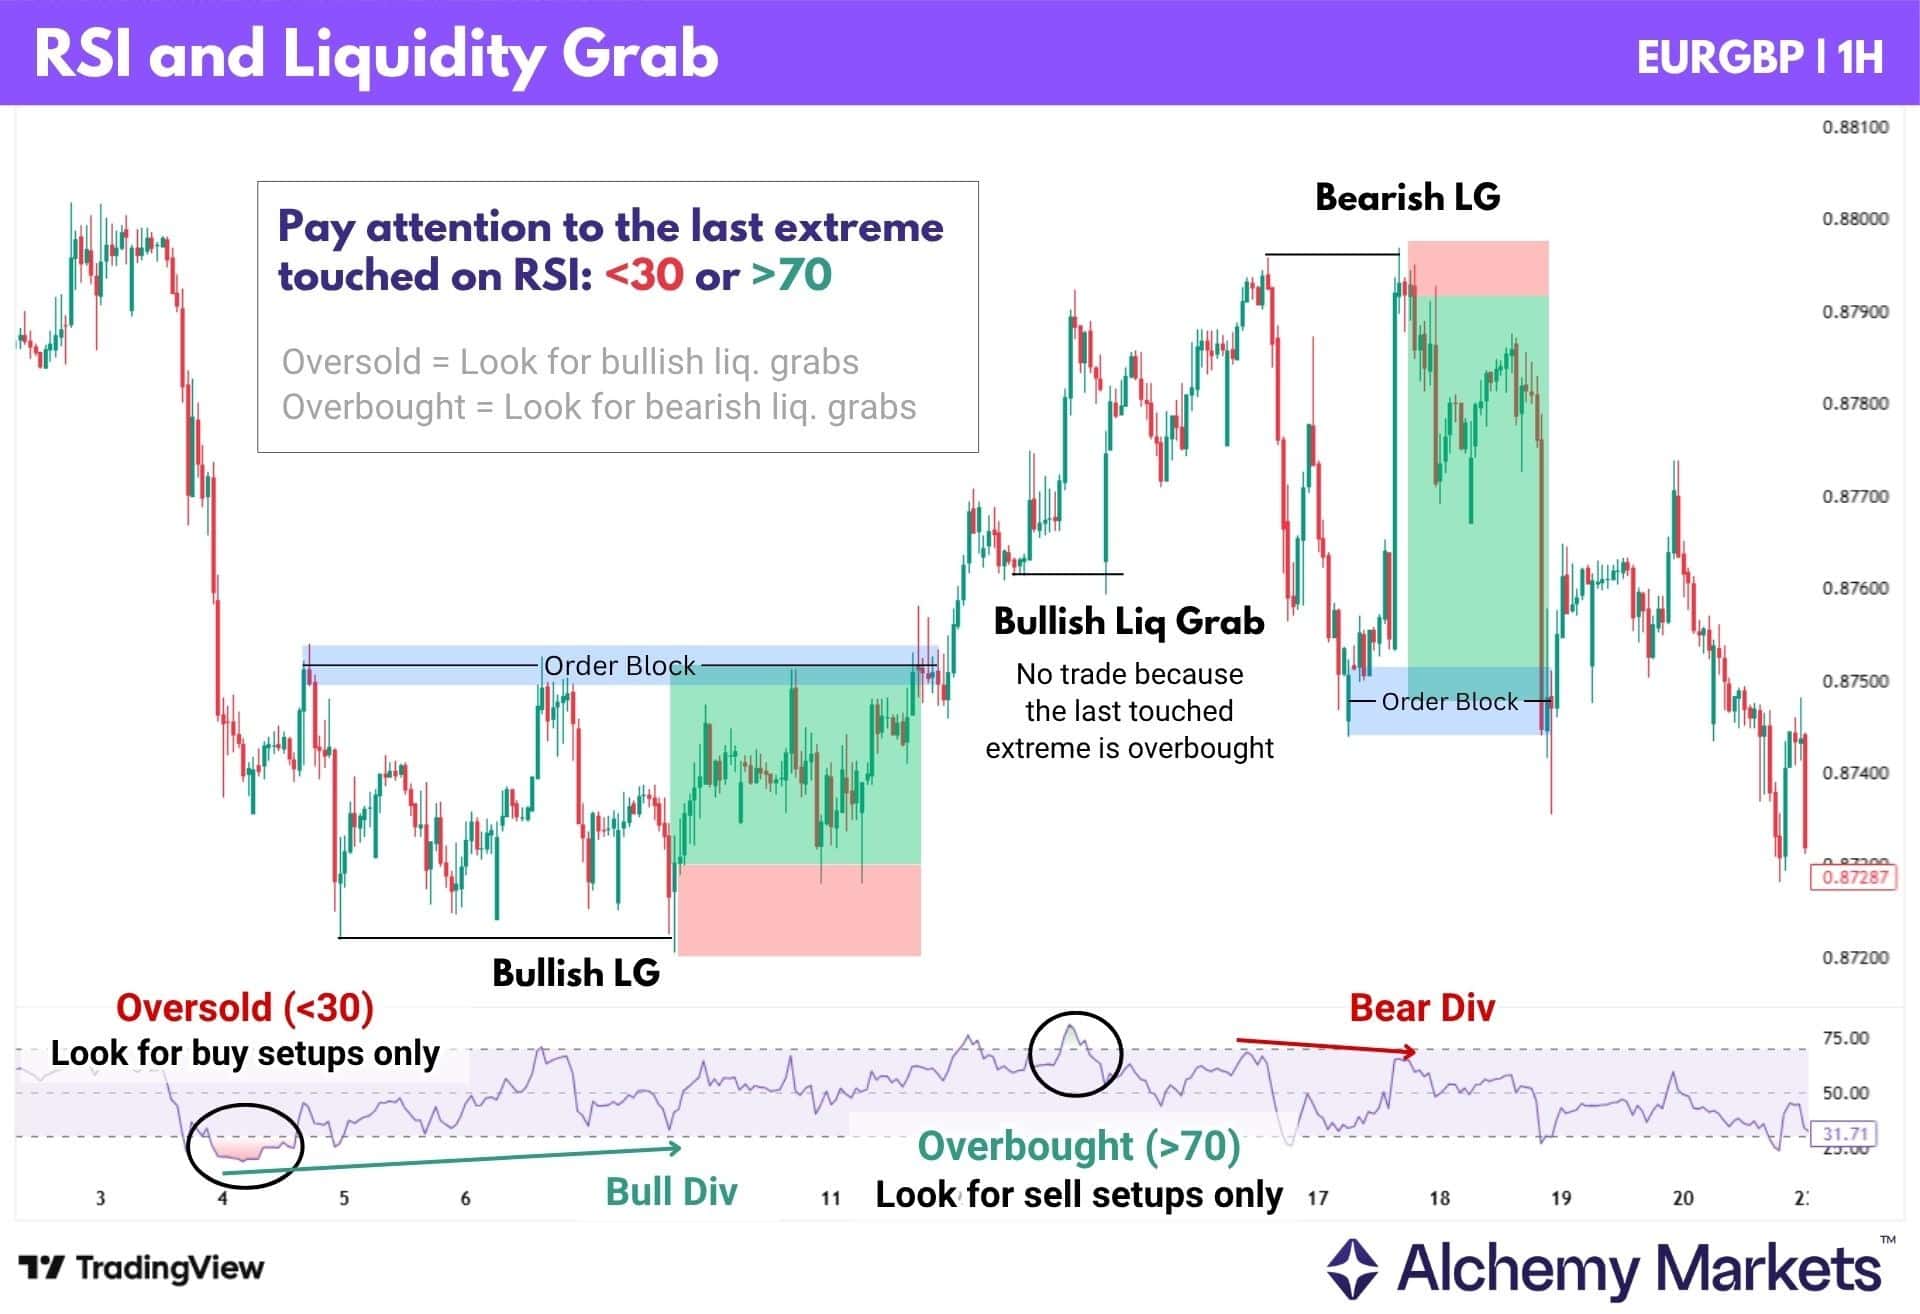
When combined with liquidity grabs, this gives traders a simple bias filter:
| i. Only trade bullish liquidity grabs if the last RSI extreme touched was oversold. ii. (Optional) Bullish divergences where the price creates a lower low but the RSI does not, add more confluence to the liquidity grab signal. iii. Only trade bearish liquidity grabs if the last RSI extreme touched was overbought. iv. (Optional) Bearish divergences where the price creates a higher high but the RSI does not, add more confluence to the liquidity grab signal. |
This helps traders avoid taking every liquidity grab blindly. For example, if price forms a bullish liquidity grab but the last RSI extreme was overbought, the setup is lower quality because the momentum backdrop still favours looking for sell-side reactions instead.
The RSI is not the entry signal by itself. It simply helps decide which side of the market deserves more attention.
Moving Average Convergence Divergence (MACD)
The MACD is a momentum indicator that can show short-term momentum through its histogram bars, while the MACD line and signal line can help confirm broader momentum shifts.
As mentioned in the Fade the Move strategy, traders can use momentum divergences to add strength to a liquidity grab setup. The MACD can do this too, especially when the histogram forms a divergence against price.
However, the MACD’s main advantage is that it can give extra confirmation after the liquidity grab has already formed. This can make entries later, but it may also help filter out weaker liquidity grabs that have not fully reversed yet.
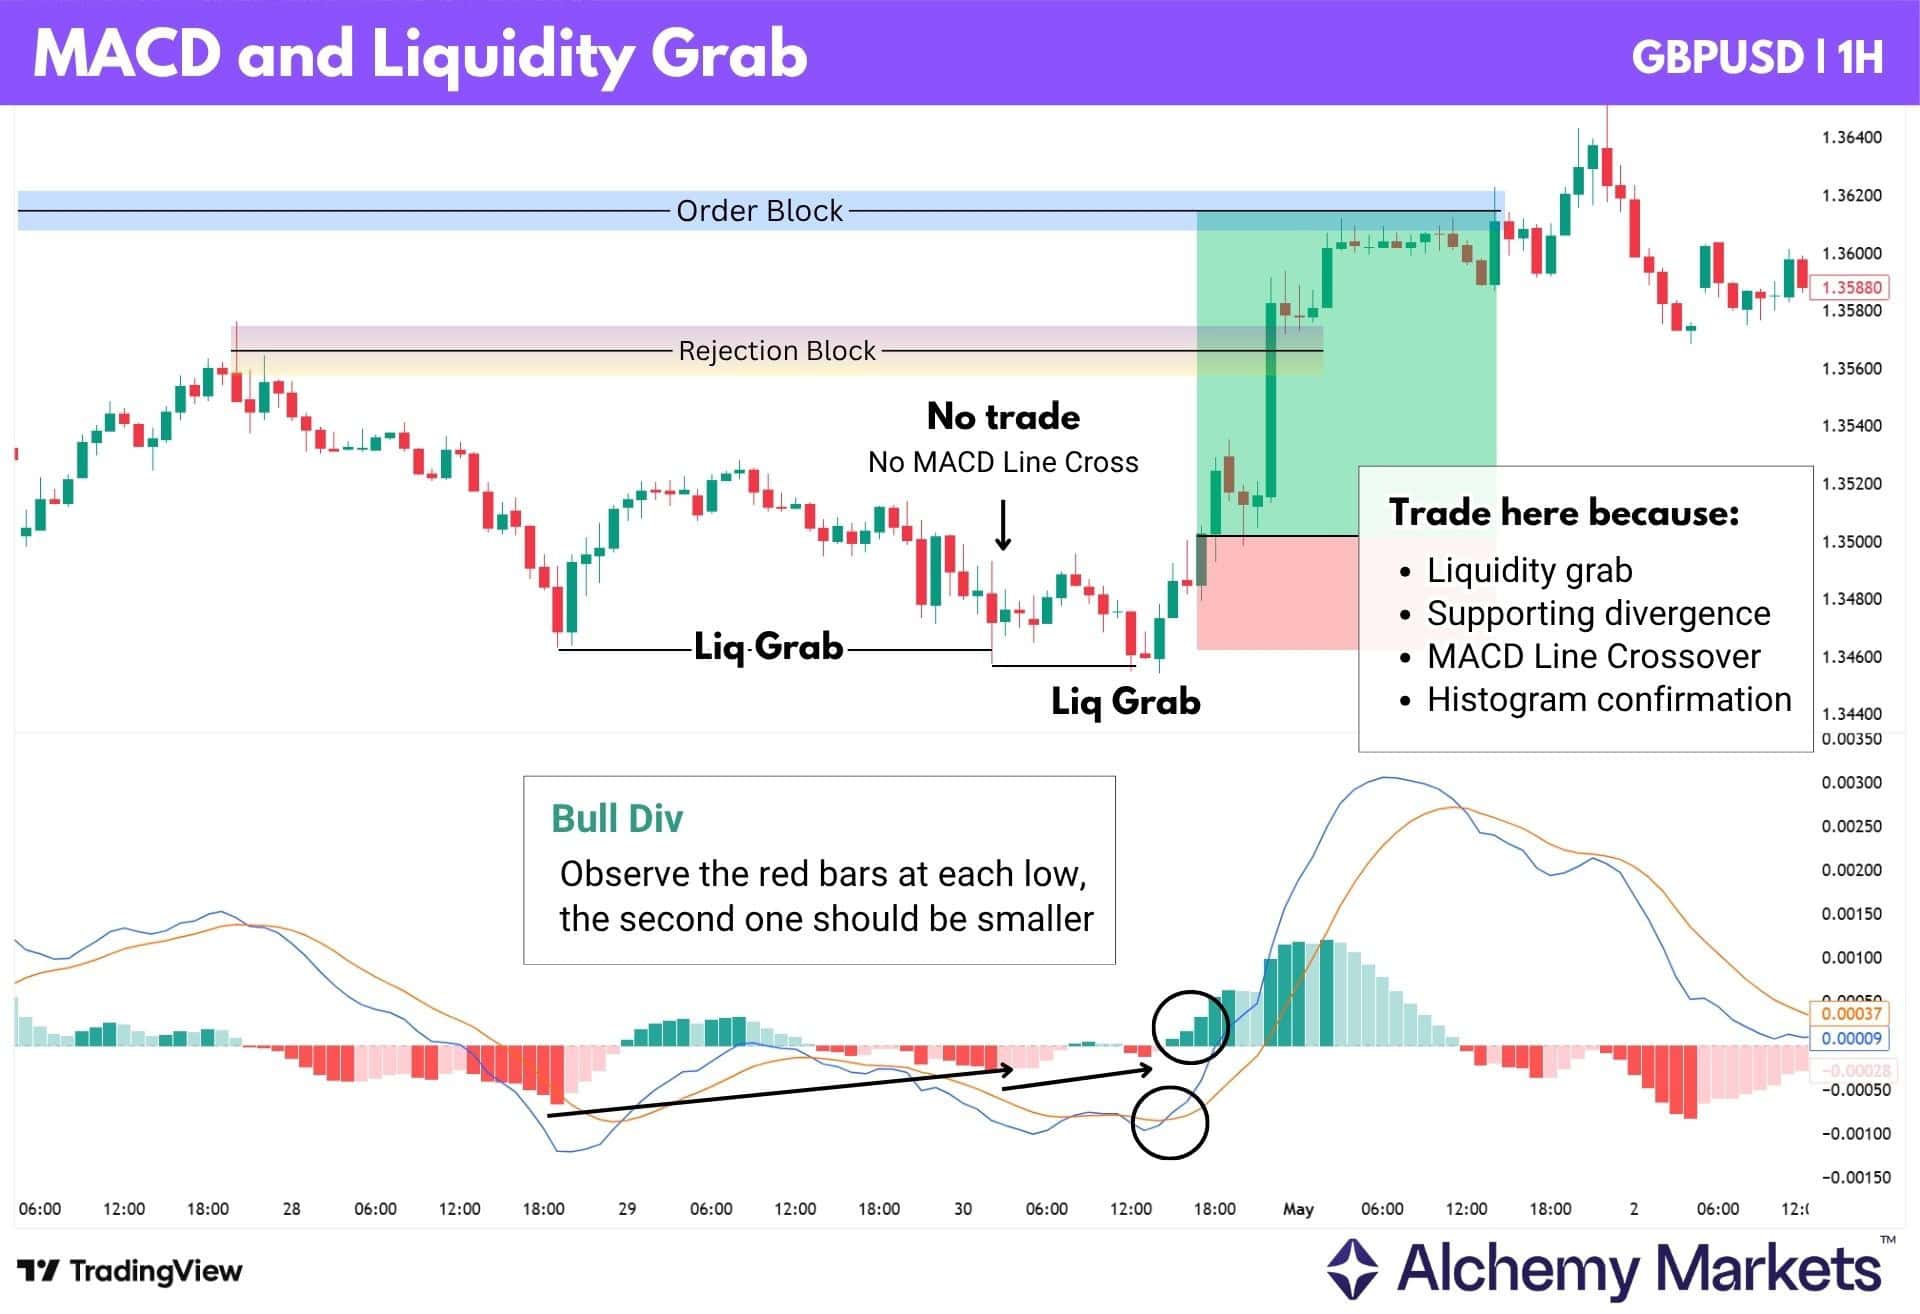
In the example above, price forms two bullish liquidity grabs. The first grab has some bullish divergence on the MACD histogram, but the MACD line has not crossed above the signal line yet. This makes the setup weaker, and price continues to push lower.
The second liquidity grab is cleaner because it has more confirmation:
| i. Price grabs sell-side liquidity. ii. The MACD histogram shows bullish divergence. iii. The MACD line crosses above the signal line. iv. The histogram starts supporting the bullish reversal. |
This makes the trade stronger than entering purely on the liquidity grab alone, at the expense of fewer trade signals.
Take-profit targets can use the same support and resistance rules mentioned earlier, such as order blocks, rejection blocks, fair value gaps, or a mechanical 1:2 risk-to-reward setup.
Bollinger Bands
Bollinger Bands® are used to identify when price may be overextended, consolidating, or reverting back toward its average.
The middle line shows the average price, while the upper and lower bands are usually plotted two standard deviations away from that average.
When price reaches the outer bands, it signals favourable conditions for a pause or reversal. But, the cherry on top is when price moves completely outside the bands, it suggests the move may be even more overextended.
We can use this logic to filter out weak and strong liquidity grabs. For example, if a liquidity grab happens after, or as the price shifts outside of the bands, we can regard that as a stronger signal for trading.
For this strategy, we recommend testing the 30m timeframe with a 50 SMA or 50 EMA and 2 standard deviation bands.
The 50-period average is balanced because it smooths out some noise without reacting too slowly. Traders can also test other common settings, such as 20, 100, or 200, depending on how fast or slow they want the bands to react.
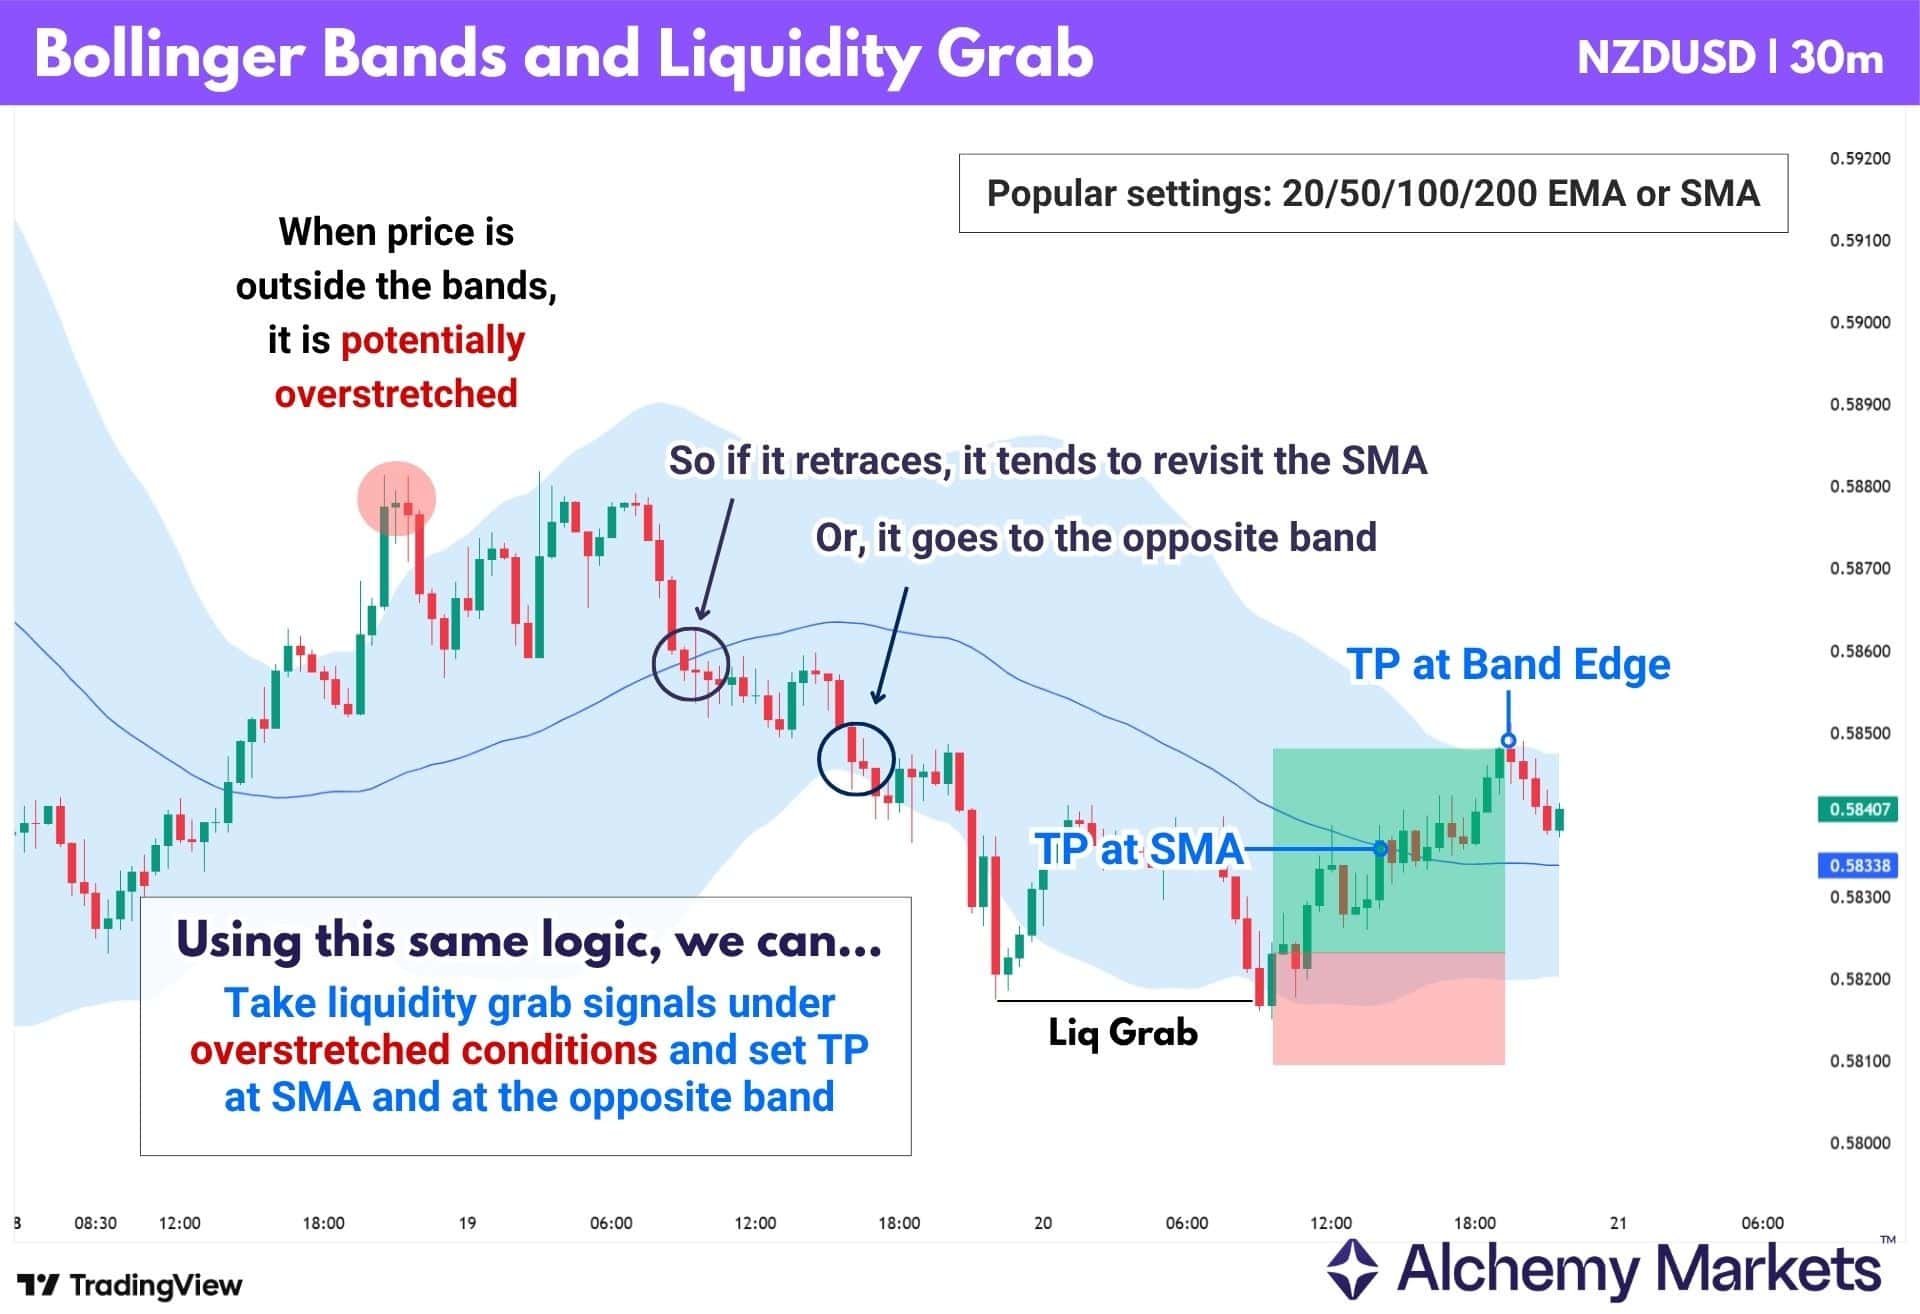
The setup is simple:
| i. Price moves outside the outer band. ii. Price grabs liquidity beyond a swing high or swing low. iii. Price closes back inside the band. iv. Traders look for a retracement back toward the moving average, or the opposite band. |
For take-profit targets, traders can use the middle moving average first. If momentum continues, the opposite band or nearby PD arrays can be used as further targets. This follows the same support and resistance rules mentioned earlier.
Trade with Liquidity and FVG
Fair Value Gaps, or FVG, forms when price moves so impulsively in one direction that it leaves a gap across three candles.
In SMC theory, price often returns to the FVG because resting orders may still be sitting around that imbalance. This can turn the FVG into a useful retracement area, where price may gather liquidity before continuing its impulsive move.
When using FVGs with liquidity grabs, the goal is not to enter as soon as the liquidity grab appears. Instead, wait for a FVG to first appear to confirm that there is enough force behind a liquidity grab to generate a meaningful reversal.
This combination of SMC theories can help us find better trade setups, if utilised correctly.
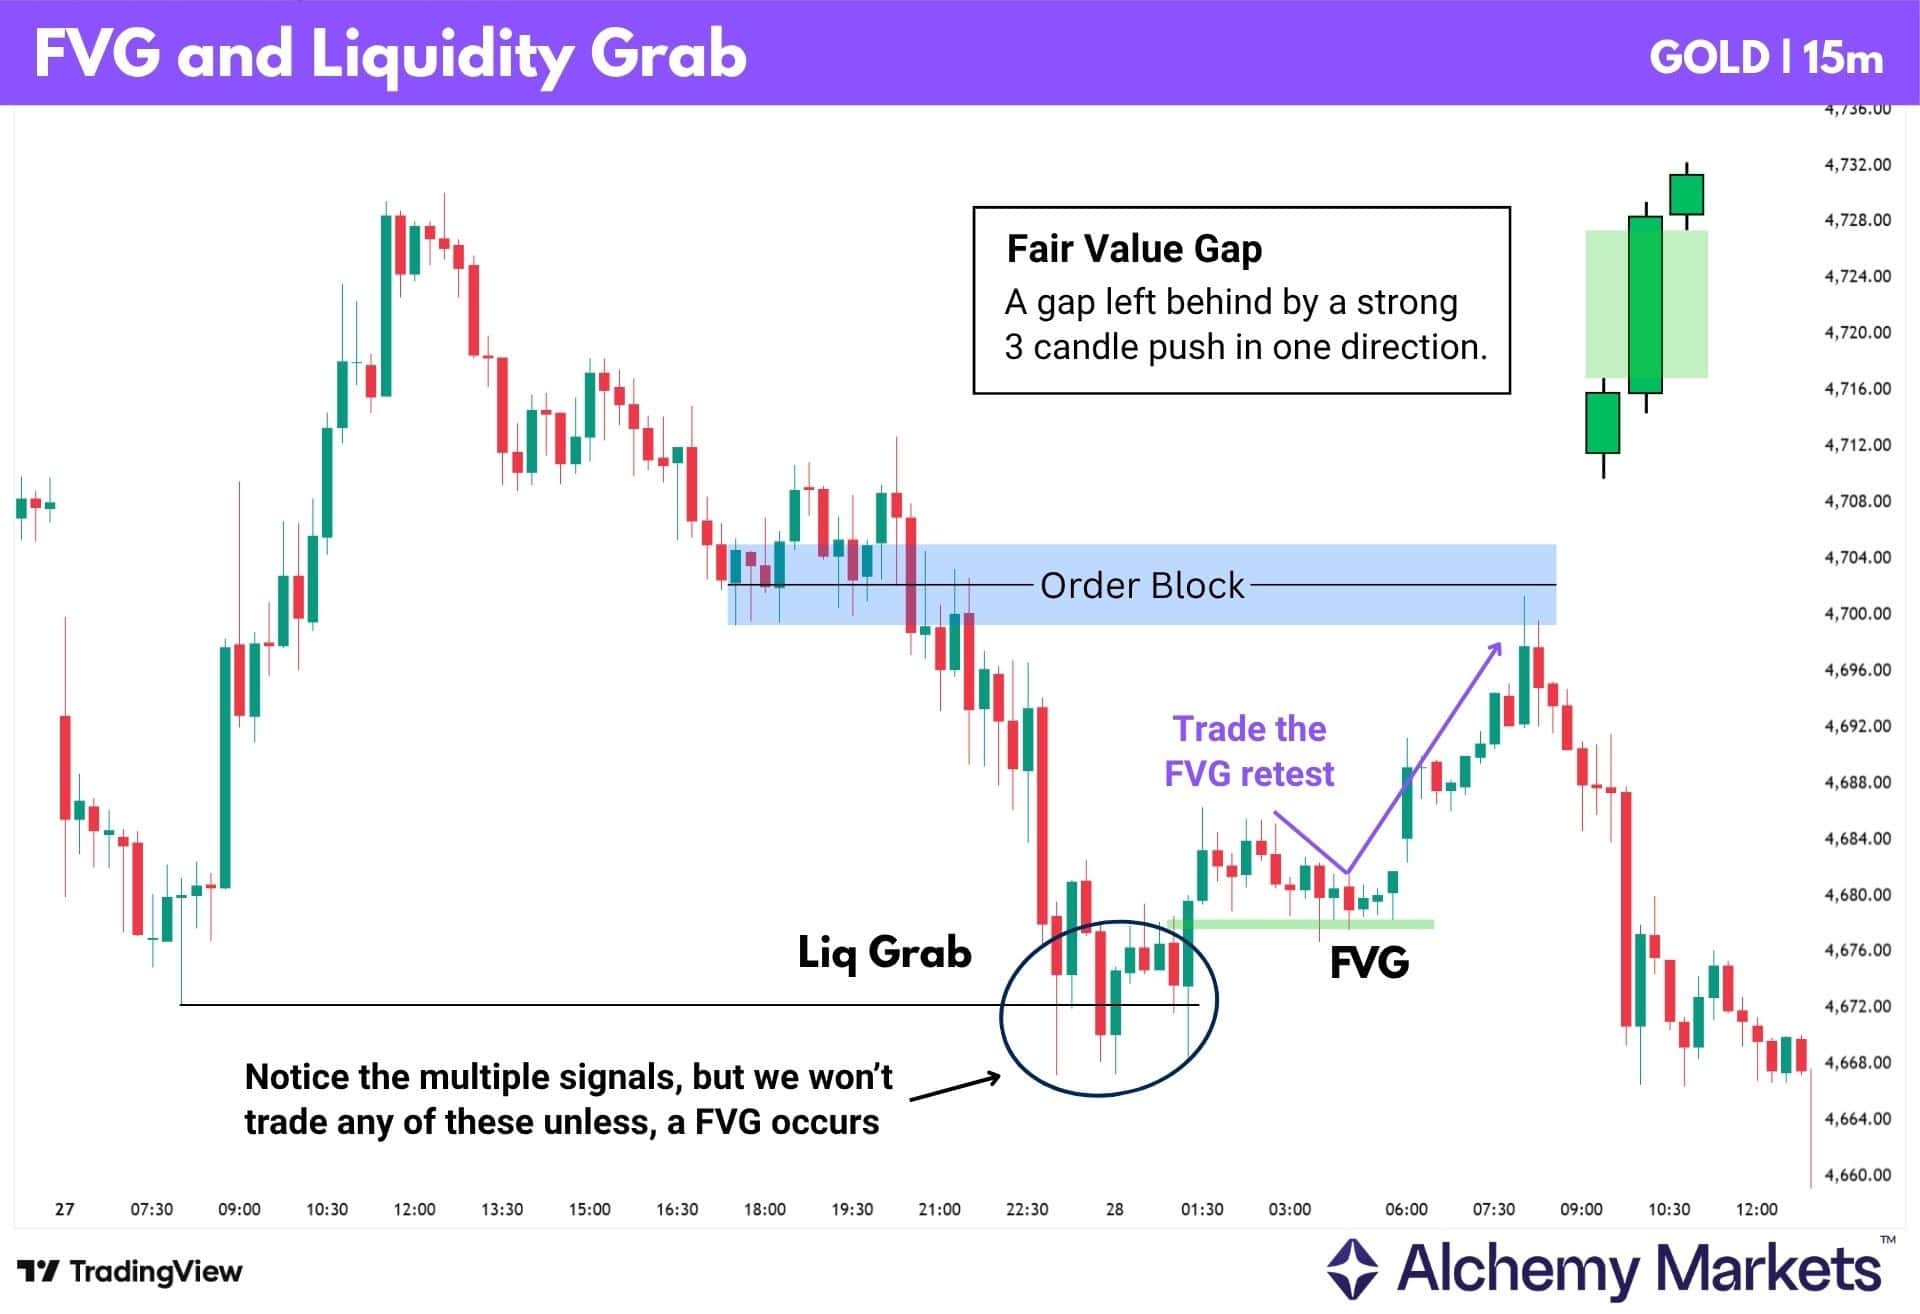
The sequence is simple:
| i. Price grabs liquidity below a swing low or above a swing high. ii. Price rejects the level and moves away strongly. iii. That strong move creates an FVG. iv. Traders wait for price to retrace into the FVG before entering a trade. |
So basically, the FVG does two jobs here. First, it confirms that the liquidity grab had strength behind it. Then, it gives traders a clean entry zone once price refills the gap.
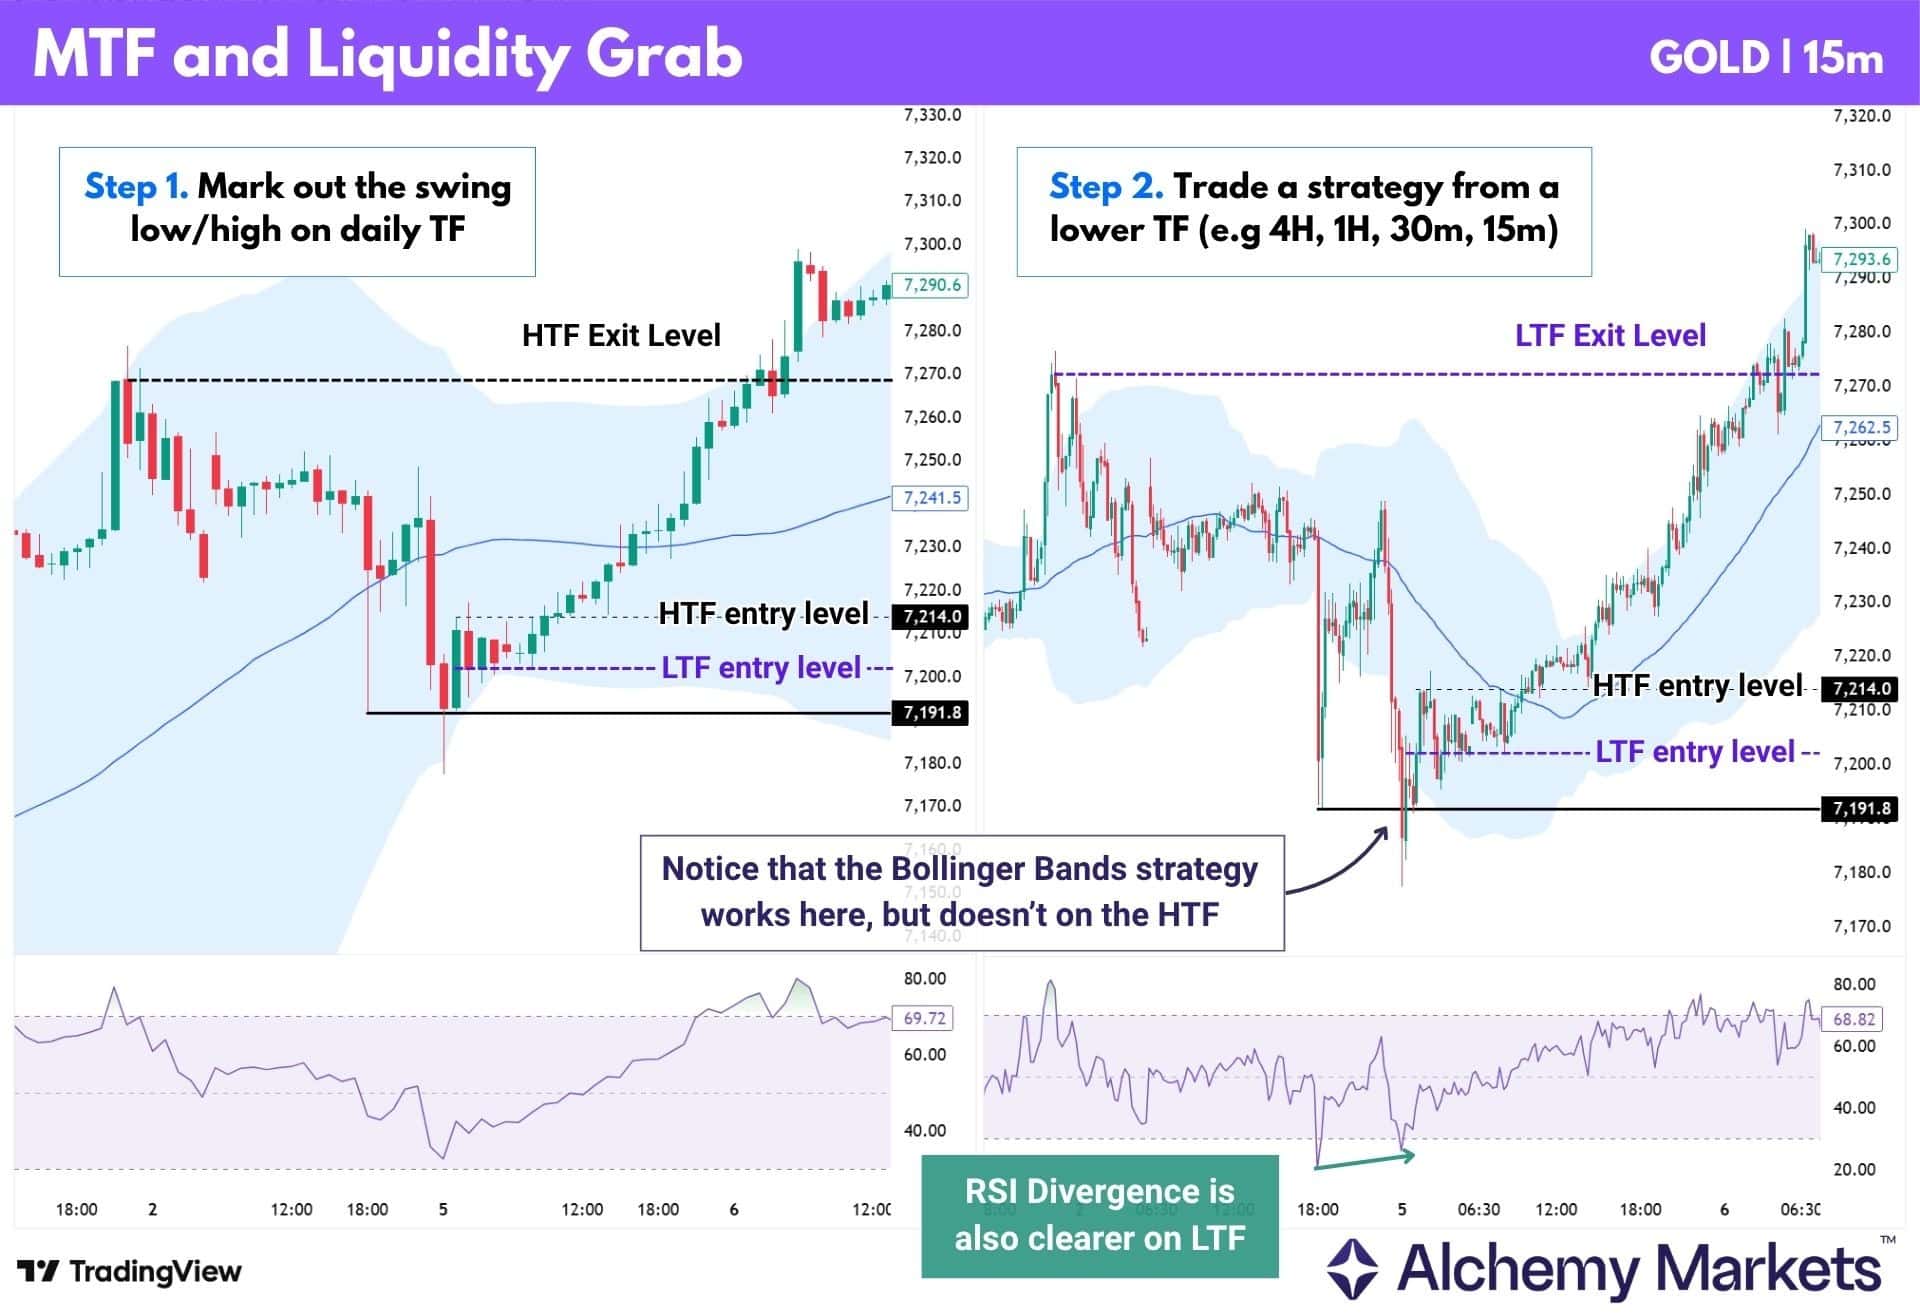
The Multi-Timeframe Approach
Multi-timeframe approach means using a higher timeframe to find important levels, then using a lower timeframe to find the cleaner entry.
This works well with liquidity grabs because higher timeframe swing highs, swing lows, and PD arrays usually hold more significance. However, the actual setup may not always look clean on the higher timeframe candle.
So sometimes, it’s the lower timeframes that will help us find those setups in a more obvious way, often with better risk to reward.
Notice how this is immediately clear in the example below, where Gold has a liquidity grab on a HTF level (Daily), but does not have clear confirmation signals unless you drop to a lower timeframe (15m).
The sequence is simple:
| i. Mark the key swing high, swing low, or PD array on the higher timeframe. ii. Drop to a lower timeframe. iii. Wait for a liquidity grab to form around that higher timeframe level. iv. Use confirmation tools like RSI, Bollinger Bands®, MACD, or FVGs to time the entry. v. Use higher timeframe levels as take-profit targets. |
So basically, the higher timeframe gives the trade its location, while the lower timeframe gives the trade its timing.
This helps traders avoid reacting to random lower timeframe wicks, while still getting a cleaner entry than waiting for the higher timeframe candle to fully close.
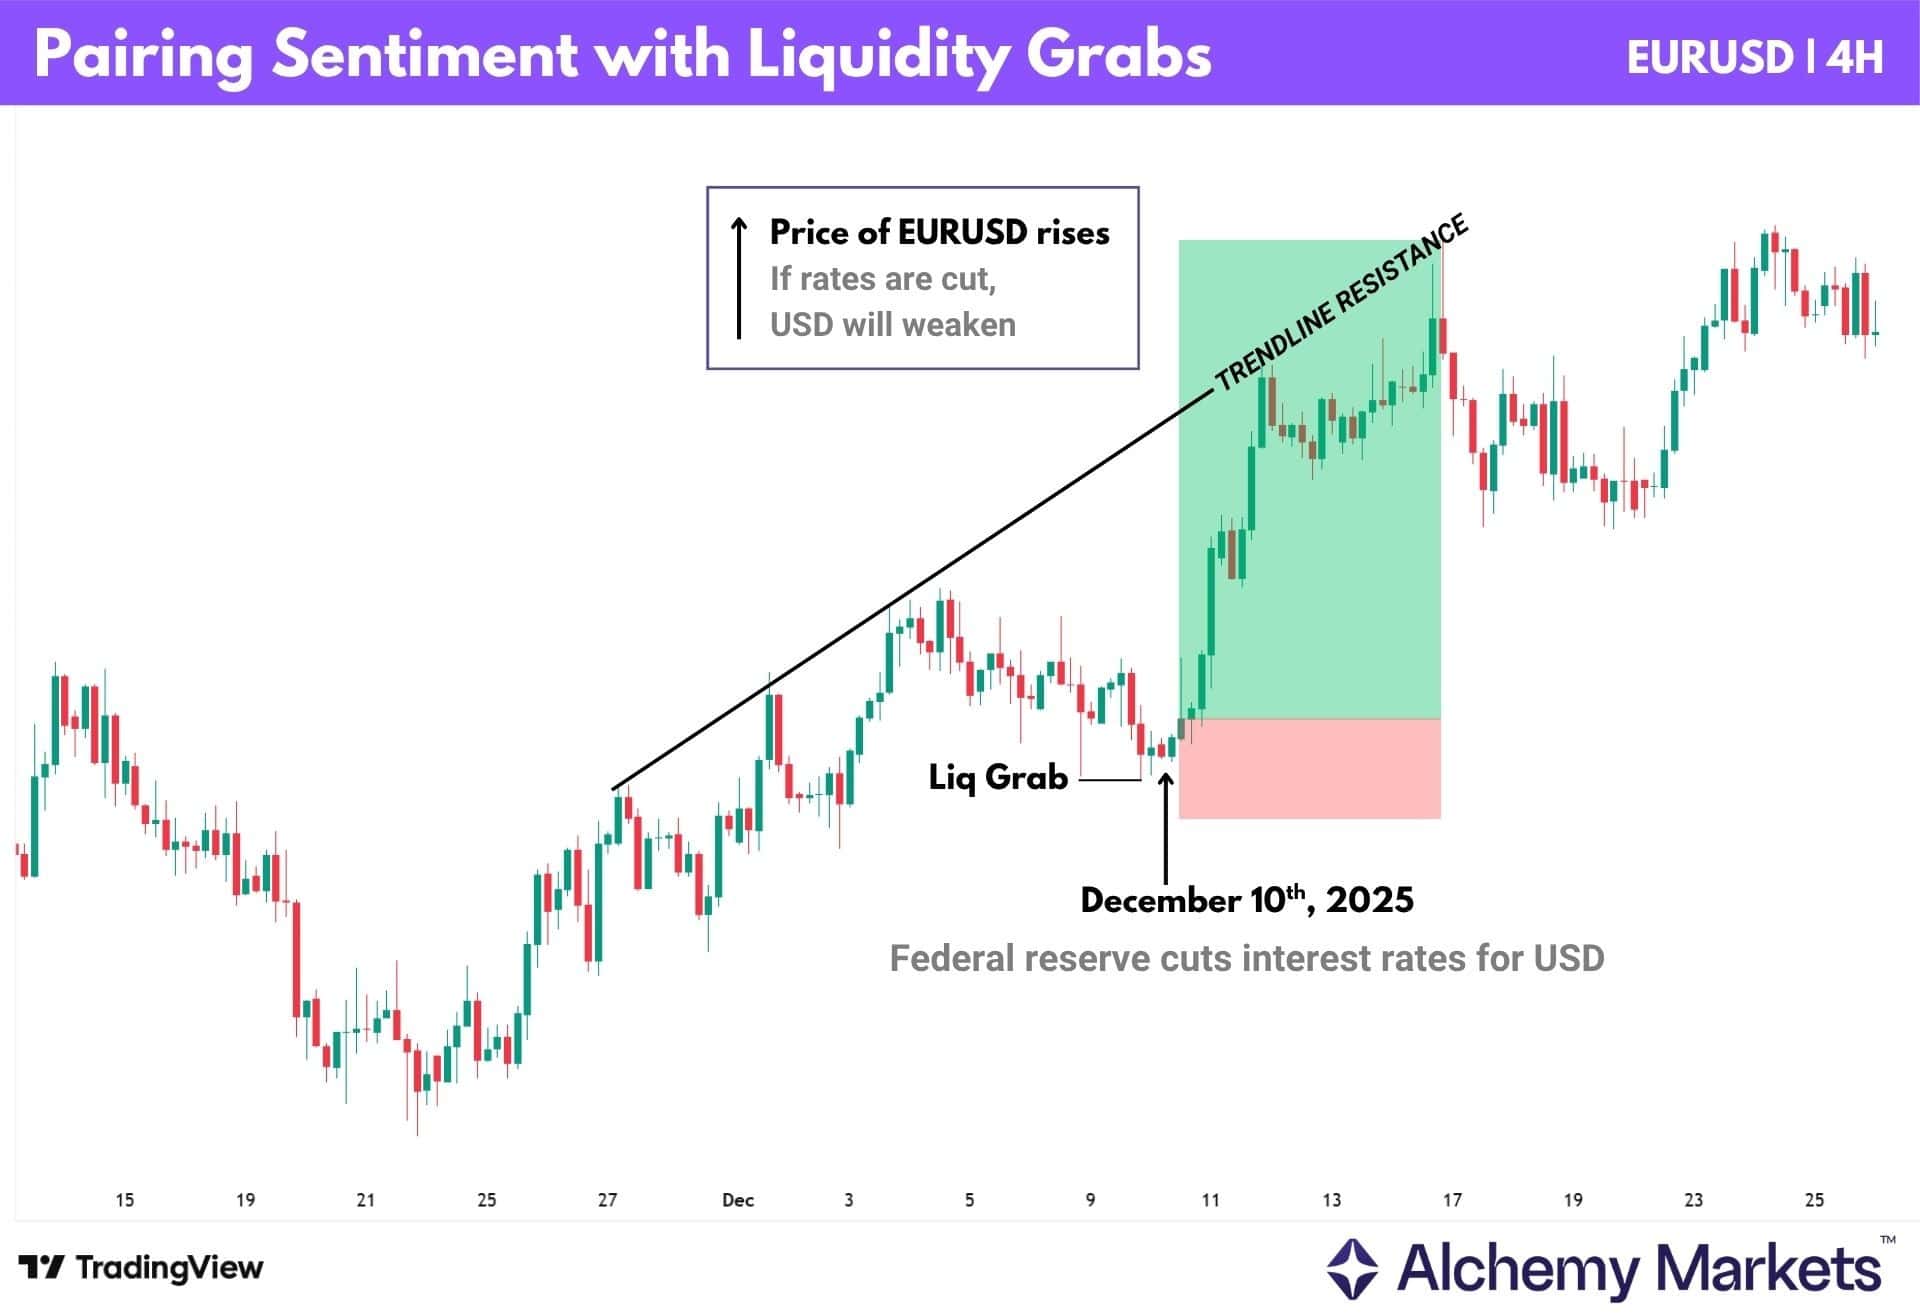
The Sentiment Overlay
The sentiment overlay means checking whether the broader market mood supports or weakens a liquidity grab.
This is especially useful around major events like FOMC meetings, where one decision can shift the US dollar, gold, indices, bond yields, and major FX pairs at the same time.
| For example, after the December 2025 FOMC meeting, the Fed cut rates by 25 bps to a 3.50% to 3.75% target range. After the decision, it is reported that stocks rose while Treasury yields and the US dollar fell. |
In that kind of environment, bullish liquidity grabs may have stronger context, because sentiment is already leaning toward lower yields and a weaker US dollar. On the other hand, bearish liquidity grabs on EUR/USD may need stronger confirmation, because the trade is fighting the broader FOMC reaction.
This is why sentiment matters: it helps traders decide whether the liquidity grab is aligned with the wider market mood, or whether it is going against it.
The sequence is simple:
| i. Price forms a liquidity grab. ii. Check whether the FOMC reaction supports or fights the reversal. This can happen before or after the liquidity grab. iii. Avoid fading the move if the broader sentiment is strongly against the trade. iv. Only take the setup if the price still holds after the market digests the news. |
So basically, sentiment helps traders avoid trading liquidity grabs in isolation. The liquidity grab shows the technical signal, while the FOMC reaction tells us whether the wider market mood gives that signal room to follow through.
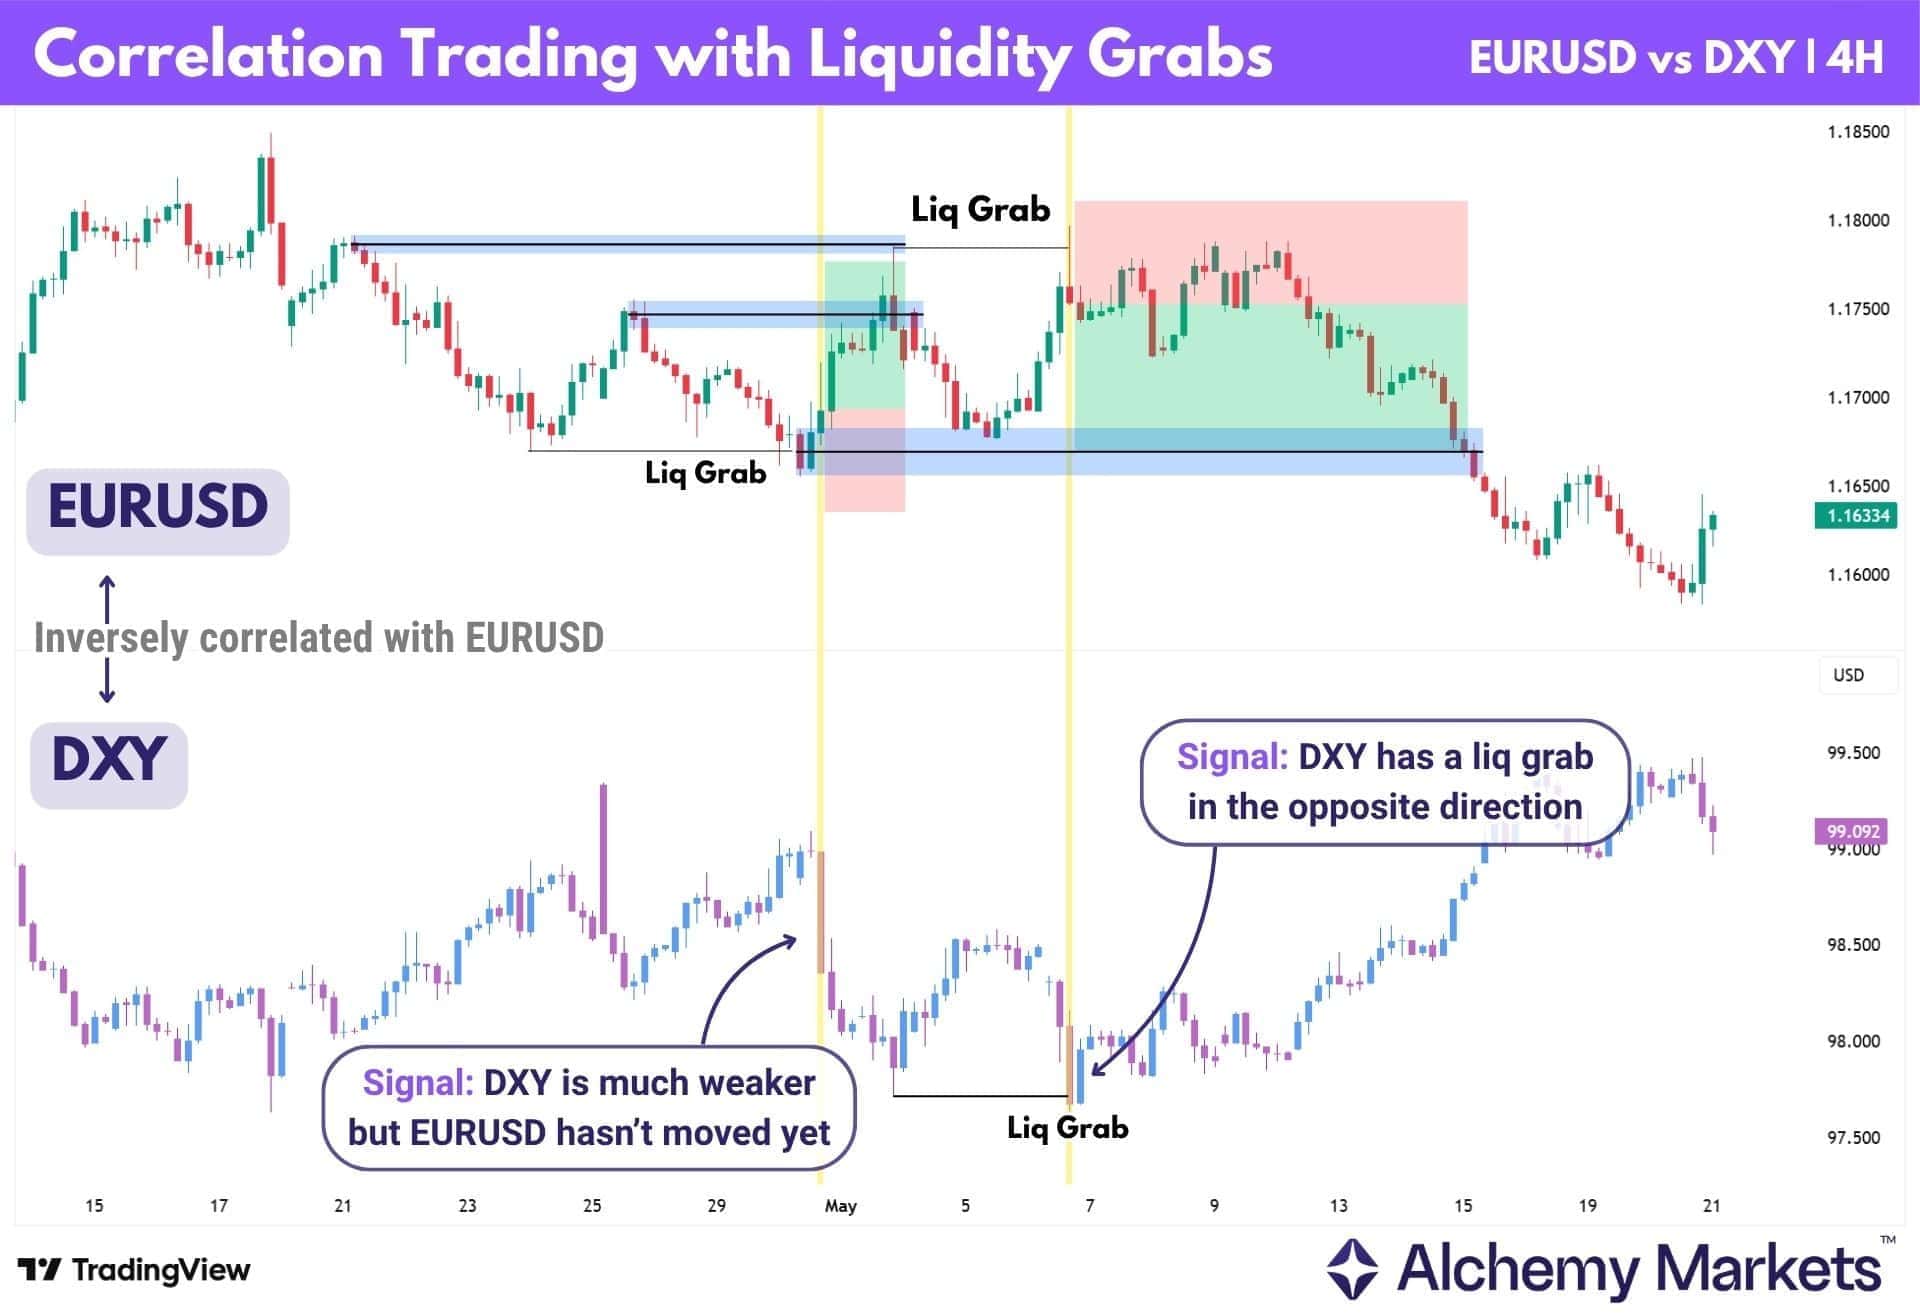
The Correlation Game
The Correlation Game means checking whether related markets support the liquidity grab setup.
Some markets naturally move against or alongside each other. For example, EUR/USD often moves opposite to the US Dollar Index, while gold is often sensitive to the US dollar and bond yields.
This can help traders avoid taking liquidity grabs in isolation:
| Eg. If EUR/USD forms a bullish liquidity grab while the US Dollar Index is rejecting from resistance, the setup has better context. But if the dollar is still pushing strongly higher, that bullish EUR/USD setup may need stronger confirmation. |
The sequence is simple:
| i. Price forms a liquidity grab on the main chart. ii. Check a related market. iii. See whether the related market supports or fights the reversal. iv. Only take the trade if the correlation does not strongly contradict the setup. |
So basically, correlation helps traders check whether the liquidity grab is part of a wider market move, or just a weak signal on one chart.
The Follow Strategy: When to Follow the Breakout Instead
What can make traders more successful with liquidity grabs is knowing when to stop fading the move and start following it.
As explained earlier, liquidity runs happen when price breaks through a key level, holds beyond it, and continues in the breakout direction. This is where price action needs to come first. If price rejects the level, it may still be treated as a liquidity grab.
But if price accepts beyond the level, the better trade may be to follow the run instead.
New FVGs, breaker blocks, mitigation blocks, or a clean break through an existing PD array can all help confirm that strength. A retest of the broken level is ideal, but it does not always happen.
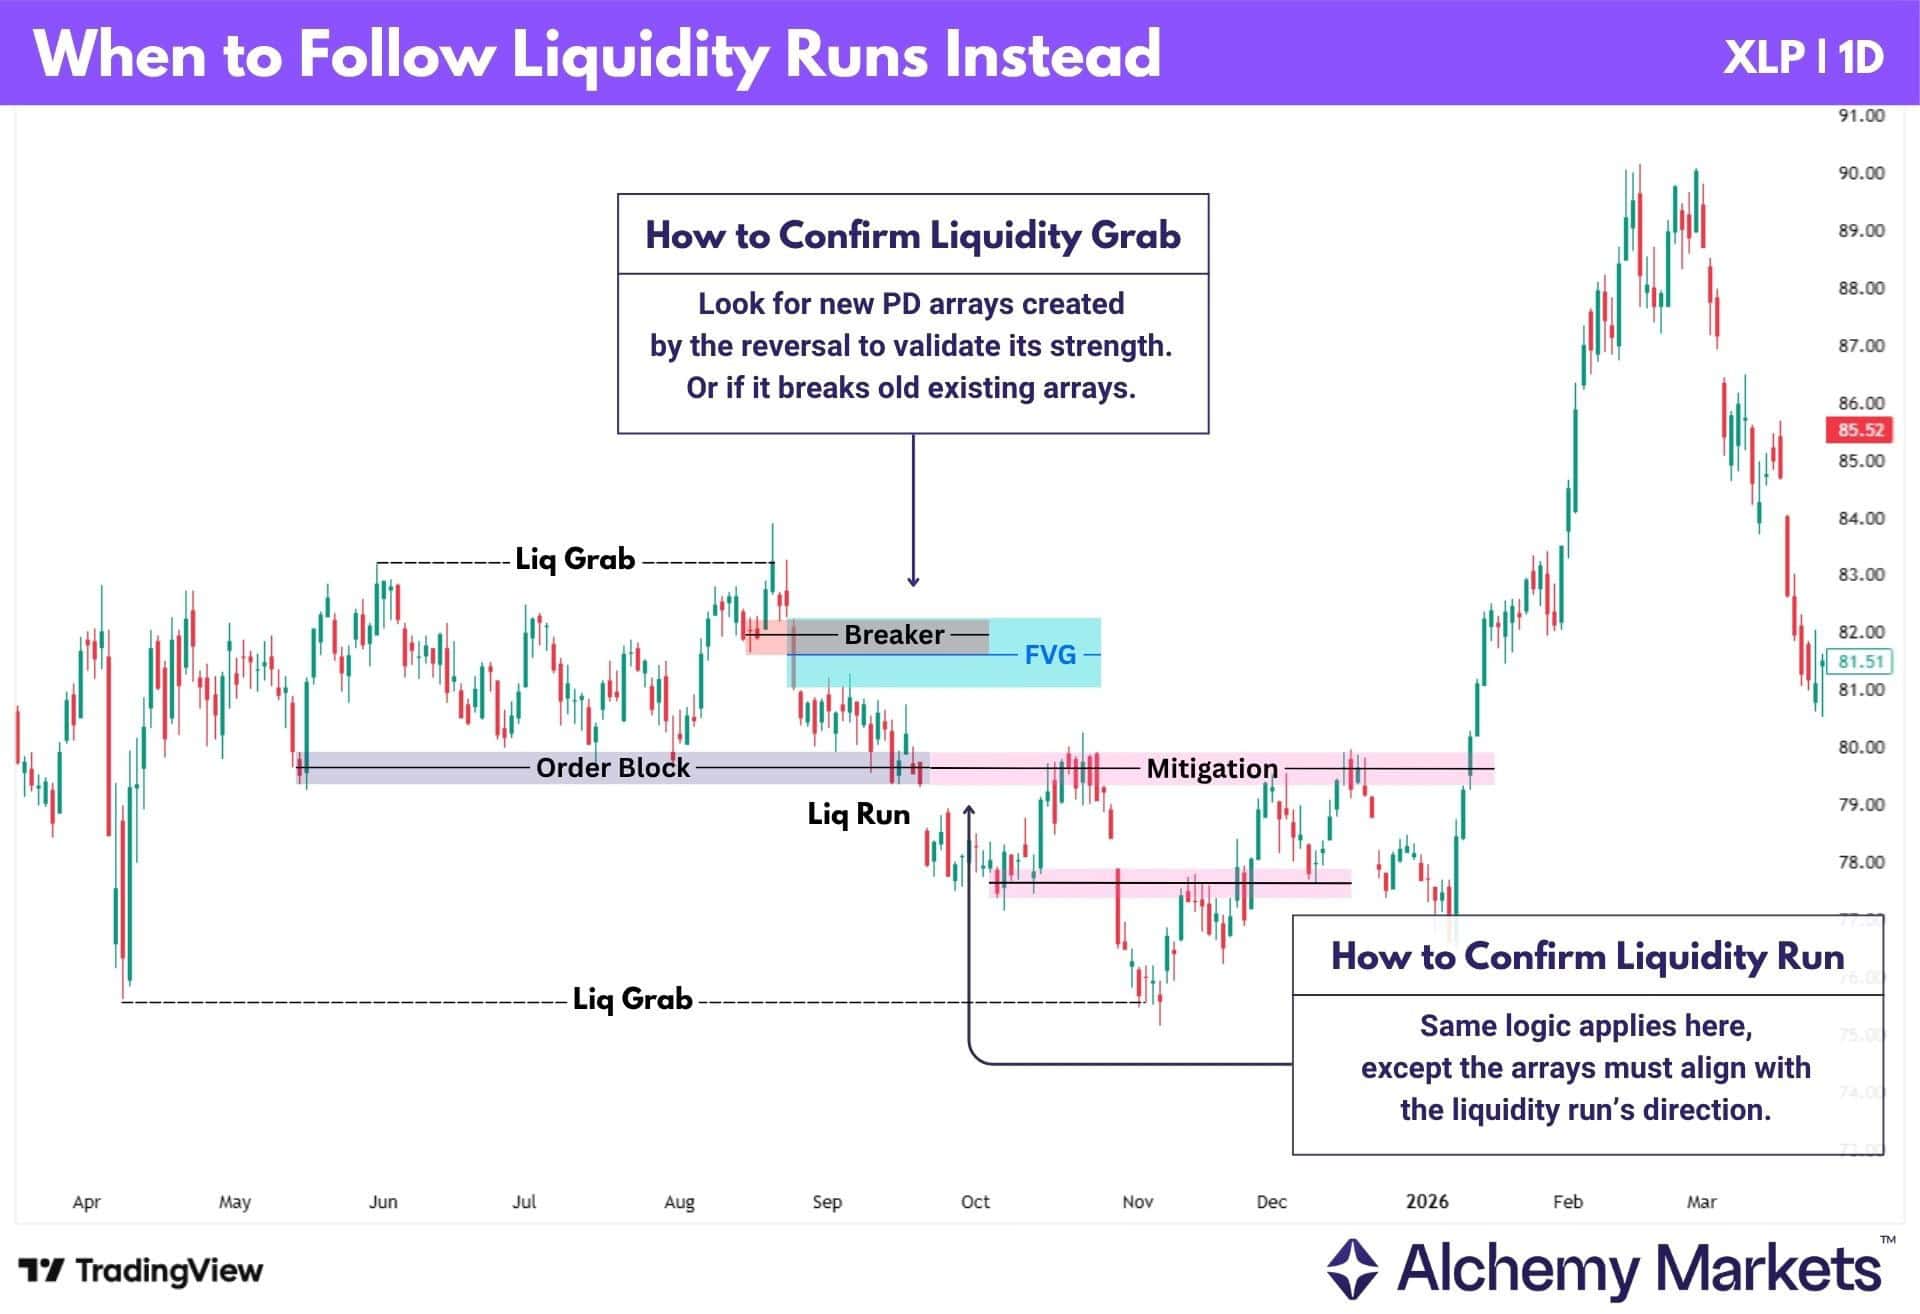
The sequence is simple:
| i. Price sweeps a swing high or swing low. ii. Check whether price rejects the level or holds beyond it. iii. If price rejects and creates reversal PD arrays, treat it like a liquidity grab. iv. If price holds beyond the level and creates PD arrays in the breakout direction, treat it like a liquidity run. |
So basically, this strategy helps traders avoid forcing every sweep into a reversal trade.
If price rejects, traders can look for the liquidity grab setup. If price accepts and follows through, traders can follow the liquidity run instead.
Advantages of Liquidity Grab Trading
One of the main advantages of liquidity grab trading is that it helps traders avoid chasing every breakout at face value.
Instead of assuming price will continue after breaking a key level, traders can wait to see whether the move actually holds. If price quickly rejects the level, the breakout may have been a trap rather than a real continuation move.
Liquidity grab patterns also make planning easier. Since the setup usually forms around a clear swing high, swing low, key support, or resistance level, traders can define entries, invalidation, and risk management more clearly.
The liquidity grab strategy can also be used across different financial markets, including the forex market, stock market, indices, commodities, and crypto.
It is especially useful on major currency pairs and liquid markets where major liquidity zones are easier to spot. In short, a liquidity grab setup gives the rejection more context. Price did not just bounce from a level. It took liquidity first, failed to continue, then reversed.
Disadvantages of Liquidity Grab Trading
The main disadvantage of liquidity grab trading is that it can be subjective.
Not every wick beyond a level is a valid liquidity grab. Sometimes price rejects briefly, then continues in the breakout direction anyway. This is why traders should not treat every sudden price movement as an automatic reversal signal.
Liquidity grabs can also happen during sharp price movement, especially around news events or low-liquidity sessions. That can lead to wider spreads, slippage, and rushed entries.
Another common issue is entering too early. A wick below support or above resistance may look like a reversal, but without confirmation, price can still turn into a liquidity run or further price decline.
This is why traders often combine liquidity grabs with the broader market trend, order blocks, fair value gaps, volume, and structure confirmation.
Liquidity Grab vs Liquidity Sweep
A liquidity grab and a liquidity sweep are closely related, but they are not always the same.
A liquidity grab is usually sharper. Price moves above a swing high or below a swing low, triggers liquidity, then quickly snaps back. This often happens through one candle, or sometimes two candles if price immediately reclaims the level.
A liquidity sweep is usually broader. Price may move further beyond the level, spend more time outside the range, or close beyond the level for several candles before reversing.
In simple terms, a liquidity grab is the quicker version. A liquidity sweep is the wider version. Both are based on the same liquidity dynamics: price enters a liquidity zone, triggers orders, then fails to continue.
Liquidity Grab vs Break of Structure
A liquidity grab is a failed break. A Break of Structure is a confirmed structural break.
In a liquidity grab, price briefly moves beyond a previous high or low, but fails to hold there. The move may look like a breakout at first, but price quickly reverses back inside the previous range.
Break of Structure is different because price actually continues beyond the level and confirms a shift in structure.
The easiest way to separate them is follow-through. If price breaks the level and continues, it is more likely a BOS or liquidity run. If price breaks the level, rejects, and reverses, it is more likely a liquidity grab.
Liquidity Grab vs Change of Character (CHoCH)
A liquidity grab is the liquidity event. A Change of Character, or ChoCh, is the structural clue that may come after it.
For example, price may first grab liquidity below a swing low. That shows sell-side liquidity was taken. But traders may still wait for price to break a short-term high afterwards, forming a bullish ChoCh.
So, the two concepts can work together. The liquidity grab shows where liquidity was taken. The ChoCh shows whether market structure is starting to shift after the grab.
Liquidity Grab vs Stop Hunting
A liquidity grab and stop hunting describe a similar idea, but from different angles.
Stop hunting focuses on the behaviour. Price moves into areas where stop losses are likely sitting, such as above a swing high or below a swing low.
A liquidity grab is the visible price action pattern that forms when that move fails to continue and price reverses.
So, stop hunting explains the possible reason behind the move. A liquidity grab explains what it looks like on the chart.
FAQ
What is the best timeframe to trade Liquidity Grabs?
Liquidity grabs can appear on any timeframe, but higher timeframes usually give cleaner signals. Beginners may find the 1-hour, 4-hour, and daily charts easier to read because they reduce noise around major liquidity zones.
Why are Liquidity Grabs popular among Smart Money Concepts traders?
Liquidity grabs are popular among Smart Money Concepts traders because they explain why markets often fake out before reversing. Instead of treating every breakout as real, traders check whether price has actually accepted beyond the level.
What is the best indicator for liquidity grab?
Some community-made indicators may exist, especially on charting platforms like TradingView, but traders should still use price action as the main guide for finding liquidity grabs.
Can you predict a liquidity grab?
You cannot predict a liquidity grab with certainty, but you can identify where they are more likely to happen. They usually form around obvious highs and lows, round numbers, previous session highs or lows, and crowded liquidity zones.
How reliable is liquidity grab?
A liquidity grab can be reliable when it forms at a meaningful level and has confirmation. Without confirmation, it can easily turn into a real breakout, liquidity run, or further price decline.
What common mistakes should traders avoid when using the liquidity grab strategy?
The biggest mistake is assuming every wick beyond a level is a liquidity grab. Traders should also avoid entering before rejection is confirmed, using stops that are too tight, and ignoring the higher timeframe trend.
Is a Liquidity Grab bullish or bearish?
A liquidity grab can be bullish or bearish depending on where it forms. A grab below a swing low is technically bullish, while a grab above a swing high is bearish.


