


Written by:

Reviewed by:


- May 10, 2024
- 22 min read
Moving Average Convergence/Divergence (MACD) Oscillator Explained
What is the MACD indicator?
Moving Average Convergence Divergence, or MACD, is a momentum trading indicator commonly used in technical analysis. Traders use MACD primarily to monitor and execute trades related to market trends. The price chart shows MACD as two lines that oscillate, cross each other often, and move up or down together for extended periods.
How does MACD work?
MACD is a trend-following momentum indicator that measures the relationship between two moving averages, the 12-period and 26-period exponential moving averages (EMAs). These moving averages smooth out price data over specific time frames, providing a clearer view of the market trend without the noise of daily price fluctuations.
The standard use of MACD is based on the exponential moving average, although it can also be used with the simple moving average. It is plotted as an oscillator at the bottom of the price chart and shows the strength of the prevailing trend along with signals of the change in trend.
MACD has four main components that can act as good trend and momentum indicators: the MACD line, Signal line, Histogram, and Zero line.
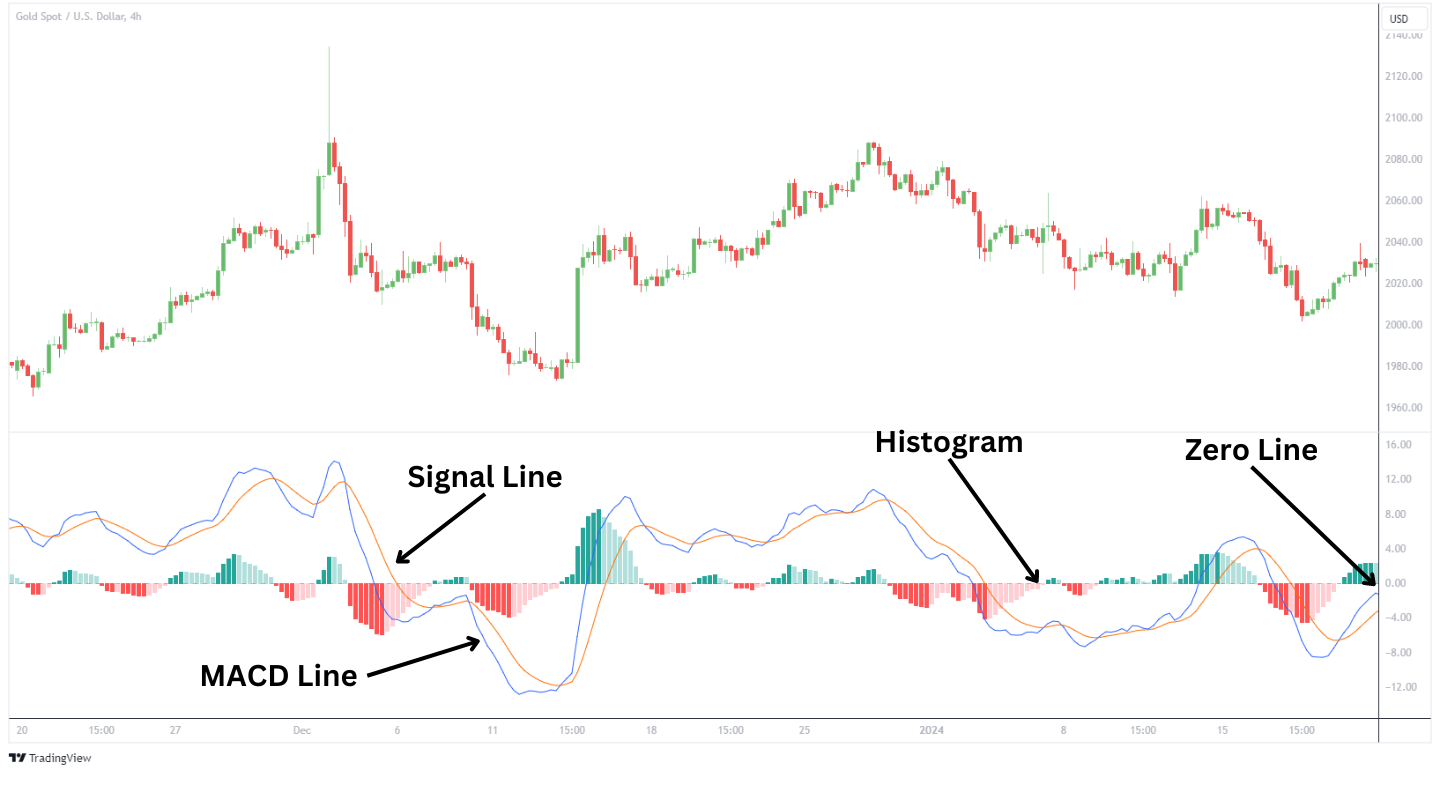
MACD Line
The MACD Line is the heart of the MACD indicator, denoting the difference between the 26-day and 12-day exponential moving averages (EMAs). In price charts, the MACD line is often addressed as a blue line that fluctuates above and below the zero line to identify market movement.
When the MACD line is above zero, it suggests bullish momentum and an uptrend. Conversely, it signals bearish momentum and a downward trend when it’s below the zero line. The positioning and movement of the MACD line relative to the zero line help traders gauge the strength and direction of market trends.
Signal Line
The Signal Line of the MACD is associated with the orange line in a price chart. It is calculated as the 9-day EMA of the MACD line and indicates potential trading signals. The crossover between the signal line and the MACD line predicts the trend.
When the MACD line crosses above the signal line, it suggests a buying opportunity by hinting at the potential of an upward trend. Conversely, a crossover below the signal line indicates a downward price movement where traders can look for a selling opportunity.
Histogram
The histogram visually represents the difference between the MACD line and the signal line. Traders use this tool when identifying price momentum shifts, as the histogram’s height indicates the trend’s strength. A rising histogram suggests increasing bullish momentum, while a falling histogram shows bearish momentum.
Additionally, divergences between the histogram and the price action are critical, as they can signal potential trend reversals or continuations, providing traders with advanced warnings about shifts in market dynamics.
As the MACD Line and Signal Line separate, the histogram gets bigger. This is called a MACD divergence because the faster-moving average (MACD Line) is “diverging” or moving away from the slower-moving average (Signal Line). As the moving averages get closer, the histogram gets smaller. This is called convergence because the faster-moving average is “converging” or getting closer to the slower-moving average.
Zero Line
The Zero Line in the MACD indicator is a reference point for the overall market momentum. Bullish momentum is indicated when the MACD Line crosses above the zero line, while a drop below it indicates a bearish momentum.
Importance of MACD
Traders use the MACD for its ability to simplify and reflect market trends during technical analysis. This tool empowers traders with actionable insights for executing trades effectively.
Trend Identification
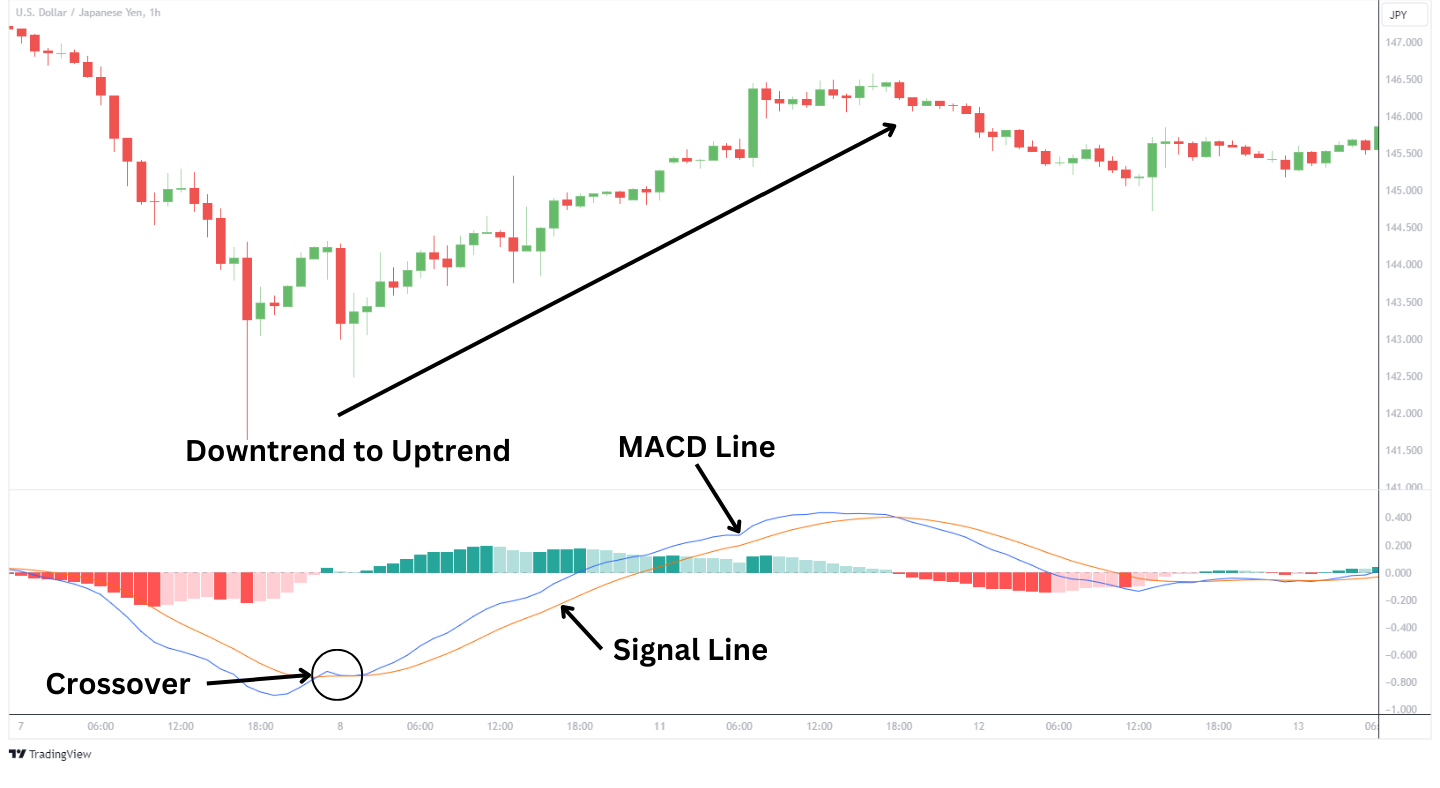
The MACD helps traders identify market trends. It compares the relationship between the two moving averages to signal trend directions and potential trading opportunities. The USDJPY chart above shows the MACD line crossing above the signal line. This crossover is a signal that buying momentum is rising, suggesting the price momentum may be shifting from down to up.
Conversely, when the MACD line crosses below the signal line, it indicates a bearish trend where selling pressure is growing.
Momentum Signaling
The histogram plays an important role in assessing the sustainability of a trend as it measures the distance between the MACD line and the signal line. A trader can gain insights into the underlying momentum and direction of price by analyzing the histogram.
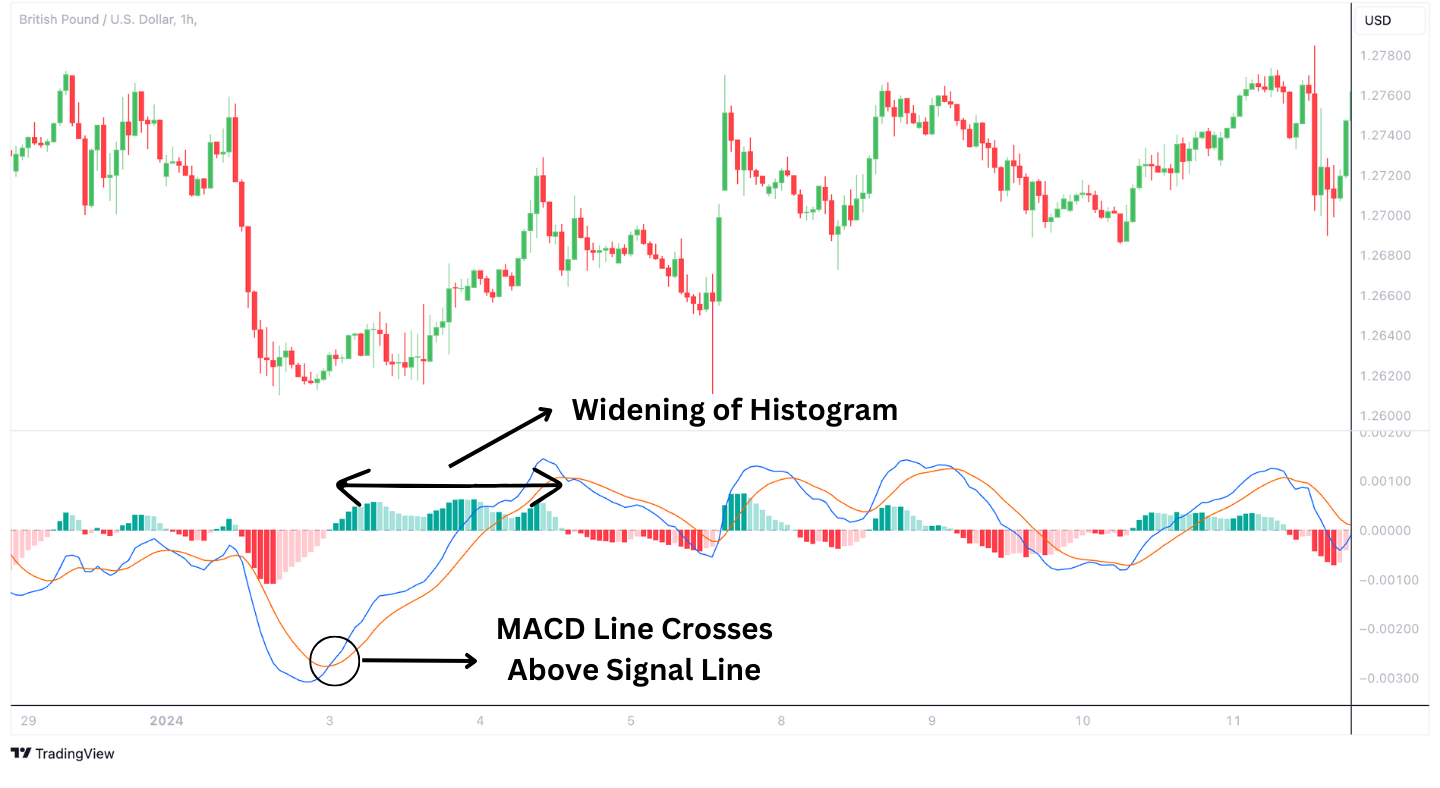
An expanding histogram, where the MACD line moves away from the signal line, indicates an increasing rate of change on the MACD line. If you remember, the MACD line is the difference between the 12 and 26-period EMAs. Since the rate of change in the MACD line is increasing (and the MACD line is above the zero line), the 12 EMA is rallying harder than the 26 EMA. For instance, in the GBPUSD chart, the MACD line rises above the signal line, and the histogram is widening, which then results in a strengthening rally.
Conversely, a shrinking histogram, where the MACD line moves closer to the signal line, signals the closing of the gap between the two EMAs. In a bearish context, the histogram bars are negative if the MACD line falls below the signal line. This indicates a rally fading or a new bearish trend as the 12-EMA falls below the 26-EMA.
Trade Execution Signal
The MACD indicator can signal moments for trade execution, primarily through the crossovers of the MACD line with the signal line. When the MACD line crosses above the signal line, it creates a bullish signal. This indicates a favorable moment to open a buy position.
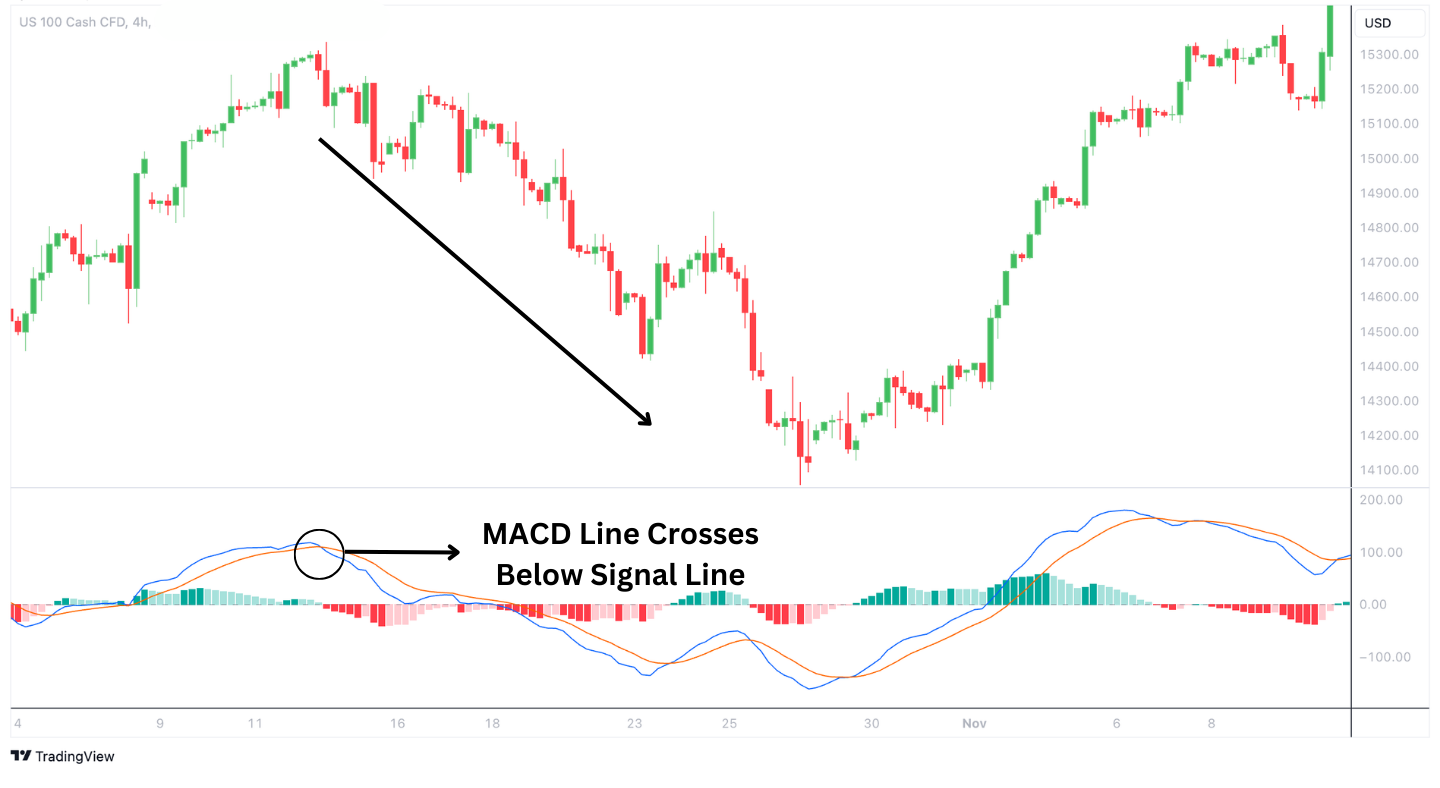
Conversely, when the MACD line crosses below the signal line, it generates a bearish signal, suggesting a potential sell opportunity as expressed in the US100 Cash CFD chart above.
How is MACD calculated?
The core of the MACD indicator is the MACD line. It is calculated by subtracting the 26-period EMA from the 12-period EMA. This calculation reflects the trend difference over these two distinct time frames, giving traders a dynamic view of market momentum.
Changing the length of EMAs used in the MACD formula can alter the indicator’s sensitivity to price movements. Shorter input periods will make the MACD more sensitive to price changes but offer more whipsawed signals. Lengthening the input periods will make the MACD less sensitive to price changes and offer more stable signals, but on a delay.
As an example, assets that are inherently volatile might use a MACD with 19, 39, 9 setting. The longer lookback period for the MACD line calculation will slow down the responsiveness to the volatile price. That way, the MACD line isn’t whipsawing back and forth due to volatility.
Also, traders can change the EMA calculation to a simple moving average (SMA) calculation. The SMA is less sensitive to the recent price movements too so it will make the MACD line less responsive to recent price moves. Again, in a volatile market, changing the MACD calculation to the SMA will make the MACD line less sensitive to the volatile price moves and allow for the larger trends to become visible. Either of these adjustments allows traders to tailor the MACD to different trading styles and market conditions.
MACD Formula
- MACD Line = 12-day EMA – 26-day EMA
- Signal Line = 9-day EMA of MACD Line
- Histogram = MACD Line – Signal Line
How do traders use moving average convergence/divergence (MACD)?
The MACD is an excellent tool for traders when conducting technical analysis. There are three popular methods by which traders can use the tool.
1) Signal Line Crossovers:
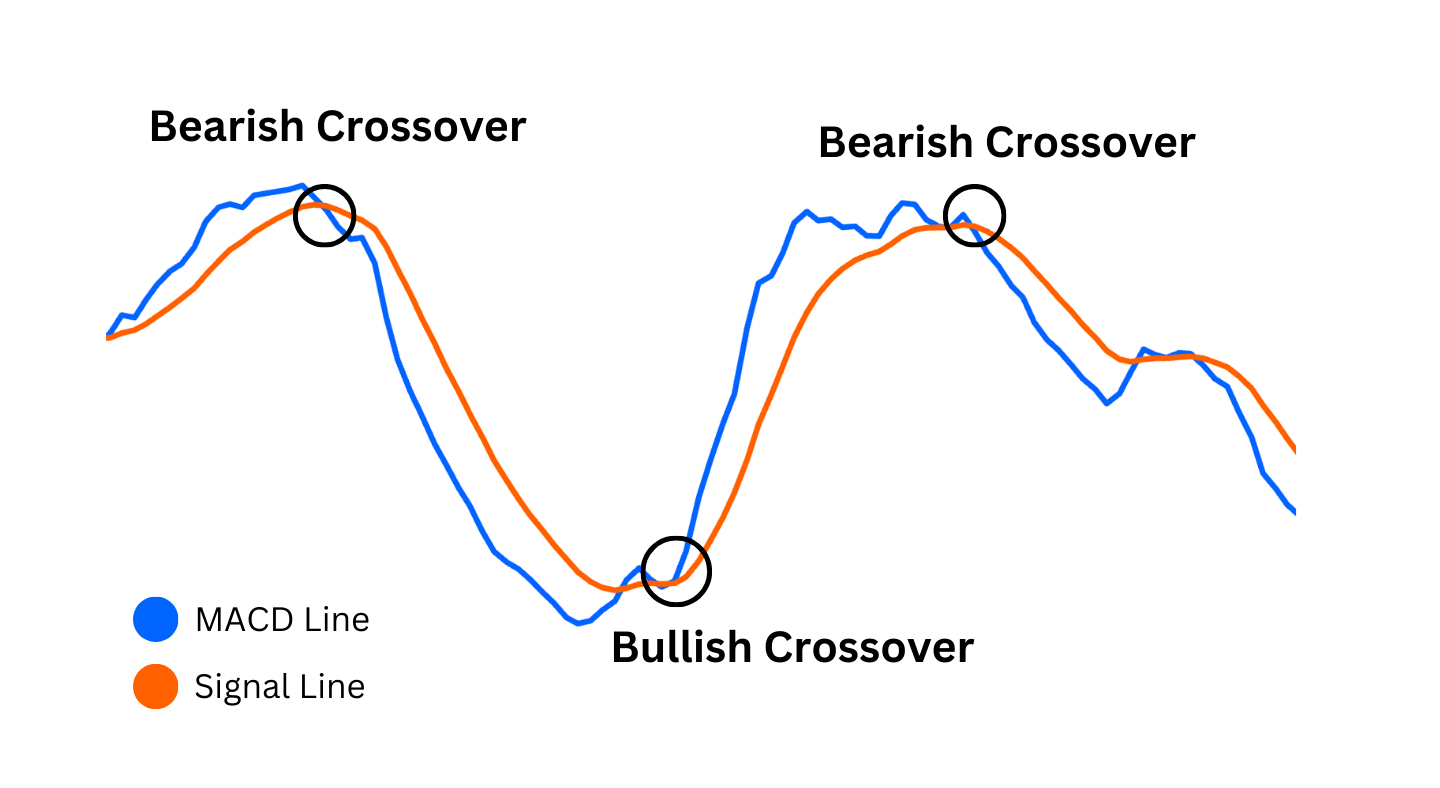
The MACD signal line crossover is a primary method used by traders for identifying potential buy or sell opportunities. A crossover between the MACD and signal lines is common in trading. When the MACD line crosses above the signal line, it is considered bullish and may indicate a good buying opportunity. Conversely, when the MACD line crosses below the signal line, it is regarded as a bearish signal and may be interpreted as a selling opportunity.
2) Center Line Crossovers:
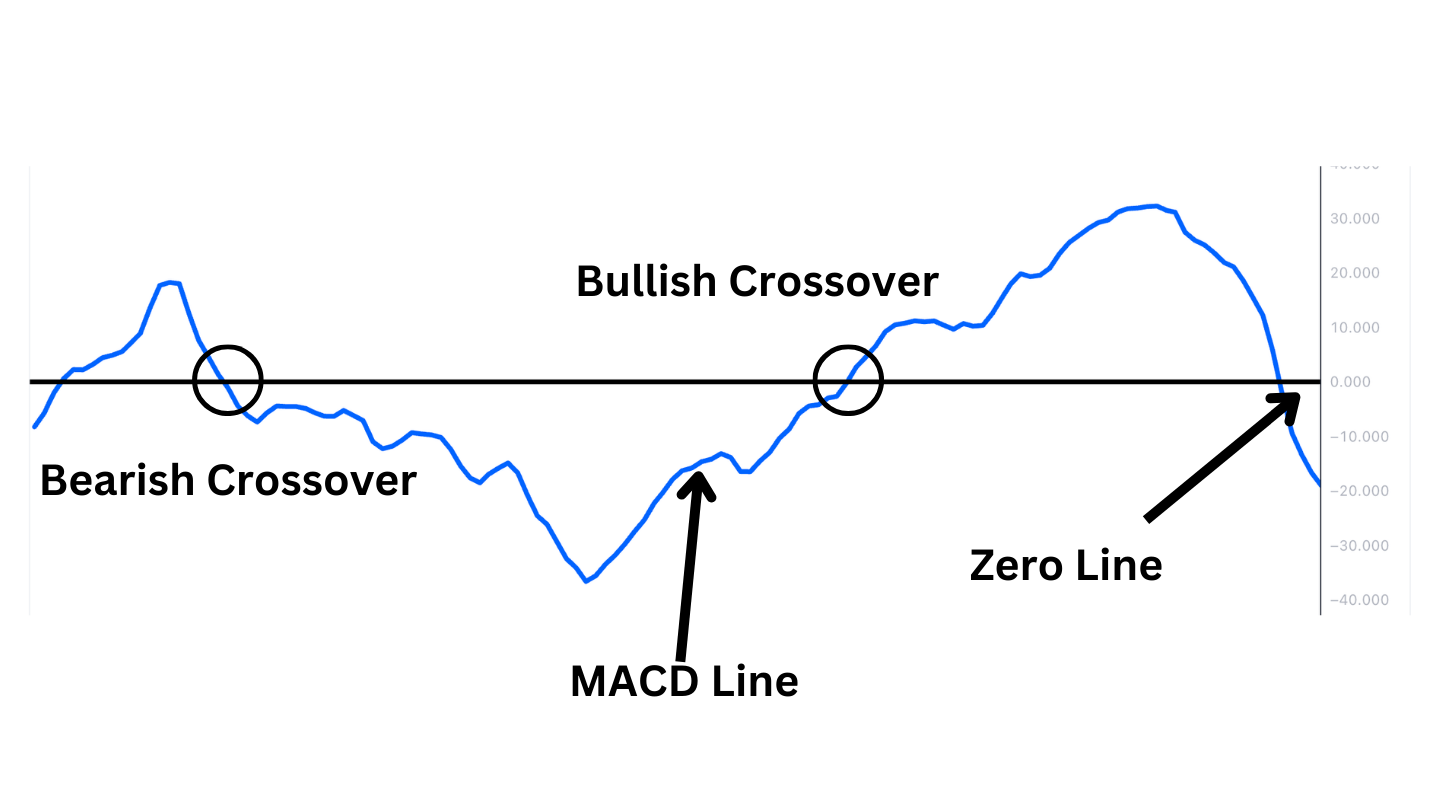
Center-line crossovers in MACD analysis help traders understand the overall trend direction. When the MACD line crosses above the zero center line, it suggests a shift to a bullish trend. This could indicate that it may be time to consider taking long positions in the market. On the other hand, if the MACD line crosses below the zero line, it signals a bearish trend, which might prompt traders to explore short positions or exit existing long positions.
3) Histogram Divergences:
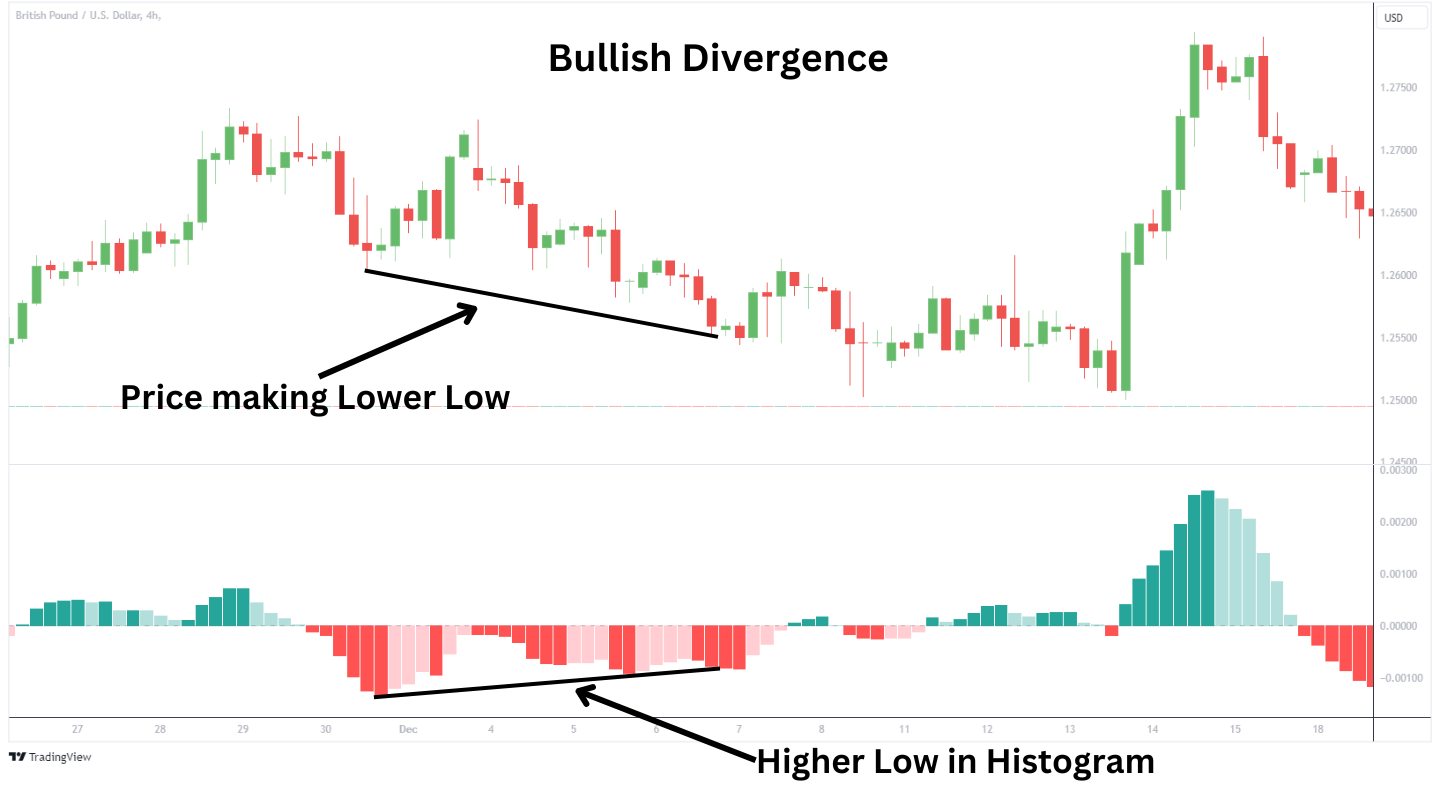
The MACD histogram helps traders identify divergences that indicate the strengthening or weakening of trends. It represents the difference between the MACD line and its signal line. For instance, if an asset’s price reaches new highs but the MACD histogram shows lower peaks, it indicates a bearish divergence. This implies that the upward momentum is decreasing, and a trend reversal may be on the horizon. On the other hand, a bullish divergence occurs when the price hits new lows, but the histogram forms higher lows, suggesting a potential upward trend reversal.
MACD Example
Signal Line Crossovers
The charts below are examples of trend reversals that occur as a result of MACD Line crossing. The 2-hour EURUSD chart experiences a momentum shift from uptrend to downtrend when the MACD Line crosses below the Signal Line.
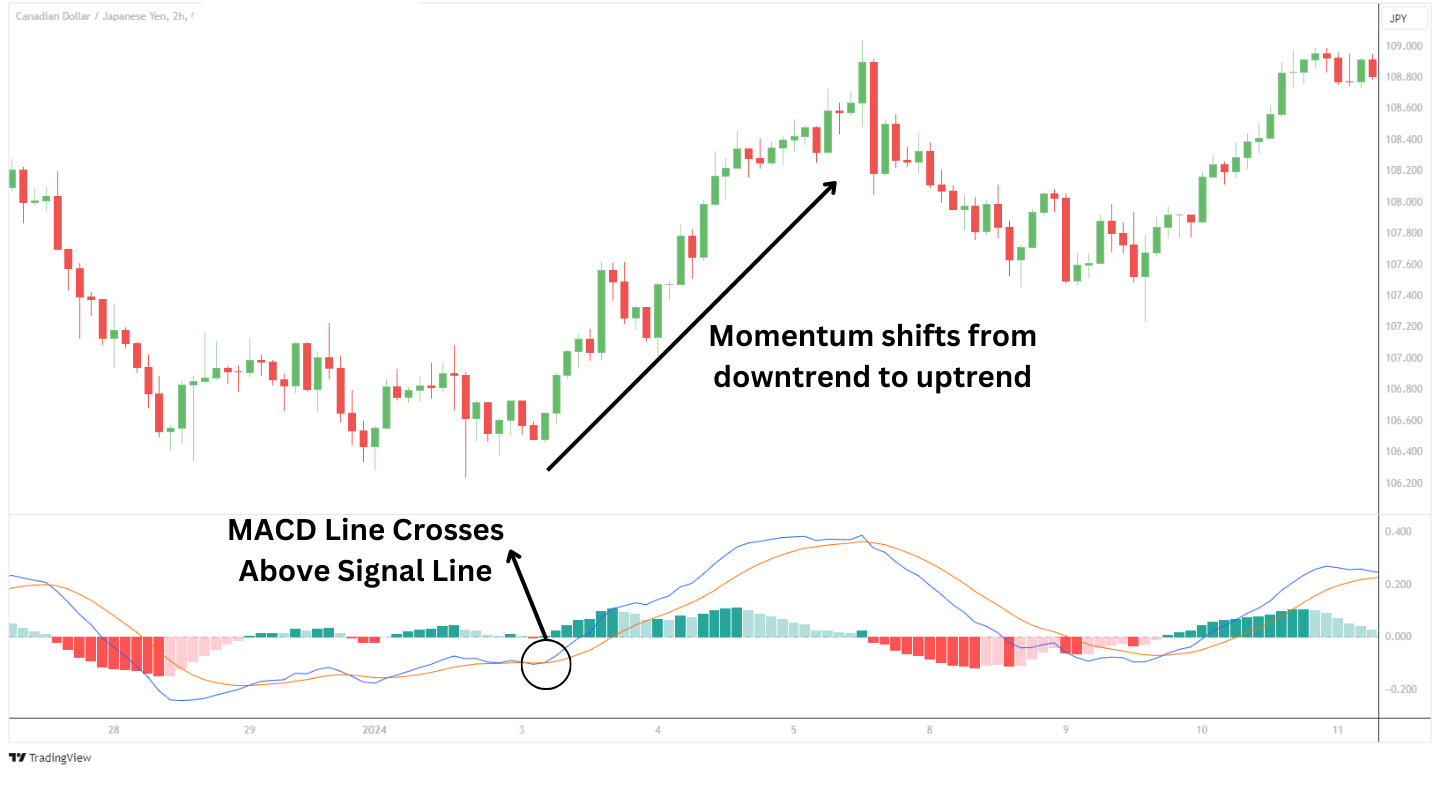
The CADJPY 2-Hour Chart above is an example of momentum shifting from a decline to a rally as a result of the MACD Line crossing above the Signal Line.
Centerline Crossovers
Below are examples of center-line crossovers with the inclusion of the 12-period Exponential Moving Average (EMA) and 26-period Exponential Moving Average.
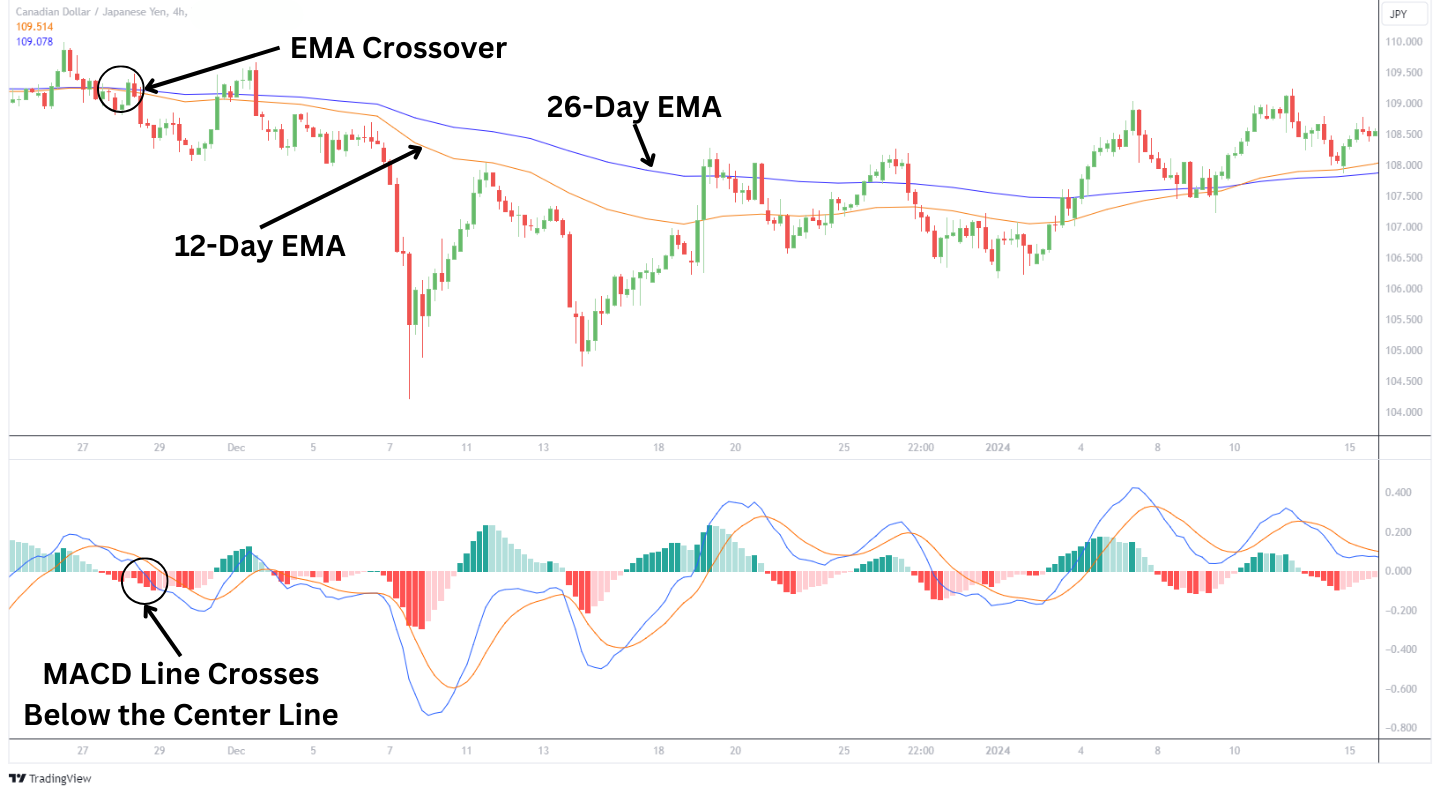
The CADJPY example shows the MACD Line crossing below the Center Line, it indicates a price drop. This is a result of the 12-period EMA crosses below the 26-period EMA.
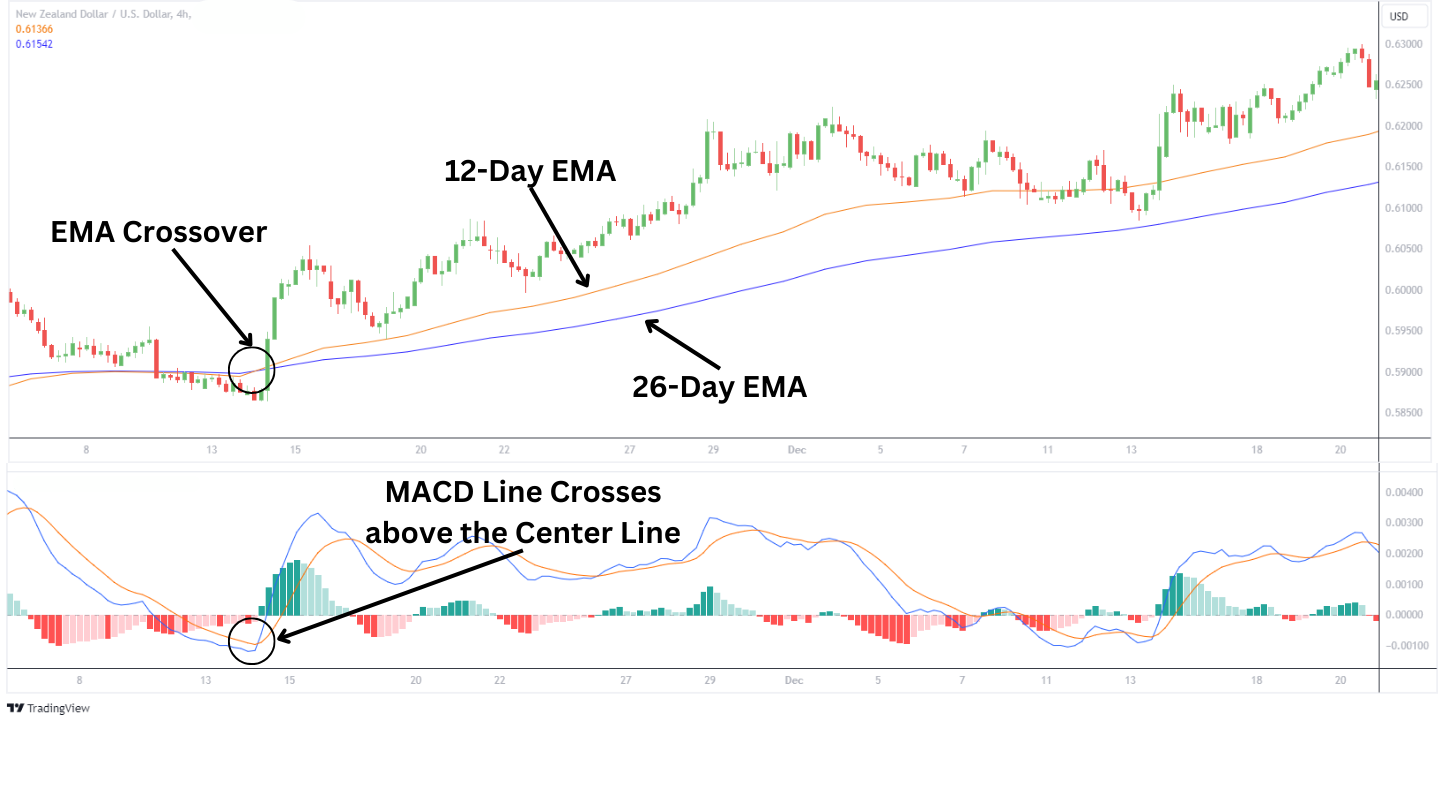
Conversely, the rally of a price as shown in the NZDUSD 4-Hour chart above is a result of the 12-period EMA crossing above the 26-period EMA while the MACD Line crosses above the Center Line.
Example of MACD Divergence
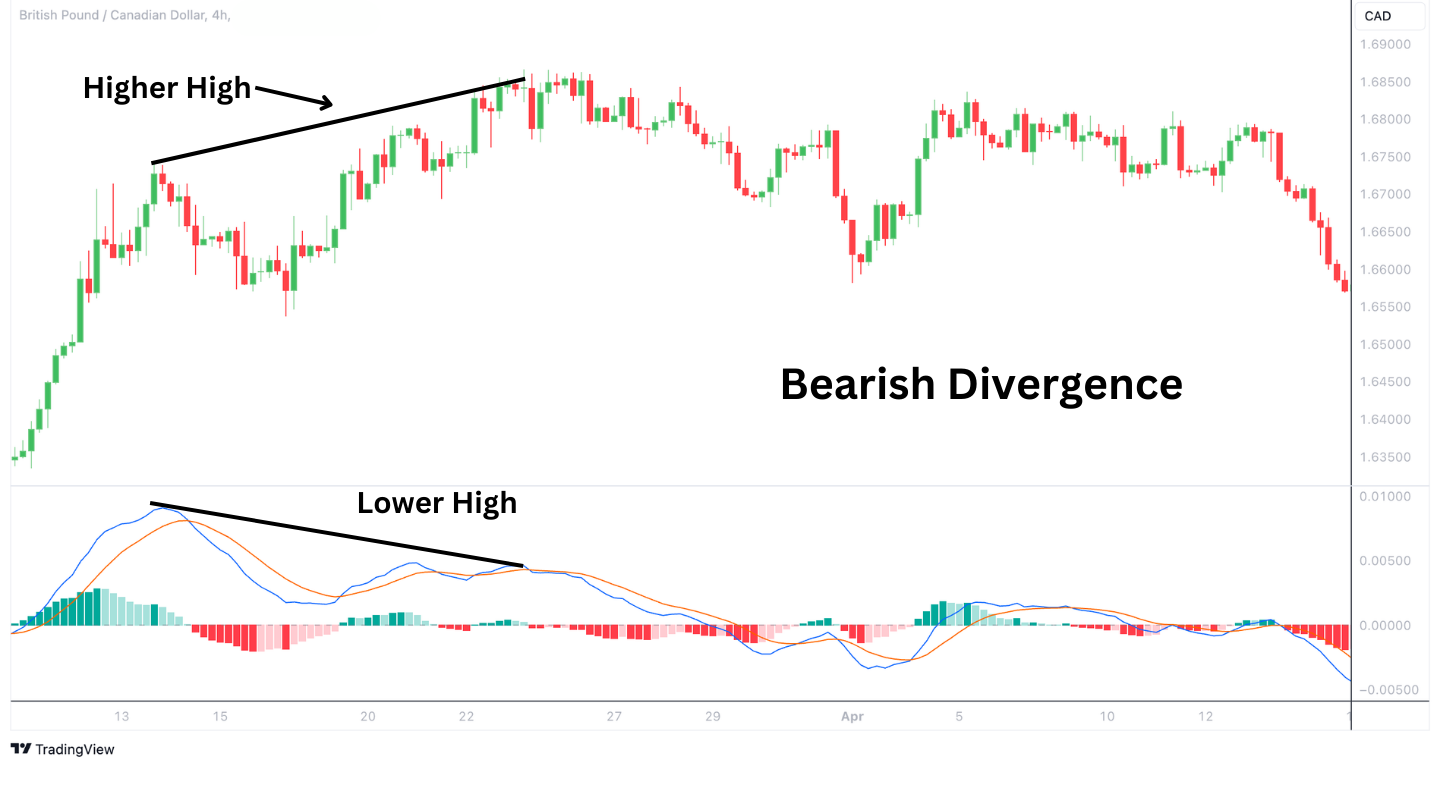
On the GBPCAD 4-hour chart above, a bearish divergence occurs as the price hits a higher high while the MACD forms a lower high, signaling decreasing momentum and likely a forthcoming bearish trend reversal.
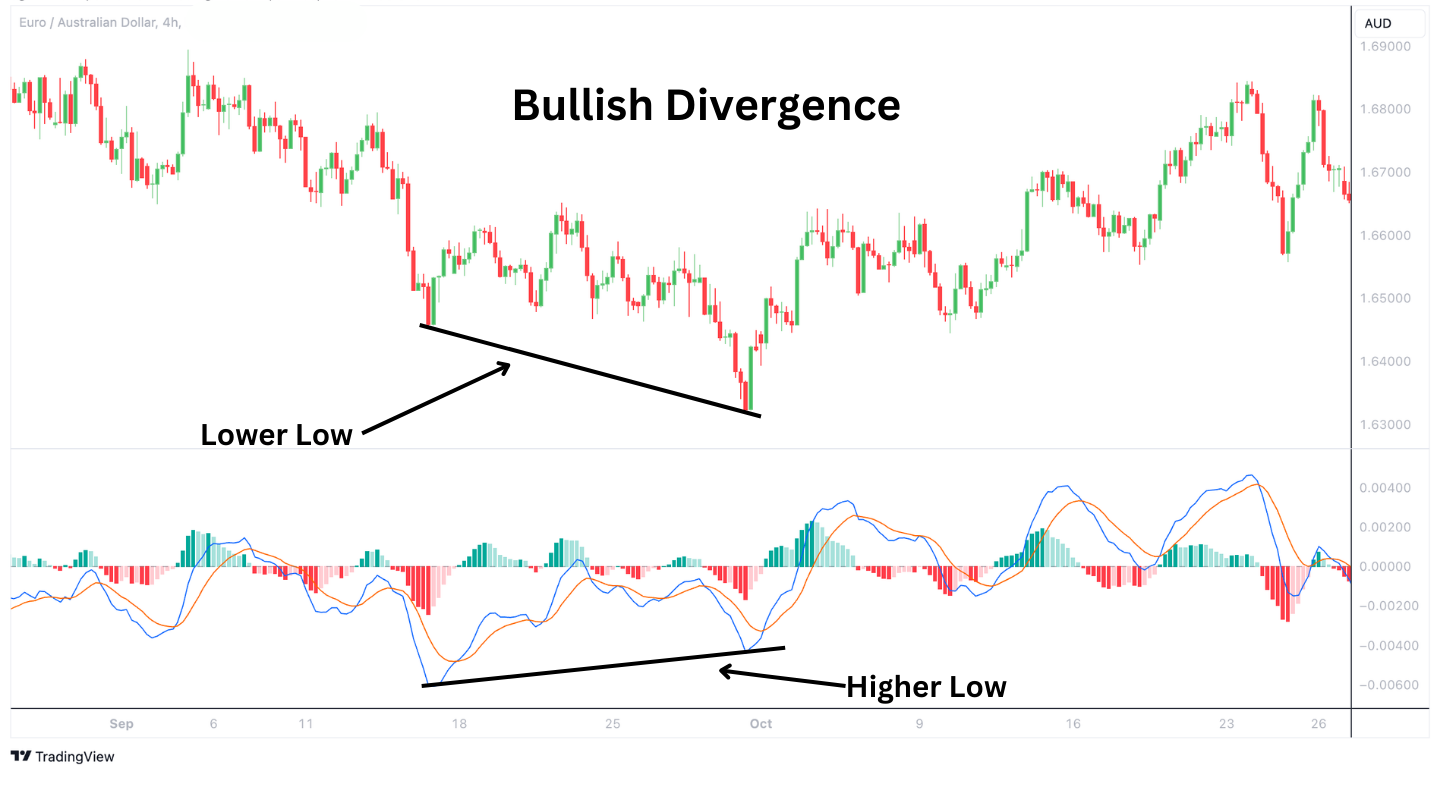
Viewing the EURAUD 4-hour chart above, notice bullish divergence as the price drops to a lower low, but the MACD charts a higher low, actively signaling a shift in momentum and hinting at an upward trend reversal.
Example of Rapid Rises or Falls in the MACD
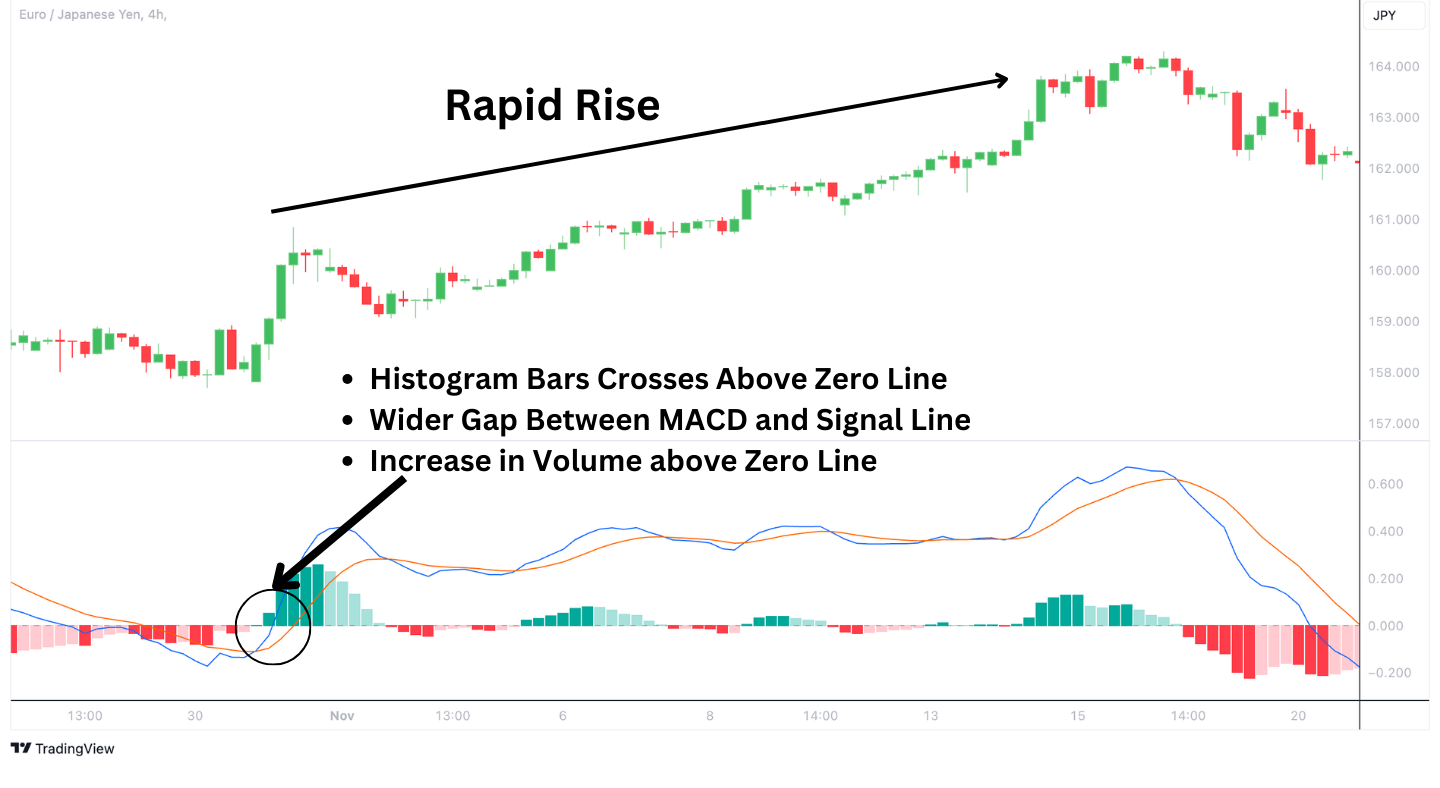
On the EURJPY 4-hour chart, a rapid rise in the MACD is observed as the histogram bars cross above the zero line, indicating bullish momentum. This crossover, coupled with a widening gap between the MACD line and its signal line creates larger histogram bars and a price rally.
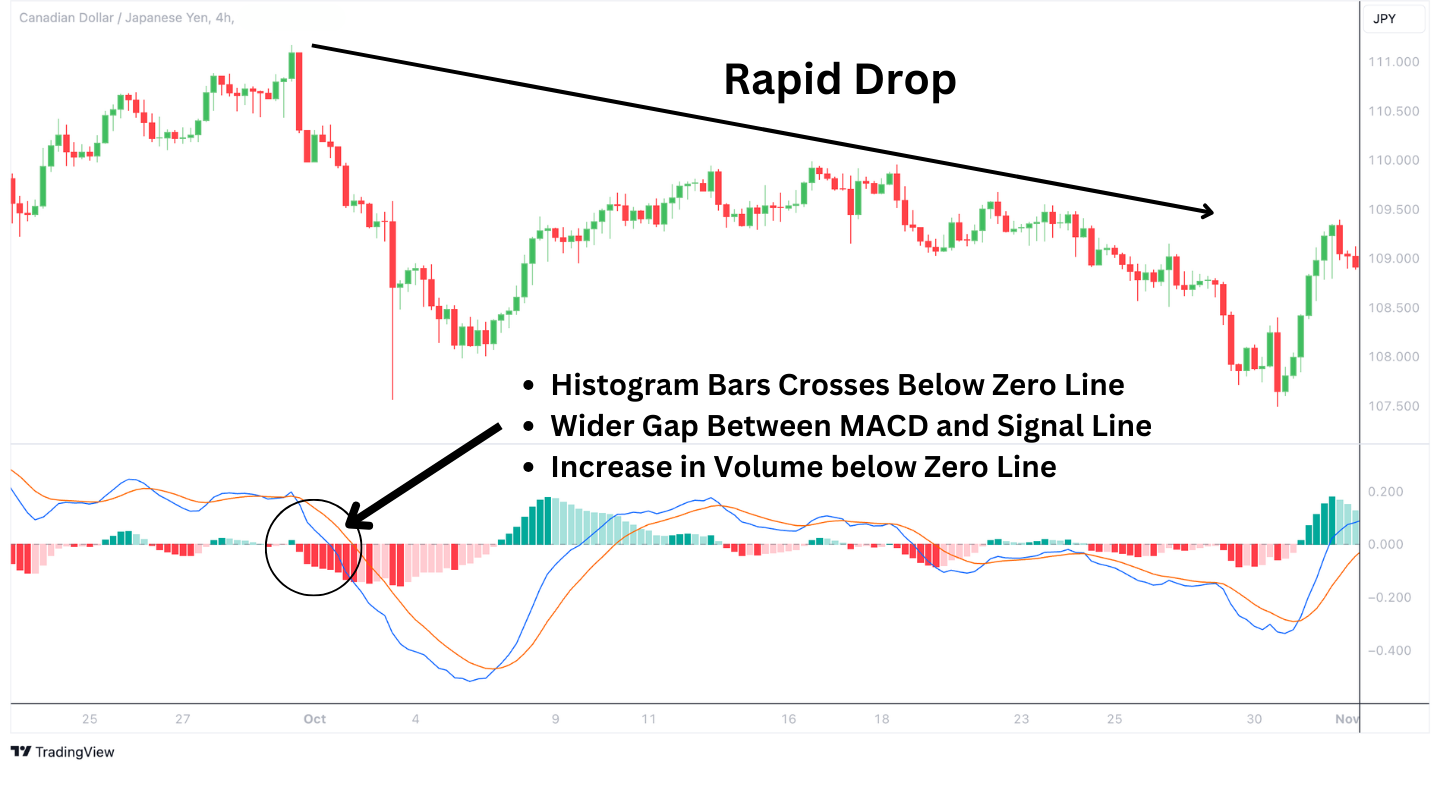
The CADJPY 4-hour chart shows a rapid drop as MACD histogram bars cross below the zero line, indicating bearish momentum. The widening gap between the MACD line and its signal line, with larger histogram bars below the zero line, suggests a strong downward trend.
Types of MACD Strategies
Multi-Timeframe Analysis
To identify the market trend, start by analyzing the MACD on a longer timeframe, such as the daily chart. If the MACD line is above the center line, it suggests a bullish trend. On the other hand, if the MACD line is below the center line, it indicates a bearish trend.
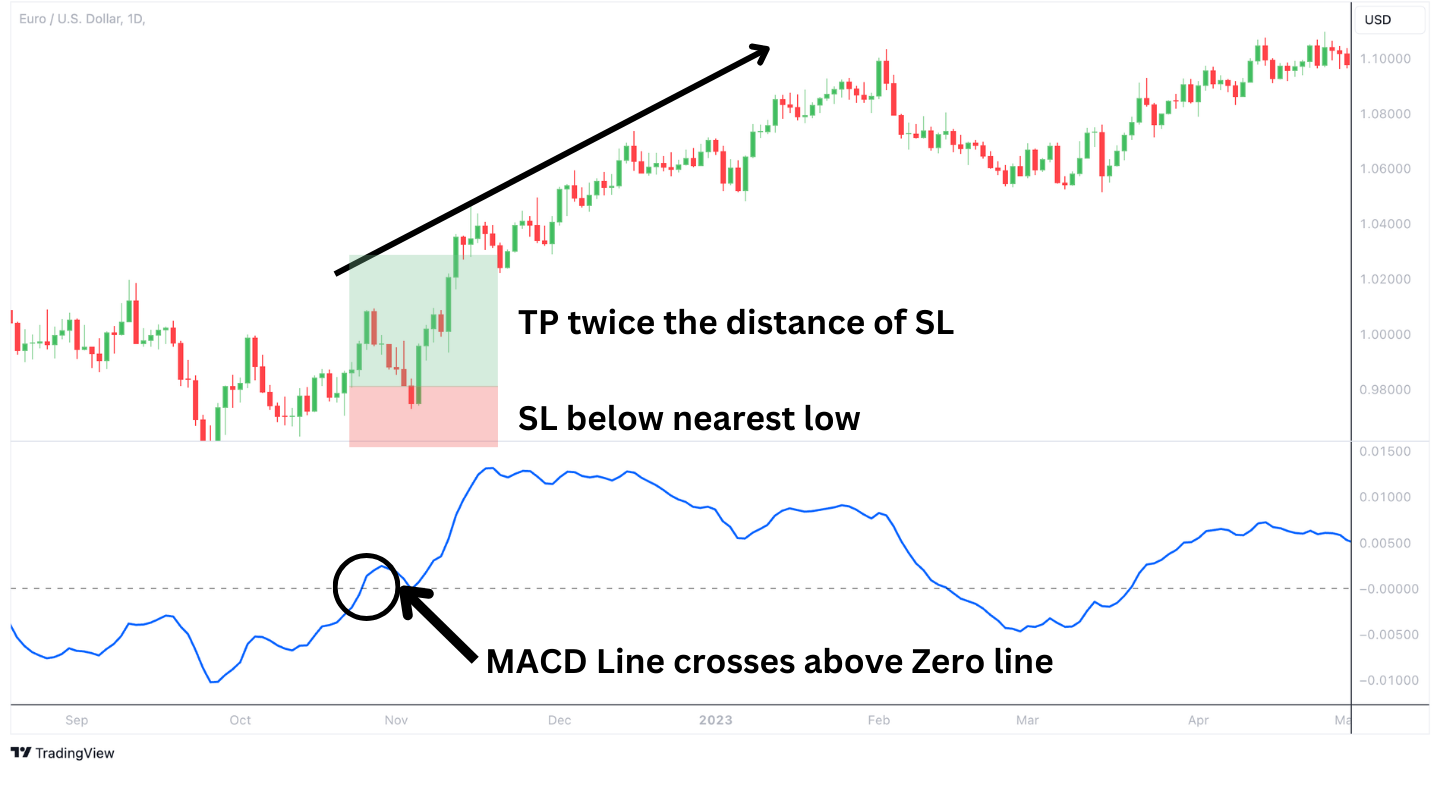
In a bullish market, it is advisable to look for buying opportunities when the MACD line is above the center line, particularly near a crucial support level, which reinforces the trade’s validity. The Daily EURUSD chart below is a great example bullish market trend once the MACD Line crosses the zero line. The stop-loss level is placed below the nearest low of the pair while the take-profit is set twice the distance of SL.
Similarly, in a bearish market, consider selling or short selling when the MACD line crosses below the signal line near a resistance level.
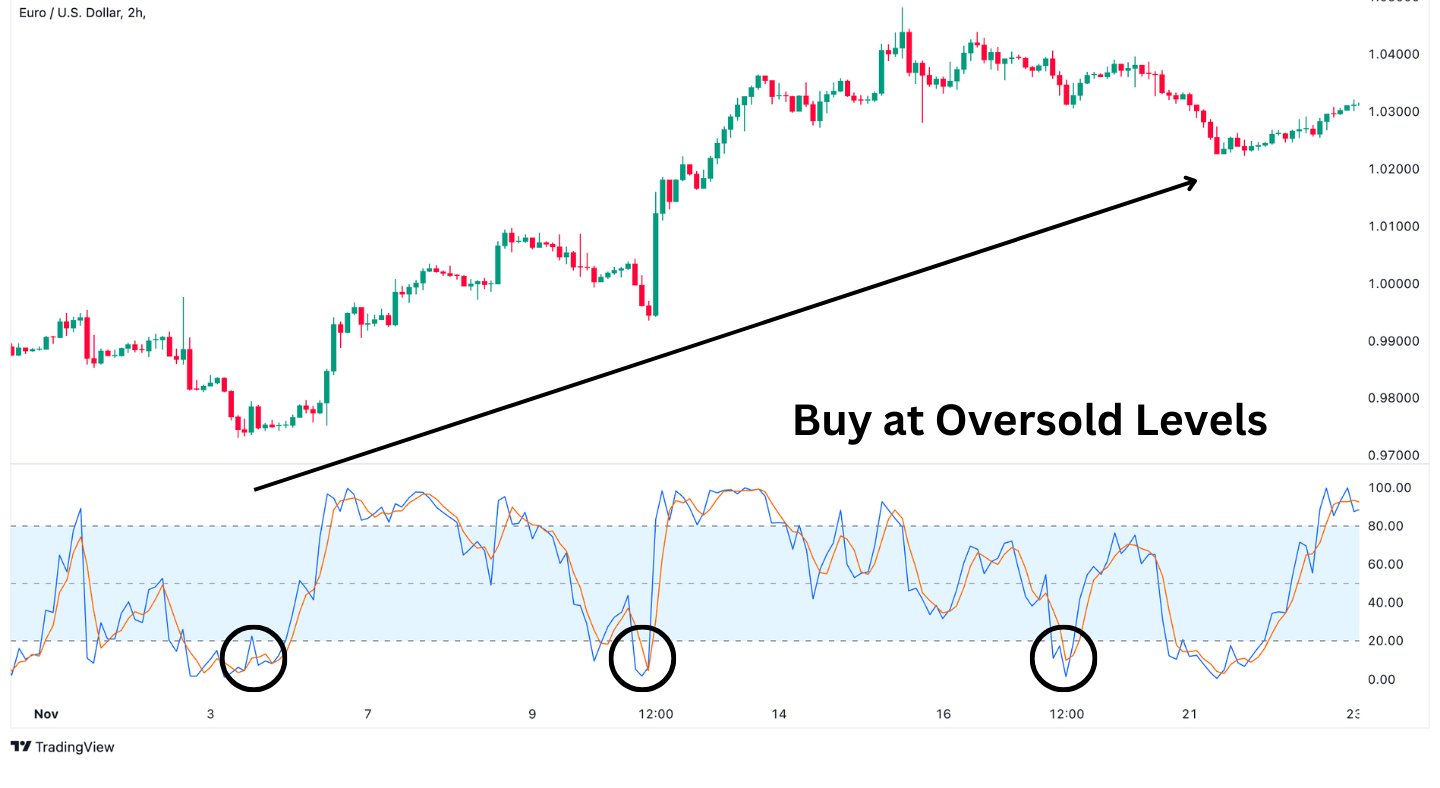
When looking for entry points, traders should pay attention to shorter timeframes once the trend has been established on longer timeframe charts. Filter down to a smaller time frame chart like a 4-hour or 2-hour chart, and look for bullish signals in a daily uptrend and bearish signals in a daily downtrend. Those bullish signals could be prices nearing an oversold condition in the Stochastic Indicator, refer to the 2-Hour EURUSD Chart below where prices experience a rally upon reaching the oversold level.
Crossover Strategy
A potential bullish trend occurs when the MACD line crosses above the signal line, prompting a buy position. Conversely, a cross below the signal line suggests a bearish trend. Traders should wait for the candle following the crossover to close before executing trades. This adds a layer of confirmation, reducing the risk of false signals.
In addition, the steepness of the MACD line’s crossover can strongly indicate the trend’s momentum. A sharper angle typically suggests a more robust and potentially more profitable trend. Integrating the MACD histogram as a secondary confirmation tool can also be beneficial. After the crossover, an increasing histogram value indicates a bullish trend, while a decreasing histogram value in bearish scenarios substantiates the downward momentum.
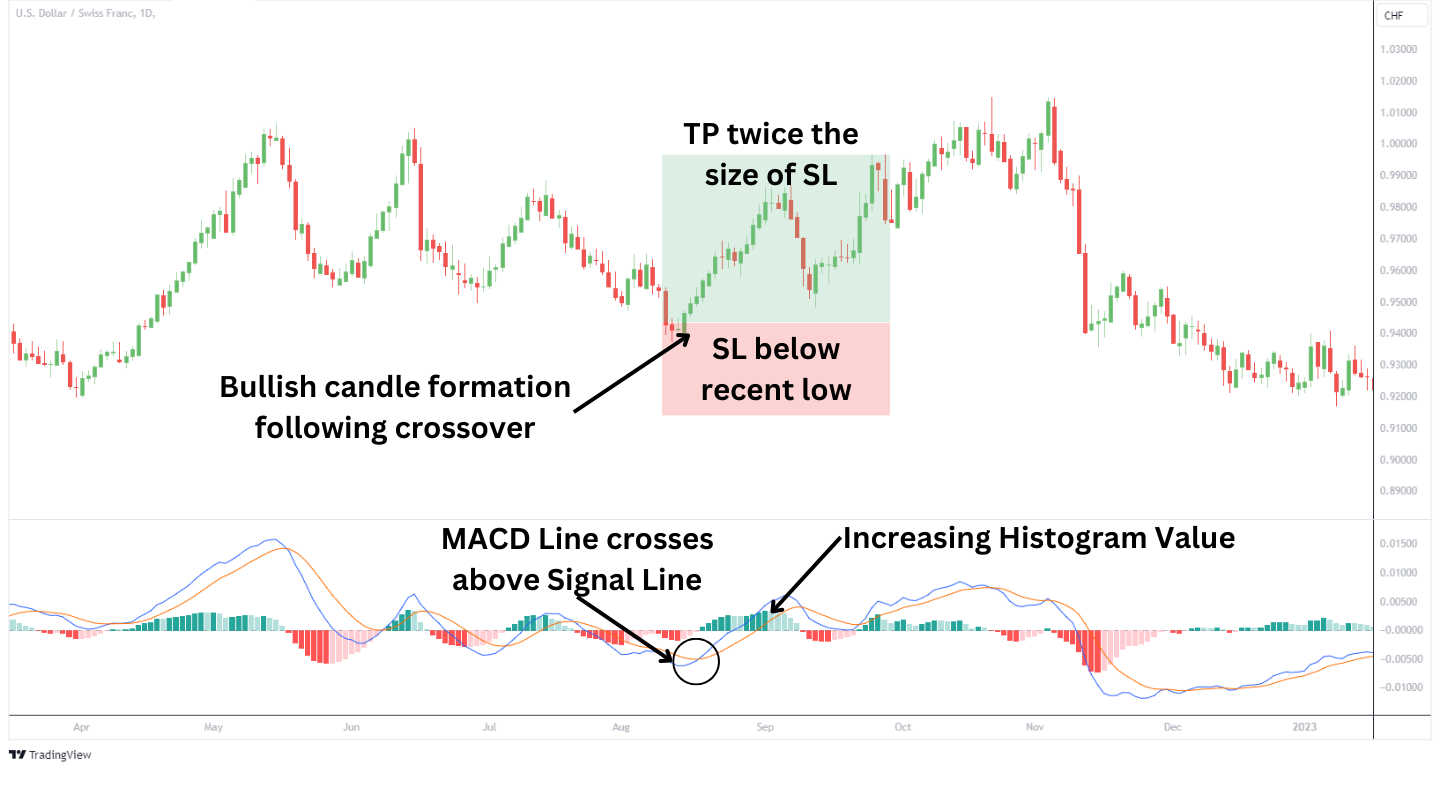
Placing the stop loss order below the most recent swing low for buy positions can help protect against sudden market downturns. When setting a take-profit target, aiming for a distance that is twice the size of the stop-loss order from the entry point can help maximize potential trend strength while maintaining a favorable risk-reward ratio.
Zero-Cross Strategy
The Zero-Cross Strategy in MACD is used for gauging shifts in market momentum, relying on the MACD line’s crossing of the zero line. To refine this strategy, traders should confirm the overall market trend before acting on zero-cross signals. A bullish signal, where the MACD line crosses above zero, gains validity in an upward-trending market. In contrast, a bearish signal, marked by the MACD line crossing below zero, is more reliable during a downtrend. This can be assessed using trendlines or other trend indicators.
The stop-loss level is aimed below the nearest low of the asset while the take-profit level is twice the size of the stop-loss level. A risk-to-reward ratio of 1:2 would be suitable for trading this strategy.
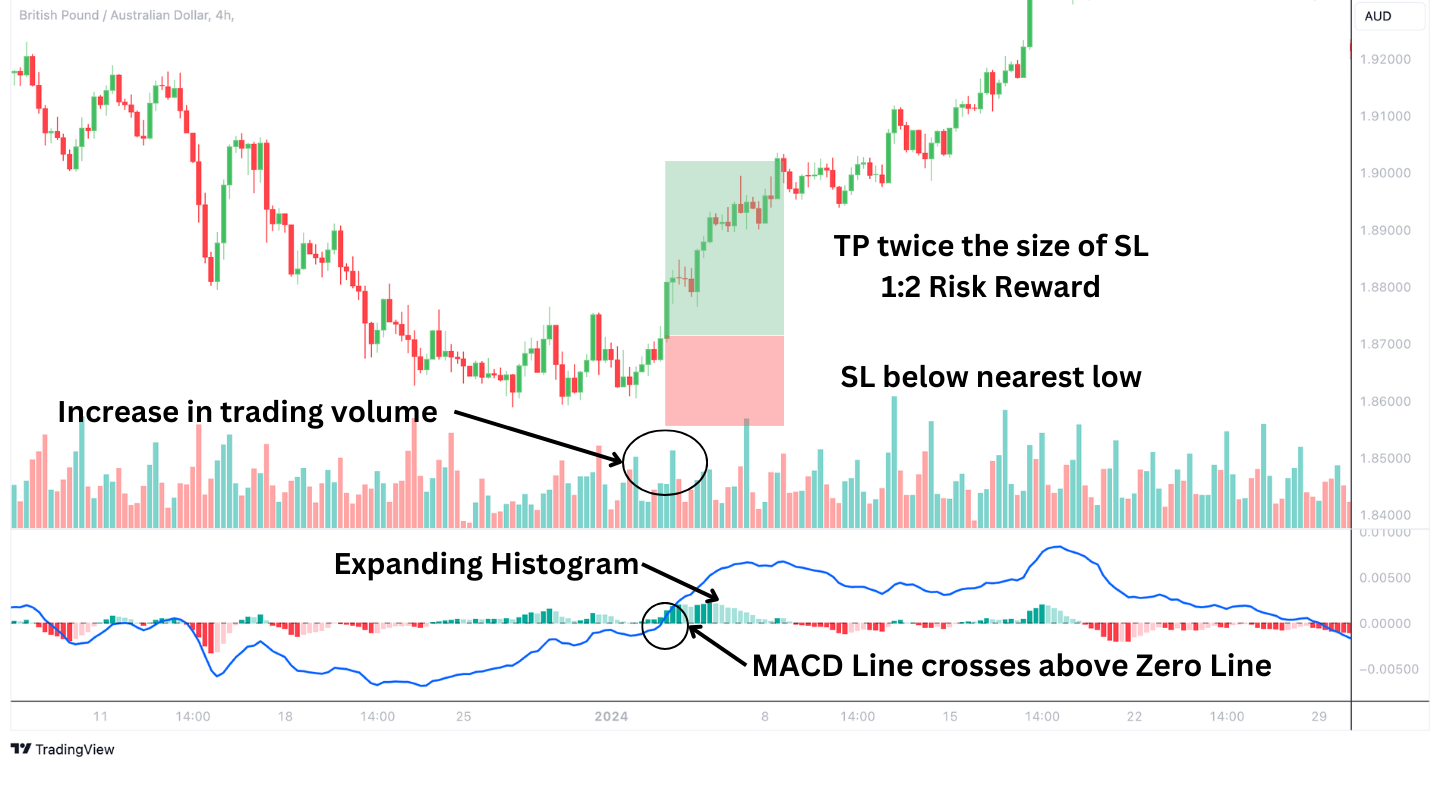
Additionally, incorporating trading volume as a confirmation tool can enhance the strategy’s effectiveness. An increase in volume during a zero-line cross suggests a more substantial market commitment to the new trend. Observing the MACD histogram is also crucial; an expanding histogram at the time of the cross indicates growing momentum, bolstering the signal’s strength.
Relative Vigor Index (RVI)
The Relative Vigor Index (RVI) strategy in MACD analysis involves using the RVI indicator in conjunction with the MACD to enhance the accuracy of trading signals.RVI is a momentum oscillator that measures the strength of a trend by comparing an asset’s price to its trading range while smoothing the results using a Simple Moving Average (SMA).
In this strategy, the RVI is used alongside the MACD to confirm the strength of trend signals. Fine-tuning the RVI settings to align with the MACD’s standard parameters can significantly improve signal reliability. Cross-confirmation is an essential technique in this strategy, where simultaneous or near-simultaneous crosses of the RVI and MACD lines over their respective signal lines offer a trade signal.
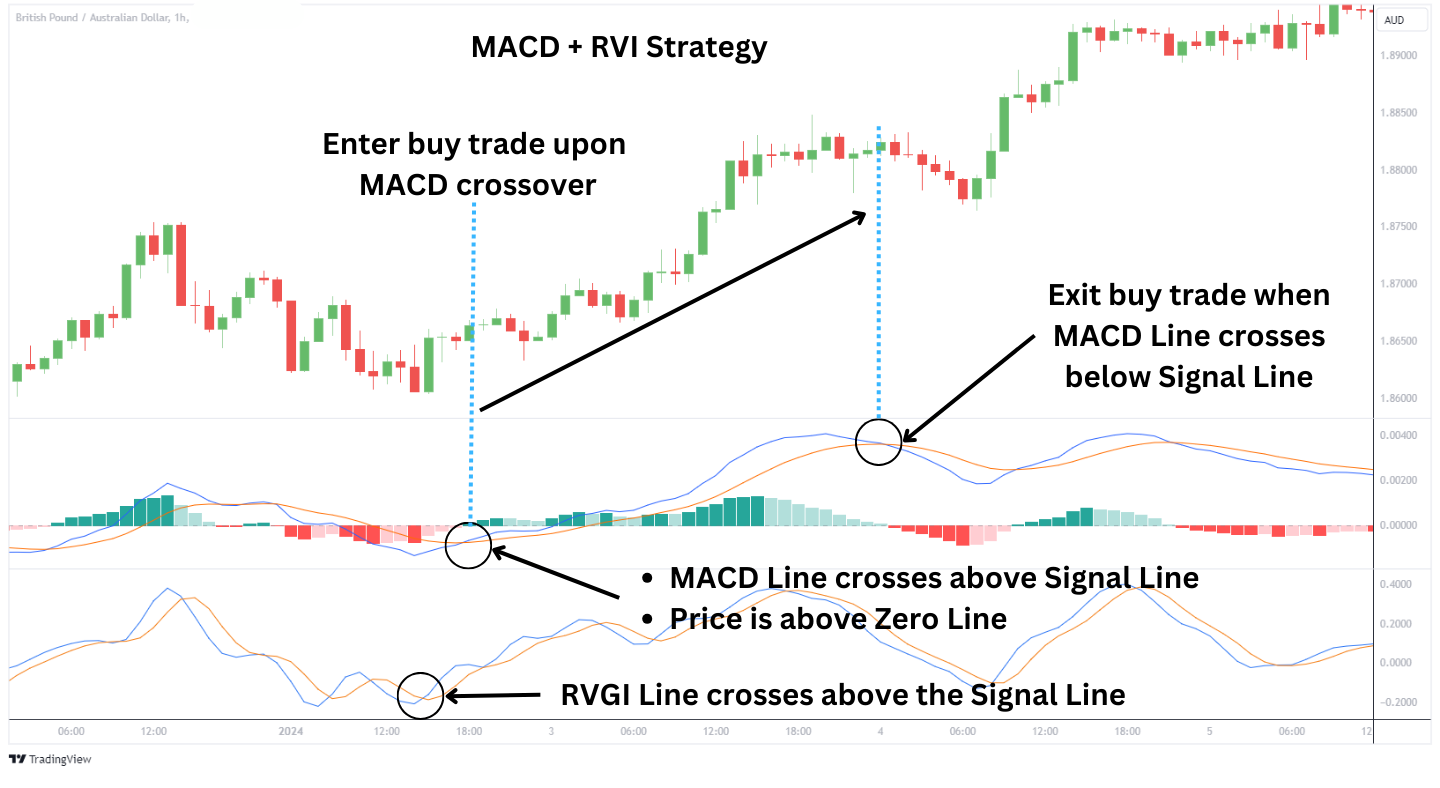
Monitoring for divergence between the RVI and price action adds an extra validation layer. For instance, a bullish MACD crossover coupled with an RVI cross above its signal line can indicate a potential rally, validating a buy decision. Conversely, an RVI peak coinciding with a bearish MACD crossover may signify a robust selling opportunity.
This strategy also emphasizes the importance of context. In volatile or flat markets, traders should exercise caution, as the RVI and MACD signals may be less reliable. The combined use of RVI and MACD offers more precise insights into market momentum and aids in filtering out less credible signals, providing traders with a more refined approach to market analysis.
Interpreting MACD in Trending vs Range-Bound Markets
Understanding the context of the market is important when interpreting MACD signals. In strong trending markets, MACD’s signals can be very reliable as it helps with trend and momentum identification. The MACD line will spend a lot of time to the trending side of the zero line. Additionally, cross overs in the direction of the larger trend tend to be more reliable.
However, in range-bound conditions, the MACD will struggle. That is because the market is lacking a trend and momentum, rendering the indicator less useful. As a result, it’s advisable to seek additional confirmation from other tools, like Stochastic, to avoid false signals in range-bound markets.
Advantages of using the MACD indicator
- Versatility: MACD’s effectiveness isn’t limited to a particular market or timeframe. It provides reliable signals in stock, forex, and commodity markets for short-term day trading or long-term investment strategies. This versatility allows traders to apply MACD in various trading conditions and investment approaches, making it a universally valuable technical analysis tool. The effectiveness of MACD can be improved by optimizing its parameters to suit any specific market’s volatility.
- Combination Analysis: MACD involves analysis of both trend direction and momentum. It tracks trend direction and momentum strength simultaneously. This gives traders a more holistic view of the market, enabling them to make more informed decisions about entry and exit points.
- Ease of Interpretation: Despite its comprehensive analysis capabilities, MACD is relatively simple to understand and interpret compared to more complex indicators. This accessibility makes it suitable for novice and experienced traders, allowing a wide range of market participants to benefit from its insights. An essential tip for newer traders is to use MACD with clear-cut price action signals to reinforce their trading decisions.
Disadvantages of using the MACD indicator
- Lagging Indicator: As a tool based on moving averages, MACD is inherently a lagging indicator. It relies on past price data, which can result in delayed signals. This delay might cause traders to enter or exit trades later than the optimal point, potentially reducing profit margins or increasing losses.
- Default Settings: Many traders use MACD with its default settings (12, 26, 9), which might only be optimal for some trading scenarios or individual strategies. Relying solely on default settings without adjusting them to specific market conditions or personal trading styles can limit MACD’s effectiveness.
- Price Gaps and Market Movements: Sudden price gaps or sharp market movements can lead to abrupt changes in the MACD indicator, causing potential confusion or misinterpretation. This can lead to hastily made trading decisions, especially for those who react without further confirmation from other sources.
What Indicators Work Best with MACD?
Stochastic Oscillator
The Stochastic Oscillator is a momentum indicator and is highly effective when combined with MACD, especially in identifying overbought or oversold market conditions. This indicator compares an asset’s closing price to its price range over a specific period.
The GBPJPY pair below is at an overbought level, followed by the crossing of the MACD Line below the signal line. This indicates a potential sell signal where prices are expected to decline.
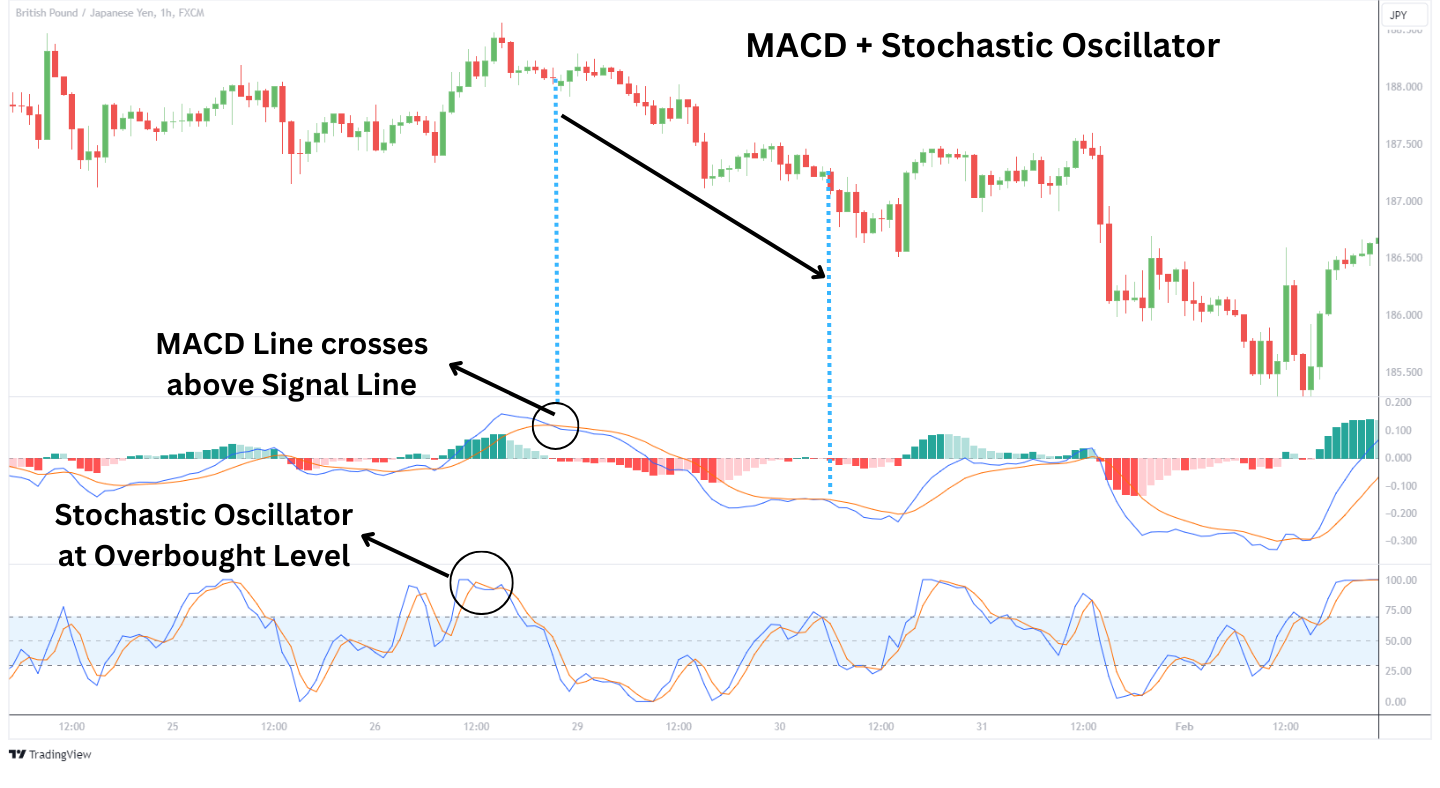
In ranging markets, where MACD struggles to provide clear signals due to its trend-centric nature, the Stochastic Oscillator steps in to fill the gap. It excels at pinpointing the critical mini-highs and lows, offering traders precise entry and exit points. This makes the Stochastic Oscillator an essential complement to MACD.
MACD With RSI and SMA
MACD’s versatility allows it to be used as an all-in-one indicator. Whereas, other indicators like the Relative Strength Index (RSI) and Simple Moving Average (SMA) provide specific use cases.
For example, the Relative Strength Index (RSI) is used to determine when the strength of the asset is strong and losing momentum. The MACD can perform the same function when the MACD line crosses the signal line or when the MACD histogram begins to shrink.
Additionally, the SMA is often used to determine the direction of the trend. MACD can perform the same function when you analyze the placement and direction of the MACD line relative to the zero line.
As a result, it would be a little redundant to incorporate the RSI and SMA together with the MACD. The additional indicators may simply clutter the chart and distract the trader from actually seeing the signal.
MACD vs. Relative Strength
On their own, MACD and RSI are popular tools in technical analysis, each with distinct functions. The MACD is an unbounded indicator primarily used for gauging momentum and identifying potential trend continuations through its two EMAs. It offers versatility in detecting divergences, not only via the MACD line but also through its histogram.
In contrast, the RSI is a bounded indicator, operating within a range of 0 to 100. It identifies overbought and oversold conditions by comparing recent price gains and losses. This makes RSI a valuable tool for anticipating potential price reversals. While MACD provides insights into momentum, RSI focuses on price extremes, with its single value line offering a direct view of market conditions.
Traders often use RSI for timing market entries and exit in volatile conditions, while MACD helps understand momentum and validate trends’ strength.
MACD vs Stochastic
MACD and Stochastic are popular technical analysis tools, yet they differ significantly in their application and interpretation.
The MACD is an unbounded indicator, meaning it doesn’t have upper or lower limits to its range. It uses exponential moving averages to highlight trend direction and momentum. MACD is most effective in trending markets as a lagging indicator, it helps identify the strength and direction of the trend.
Stochastic is a momentum oscillator that ranges between 0 and 100. It compares an asset’s closing price to its price range over a specific period, signalling overbought or oversold conditions. Stochastic excels in ranging markets as a leading indicator, providing valuable insights for short-term trading decisions by identifying potential reversal points.
Both indicators feature a primary line and a signal line, but their interpretations differ. While MACD is valuable for analyzing momentum over more extended periods, Stochastic’s strength lies in its ability to pinpoint entry and exit points in markets where prices are fluctuating but not following a clear trend, making it a go-to choice for short-term traders.
TTM Squeeze vs MACD
MACD is a momentum tracker that signals trend direction by comparing two moving averages.
TTM Squeeze focuses on market volatility by combining Bollinger Bands and Keltner Channels to identify low-volatility periods that precede significant price movements. TTM Squeeze alerts traders to potential breakouts from periods of consolidation, unlike MACD, which follows the trend. When the market is quiet, TTM Squeeze indicates this with a ‘squeeze,’ when it expands, it signals a potential breakout, either bullish or bearish.
While MACD provides insights on trend momentum, TTM Squeeze specializes in pinpointing market breakout points following periods of low volatility. This fundamental difference makes TTM Squeeze particularly valuable for traders looking to capitalize on abrupt market shifts, whereas MACD is more suited for trend-based strategies.
FAQ
What are the best MACD settings?
The most commonly used MACD settings are 12, 26, and 9, representing the 12-period and 26-period exponential moving averages, and a 9-period signal line, respectively. These settings are widely regarded as the best for general trading purposes unless you are trading a volatile asset. Then, a setting of 19,39, 9 is suggested to slow down the sensitivity to volatile price trends.
What is a MACD bullish/bearish divergence?
A MACD bullish divergence occurs when the MACD indicator forms higher lows while the price forms lower lows, suggesting a potential upward trend reversal. Conversely, a MACD bearish divergence happens when the MACD forms lower highs while the price forms higher highs, indicating a possible downward trend reversal.
Is MACD a leading indicator or a lagging indicator?
MACD is a lagging indicator, as it is derived from historical price data, primarily past moving averages, to confirm trend direction and momentum after they have occurred.
Why Does MACD Use 12 and 26?
12 and 26 do appear like crazy numbers as standard input values. They represent weekly cycles as there are 52 weeks in a year. The 12 and 26 represent about ¼ and ½ of a yearly cycle on a weekly chart.
Shrinking MACD histogram, what does it mean?
The shrinking of a MACD histogram indicates a decrease in the spread between the 12 and 26 EMA. That EMA spread shrinks when the price trends are losing momentum from their uptrend or gaining momentum in their downtrend.
How reliable is the MACD?
The reliability of MACD depends on the strategy deployed, your stop loss, take profit level, and the market conditions. The reliability of MACD as a technical analysis tool can be enhanced by using it in conjunction with other technical analysis tools like support and resistance.
Who invented the MACD?
The MACD (Moving Average Convergence Divergence) indicator was invented by Gerald Appel in the late 1970s. Over time, the MACD has been adopted by traders and analysts globally due to its dual functionality of being a trend following and momentum indicator packaged in one.
What is the difference between signal line crossovers and centerline crossovers in MACD?
In MACD, signal line crossovers occur when the MACD line (the difference between the 12-period and 26-period EMAs) crosses the signal line (the 9-day EMA of the MACD line). This indicates potential buy or sell opportunities. A crossover above the signal line suggests bullish momentum, while a crossover below indicates bearish momentum.
Centerline crossovers happen when the MACD line crosses the zero line. Crossing above the zero line signifies a shift to positive momentum (bullish), and crossing below indicates negative momentum (bearish), often reflecting broader market trend changes.
Can the MACD be used to identify overbought and oversold levels?
The MACD isn’t used for identifying overbought or oversold levels as it’s an unbounded indicator without defined limits. It’s more effective for tracking the direction and strength of a trend. In contrast, bounded indicators like the RSI are designed to pinpoint when the market is reaching extreme pricing and potentially may turn.
Can MACD values be compared for different securities?
No, it’s not effective to directly compare MACD values across different securities. The MACD is calculated from price-based moving averages, which vary significantly with each security’s price level.


