


Written by:

Reviewed by:

Bearish
Bullish
- June 16, 2026
- 31 min read
PD Arrays Trader Guide
In financial markets, price movements are not random. They are driven by a combination of factors, both on the chart and beyond it.
As a result, price does not behave the same everywhere. Some areas attract more activity than others, making them more relevant for market analysis.
PD arrays are one way to organise these areas and help traders interpret price behaviour more effectively. Instead of reacting to every movement, traders focus on specific areas where price is more likely to respond, improving the quality of their decisions.
In this guide, you’ll learn how PD arrays work, how to identify them on the chart, and how to apply them in a clear and practical way.
What is a PD Array Pattern?
A PD array ‘pattern’ is a component of the Smart Money Concepts (SMC) framework, used to identify favourable areas for trading.
They are thought of as supply and demand zones with institutional involvement, where trades have been executed by large, financial entities. With that logic in place, SMC interprets that when price returns to a PD array, that financial institutions will look to enter with more size or defend their positions.
The term PD stands for premium and discount, while arrays stand for “arrangement”:
- Premium refers to areas where price is relatively high within a defined range.
- Discount refers to areas where price is relatively low in that range.
- Array/Arrangement simply classes them as visual patterns to look for in trading.
So together, PD arrays are areas that help traders understand whether price is in a more favourable location to look for selling or buying opportunities.
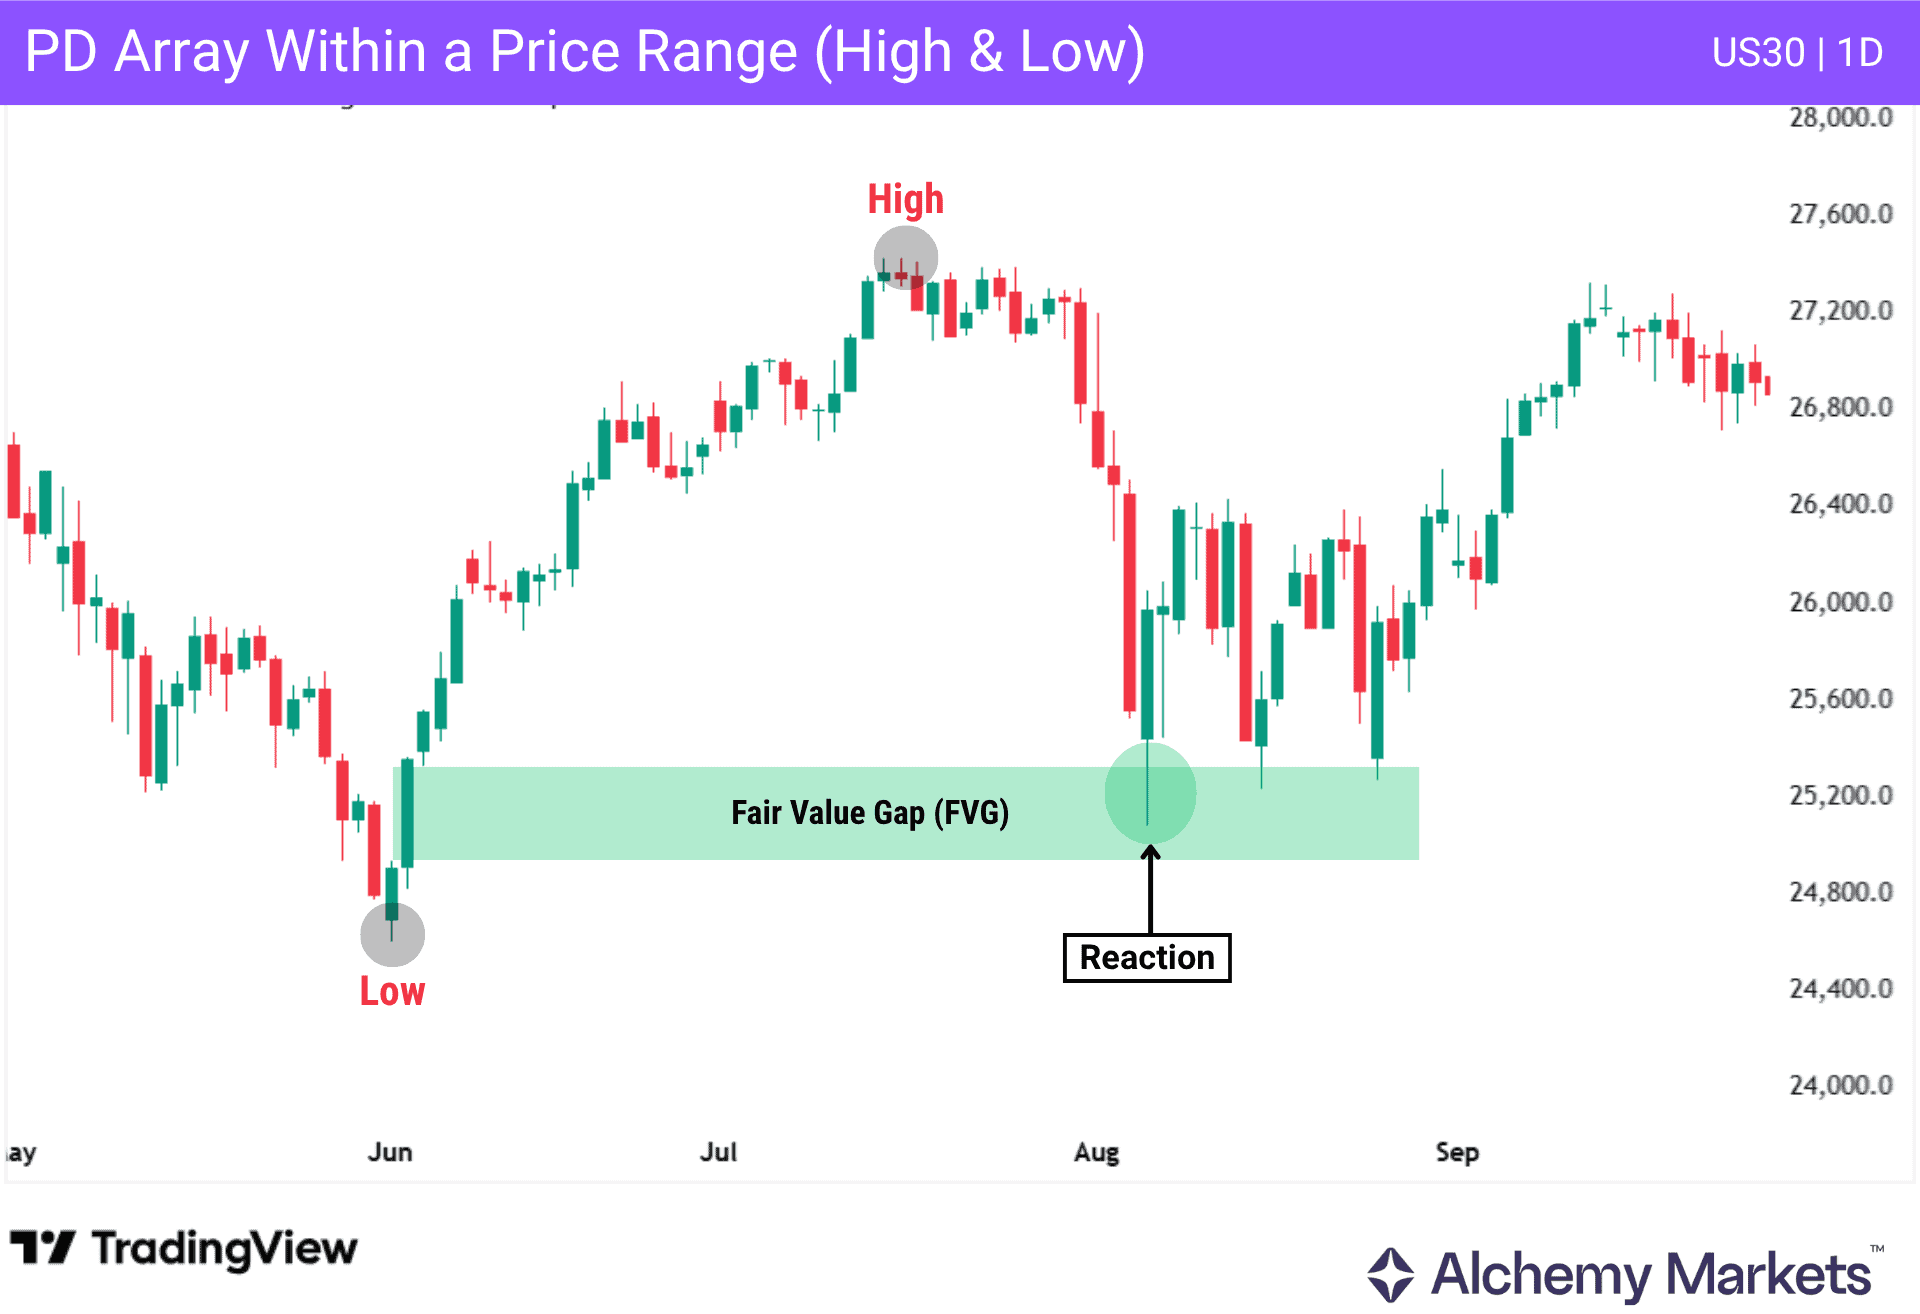
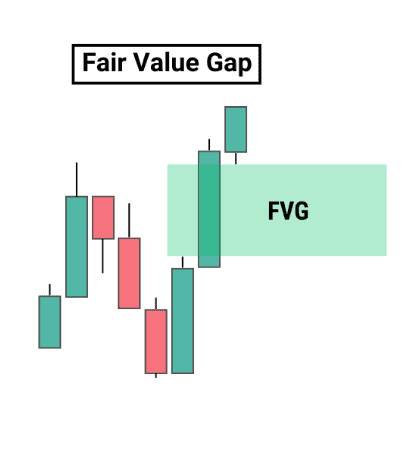
For example, a Fair Value Gap (displayed in the image above) would be considered a PD array, as it is a Smart Money Concepts derived support/resistance zone.
Where the Idea Comes From
PD arrays as a concept was formalised within a new trading approach that emerged in the 21st century, known to many as Smart Money Concepts (SMC).
The core belief of Smart Money Concepts is that financial institutions, or large financial players, are the ones who have the capital to affect market movements.
So as a retail trader (commonly referred to as ‘dumb money’), we must understand where Smart Money has entered the market, and their intent for a market’s price action.
PD arrays reveal areas where Smart Money has demonstrated buying or selling interest, and correctly identifying them can help traders align with the intentions of the Smart Money.
| 🤔 In short: Big players drive the market but leave clues behind. PD arrays help us identify these clues, so we can find price areas to trade in the same direction as the big players. |
How to Identify the PD Array Pattern
A PD array first starts with swing analysis. Before looking for an entry, traders first need to define the dealing range by marking the swing low and swing high of a strong price move.
This range helps divide price into two key areas:
- Premium: the upper half of the range, where short setups become more relevant.
- Discount: the lower half of the range, where long setups become more relevant.
The midpoint of the range is often called the equilibrium level. Price above this level is considered premium, while price below it is considered discount.
The goal is not to buy or sell just because price enters one of these zones. Instead, the PD array helps traders understand whether price is in a more favourable area for the current market bias.
| For example, if price is forming higher highs and higher lows, the market has a bullish structure. In that case, traders may look for long setups when price pulls back into the discount area. If price is forming lower lows and lower highs, the market has a bearish structure. In that case, traders may look for short setups when price retraces into the premium area. |
Basically, the dealing range gives context, while the market structure gives direction. A PD array works best when both are aligned.
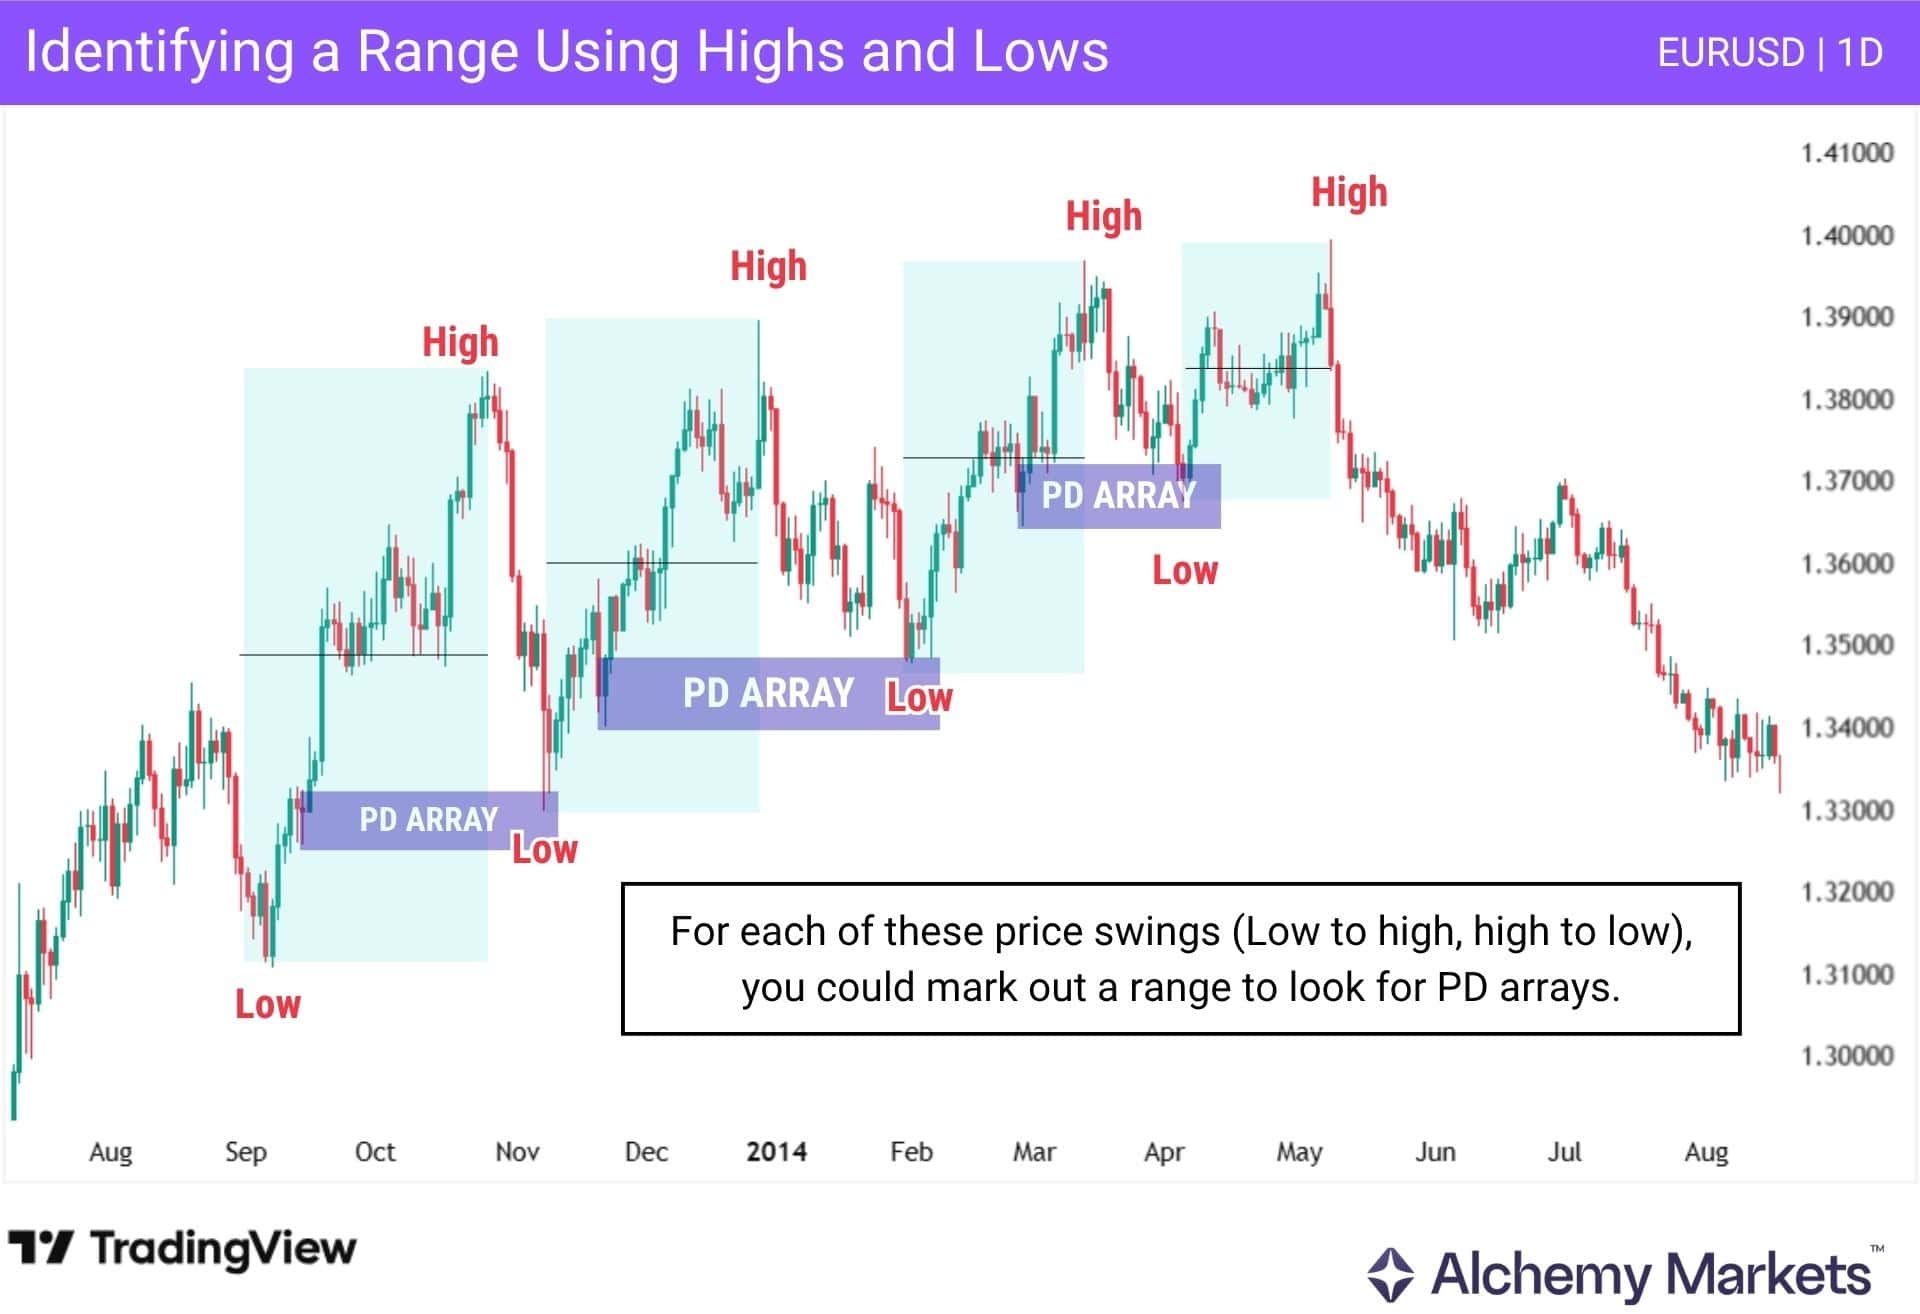
Once this range is defined, traders can look inside it for PD array patterns.
Again, these are areas that SMC traders believe Smart Money have likely entered the market, making them potent reaction zones.
The basic flow is simple:
| Range → Impulsive move → PD array → Retracement → Reaction |
As shown in the chart, each swing creates a new range where traders can mark potential PD arrays. The goal is not to trade every move, but to identify the areas where price is more likely to respond.
Premium and Discount Zones of a PD Array
PD Zones, or premium and discount zones, are used to determine whether price is relatively high or low within a range. This can give traders a guideline for when to favour a long or short position.
Just like how you’d use a Fibonacci retracement tool, a PD zone is applied from swing point to swing point, creating an upper zone (Premium), lower zone (Discount), and an equilibrium point (50% mark).
Traders often use SMC tools like MSS, FVGs, and order blocks as trigger tools to trade inside PD Zones
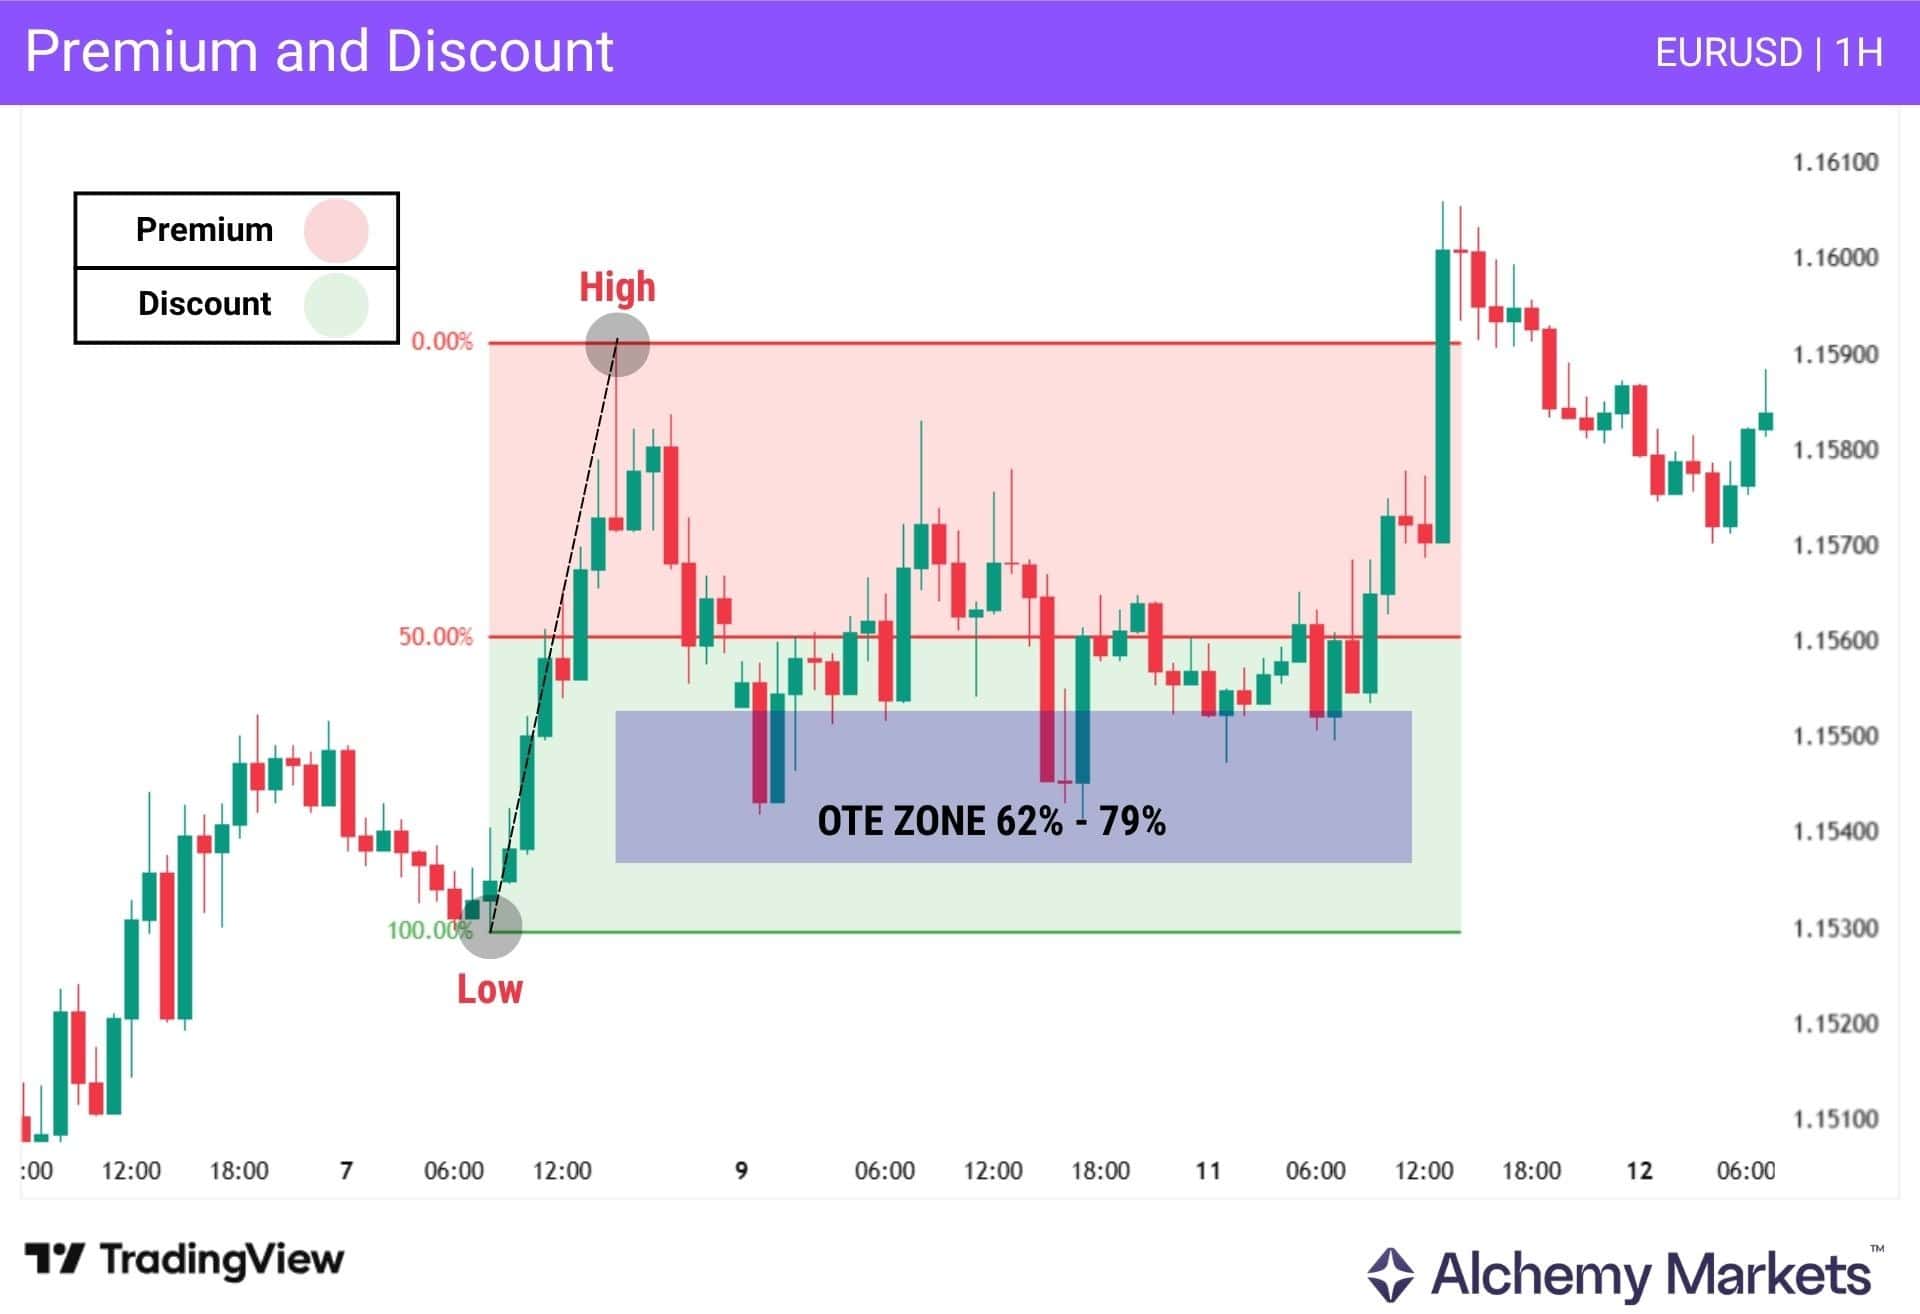
Beyond the 50% equilibrium level, ICT traders may also watch the deeper Fibonacci retracement levels between 62% and 79%.
This area is known as the Optimal Trade Entry, or OTE, zone.
In bullish conditions, a bullish PD array may carry more weight when it forms inside the 62%–79% discount area. In bearish conditions, a bearish PD array may carry more weight when it forms inside the 62%–79% premium area.
Uptrend Environment PD Zones
In an uptrend, the Premium-Discount Zone should be marked based on swing low to swing high.
Then, only long positions should be taken based on a retrace back into the Discount Zone.
This line of thinking has three advantages:
- Alignment with overall trend structure.
- Better to risk-to-reward.
- Alignment with Smart Money logic; these institutions have a preference for buying when something is under equilibrium valuation.
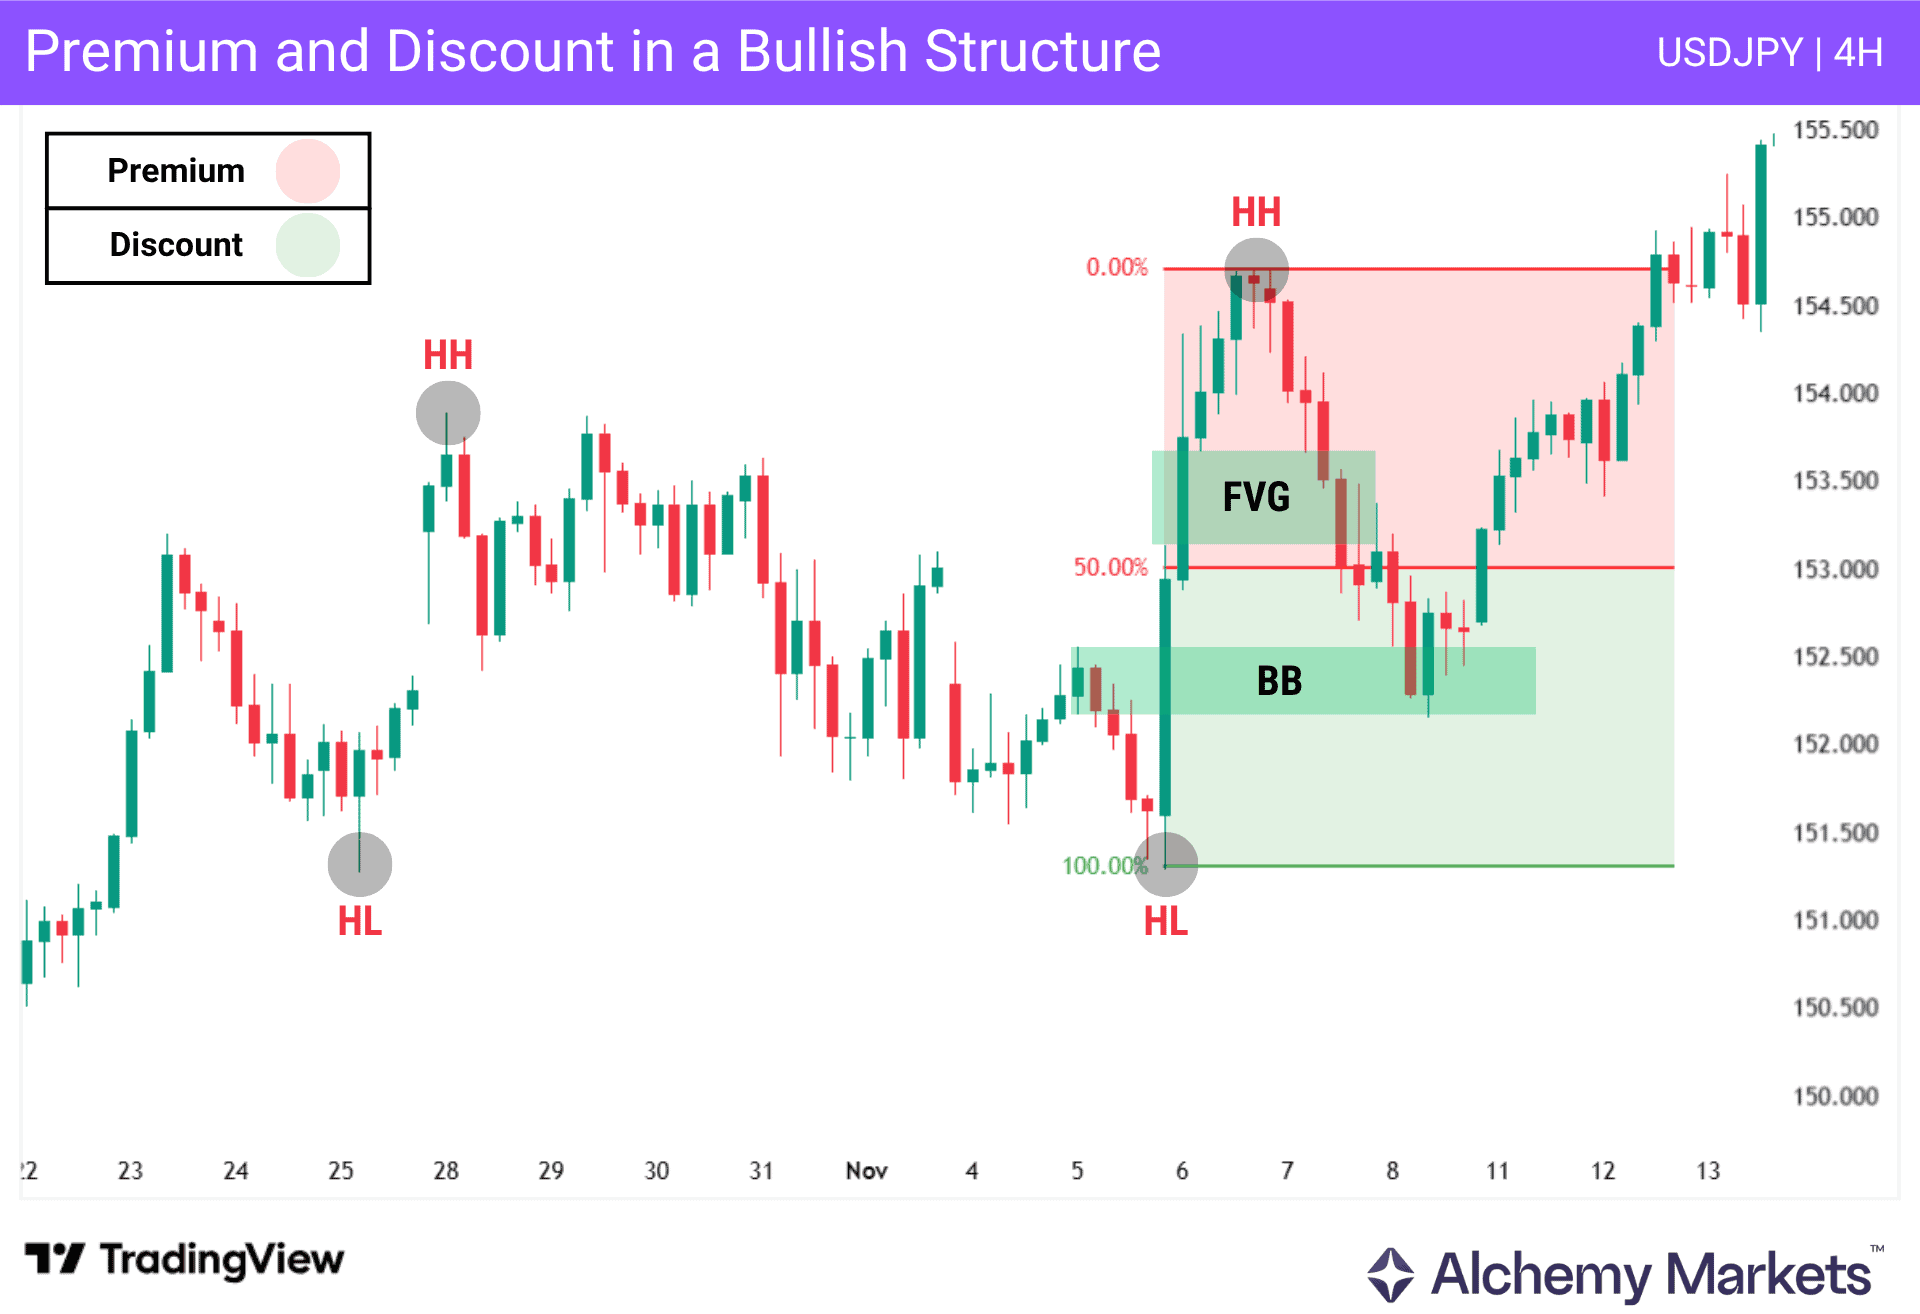
Notice how price on USDJPY is forming a bullish structure by creating higher highs and higher lows.
As price retraces into the discount area and forms a higher low, the PD array, in this case a breaker block, leads to a clear bullish reaction.
In contrast, the bullish Fair Value Gap PD array at the premium zone does not lead to a positive reaction.
Downtrend Environment PD Zones
In a downtrending environment, PD zones are drawn from swing high to swing low. The premium zone still remains at the top, while the discount is still at the bottom.
So in downtrend environments, we only want to look for sells at PD arrays in premium zones.
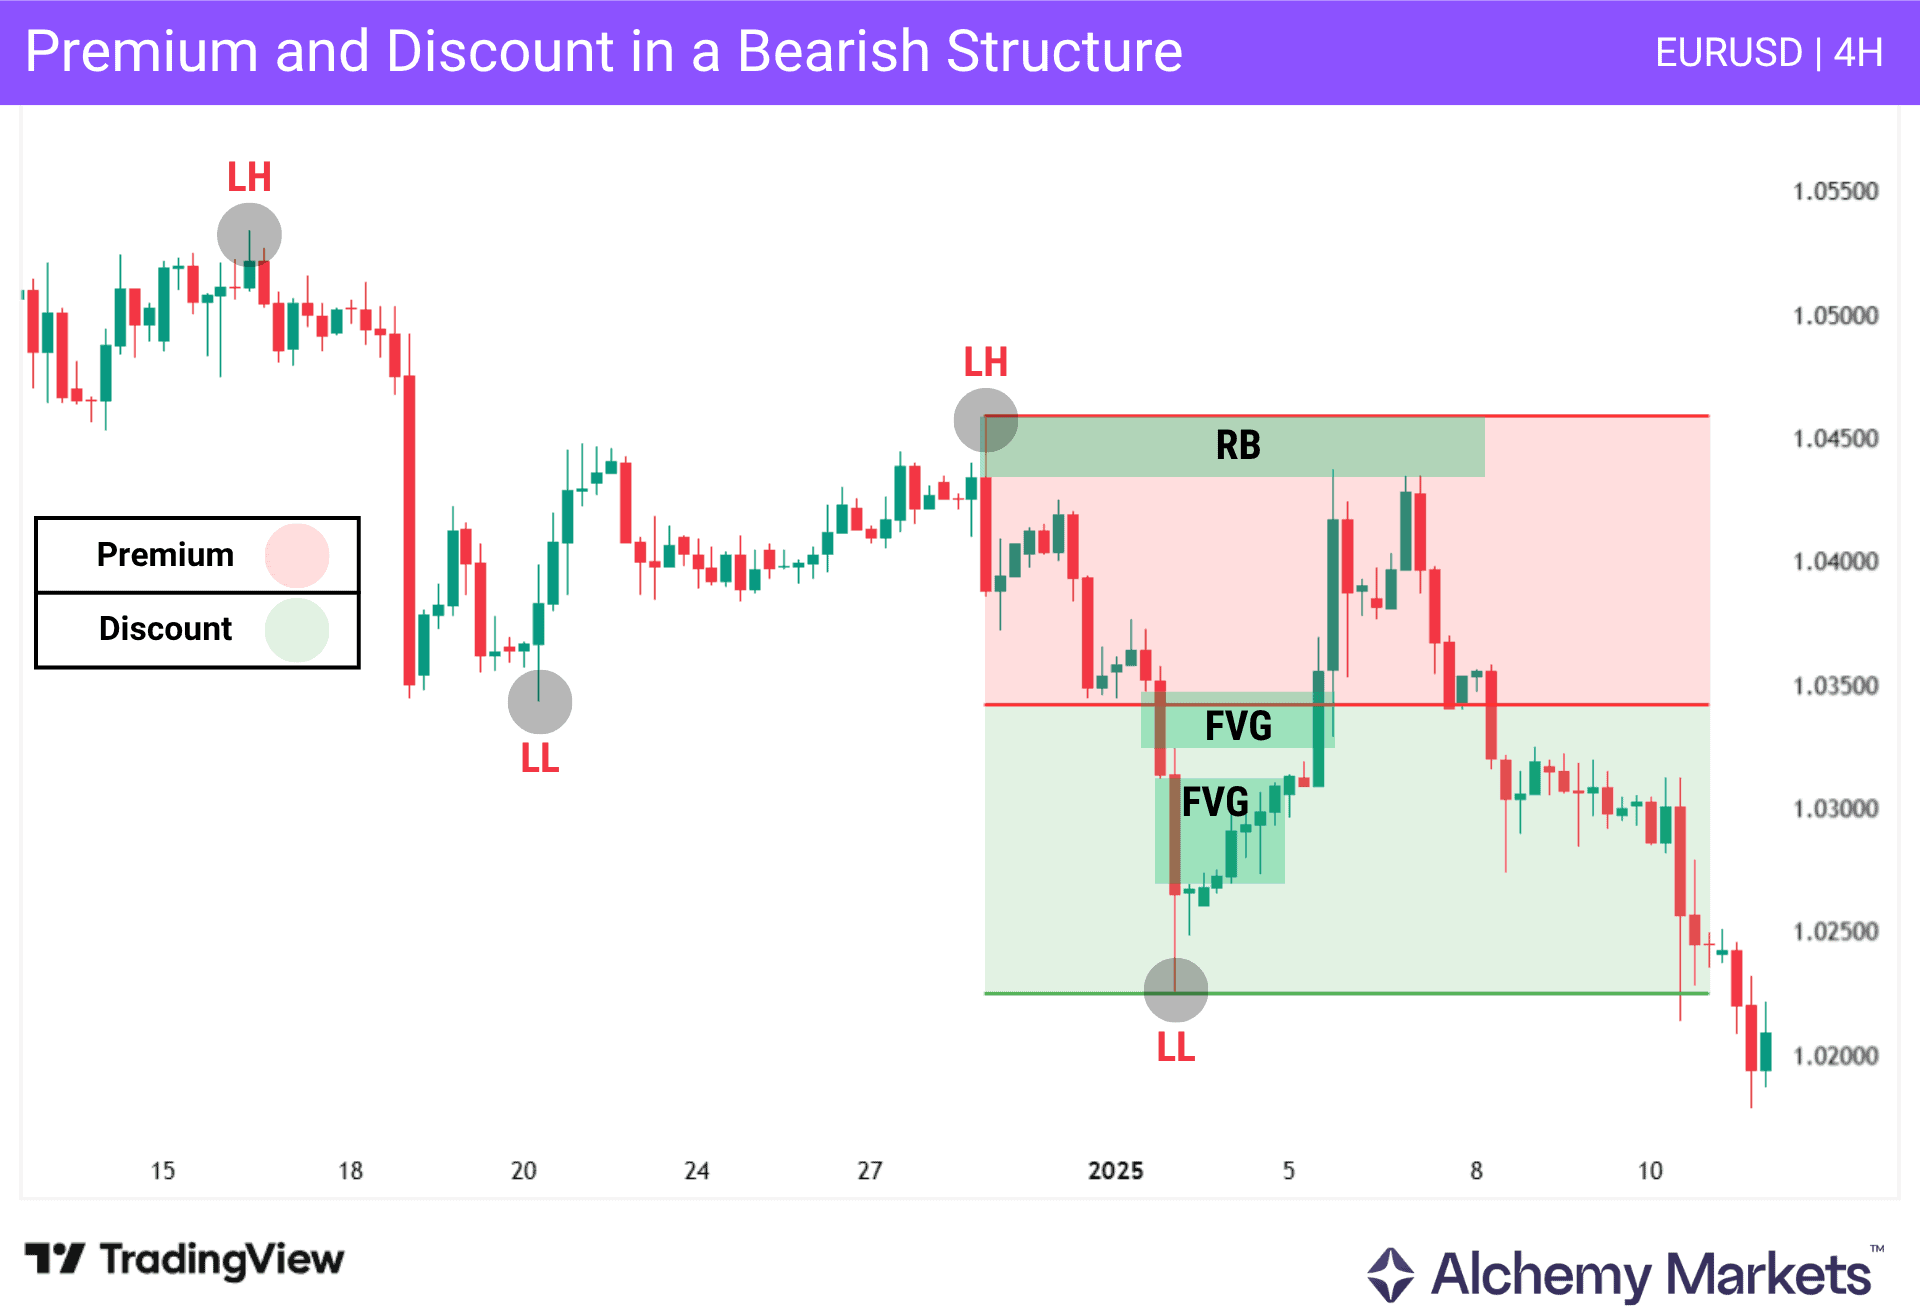
As you can see in this EURUSD 4H example, the price retraces back into the premium zone’s PD array (RB – short for rejection block), and begins its ‘true move’ from there.
By contrast, the Fair Value Gaps (FVG) in the discount zone do not provide any sort of tradeable reaction.
Types of PD Arrays
Under the Smart Money Concepts framework, there are several PD arrays traders look for, with each having its own structure, purpose, and reaction logic.
This guide covers the main bullish and bearish PD arrays first, before moving into additional ICT-style concepts such as old highs/lows, the Unicorn Model, NWOG, and NDOG.
Bullish PD Arrays
Bullish PD arrays are areas where price may find buying interest and move higher.
 | Bullish Order Blocks They represent the last bearish candle before a strong upward move. It forms when selling pressure is absorbed and price moves higher. This area may act as a point where price returns and reacts. |
 | Bullish Fair Value Gaps (FVGs) These are three-candle structures that form during a strong upward move, leaving a gap between the first and third candle wicks. This imbalance shows that price moved quickly, and it may return to rebalance before continuing higher. |
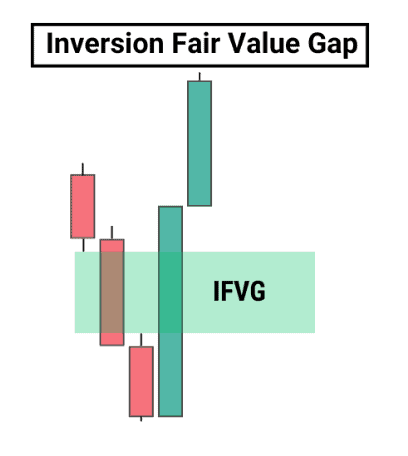 | Bullish Inverse FVGs These describe a bearish FVG that fails to hold and is broken to the upside. This shows strength, and the area may later act as support, where price can react after a pullback. |
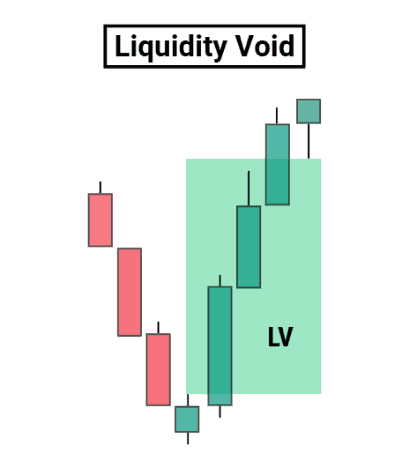 | Liquidity Voids Refer to areas formed by strong price movements (upwards for bullish, downwards for bearish) with little or no pullback. These are effectively “extended fair value gaps” that go beyond just a three-candlestick structure. Liquidity voids leave behind inefficient structure, and price may later return to partially fill the area before continuing higher. |
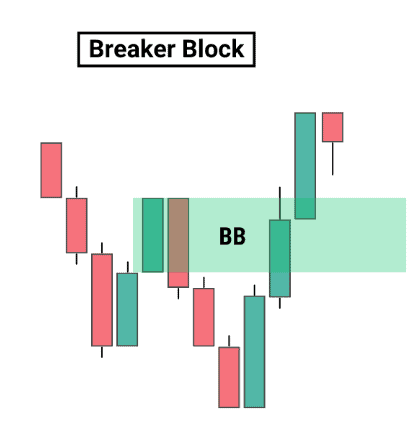 | Bullish Breaker Blocks Refer to a high that price breaks through after taking a low. After the break, the candle that formed the high becomes the breaker block. Price may return to this area and show a bullish reaction. |
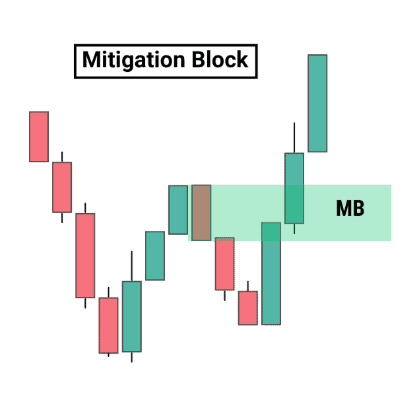 | Bullish Mitigation Blocks These represent an area formed after a failed attempt to break a low, known as a failure swing, followed by a move higher that breaks a high, known as a market structure shift. Price may return to this area to rebalance before continuing upward. |
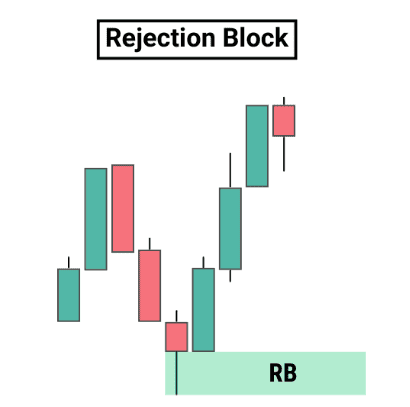 | Bullish Rejection Blocks Refer to areas formed by candles with strong lower wicks, followed by strong bullish candles. They show that price attempted to move lower but was quickly rejected, indicating buying pressure. |
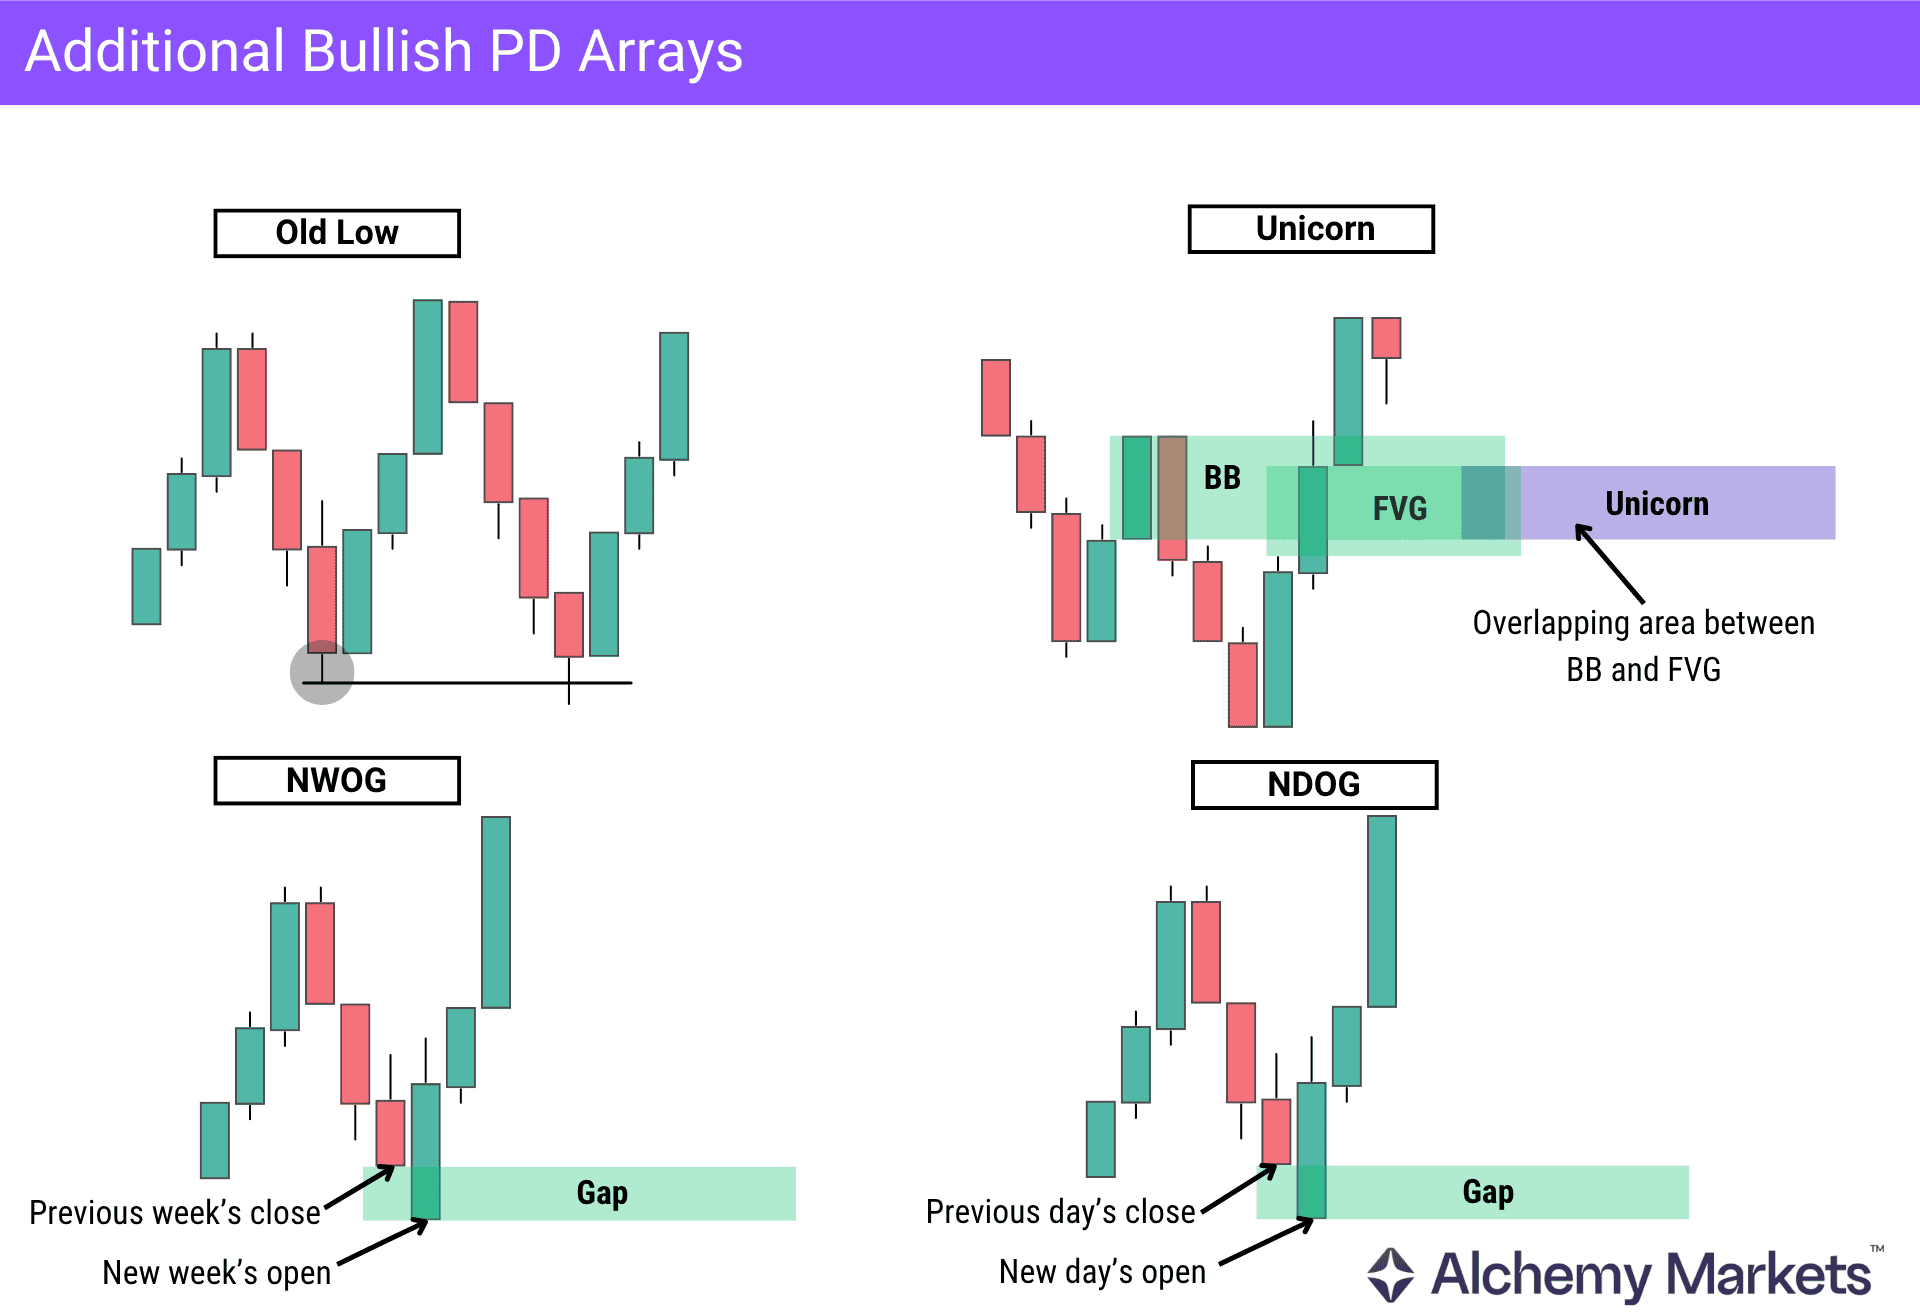
Old lows are previous swing lows where sell-side liquidity may rest. In a bullish setup, price may revisit or sweep these lows before rejecting them and moving higher.
Bullish Unicorn Model combines a breaker block with a fair value gap after price takes a low and reverses upward. The overlap can provide a more precise, bullish reaction area after a pullback.
New Weekly Opening Gaps (NWOG) and New Daily Opening Gaps (NDOG) are inefficient areas created between session opens. In bullish conditions, they may act as support or reaction zones when price returns to them.
Bearish PD Arrays
Bearish PD arrays are areas where price may find selling interest and move lower after a reaction.
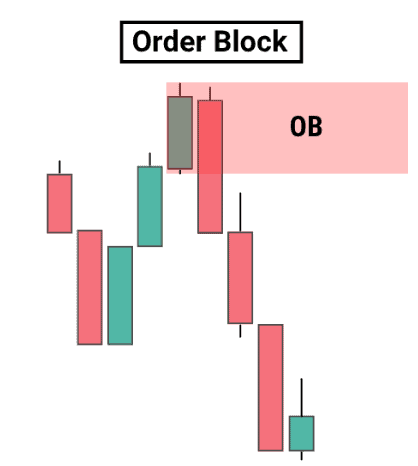 | Bearish Order Blocks Represent the last bullish candle before a strong downward move. It forms when buying pressure is absorbed and price moves lower. This area may act as a point where price returns and reacts. |
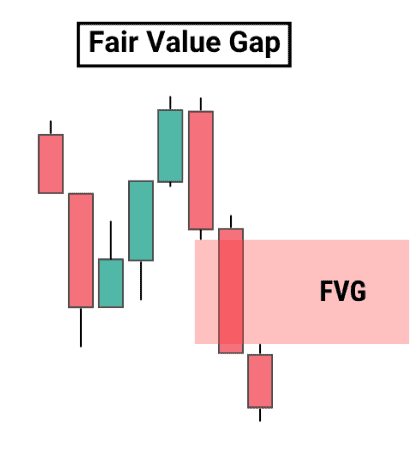 | Bearish Fair Value Gaps (FVGs) Refer to a three-candle structure formed during a strong downward move, leaving an imbalance. This shows that price moved quickly, and it may return to this area before continuing lower. |
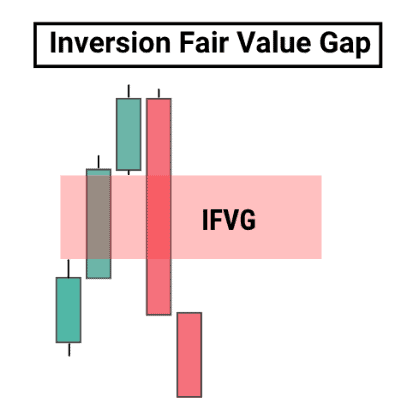 | Bearish Inverse FVGs Describe a bullish FVG that fails to hold and is broken to the downside. This shows weakness, and the area may act as resistance when price returns. |
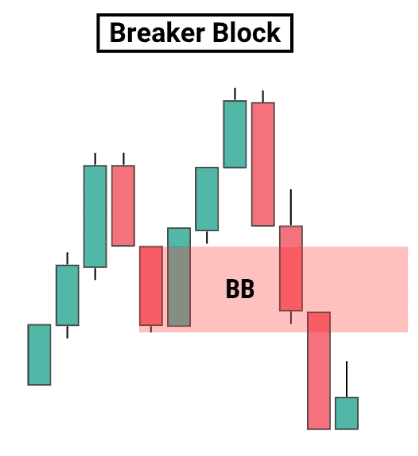 | Bearish Breaker Blocks Refer to a low that price breaks below after taking a high. After the break, the candle that formed the low becomes the breaker block. Price may return to this area and show a bearish reaction. |
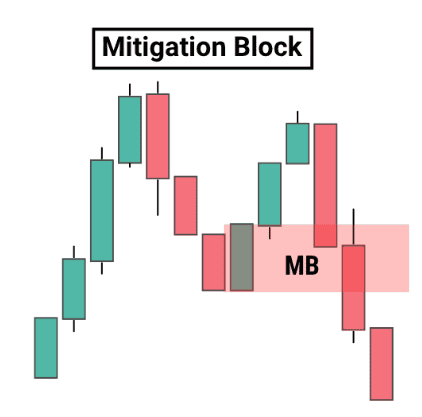 | Bearish Mitigation Blocks Represent an area formed after a failed attempt to break a high, known as a failure swing, followed by a move lower breaking a low. Price may return to this area to rebalance before continuing downward. |
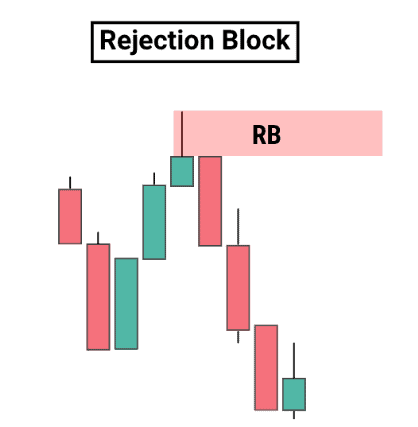 | Bearish Rejection Blocks Refer to areas formed by candles with strong upper wicks, followed by strong bearish candles. They show that price attempted to move higher but was rejected, indicating selling pressure. |
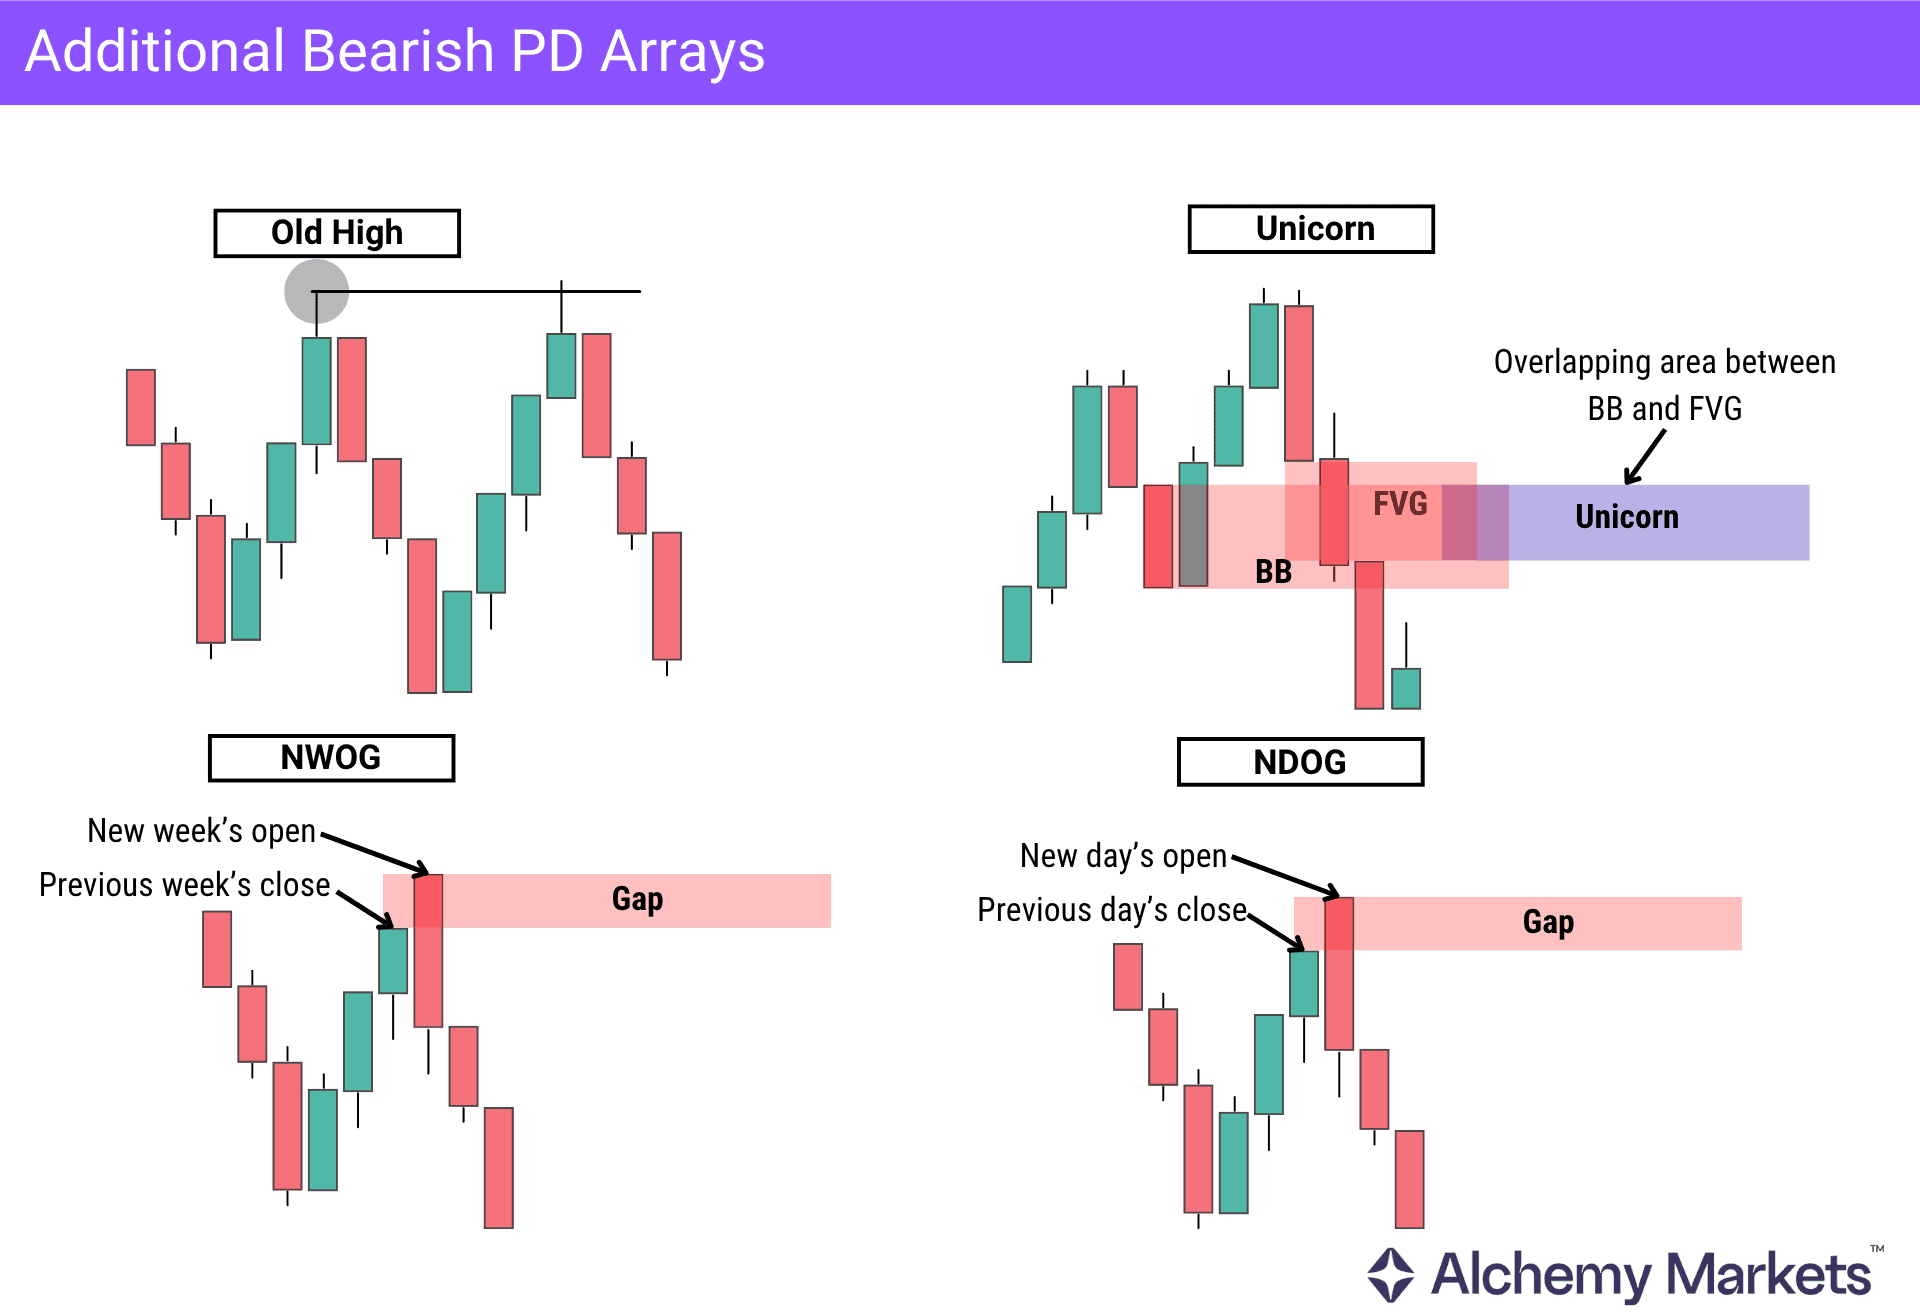
Old highs are previous swing highs where buy-side liquidity may rest. In a bearish setup, price may revisit or sweep these highs before rejecting them and moving lower.
Bearish Unicorn Model combines a breaker block with a fair value gap after price takes a high and reverses downward. The overlap can provide a more precise bearish reaction area after a retracement.
New Weekly Opening Gap (NWOG) / New Daily Opening Gap (NDOG) are inefficient areas created between session opens. In bearish conditions, they may act as resistance or reaction zones when price returns to them.
How Does PD Array Pattern Trading Work?
PD Array trading becomes practical when arrays are used as part of a structured process, rather than treated as automatic entry signals.
The process starts with context. Traders identify the overall trend and recent price movement to define a clear directional bias.
Next, a dealing range is defined using a significant price swing, followed by drawing premium and discount areas. The equilibrium point divides the range and helps locate more favourable prices to find PD arrays.
Once PD arrays are identified, traders wait for price to react and look for confirmation, such as candlestick patterns, a market structure shift (MSS), or the formation of new PD arrays, before entering trades.
Key Confluences to Consider
- Market Bias: Identify direction using recent structure (higher highs/lows or lower highs/lows) or tools such as trendlines and moving averages. Trading in line with the market trend improves consistency.
- Multi-Timeframe Alignment: Ensure higher timeframe direction aligns with the lower timeframe. This adds weight to the trade and avoids conflicting signals.
- Location of PD Arrays: Bullish PD arrays forming in discount or near lows, and bearish PD arrays forming in premium or near highs, are generally more reliable.
- Confirmation (Price Behaviour): Wait for confirmation such as rejection, momentum shift, or a market structure shift (MSS) before execution.
Once these elements align, traders can take trades with the trend and at better prices, which can help improve both win rate and risk-to-reward.
What Does a PD Array Tell You
A PD array helps interpret how price behaves when it reaches an important area.
Each PD array has a different structure, but they all serve the same purpose: identifying areas where price may react and move away.
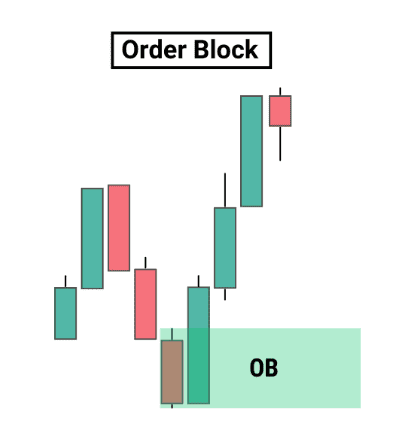
Order Blocks
Perhaps the single most important element of the PD array family, an order block (OB) forms the basis for many of the other PD arrays in the lineup.
An order block is a horizontal support or resistance zone, marked by shows where price has previously shifted direction after strong participation. The range is defined by the size of the last candle before price pivots.
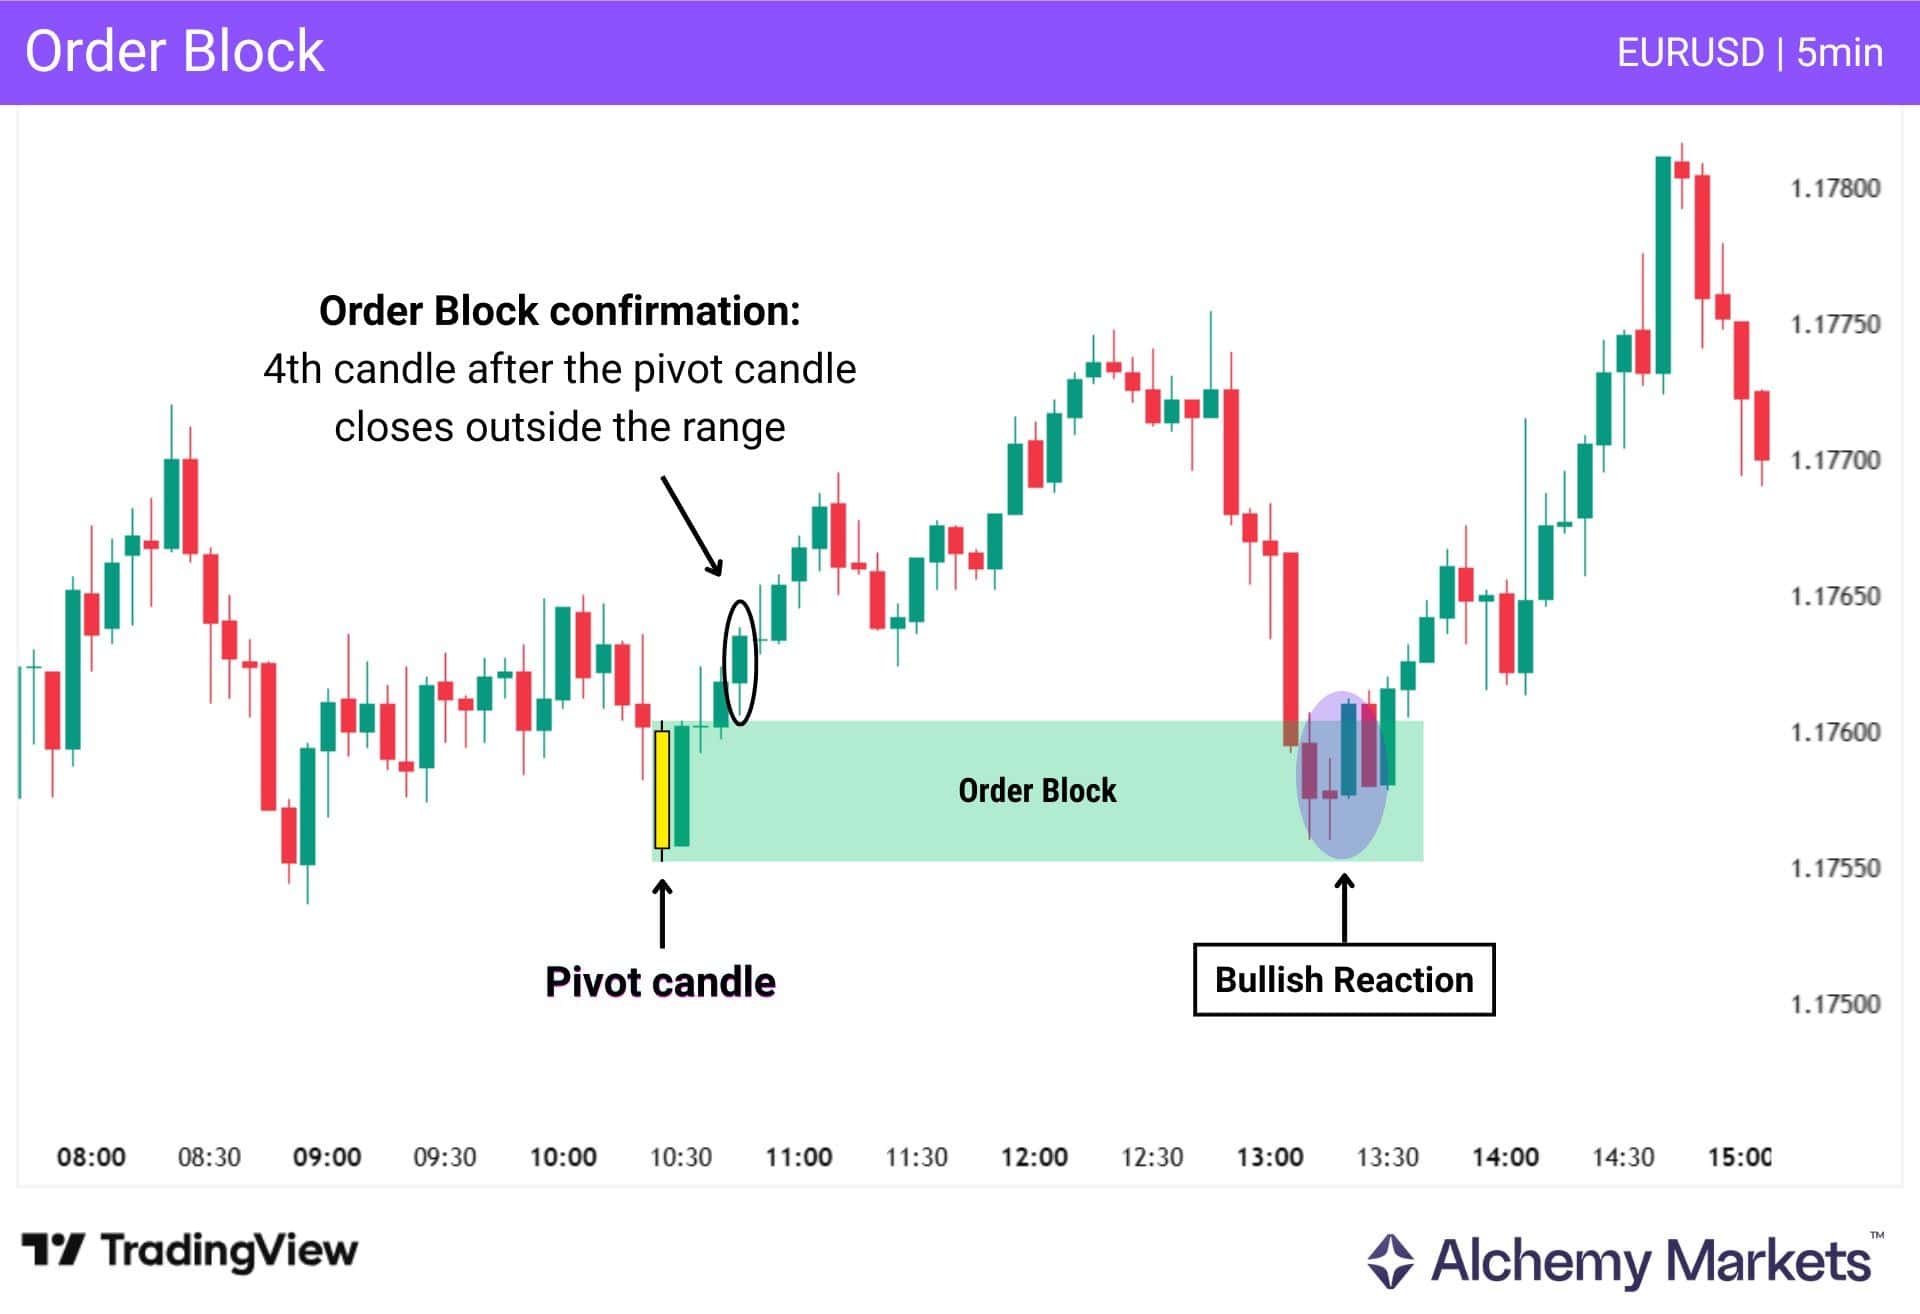
There are many rules SMC traders use to identify an OB as it is forming. We use a 4-candlestick follow-through rule to help confirm whether the zone is valid.
| 4-Candlestick Follow-Through Rule The 4th candle after the pivot must close outside the pivot candle’s range; above for a bullish order block, below for a bearish order block. |
When price returns to an OB, it’ll tell you whether that area is still being defended. A strong reaction suggests continuation, while a weak reaction or break indicates that the area is no longer respected.
Fair Value Gaps (FVGs)
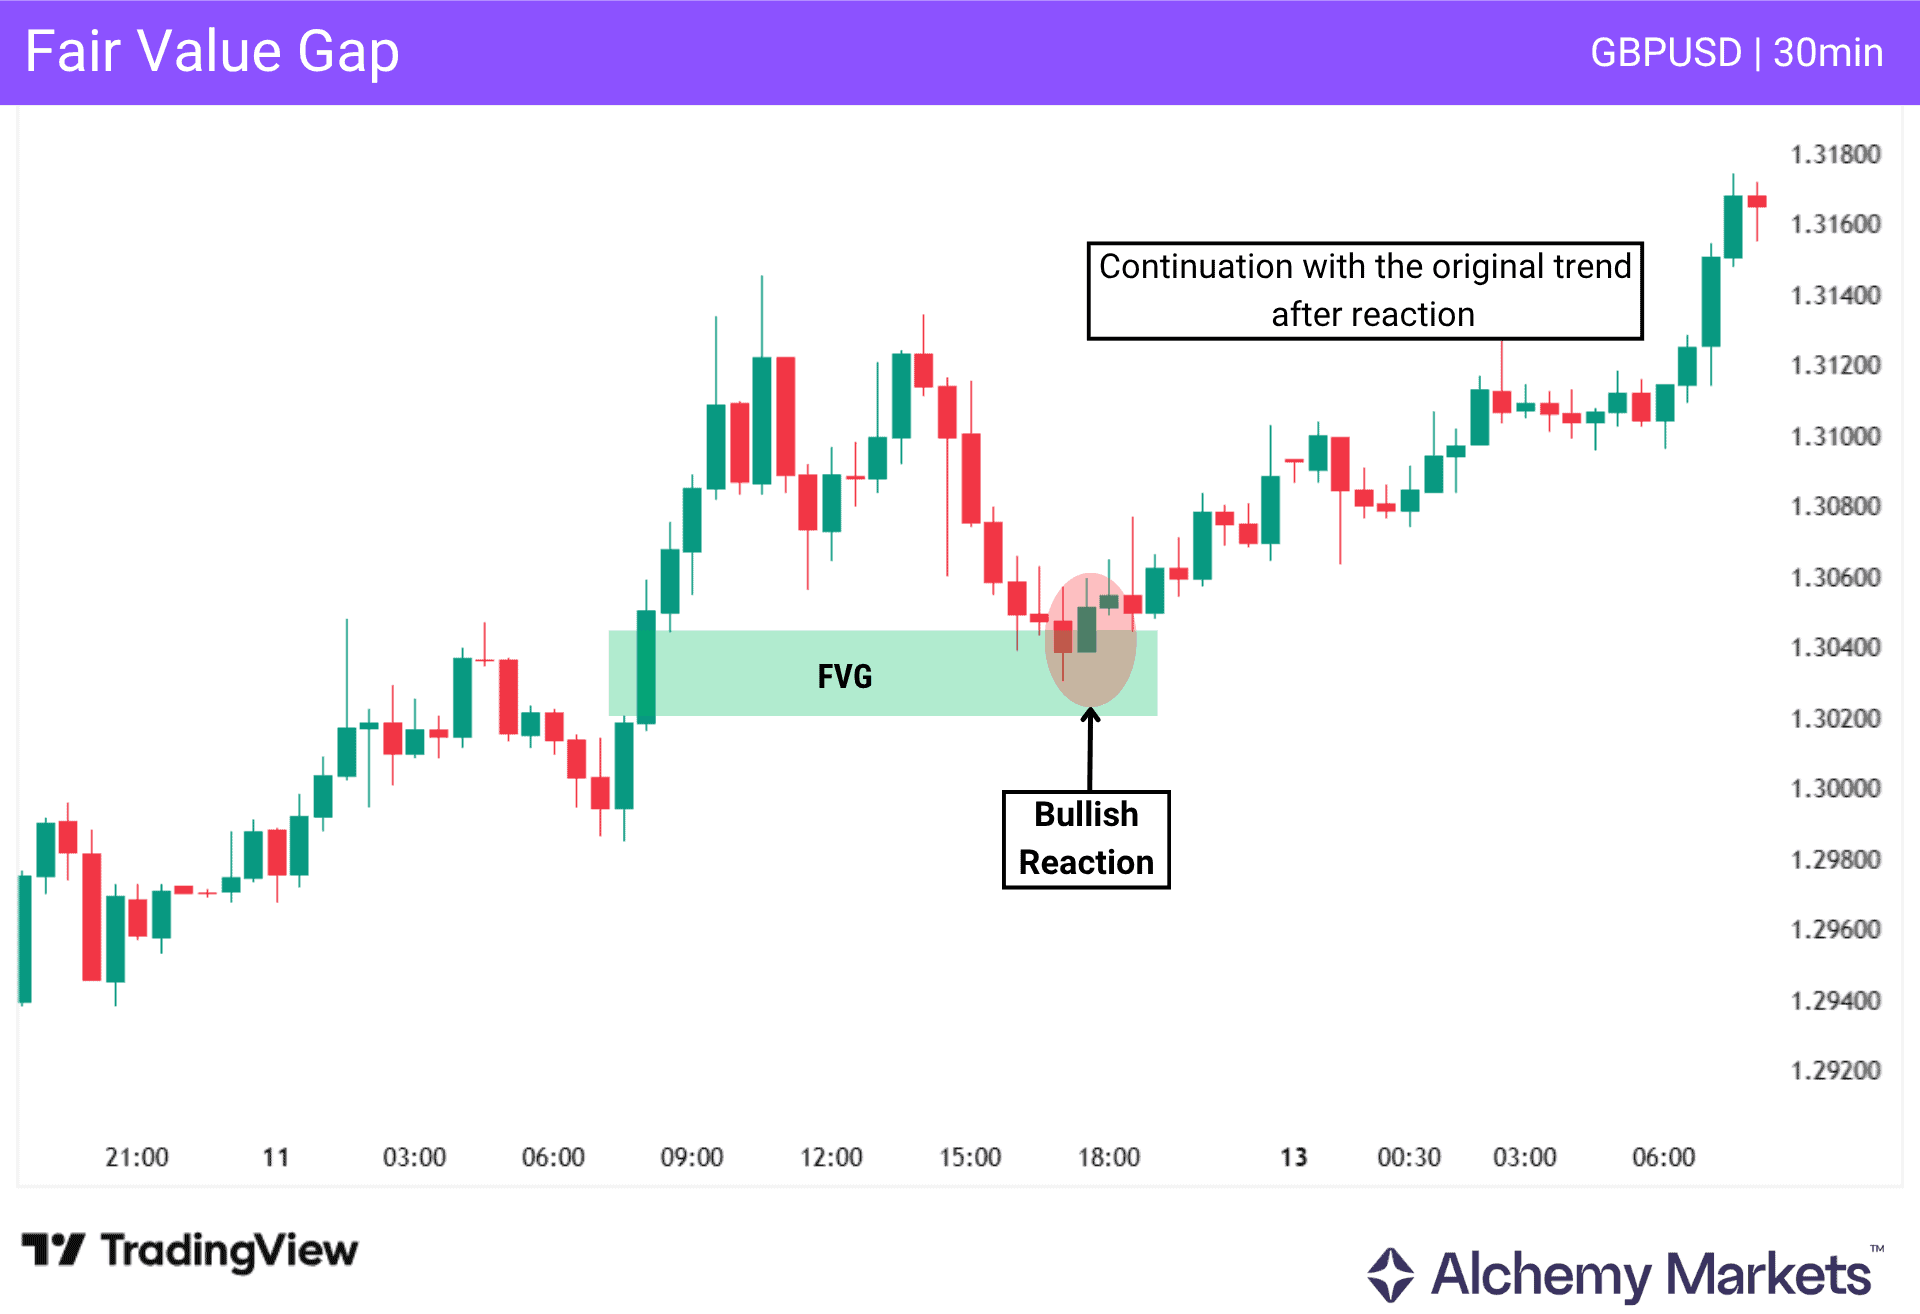
A fair value gap is a three-candlestick pattern that forms when price moves aggressively, leaving an imbalance between candles. The imbalance appears when the first and third candles do not overlap, creating an empty price area between them. It tells you that price moved too quickly and may return to rebalance before continuing.
Inverse Fair Value Gaps
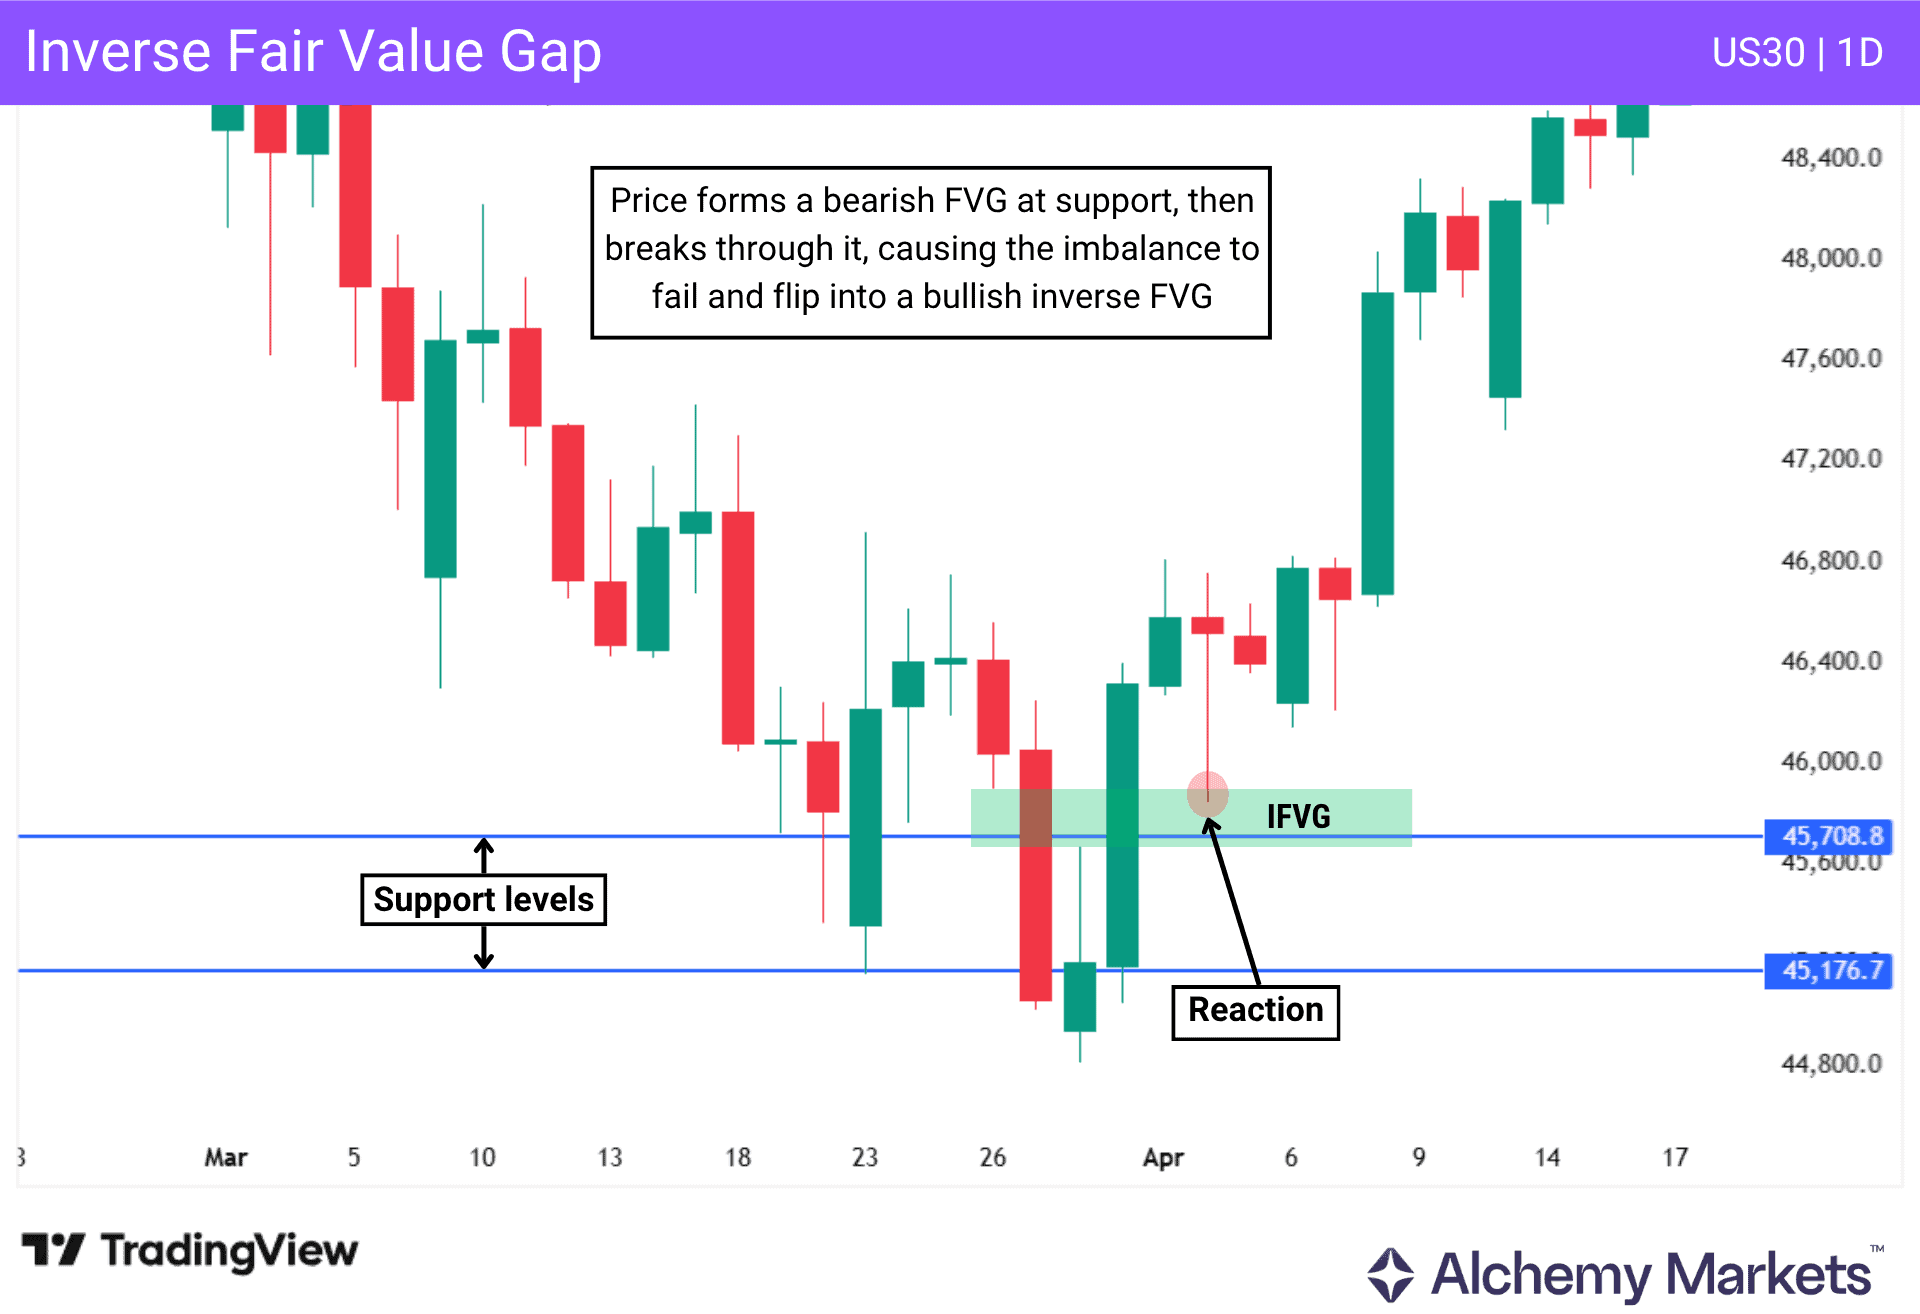
An inverse FVG forms when a previous FVG fails and price breaks through it. This effectively flips its role as a support into resistance, or vice versa. It tells you that the previous imbalance is no longer respected and that control may have shifted. This often reflects a change in behaviour, not just a simple retracement.
Breaker Blocks
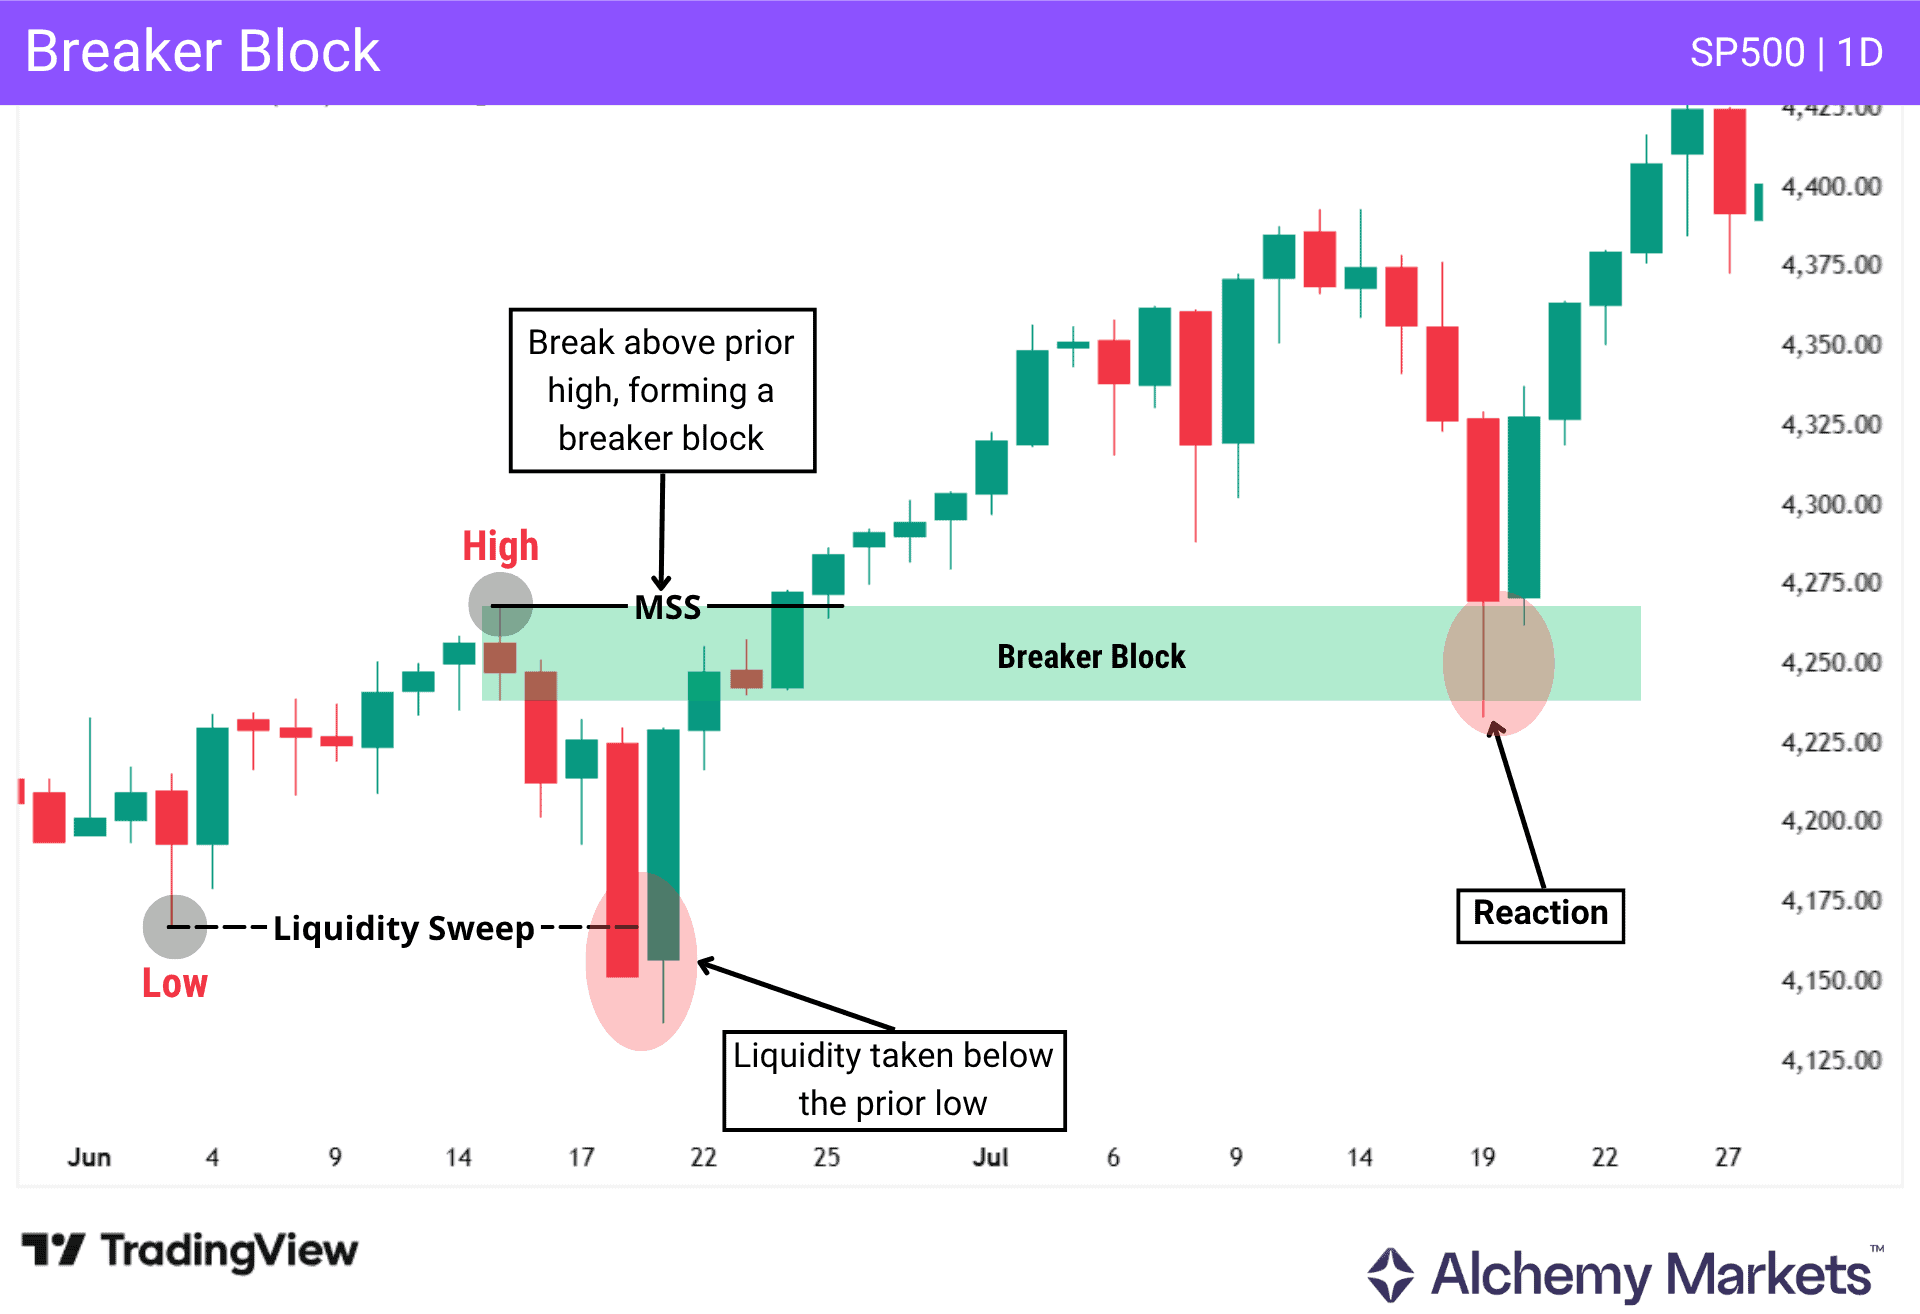
A breaker block forms after price first takes liquidity above a prior high or below a prior low. This can happen through a liquidity sweep or liquidity grab, which helps validate the setup because it shows that stops or resting orders have been triggered before price reverses.
After the sweep, the breaker block is confirmed when price breaks structure in the opposite direction through a market structure shift (MSS) or change of character (CHoCH).
Once price returns to the breaker block, traders watch for a reaction. If the area holds, it suggests price may continue in the new direction. This pattern can be used for both continuation and reversal setups.
Mitigation Blocks
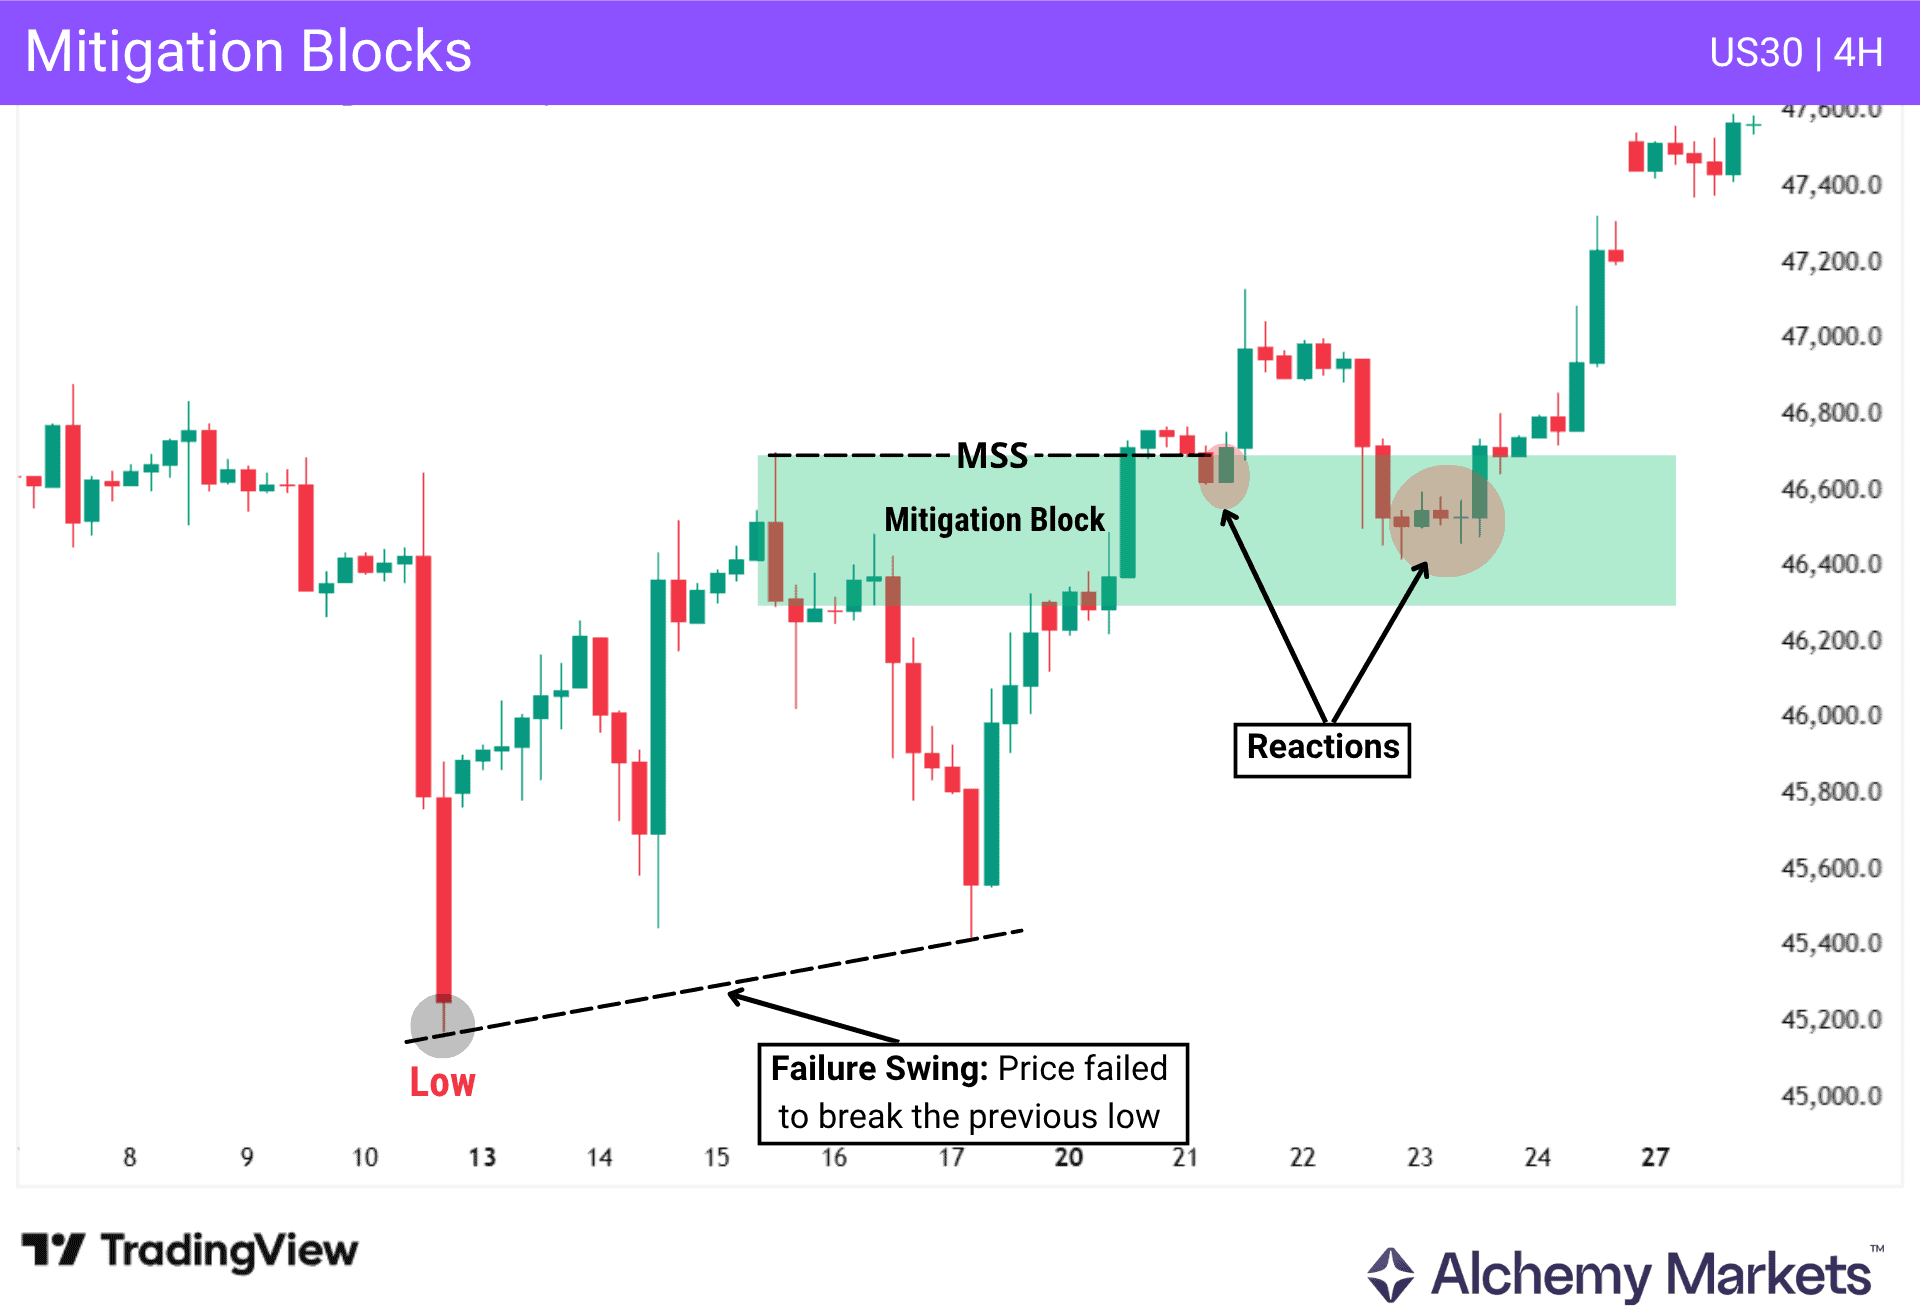
A mitigation block forms after a failure swing, followed by a market structure shift in the opposite direction. A failure swing means price fails to break a previous high or low in the direction of the existing move, showing weakness in the original direction. After the MSS, it can signal a reversal, especially if it appears at a key level or area.
In a bullish setup, price fails to break a previous low, then shifts higher. In a bearish setup, price fails to break a previous high, then shifts lower.
The key difference with a breaker block is that a breaker forms after a liquidity sweep or grab, while a mitigation block forms after a failure swing.
Liquidity Voids
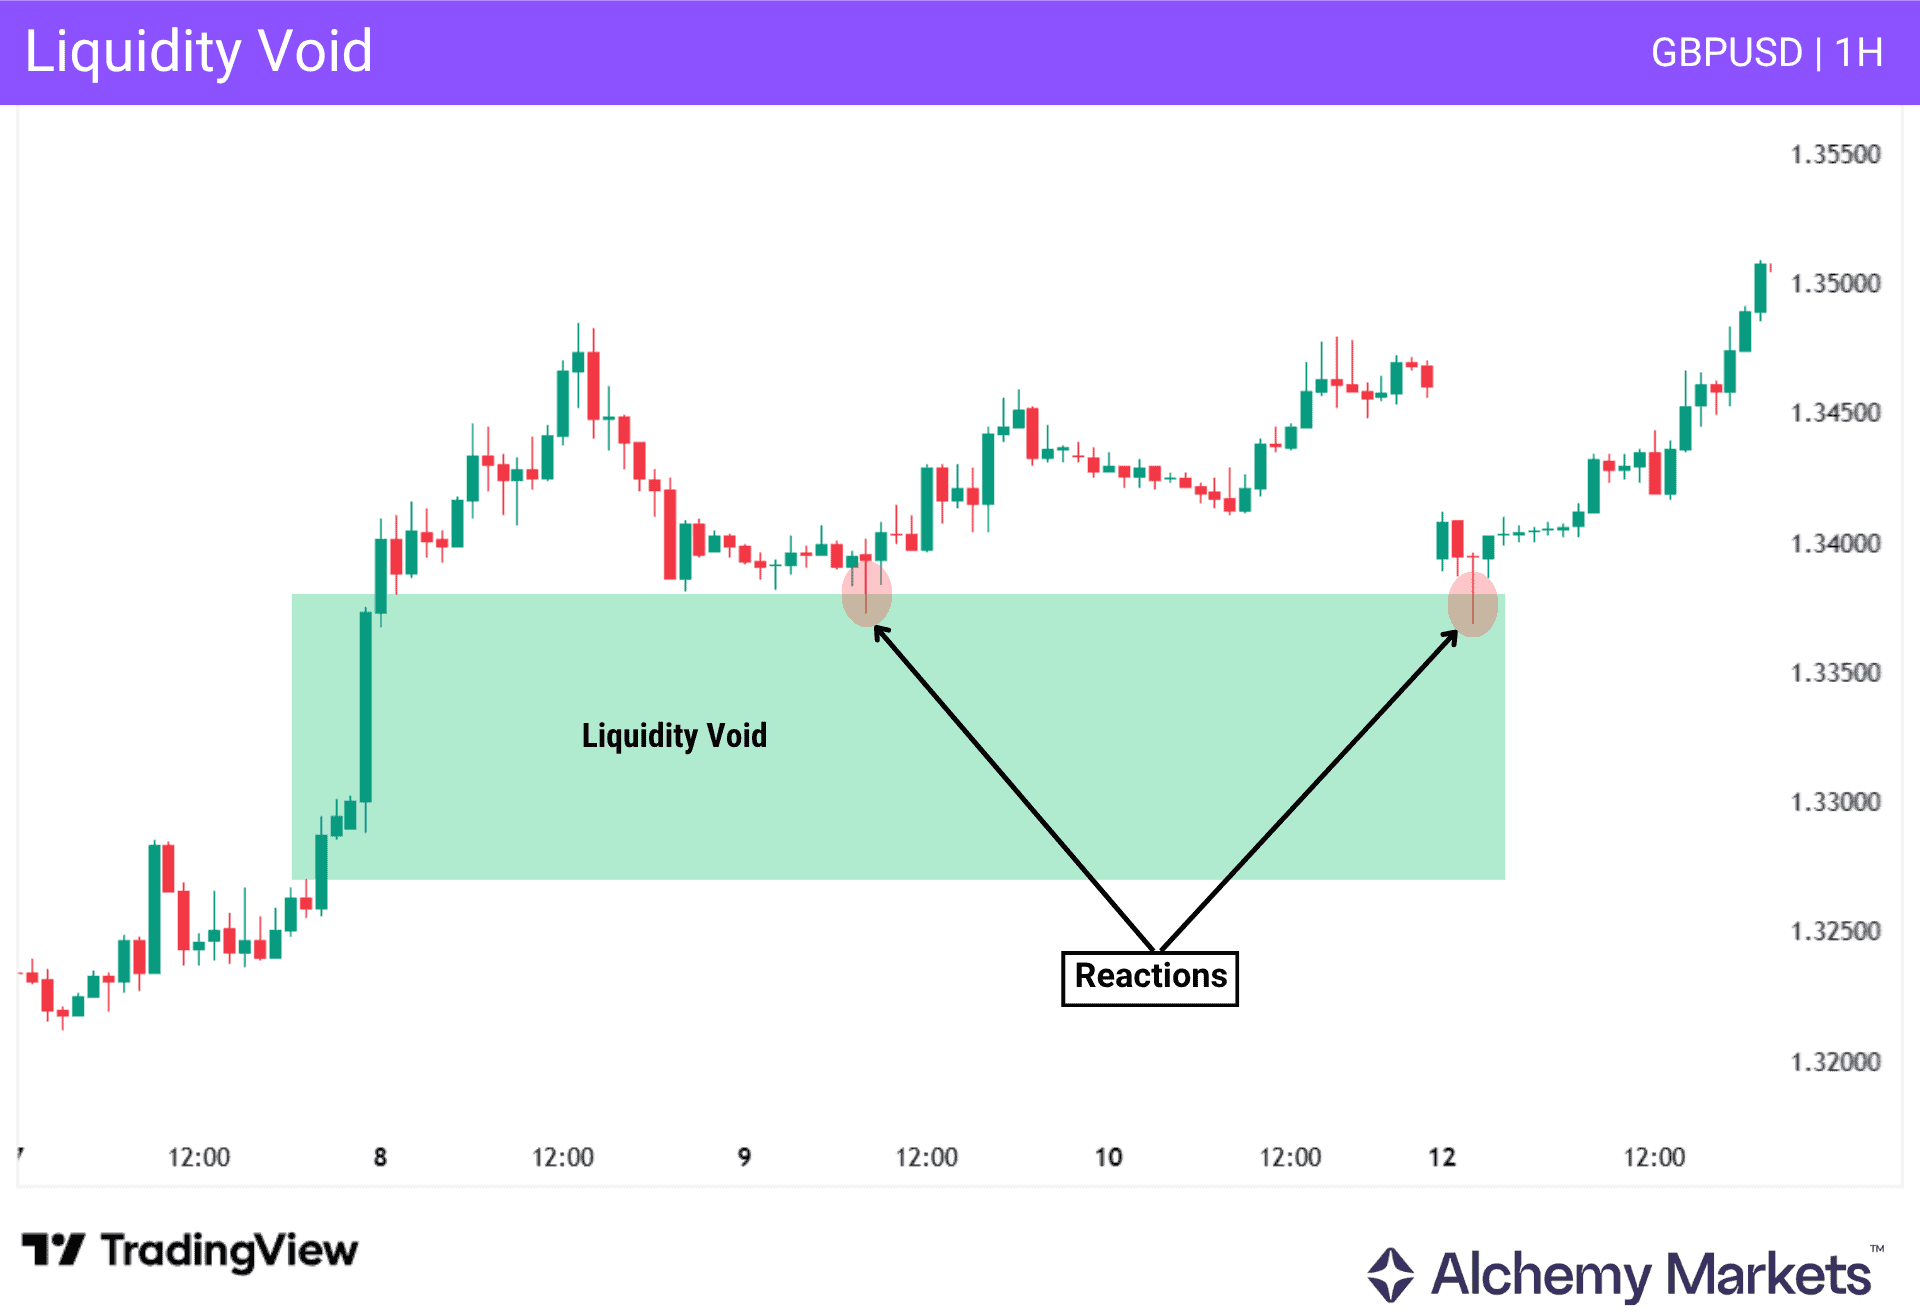
A liquidity void forms when price moves strongly in one direction with little to no pullback. It tells you that the move was inefficient, and price may return to rebalance before continuing. In strong trends, price may also move through it with little resistance.
Rejection Blocks
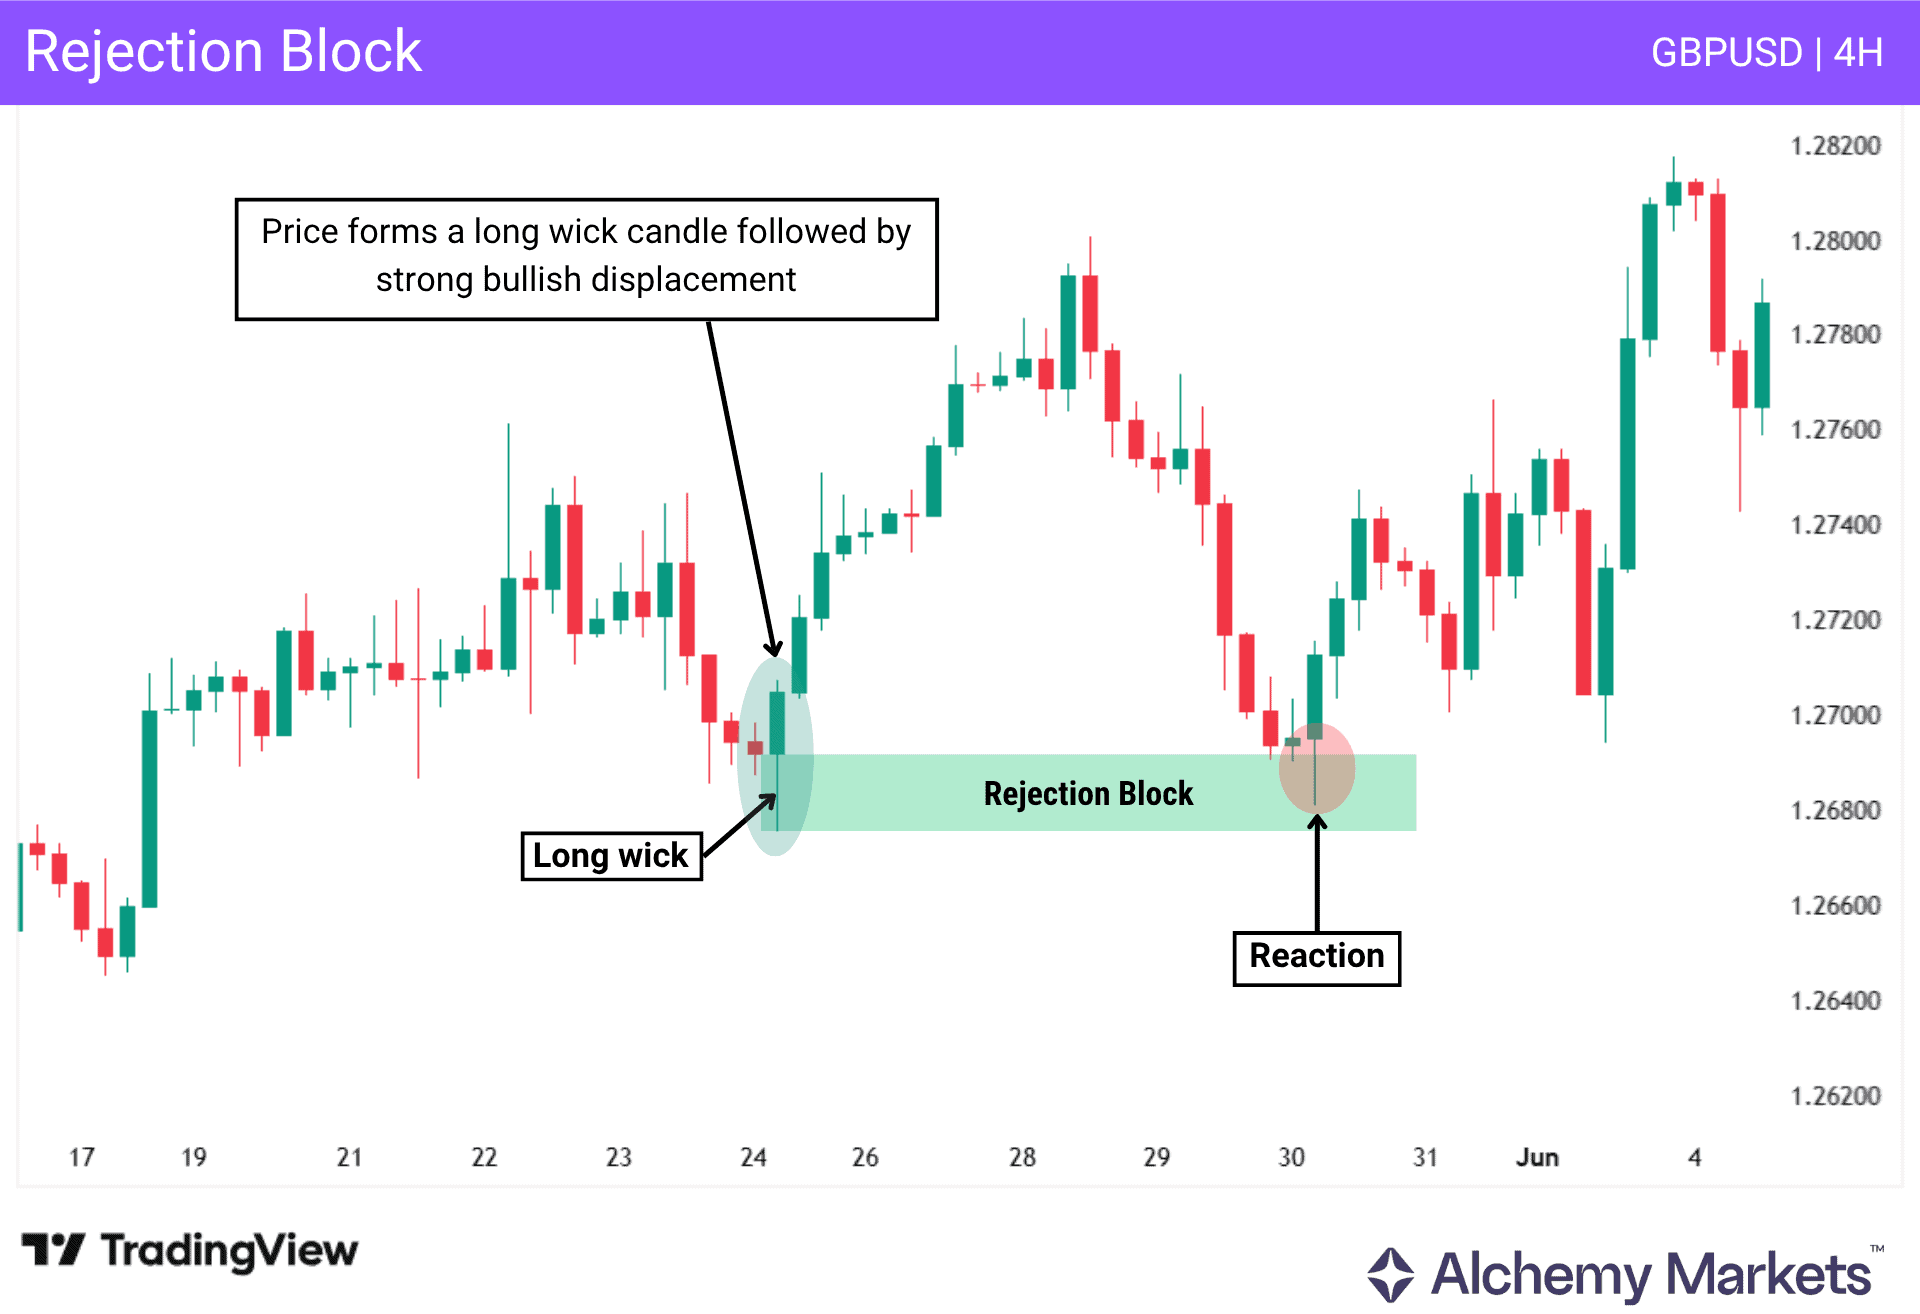
A rejection block forms when price is sharply rejected, typically shown by a long wick followed by strong movement in the opposite direction. It tells you that there was imcmediate opposing pressure at that area, and price may react again if it returns.
Old Lows or Highs
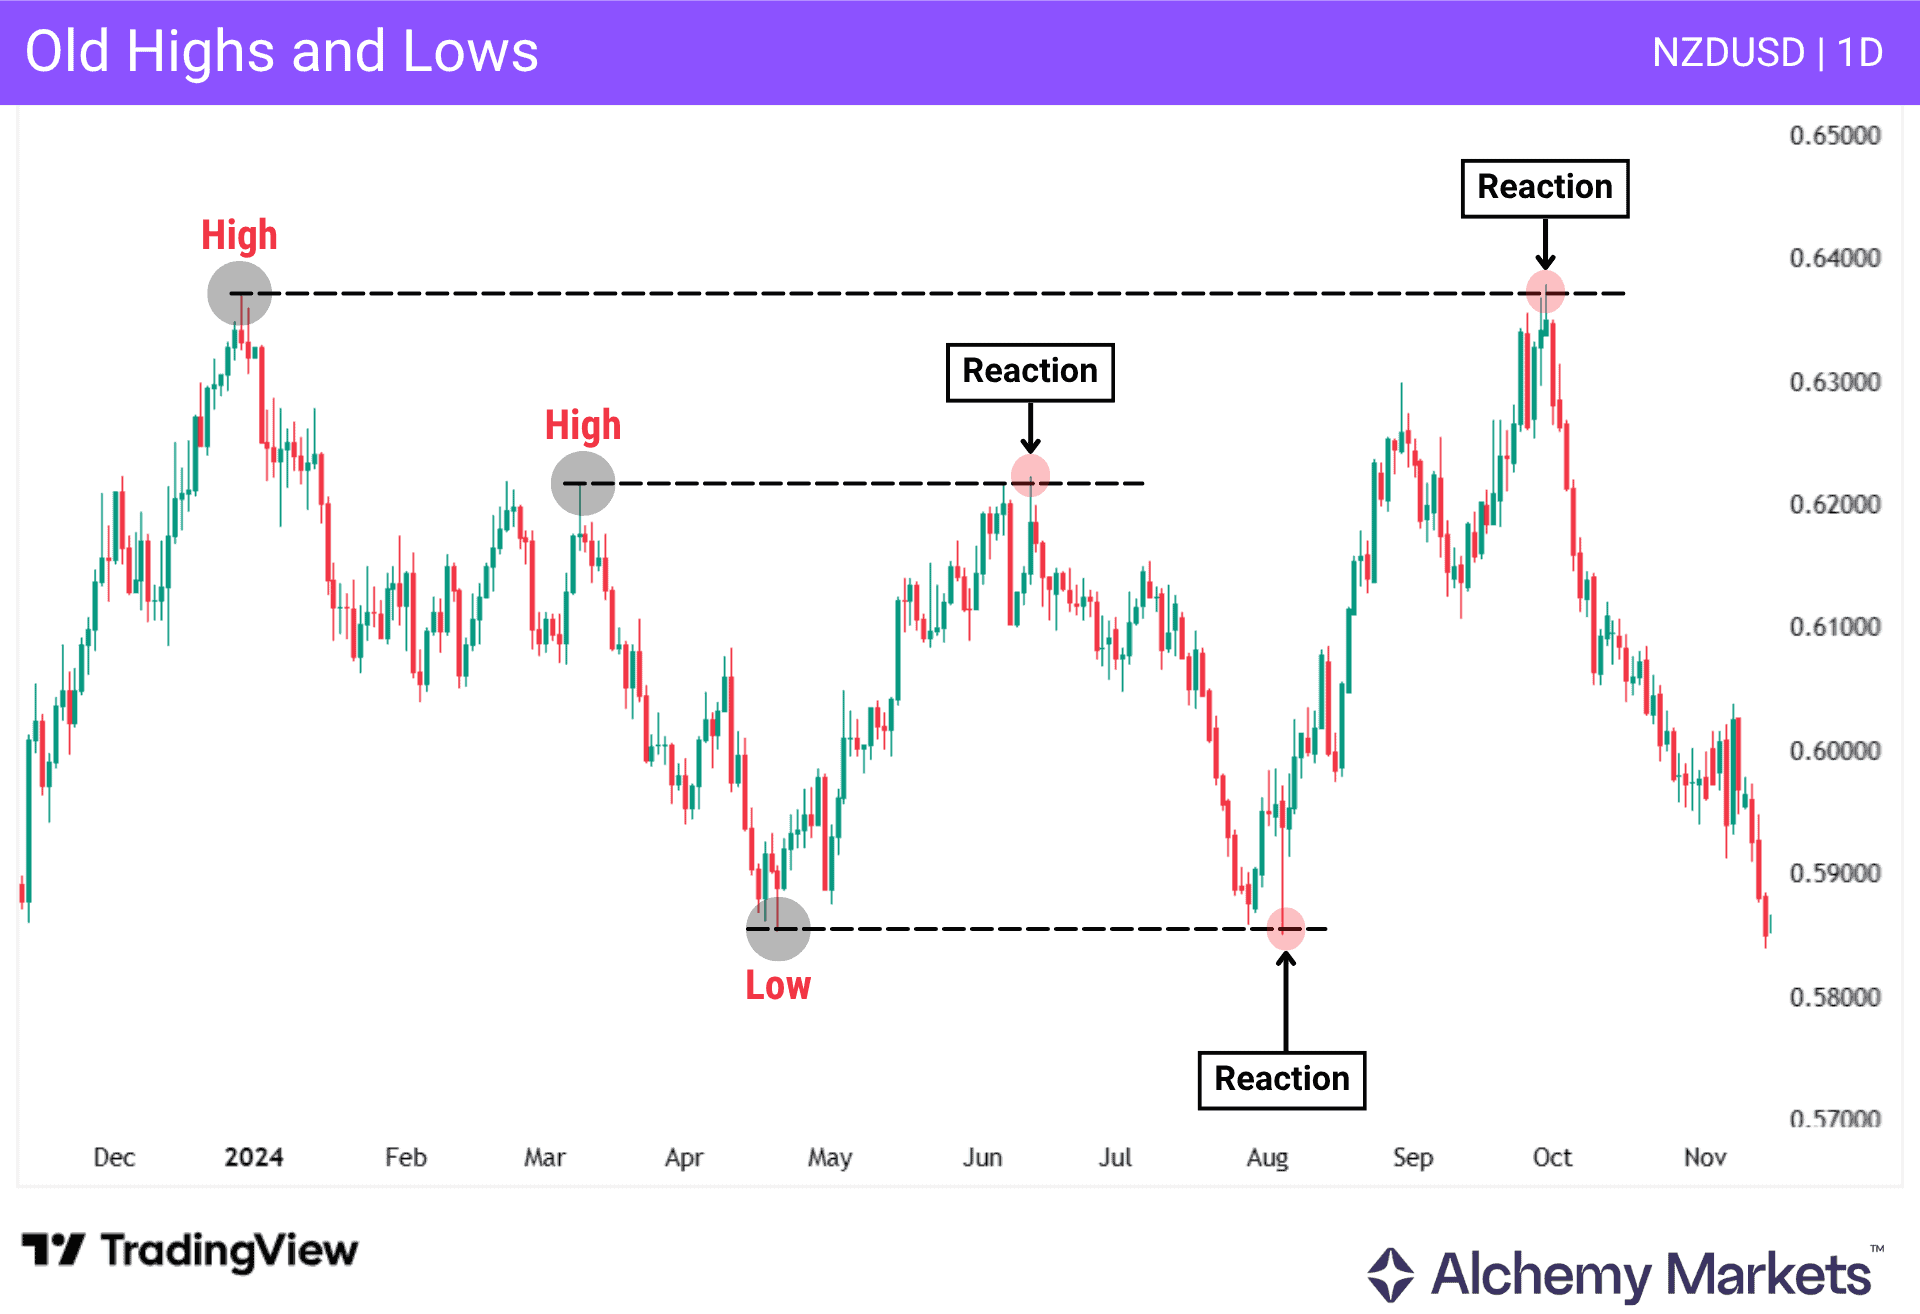
Old highs and lows are previous swing points where price has reacted before. It tells you where liquidity such as pending buy/sell orders, stop losses, liquidation points are likely resting. Price may react, reverse, or break through these areas to continue the move.
Unicorn Model Unique Analytical Patterns
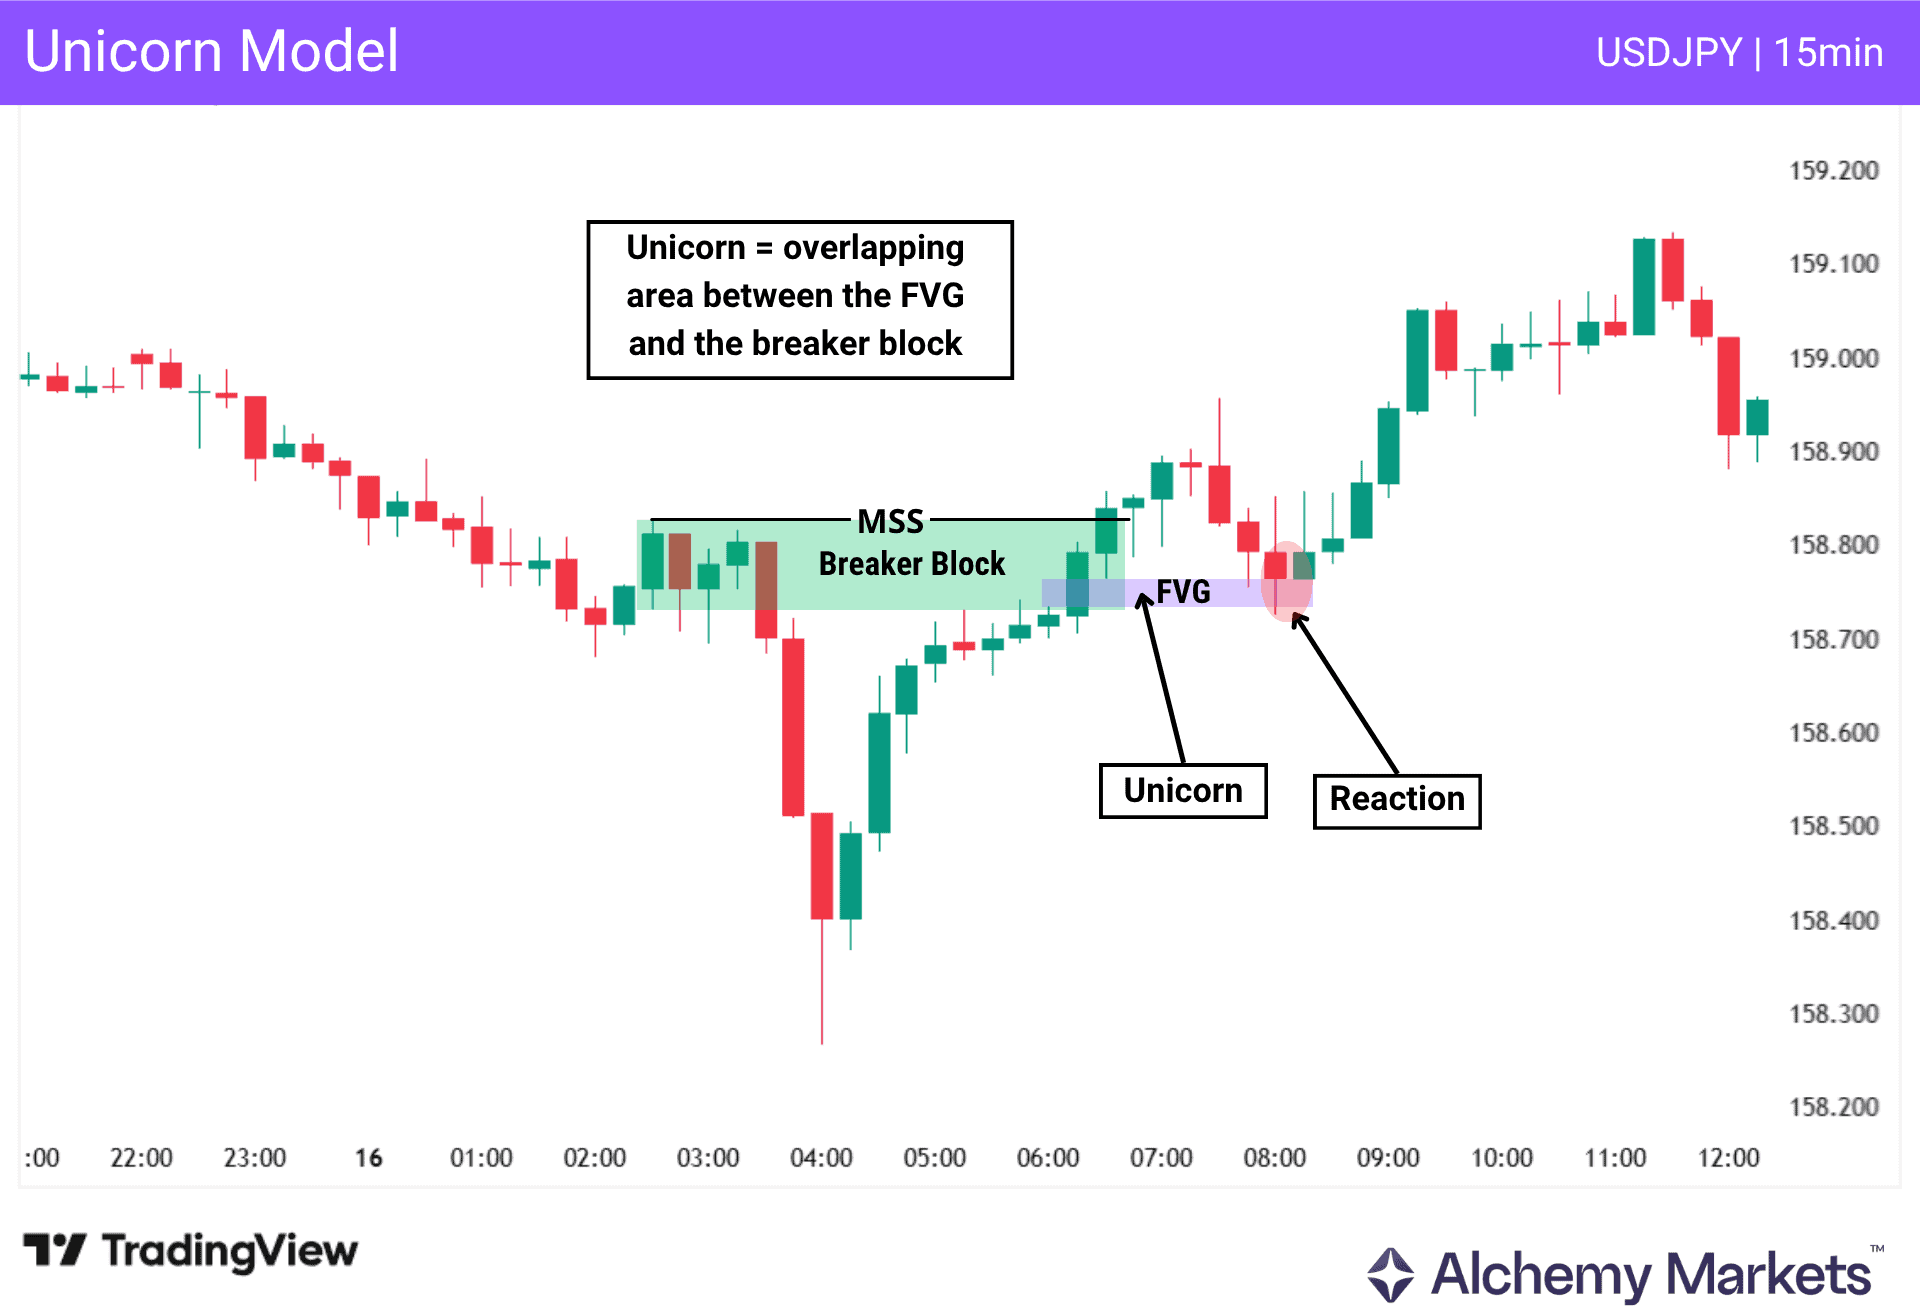
The Unicorn model is essentially a combination of a breaker block and a fair value gap. It is defined by the overlapping area between them, forming a precise zone where price is likely to react.
It tells you that price has shifted direction and may continue after a retest of this area.
The model becomes stronger when it forms at key PD arrays, usually marked on higher timeframes such as the daily or weekly timeframe. In this context, it can signal a potential reversal from that area and act as a high-quality entry zone.
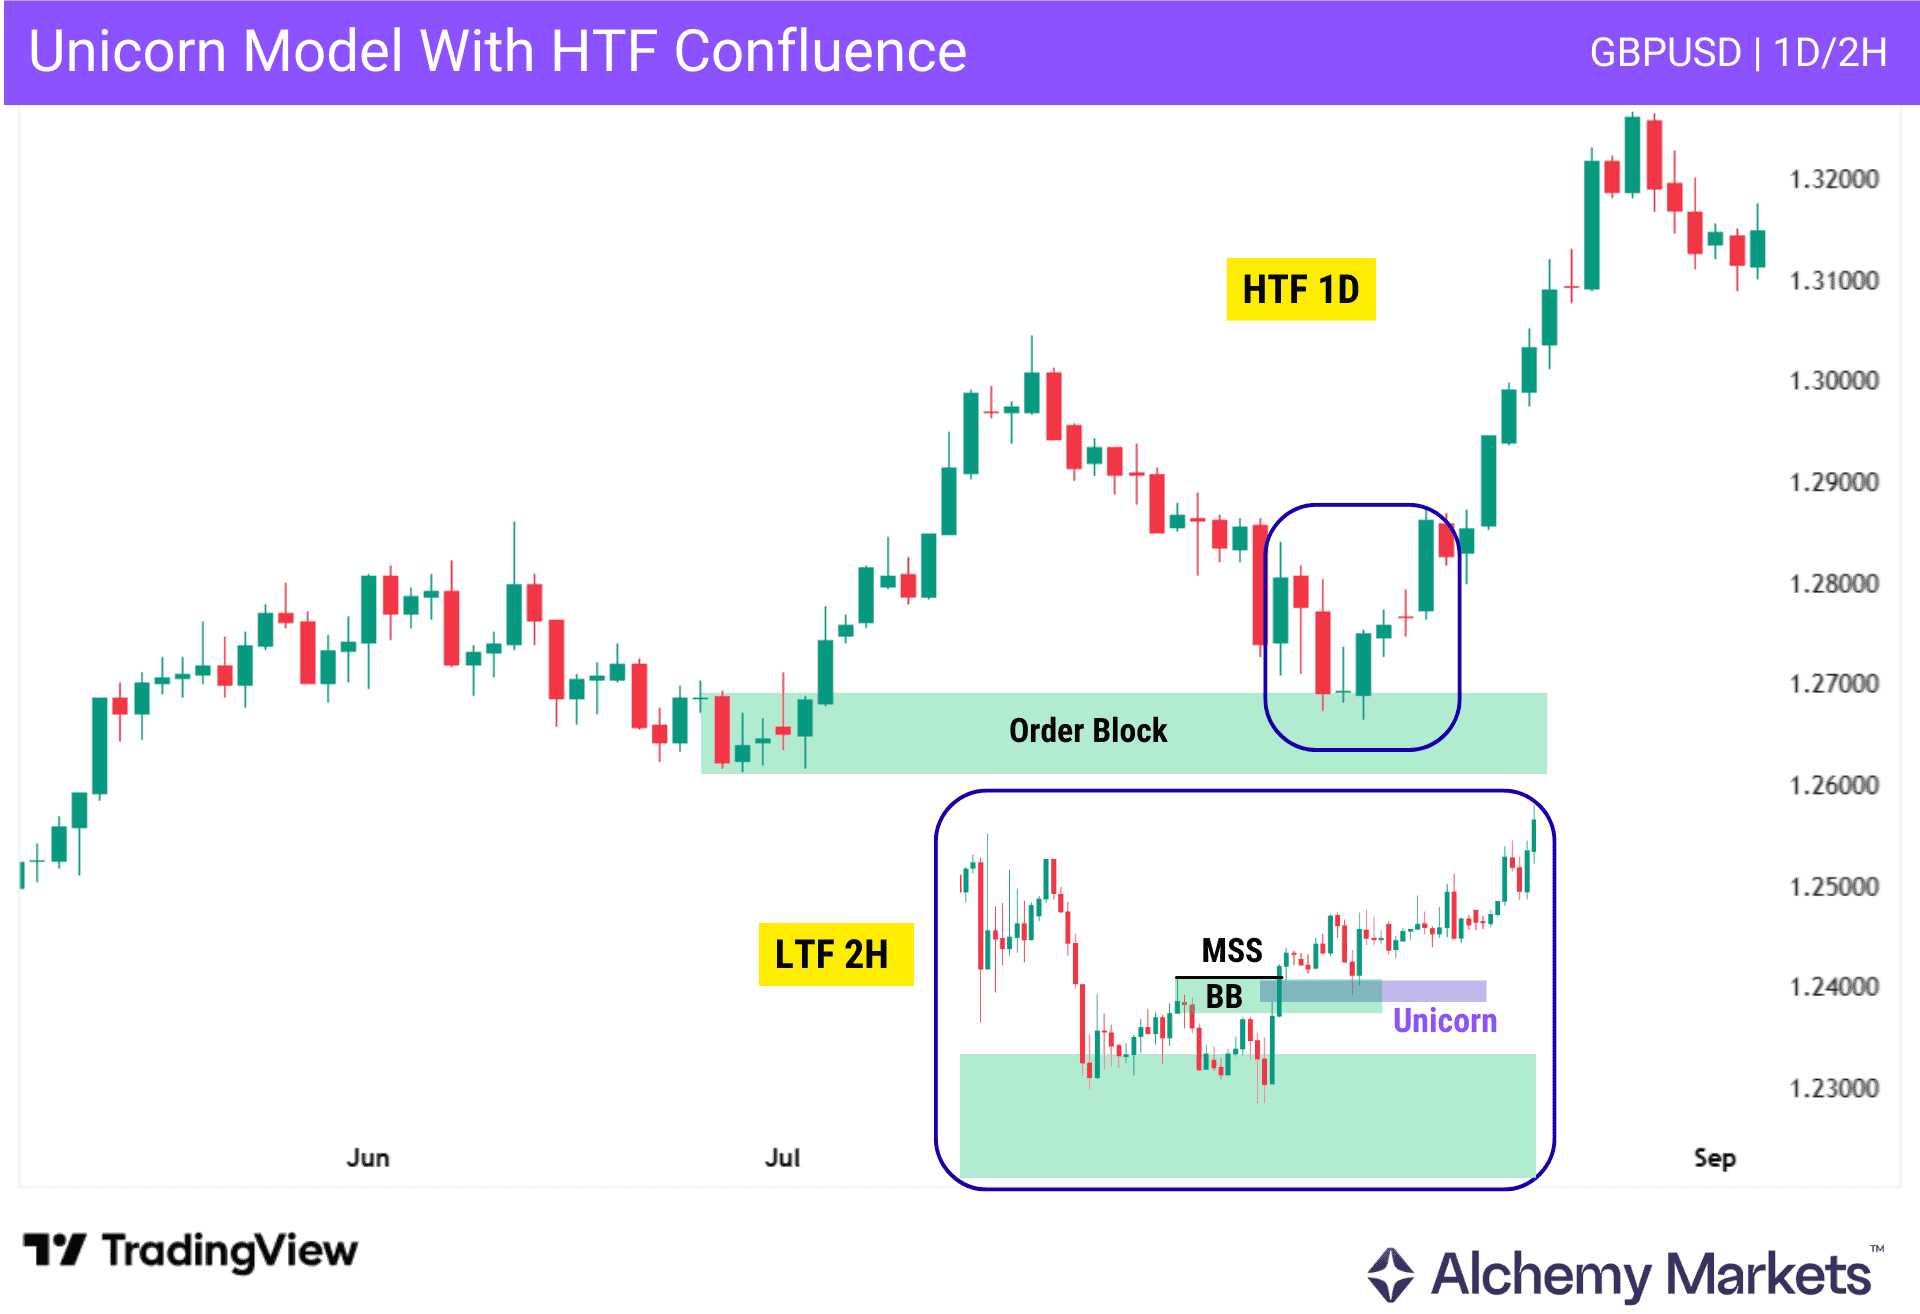
As you see on this example, price reaches a HTF order block on the daily timeframe, and when we zoom into the LTF (2H), a Unicorn model forms just after testing that zone. This makes it more effective, confirms the bullish setup, and provides a precise entry for going long.
NWOG (New Weekly Opening Gap)
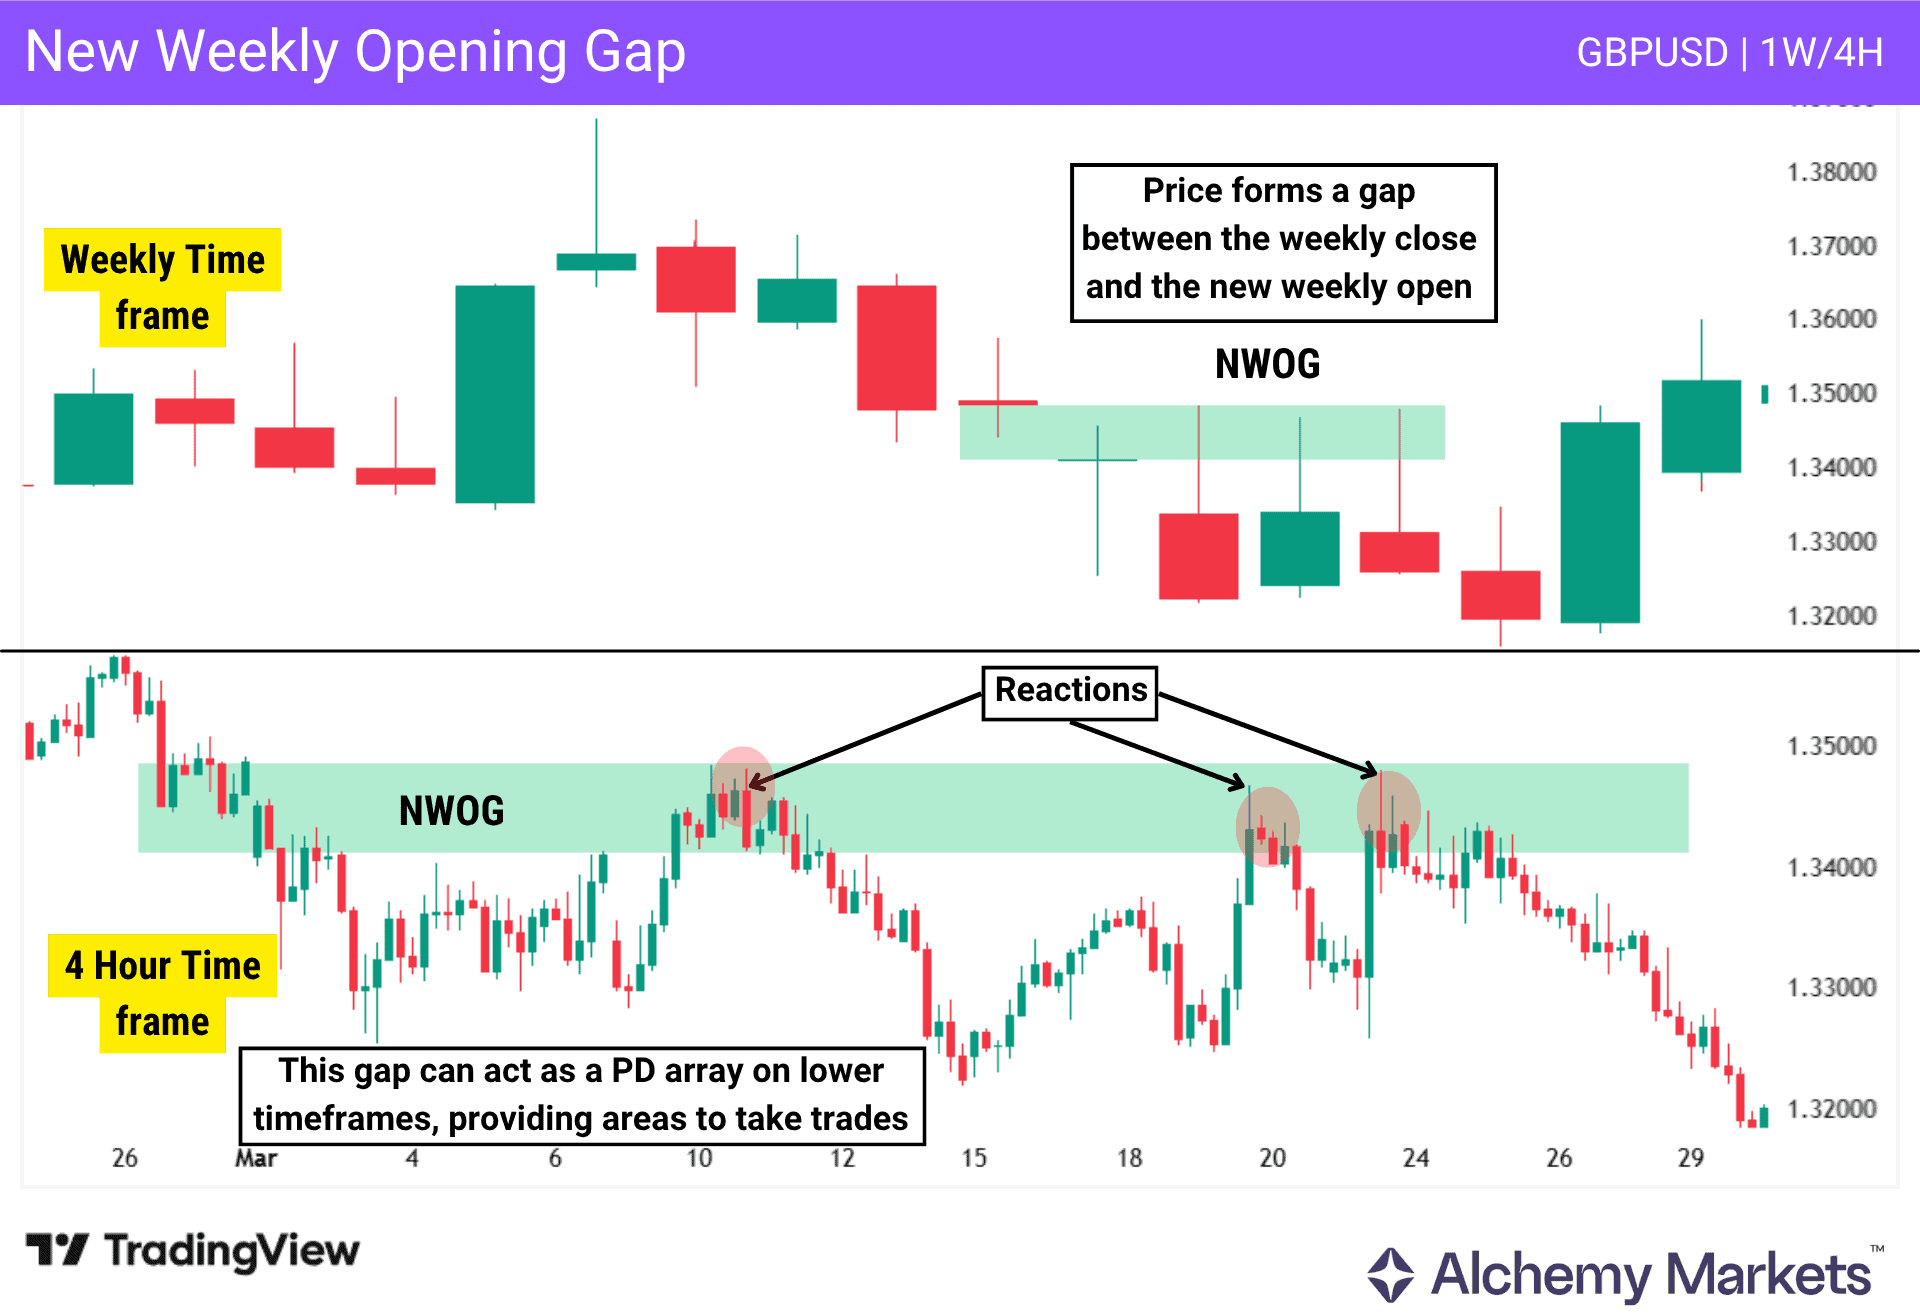
NWOG is the gap formed between the previous week’s close and the new week’s open. This creates an area where price moved without trading, leaving an inefficient zone.
It tells you that price may later return to this gap to rebalance, often reacting from it or filling it partially or fully.
When viewed on lower timeframes, this gap can act as a PD array, providing a clear area where price may react and offer trading opportunities.
NDOG (New Daily Opening Gap)
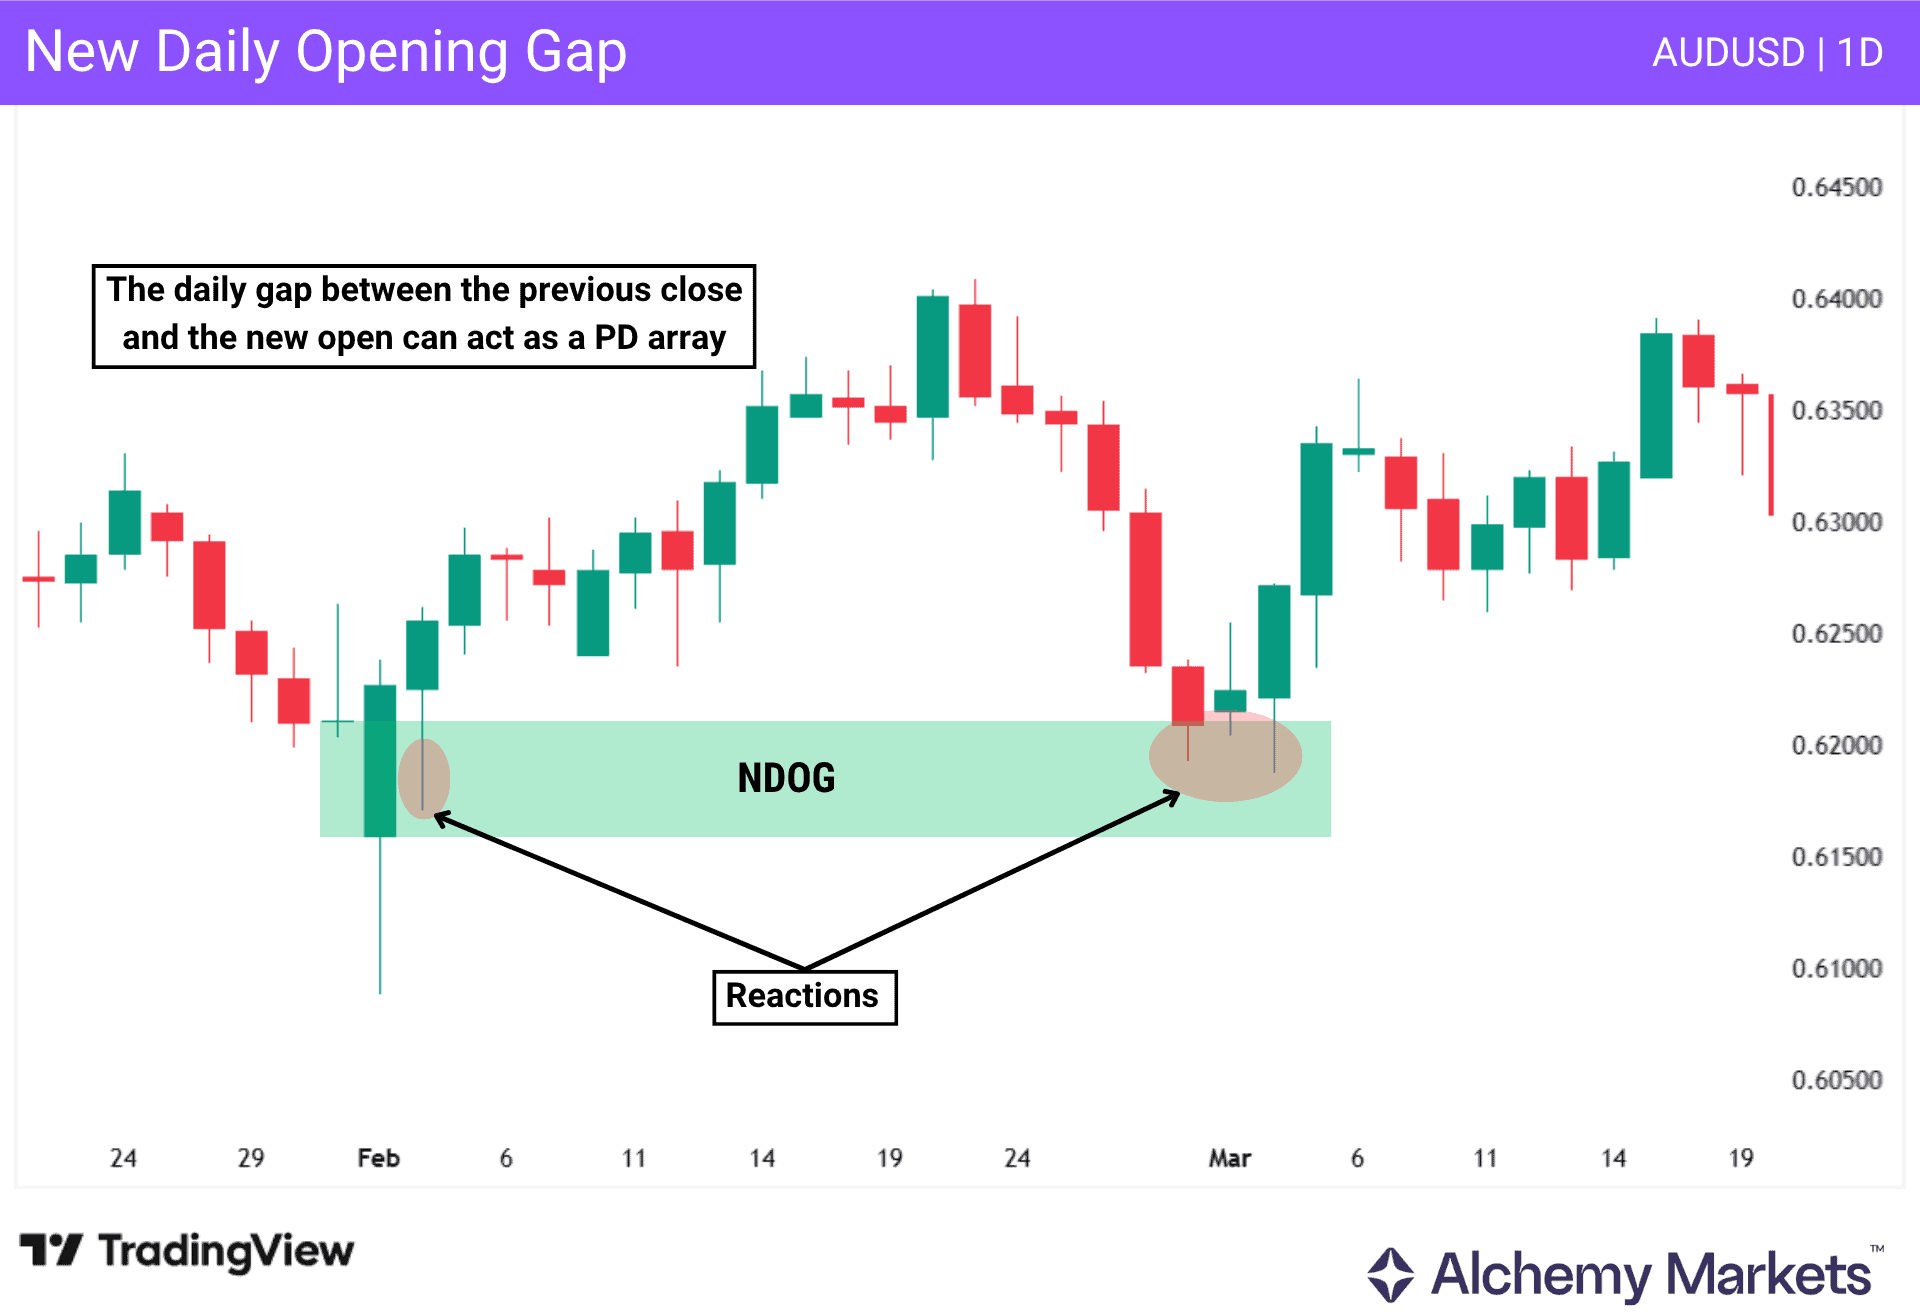
NDOG is the gap formed between the previous day’s close and the new day’s open. It is created during the one-hour pause in trading, where no transactions occur, causing price to reopen at a different level.
It tells you that price may later return to this area to rebalance, often reacting from it or partially filling it.
Compared to NWOG, NDOG is generally less effective, as these gaps are smaller and more frequent, which can lead to weaker or less consistent reactions.
When used in context, it can still act as a PD array, providing a reference area where price may react.
When Are PD Arrays More Effective
PD arrays become more reliable when they are aligned with the overall market context and supported by clear price behaviour.
They are more effective when:
| i. Aligned with the broader trend structure ii. Formed after strong displacement or momentum iii. Located in premium or discount areas iv. Formed at important price zones (support, resistance, or supply and demand) v. Untested prior to the retest vi. Combined with another PD array (confluence) vii. Supported by a clear market structure shift (MSS) or liquidity sweep viii. Showing a strong or immediate reaction on return, or an increase in volume |
Importance of PD Array Pattern
The PD array pattern is important because it highlights where price is more likely to react, helping traders focus on key areas instead of random price movements.
It improves decision-making by:
| i. Identifying areas where price may react or reverse ii. Confirming entries and improving precision, supporting better risk-to-reward by entering from more favourable locations iii. Providing clear targets, as price often moves from one PD array to another within the range iv. Filtering out low-quality setups by avoiding trades in poor locations |
PD arrays improve consistency by focusing on important price zones and reducing the need to analyse every move. Instead, traders focus on how price behaves at key areas within the broader market structure.
In practice, they help answer three key questions:
- Where is price within the range?
- Is this location favourable?
- Is there confirmation to support the setup?
PD Array Pattern Example
Let’s look at this example to show how PD arrays work, and how they can be used to identify important areas, confirm trade setups, and define targets:
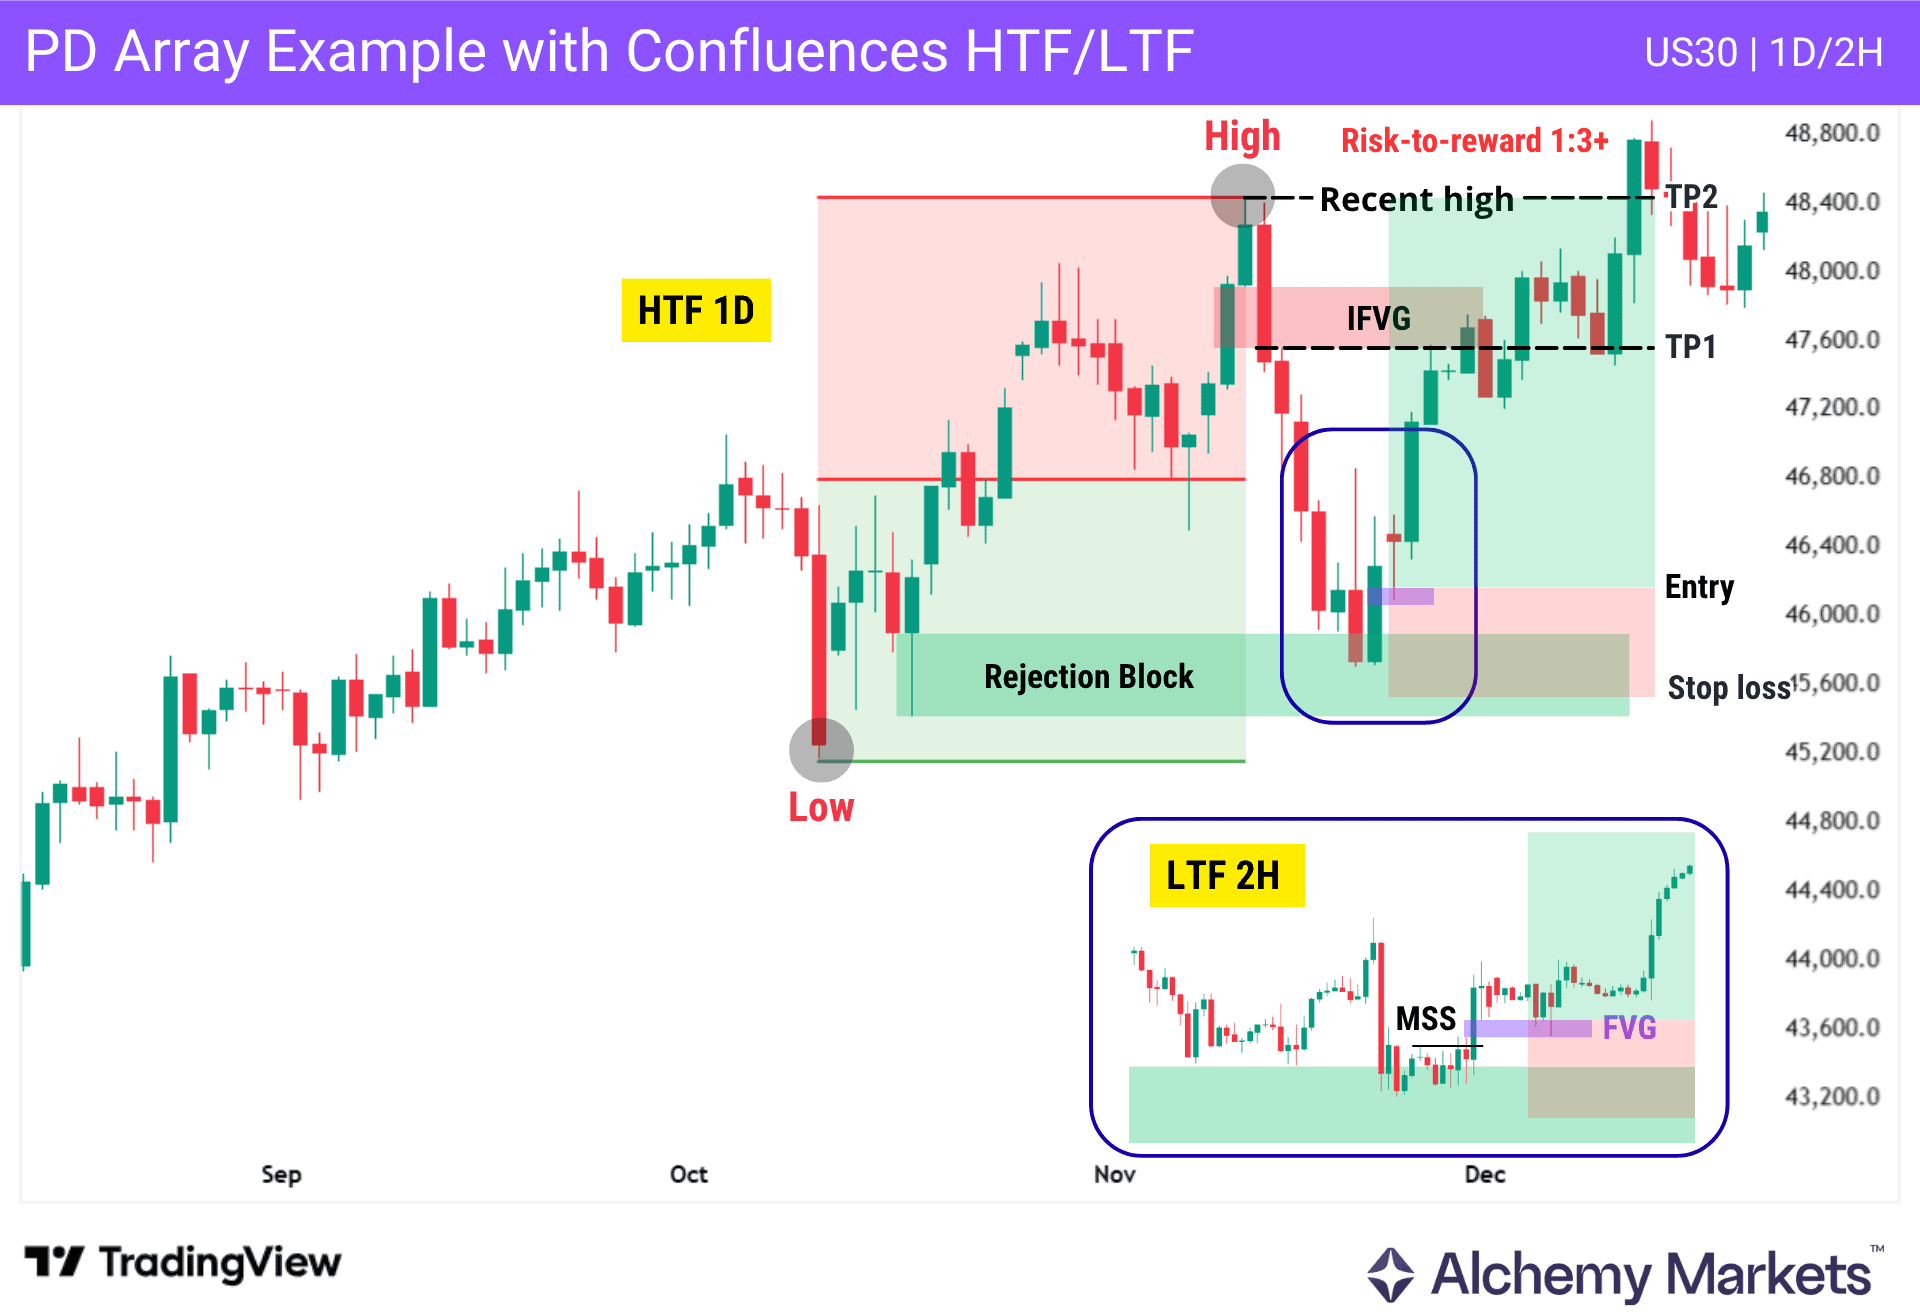
As shown in this example, US30 on the daily timeframe forms a bullish move, defining a range between a low and a high. This allows premium and discount areas to be identified.
Price then retraces into the discount area and reacts from a rejection block.
We then zoom into the lower timeframe (2H) to refine the setup. Price reacts from the rejection block, forms a market structure shift (MSS) to the upside, and leaves a fair value gap (FVG), which provides a more precise entry. The stop loss is placed below the low formed after the reaction to the rejection block.
For targets, higher timeframe PD arrays are used. In this case, an inversion fair value gap (IFVG) acts as TP1, while the previous high serves as the final target (TP2).
This example shows how PD arrays can serve different roles within a setup:
- Identifying reaction areas: rejection block
- Refining entries: FVG
- Defining targets: IFVG (TP1) and the previous high (TP2)
PD Array Pattern Trading Strategies
In this section, we show how PD arrays are applied in real market conditions, under different scenarios and with different confluences, to refine entries, exits, and overall trade quality.
PD Array Pattern with OTE aka Deep Retracement Zone
OTE, or Optimal Trade Entry, is a way to refine PD array setups using Fibonacci retracement levels. Instead of treating the whole premium or discount area equally, traders focus on the deeper part of the retracement, usually around the 62% to 79% zone.
In this context, the 62% level is used as a rounded version of the 61.8% Fibonacci retracement level, making it easier to reference on the chart without changing the core idea.
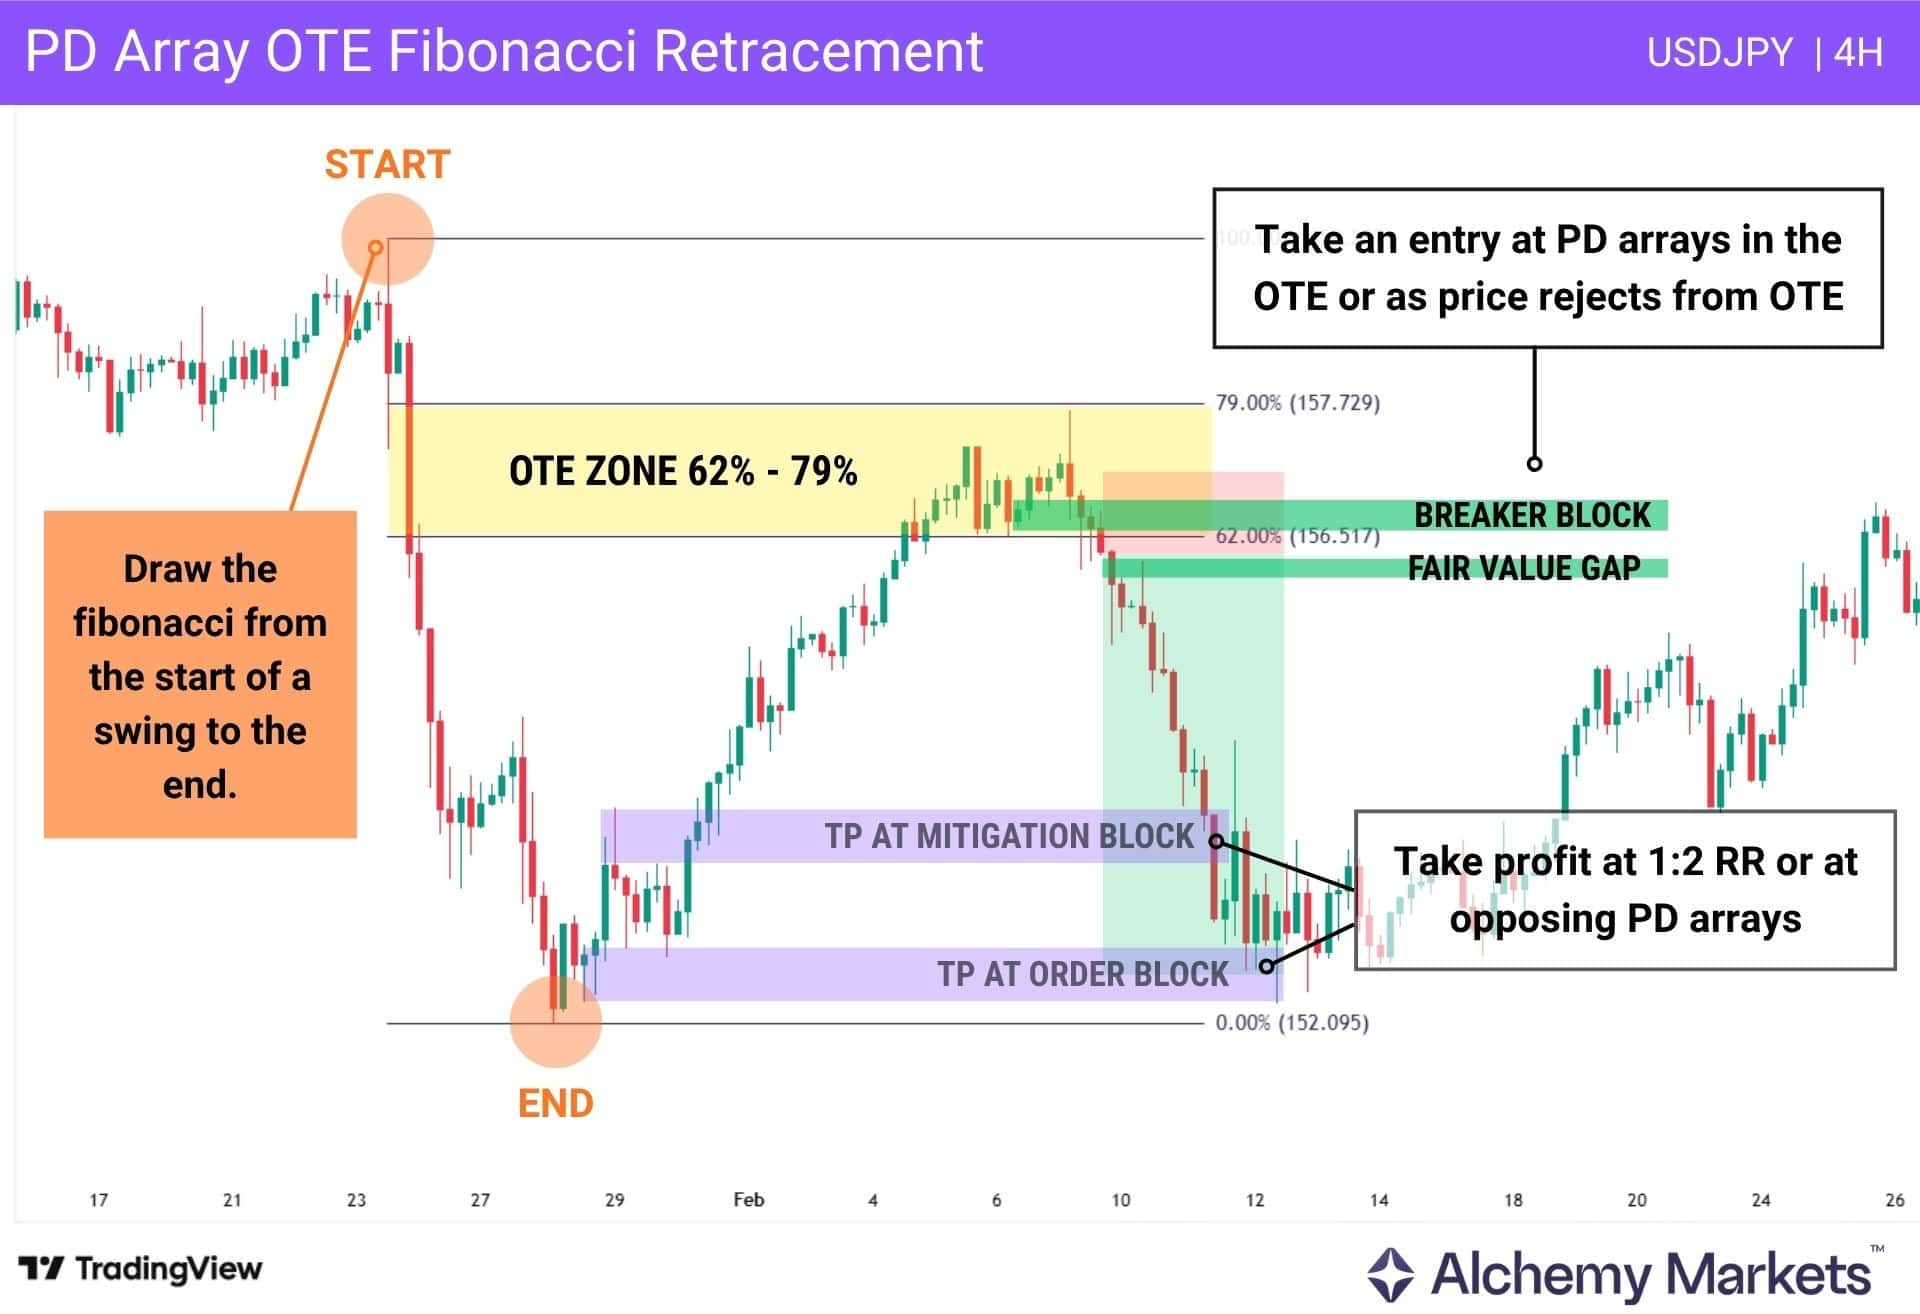
As shown in the chart, the Fibonacci retracement is drawn from the start of the swing to the end of the swing.
Price then retraces back into the OTE zone, where a breaker block forms and provides a trade entry. Then, a Fair Value Gap forms during the displacement away from OTE, giving traders an additional confirmation point.
| The core idea is this: The OTE zone gives traders the favourable retracement area, while the PD arrays provide the more specific reaction zone. Entry can be considered when price trades into the PD array inside the OTE zone, or after price rejects from that area. |
Targets can then be set at opposing PD arrays, nearby liquidity, or based on a fixed risk-to-reward model such as 1:2.
PD Array Pattern with Trend Highs and Lows
In a trending market, price forms a series of higher highs and higher lows (bullish) or lower highs and lower lows (bearish), defining the overall market trend.
Rather than entering at extremes, traders wait for pullbacks into premium or discount areas, where PD arrays form at more favourable prices.
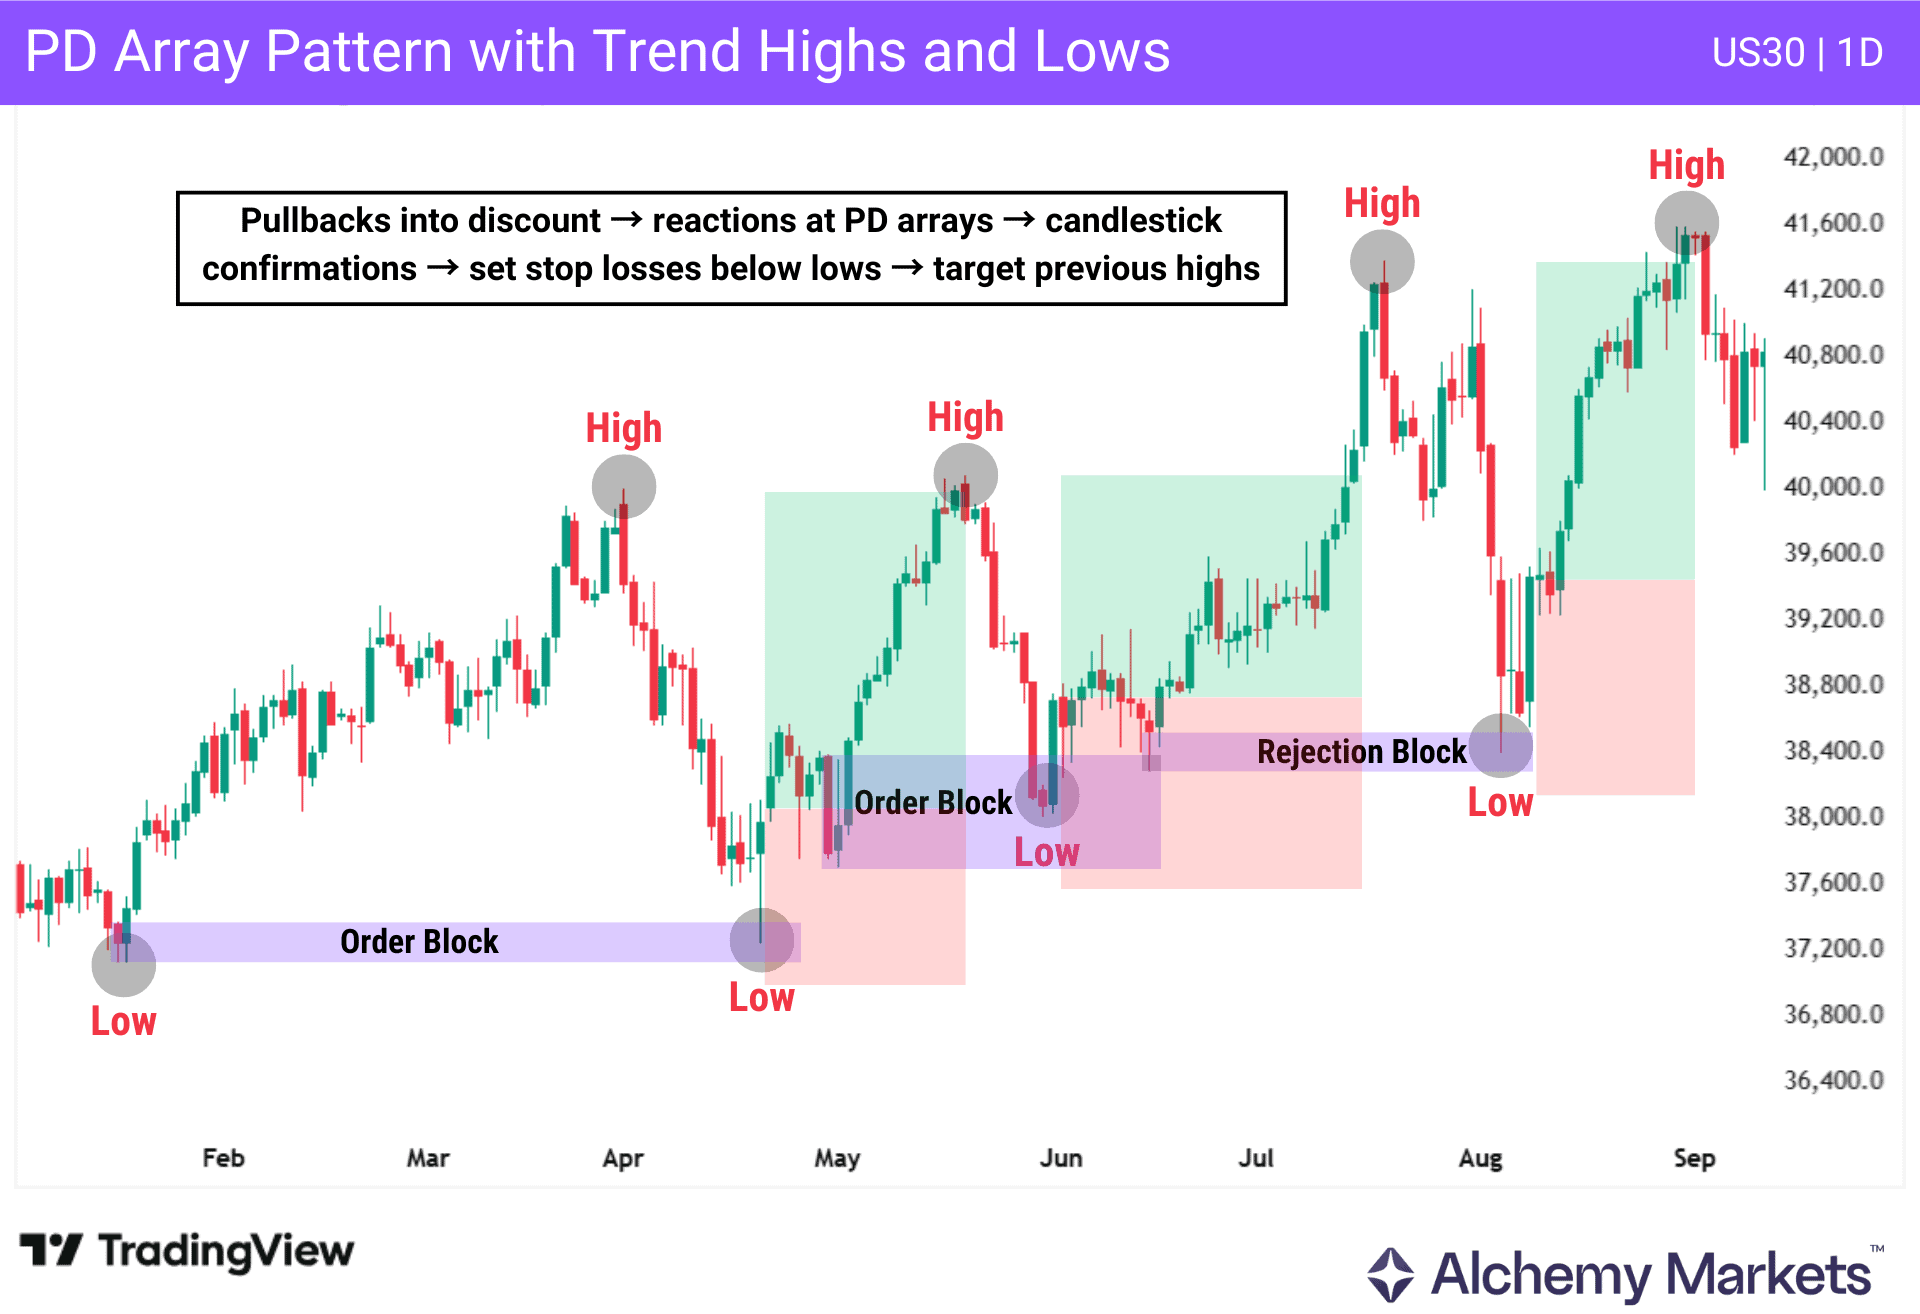
As shown in the chart, price is trending upward, forming a series of highs and lows. Pullbacks react from PD arrays formed in discount areas.
Entries are taken after confirmation using candlestick patterns, with stop loss placed below the recent lows, and targets set at previous highs. This allows alignment with the trend and taking trades at favourable areas.
PD Array Pattern with Multi-Timeframe Analysis
The PD array pattern becomes more effective when you can align an analysis with a higher timeframe bias.
For example, if you have multiple PD arrays, both bullish and bearish, on the 1H timeframe, the daily bias can give you a directional hint for which side to trade.
Under this system, the PD array of the HTF (higher timeframe) is used to set our expectations for what is more likely to happen, and the PD arrays are used to find precise price zones to trade that bias.
Traders can wait for both timeframes to align before entering a trade. Common combinations include:
- 1W (HTF) → 1D / 4H (LTF)
- 1D (HTF) → 1H (LTF)
- 4H (HTF) → 15M (LTF)
- 1H (HTF) → 5M (LTF)
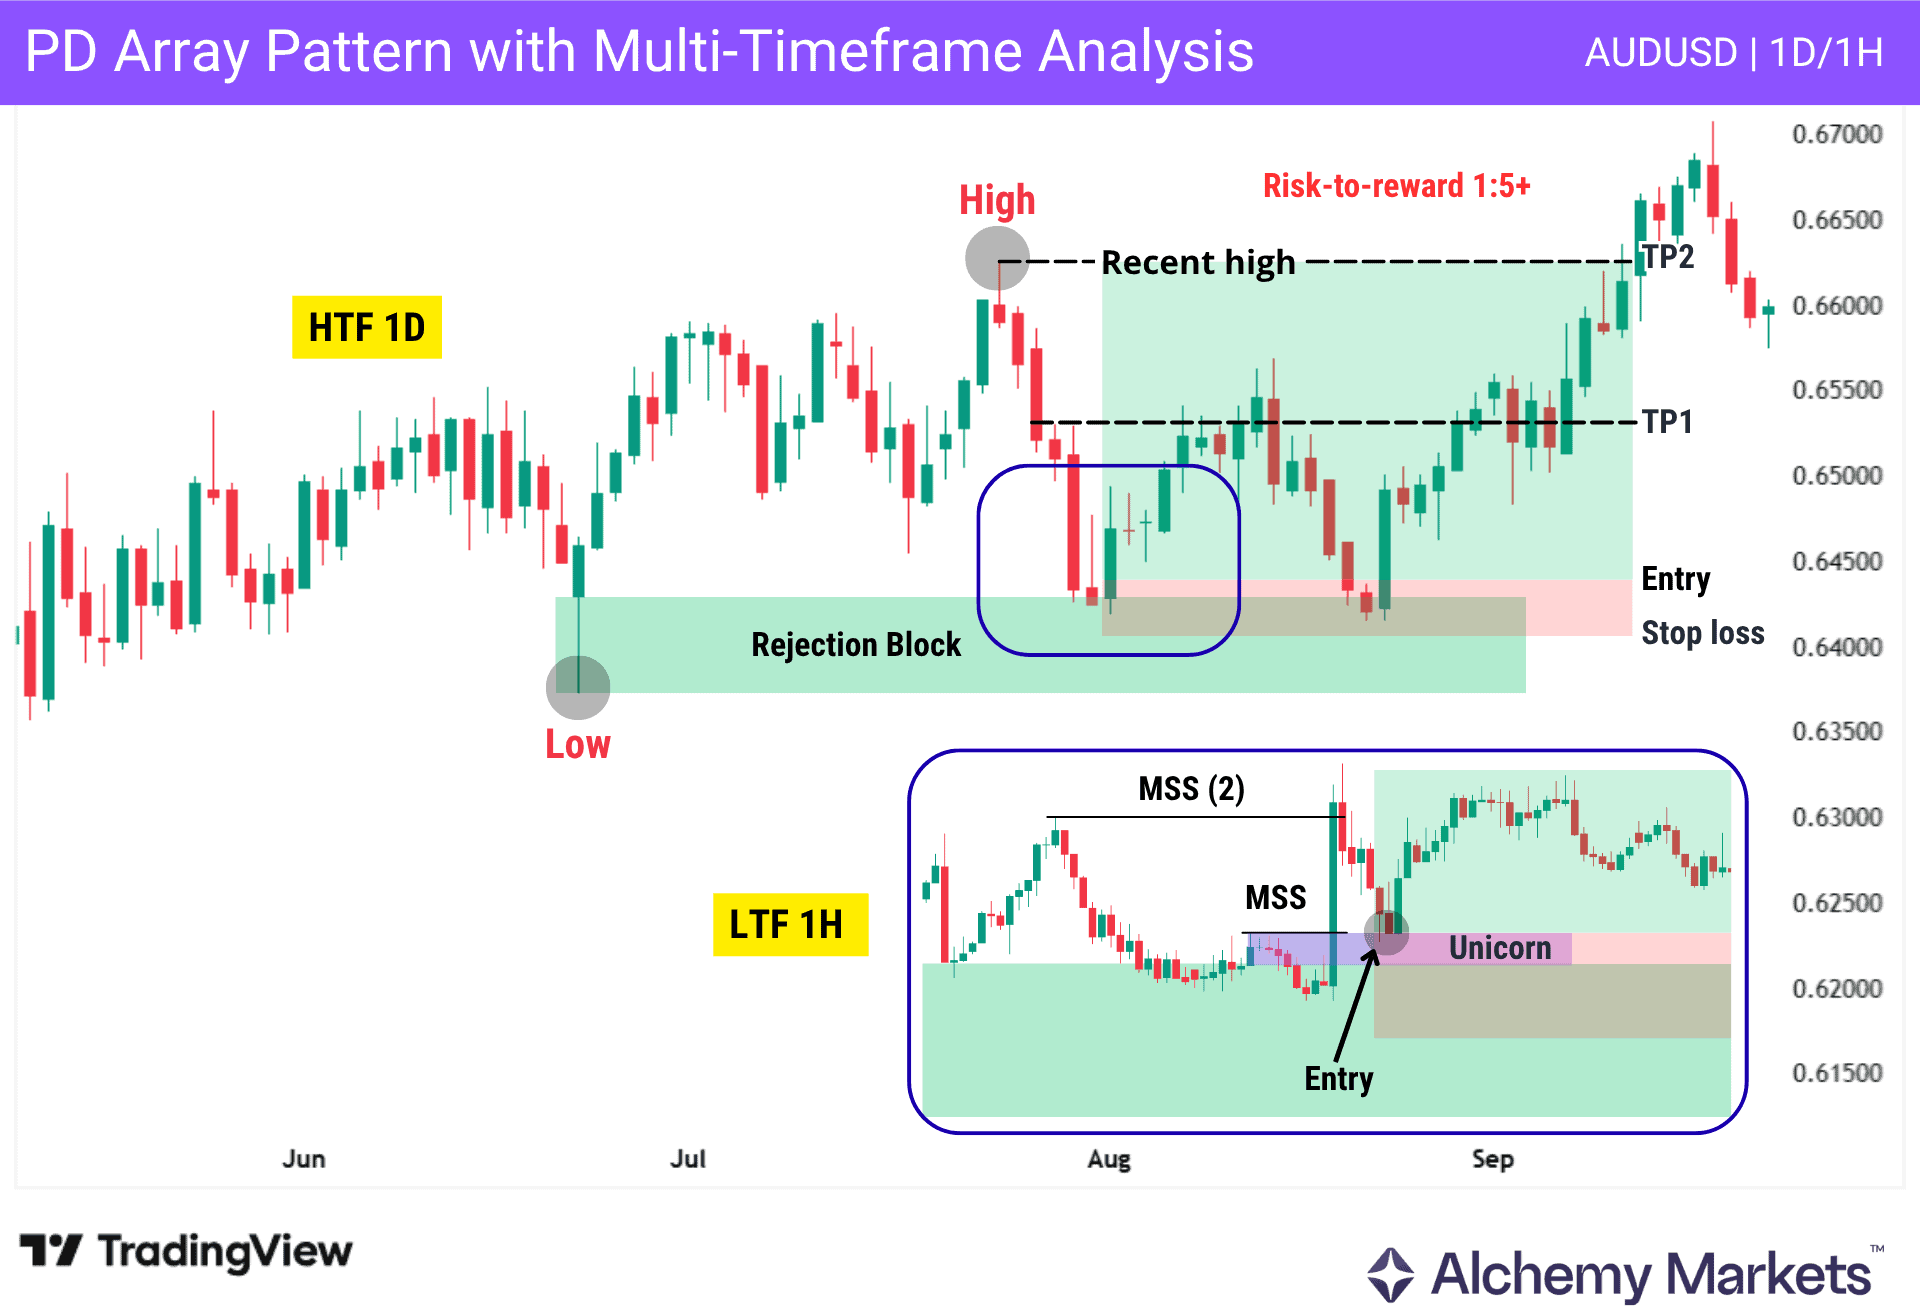
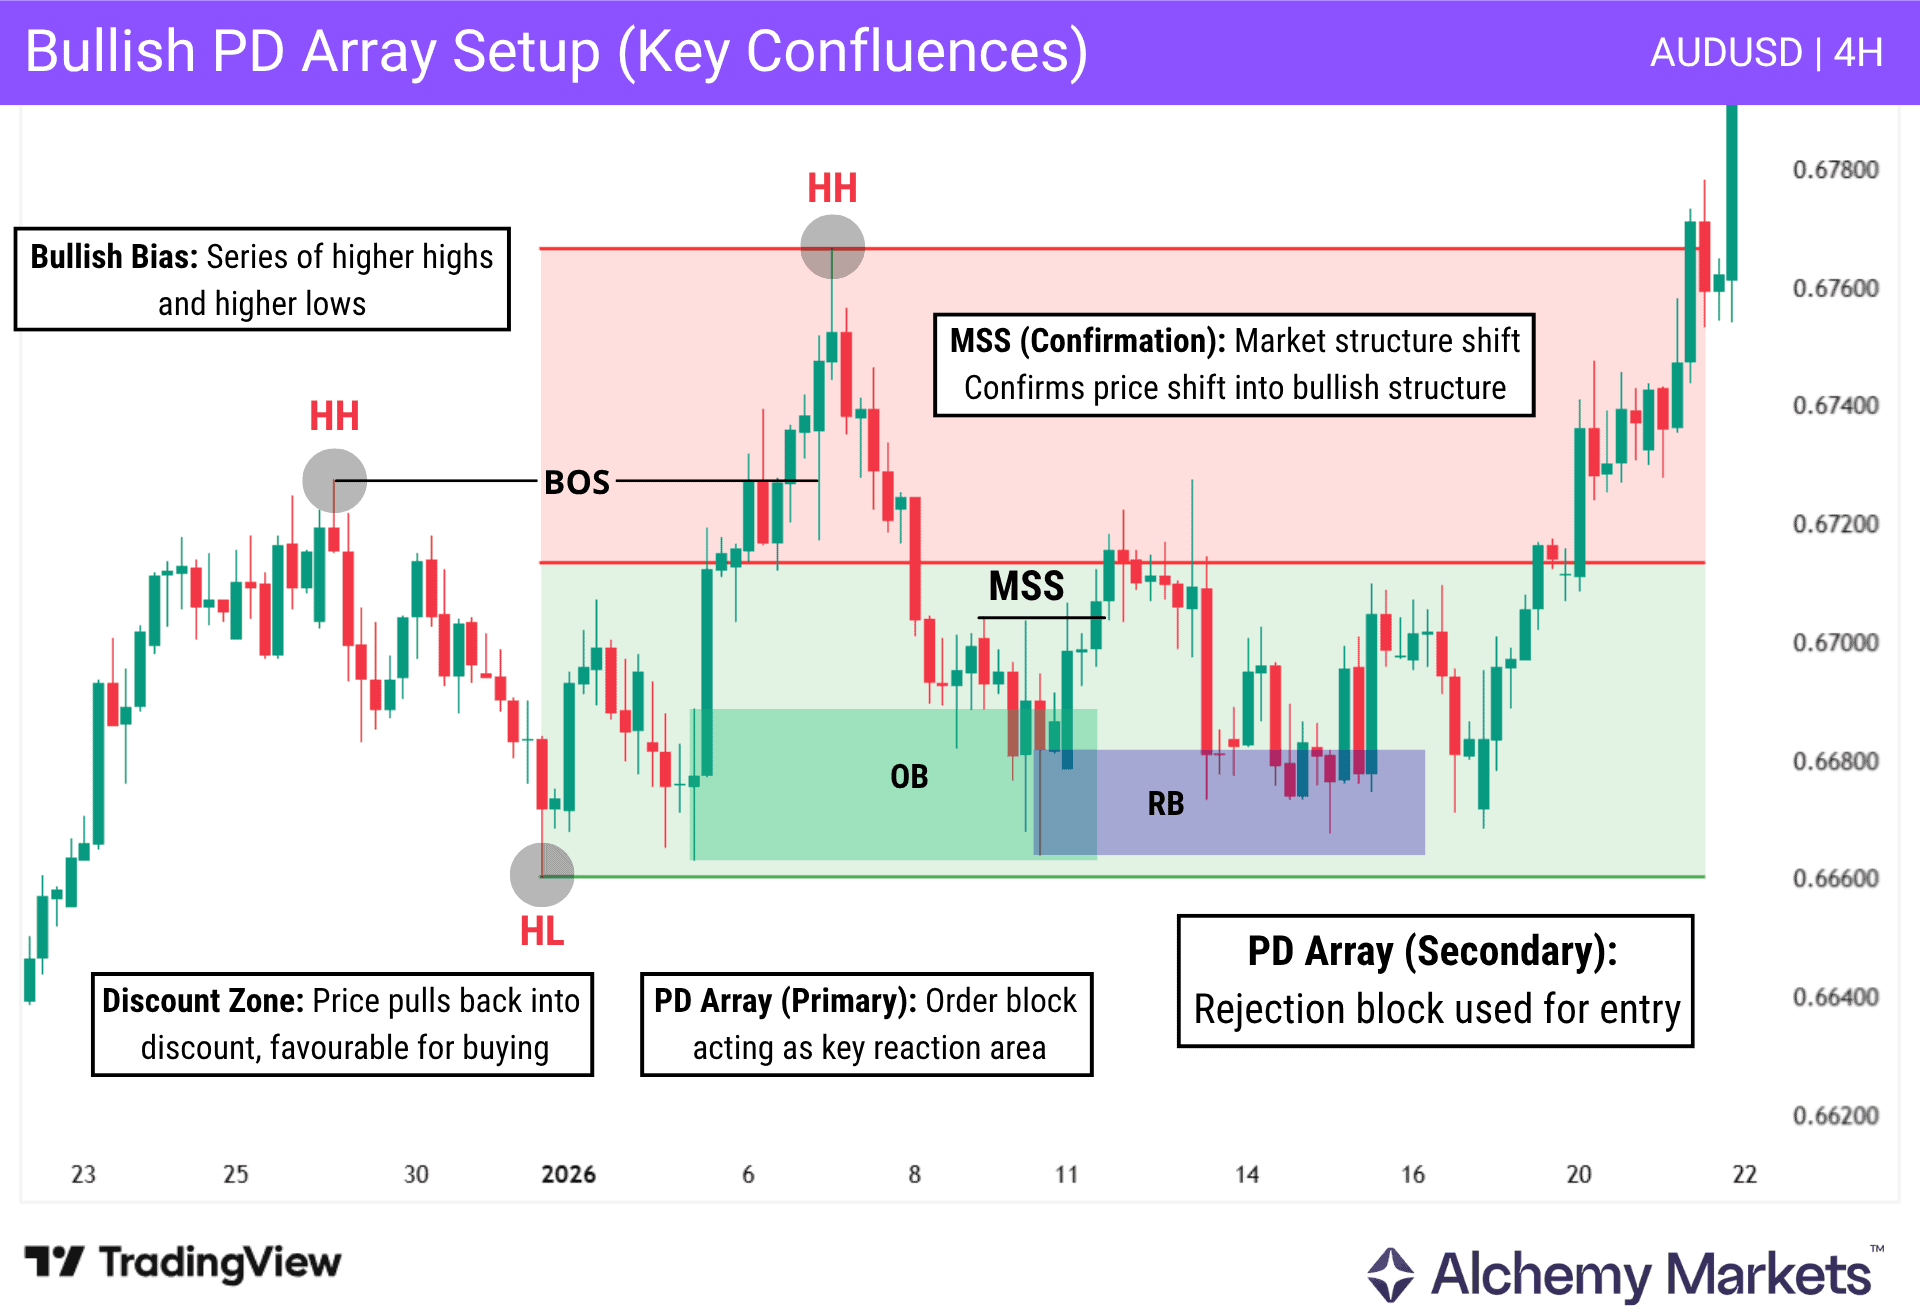
As shown in the chart, AUDUSD on the daily timeframe is bullish and forms a PD array (rejection block). Price later returns to this area. We then move to the lower timeframe (1H) to confirm the setup. Price breaks two highs with a strong move forming market structure shift, or CHoCH.
A Unicorn PD array forms, providing a precise entry, with the stop loss placed below the low. Targets are set at the next PD array or level (TP1), with the recent high as the final target (TP2).
PD Array Pattern with Market Structure Confirmation
PD arrays identify where to trade, while market structure confirms direction and validates the setup, especially when combining external and internal market structure.
- External market structure defines the overall direction and the range high and low.
- Internal market structure defines the direction within the range and helps confirm trades.
This approach helps avoid counter-trend entries and improves timing by waiting for confirmation.
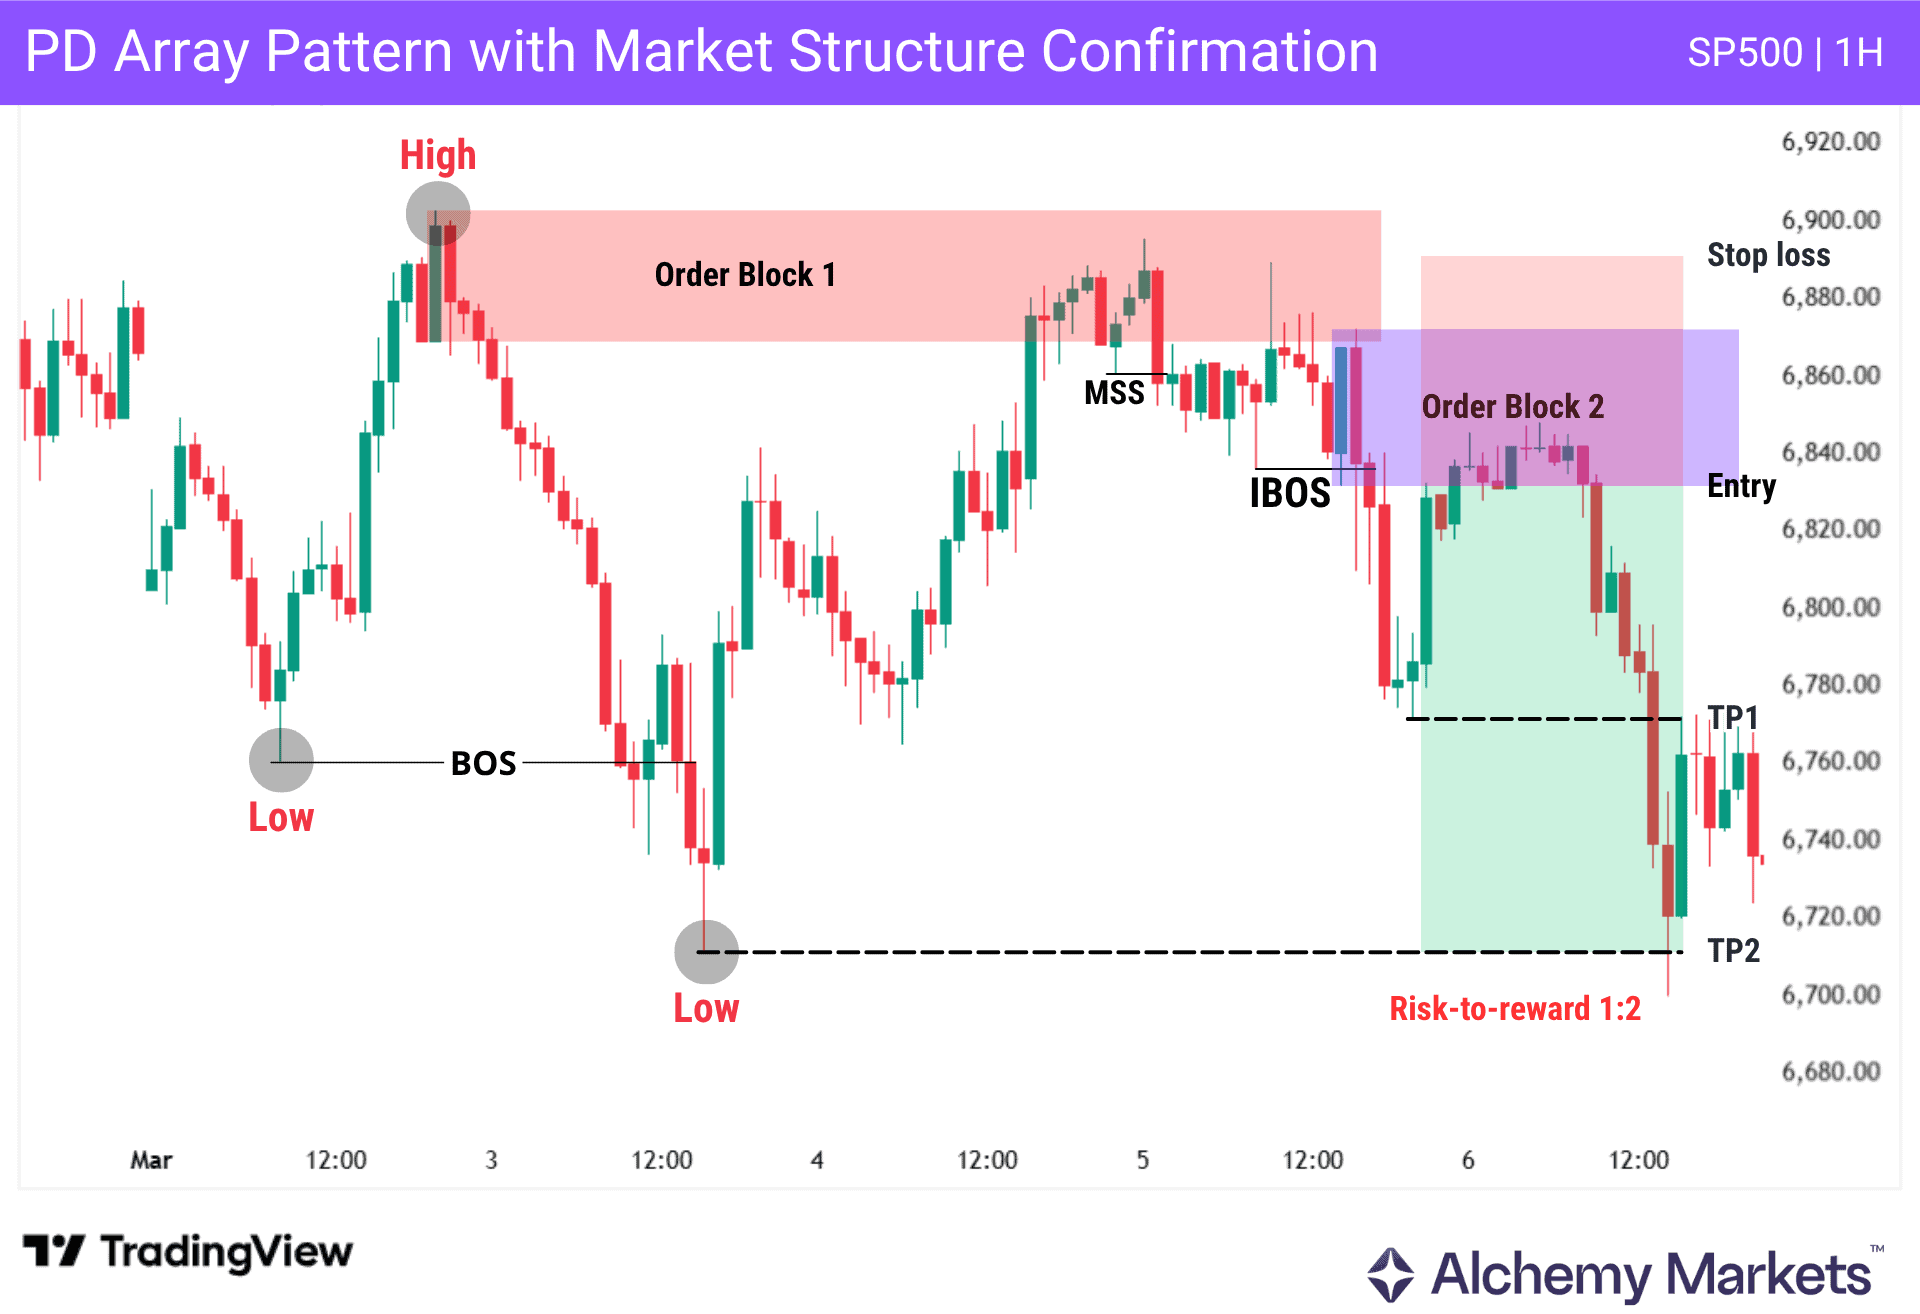
As shown in the chart, price reaches a PD array in the premium area (Order Block 1) and reacts from it. Instead of entering immediately, we wait for confirmation.
Price first breaks structure to the downside (BOS), which represents the external structure and defines the overall bearish direction. A market structure shift (MSS) then forms, followed by a bearish internal break of structure (IBOS) within the range high and low, confirming bearish pressure inside the range and showing that price is more likely to revisit the low.
After this confirmation, price forms a second order block (Order Block 2), which serves as the entry zone.
The stop loss is placed above the high, while targets are set at the internal low (TP1) and the external low (TP2).
PD Array Pattern with Tool Confluence
Confluence strengthens a PD array setup by combining multiple factors that support a reaction. Instead of relying on a single element, traders look for alignment between location, price behaviour, liquidity, and volume.
This also includes using premium and discount areas, liquidity sweeps, candlestick patterns, and volume. PD arrays formed at important areas carry more weight.
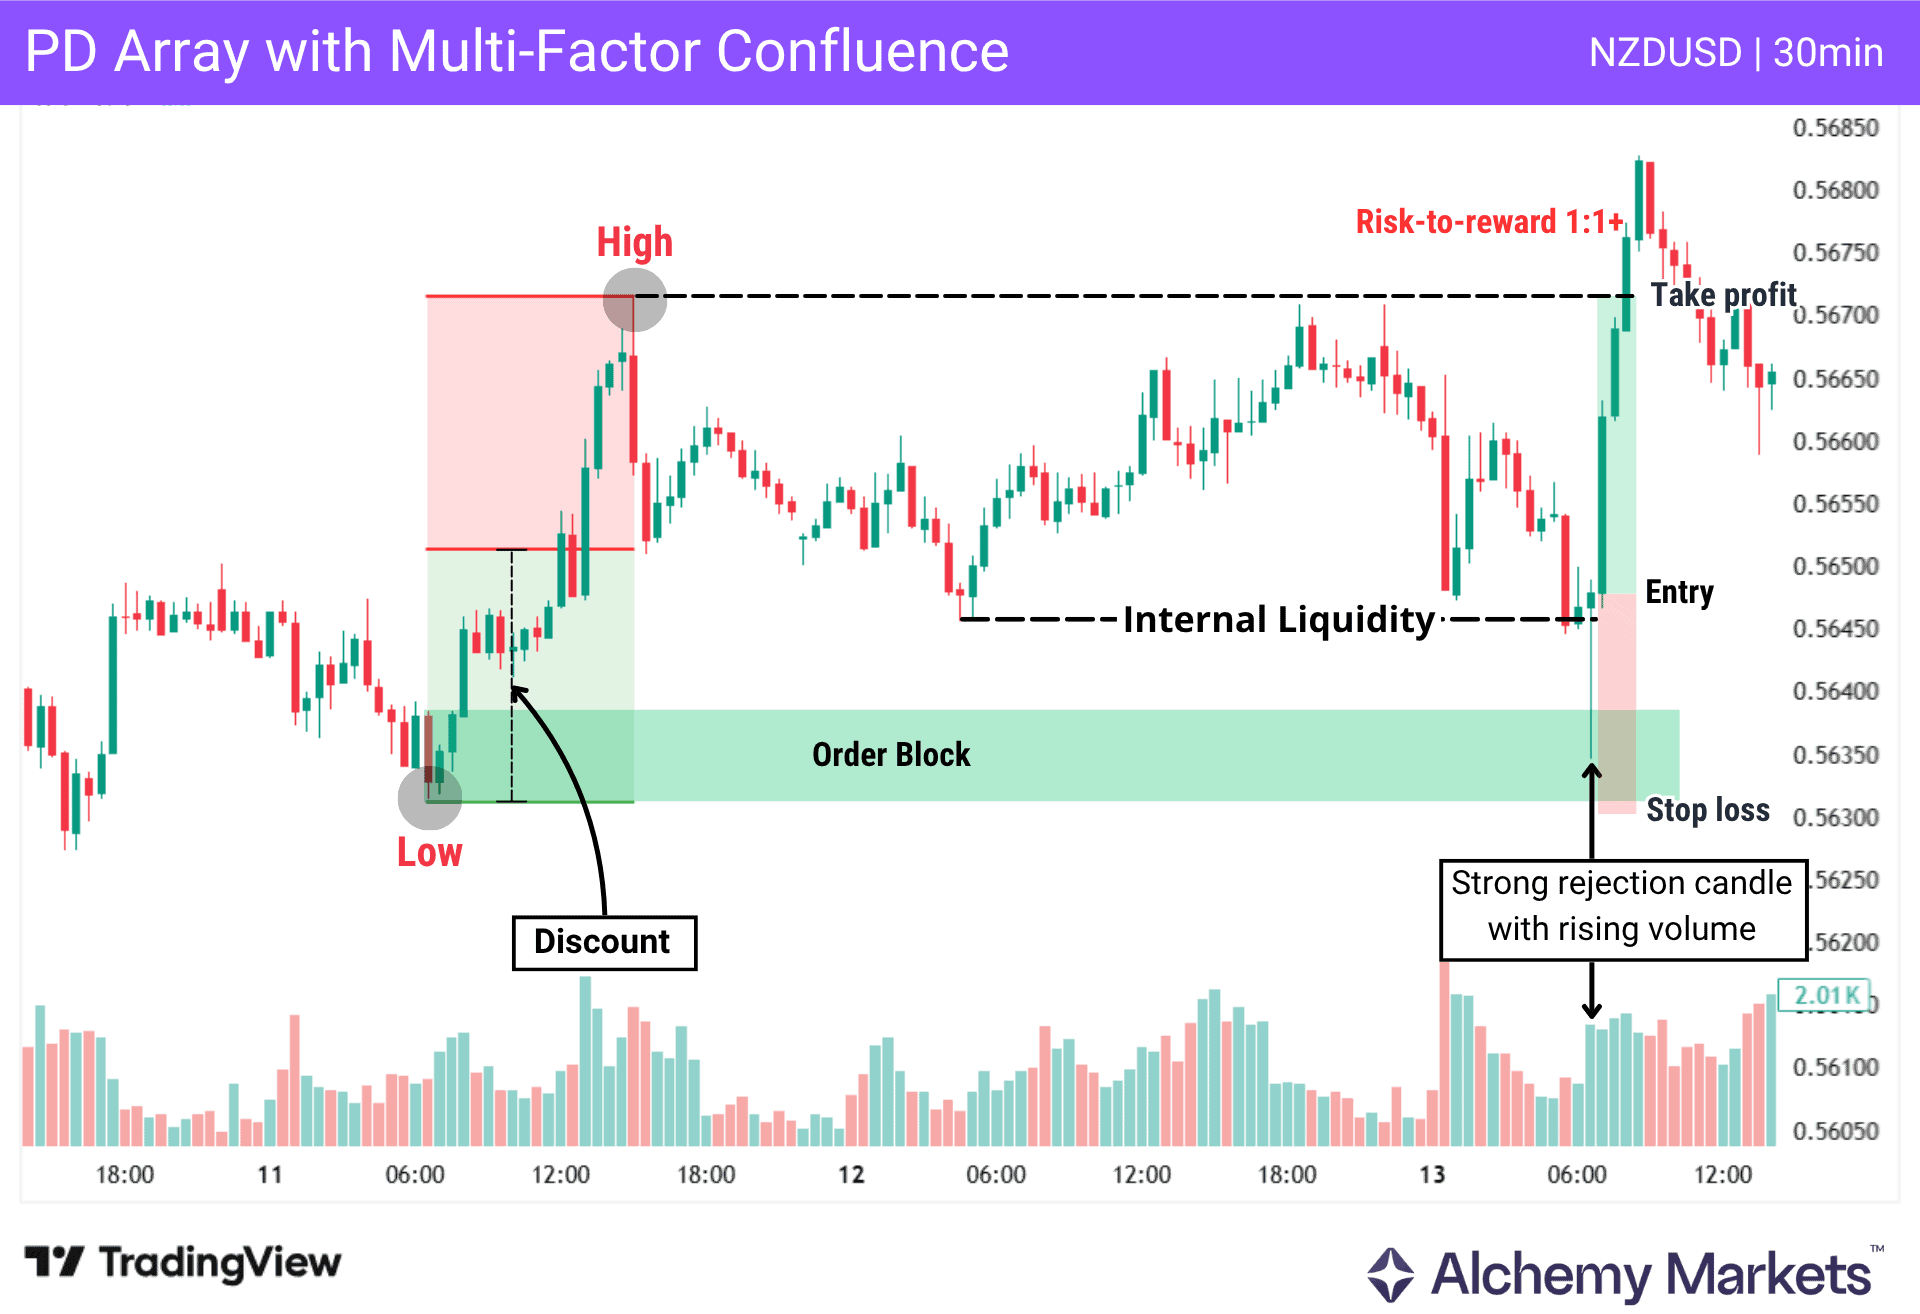
As shown in the chart, the range is defined from low to high, allowing premium and discount to be identified. Price retraces into the discount area, where a PD array forms (order block near the low).
During the move, price creates internal liquidity, which is later swept. After taking this liquidity, price reacts from the order block and forms a strong rejection candle, supported by rising volume, indicating buying pressure.
This combination of discount location, liquidity sweep, and candlestick and volume reaction adds more significance to the setup.
Entry is taken after the rejection, with stop loss placed below the low, and targets set at the previous high, where liquidity is likely resting.
PD Array Pattern with Trend Identification
Aligning PD arrays with the trend is essential for improving trade quality and avoiding counter-trend setups. While PD arrays define where to trade, the trend determines direction.
Trend can be identified in different ways, such as market structure, trendlines, or moving averages, each providing a different view of price direction.
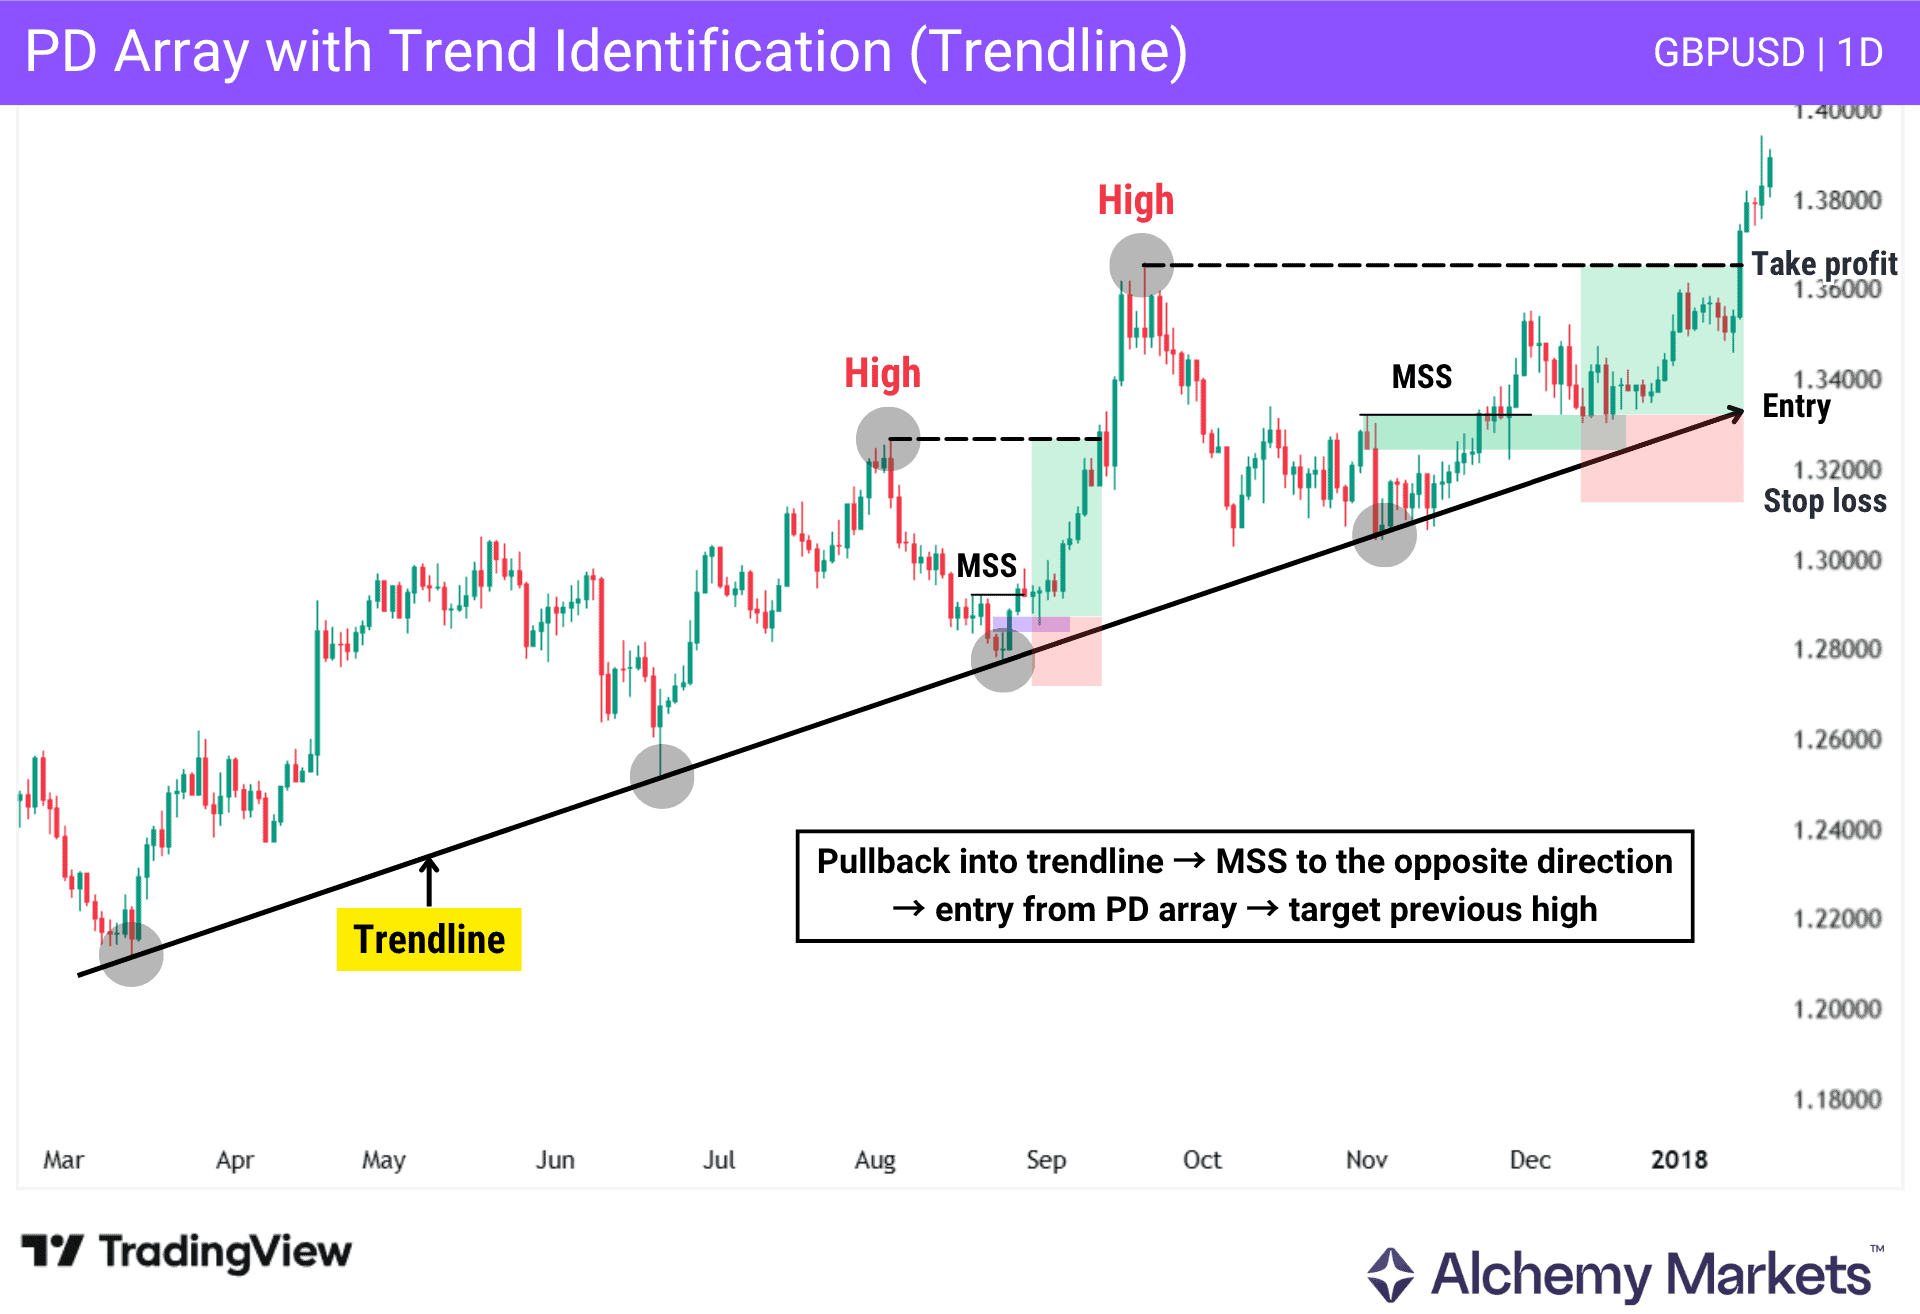
As shown in the chart, the trend is identified using a trendline. Pullbacks into the trendline create opportunities to look for PD arrays aligned with the trend. Entries are taken after reacting to thos pd arrays, targeting the previous high.
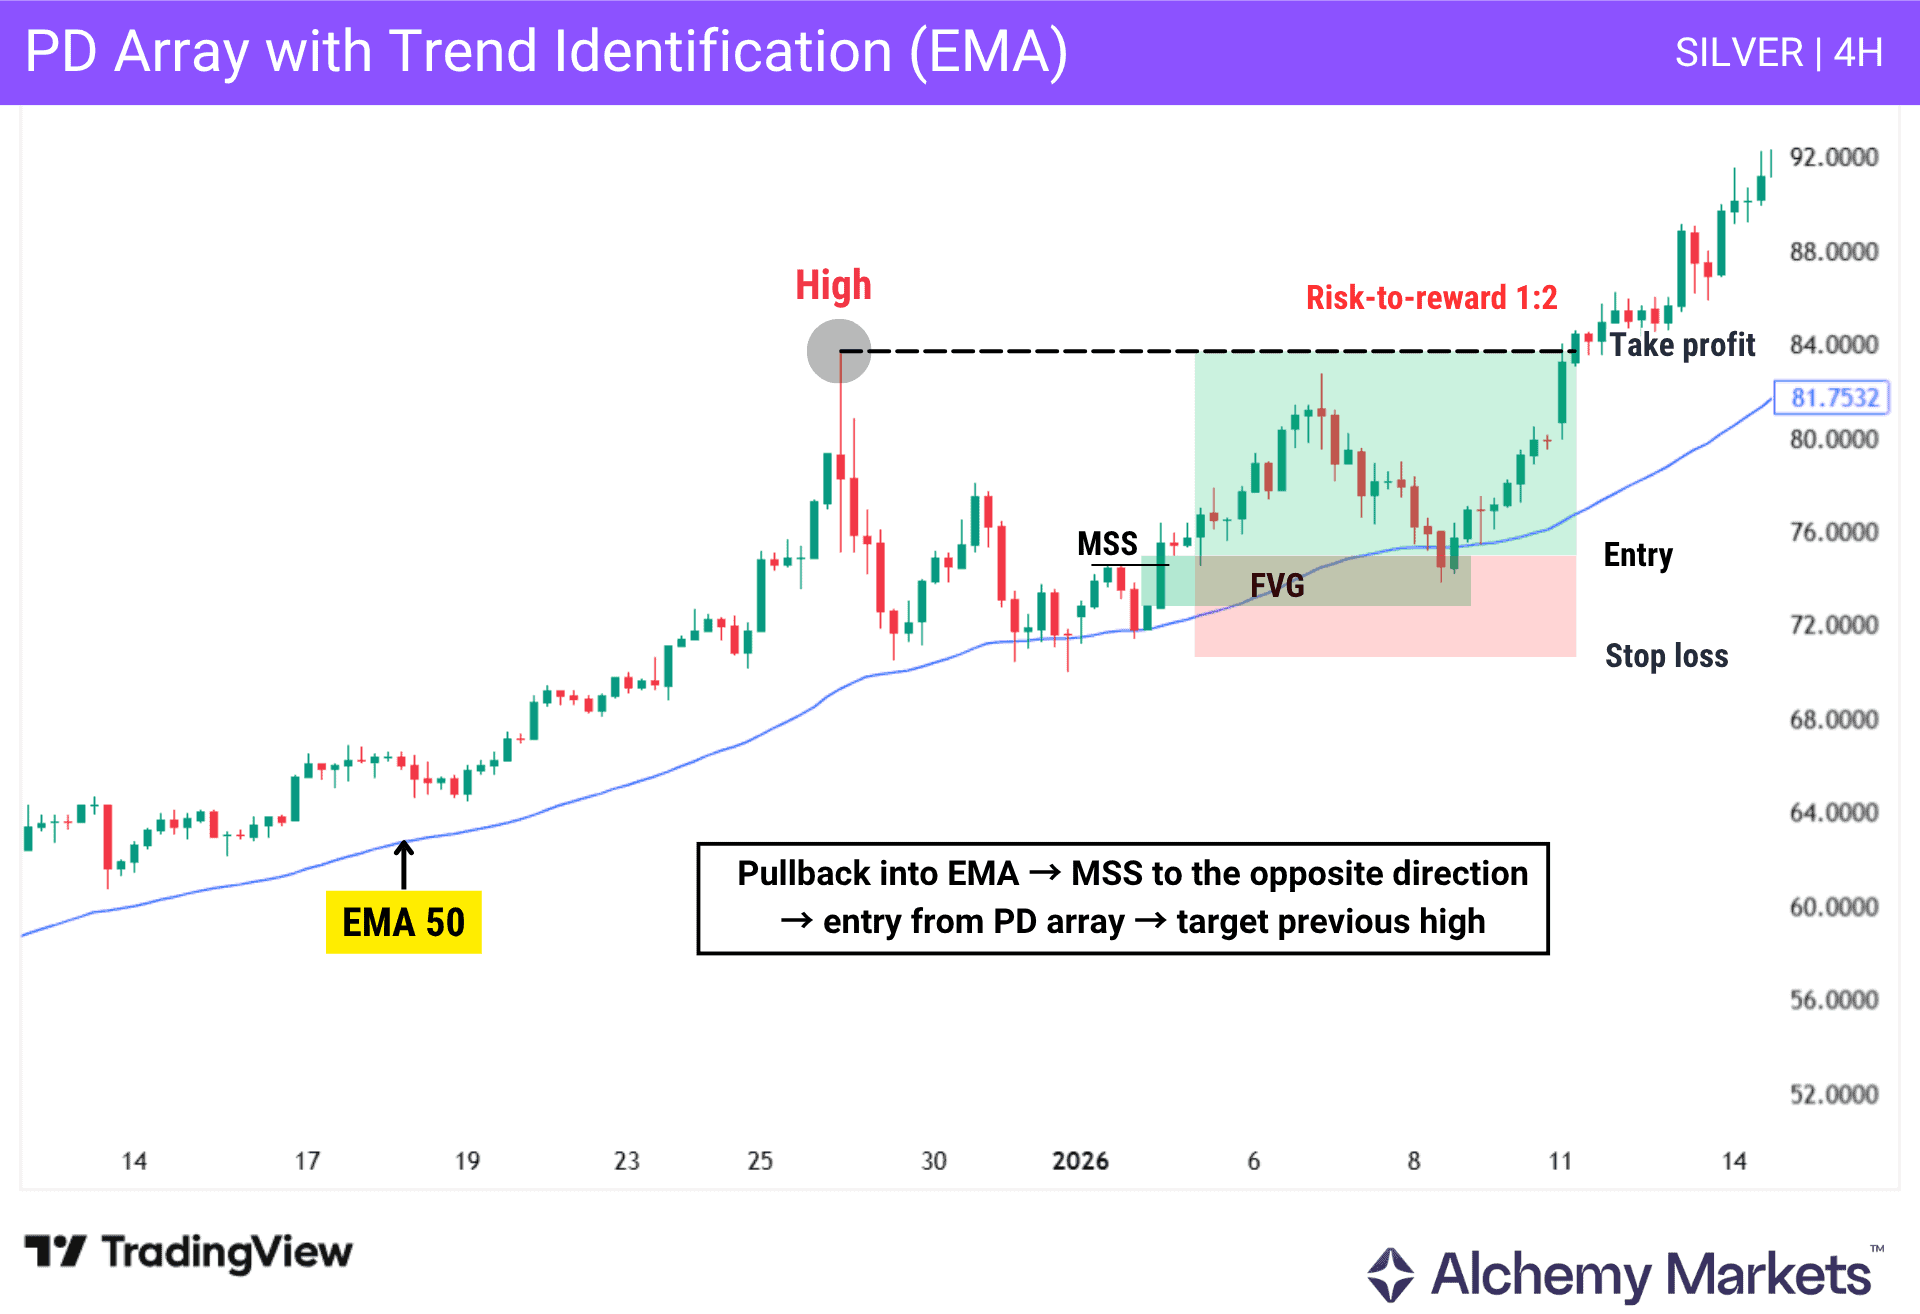
In this example, the EMA is used to confirm the bullish trend, with price remaining above it. Pullbacks toward the EMA create areas where PD arrays form (FVG).
The entry is confirmed with a market structure shift (MSS), with target set at the previous high.
The PD array improves trading by focusing on location rather than signals. It helps traders interpret price behaviour and align trades with how market movements develop within a range.
PD Array Matrix – Which Array Wins?
With so many types of arrays on the table, it can be intimidating to know where to get started.
This is where the PD array matrix can help.
The PD Array Matrix is an ICT framework for loosely ranking PD arrays based on importance. Instead of treating every zone equally, traders use it to decide which area deserves more attention based on location, timeframe, and market context.
For this guide, the priority ladder looks like this:
| i. Optimal Trade Entry (OTE) ii. Order Block iii. Fair Value Gap (FVG) iv. Breaker Block v. Mitigation Block vi. Rejection Block vii. Inverse Fair Value Gap (IFVG) viii. Liquidity Void ix. Old High / Old Low x. Unicorn Model xi. New Weekly Opening Gap (NWOG) / New Daily Opening Gap (NDOG) |
This does not mean the top array always wins. Rather, the array matrix is based on how frequent and how reliable an array is.
Order blocks are the most important to notice amongst the standard PD arrays because it acts as a foundation for breaker and mitigation blocks.
And OTEs offer the most actionable and high probability setups, based on ICT’s creator, Michael Huddleston’s own preferences.
Advantages of Trading on the PD Array Pattern
The PD array improves trading by focusing on location rather than signals. It helps traders interpret price behaviour and align trades with how market movements develop within a range.
| Advantage | Explanation |
| Better entry pricing | Entries are taken in premium and discount areas where buyers or sellers are more likely to react |
| Can be used for entries and targets | Price often moves from one PD array to another within the range |
| Cleaner execution | Follows a clear process: range → zone → reaction → confirmation |
| Works with confluence | Combines easily with tools like liquidity, structure, and imbalances |
| Reduces overtrading | Forces patience by waiting for price to reach important price zones |
It simplifies decision-making by removing noise. Instead of analysing all price movements, traders focus only on key areas where reactions are more likely.
Disadvantages of Trading the PD Array Pattern
The PD array provides structure, but it does not guarantee outcomes. Execution still depends on analysing price behaviour at key areas and confirming the setup.
| Disadvantage | Explanation |
| Subjective range selection | Incorrect range leads to wrong zones and invalid setups |
| Higher timeframe conflict | Higher timeframe PD arrays can override lower timeframe setups |
| No timing precision | Shows where price may react, not when |
| False reactions | Price can react and still fail to hold or continue |
| Weak in choppy markets | Lack of direction reduces reliability |
| Requires confirmation | Cannot be traded without structure or confirmation |
| Can become complex | Using too many tools reduces clarity |
| Requires experience | Understanding reactions and context takes practice |
The main limitation is timing. Even strong areas can fail without confirmation, especially when higher timeframe levels are involved or when market conditions are unclear.
PD Array vs Support and Resistance
PD arrays and support and resistance both help identify where price may react, but they are built differently. Support and resistance mark price levels based on repeated reactions, while PD arrays define specific zones derived from price behaviour during a move.
They work best together. Support and resistance provide broader market context and key levels, while PD arrays refine the exact area for entries and exits.
| Feature | PD Array | Support & Resistance |
| Main idea | Defines specific zones based on price behaviour | Marks price levels where reactions occurred in the past |
| How it forms | Derived from price behaviour during a move | Derived from repeated reactions at similar levels |
| Reaction logic | Acts as a reaction zone; repeated tests can weaken it | Strengthens with repeated reactions |
| Structure | Defined zones based on behaviour | Visible levels on the chart |
| Purpose | Refines entries, targets, and reaction areas | Identifies reversals and breakouts |
| Practical use | Used within broader market analysis (structure, context, confirmation) | Used as reference levels for reactions and retests |
| Relationship | Can align with support and resistance to strengthen setups | Provides broader context for PD array zones |
Now let’s see how support and resistance and PD arrays can work together:
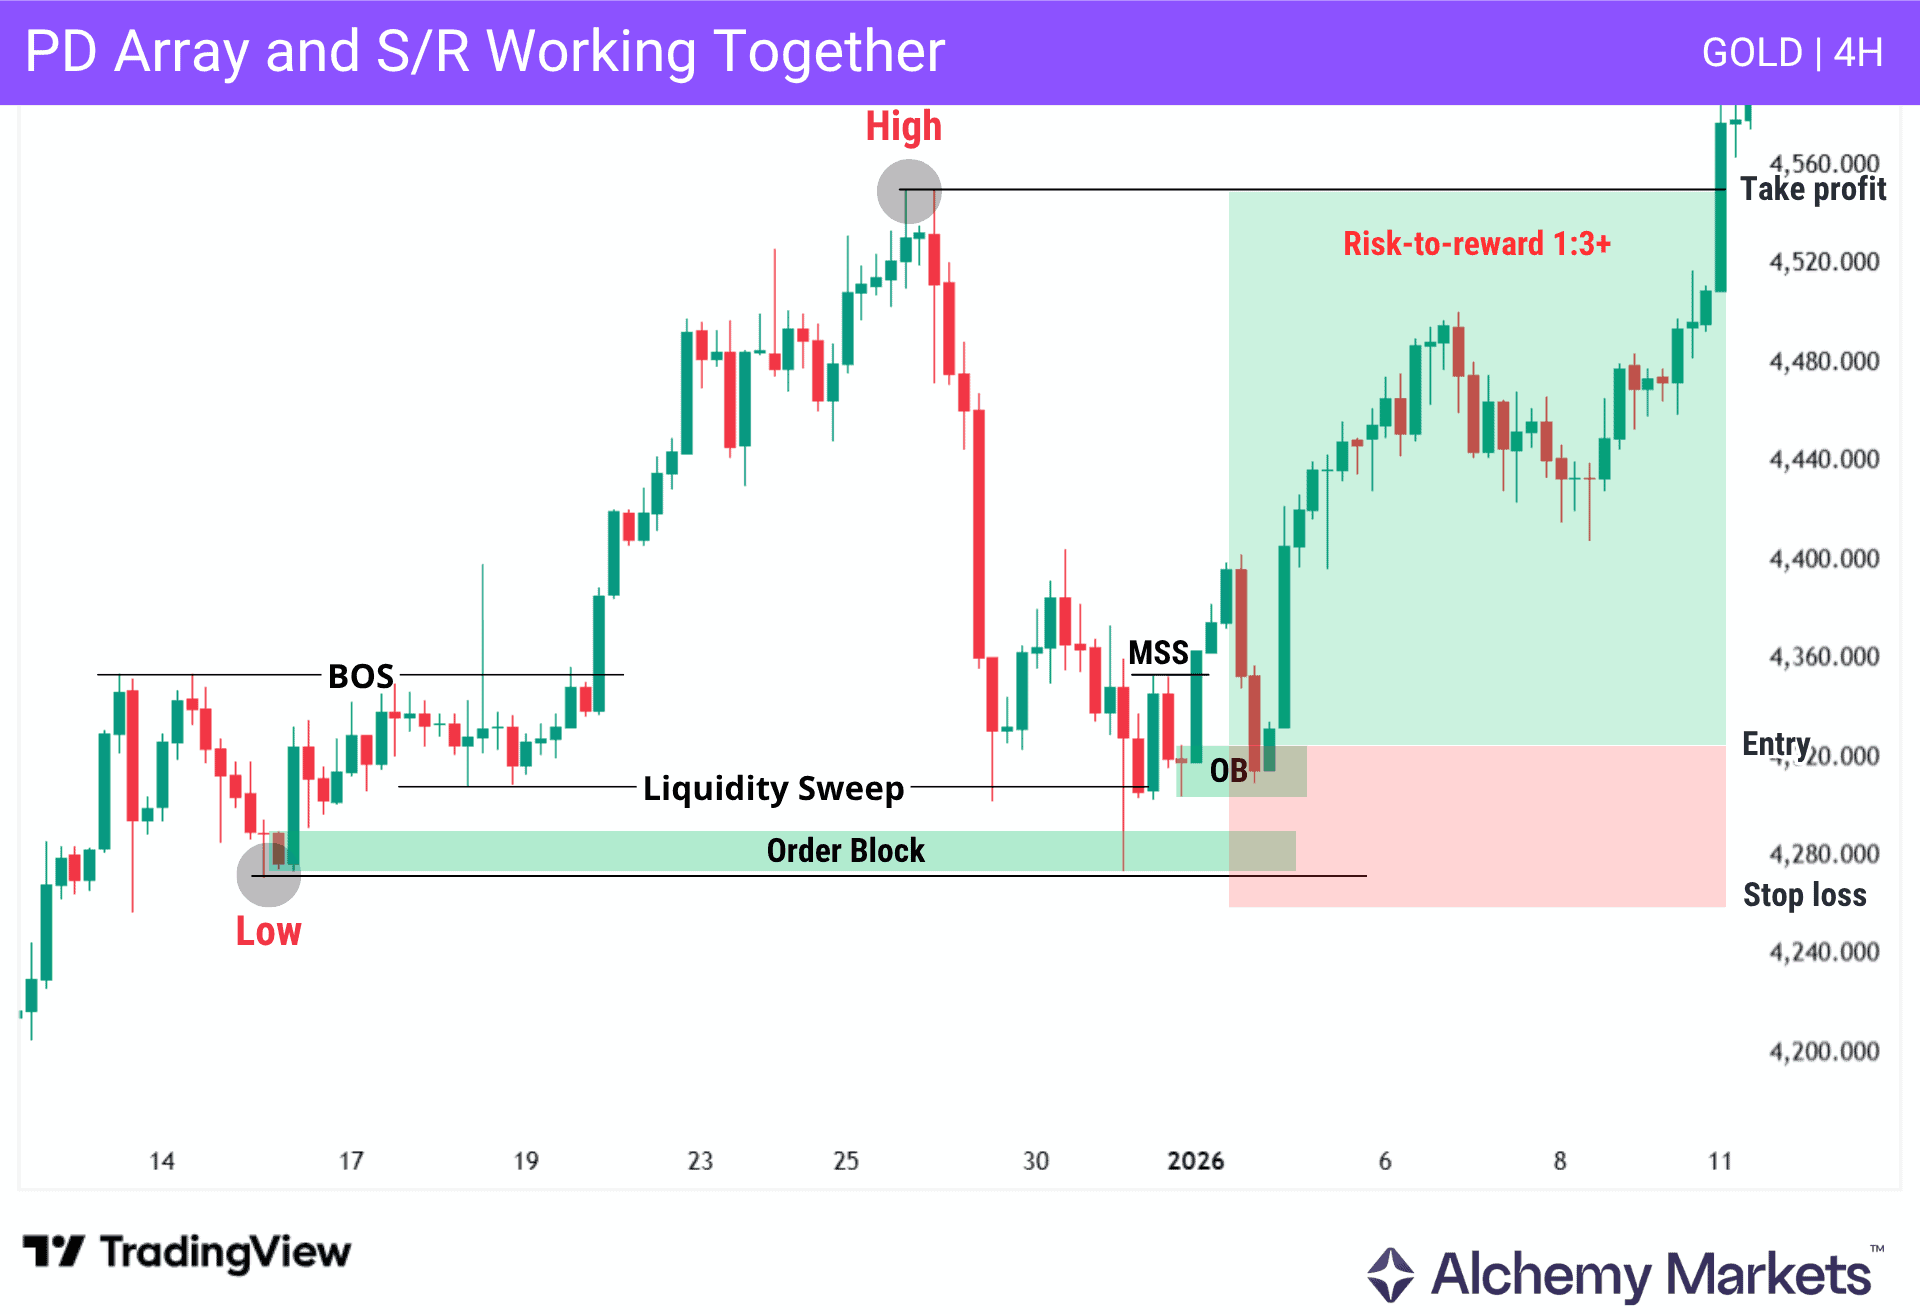
As shown in the chart, the low acts as support and the high as resistance, and together they define the range. The stop loss is placed below the low, while the high is used as the target.
The break of structure (BOS) shows that resistance has been broken, indicating a bullish structure and confirming the direction.
Within the range, internal liquidity acts as support but is swept before price reacts to the order block and reverses.
A market structure shift (MSS) then forms, which can act as an internal resistance level during the pullback.
The two order blocks represent PD arrays. Together with support and resistance, liquidity, BOS, and MSS, they align to confirm the setup and provide a structured trade idea.
PD Array vs Fair Value Gaps
A fair value gap (FVG) is one of the tools within PD arrays. PD arrays are not a single pattern but a framework that includes multiple price tools such as order blocks (OBs), fair value gaps (FVGs), rejection blocks (RBs), breaker blocks (BBs), and mitigation blocks (MBs).
| Feature | PD Arrays | Fair Value Gap (FVG) |
| Type | Framework | Single tool |
| Role | Organises multiple price tools | Identifies imbalance in price |
| Scope | Includes OBs, FVGs, RBs, BBs, MBs | Focuses only on gaps |
| Use in trading | Defines context and location | Used to refine entries or reactions |
| Dependence | Requires structure and context | More effective when used within PD arrays |
An FVG highlights areas where price moved aggressively, leaving an imbalance. Price may return to these areas, but not every FVG is meaningful on its own.
This is where PD arrays add value. They provide context by filtering which FVGs are relevant based on structure and location.
For example, an FVG aligned with the market trend and formed after a strong move is more relevant than one that appears in the middle of a range.
PD arrays do not compete with FVGs. They organise how FVGs and other tools are used together within a structured framework.
FAQ
What Are the Common PD Array Pattern Mistakes to Watch Out For?
A common mistake is entering without confirmation. Reaching a PD array does not guarantee a reaction, especially as markets evolve quickly. Ignoring higher timeframe dependence or poor range selection can lead to weak setups.
What Is the Best Time Frame to Use for the PD Array Pattern?
The ICT PD array can be used on all timeframes. Higher timeframes provide context, while lower timeframes refine entries, helping traders better interpret price movements and identify future price movements.
What Is the Best Trading Pair for PD Arrays?
PD arrays work across most markets but perform better in forex trading on highly liquid pairs like EUR/USD and GBP/USD. These FX pairs often provide cleaner PD array structures, along with cleaner reactions; highlighting the importance of high liquidity in trading PD arrays.
What Is a Premium Array in Forex?
In forex trading, premium refers to price trading above the midpoint of a range. It represents a higher area where selling setups are typically considered, depending on how price aligns with the trend.
What Is a Discount Array in Forex?
In forex trading, discount refers to price trading below the midpoint of a range. It represents a lower area, often considered undervalued relative to the range, where buying opportunities may develop.
Who First Identified the PD Array Pattern?
The PD array was formalised within the Inner Circle Trader methodology. This trading concept developed from earlier ideas like support and resistance, used to organise price levels/areas and understand how price delivers.
Are there PD Array indicators?
Yes, PD Array indicators do exist, but most are community-made tools, often found on platforms such as TradingView, and are usually fine-tuned for specific concepts like order blocks or fair value gaps. Since they are not as standardised as classic indicators like RSI or MACD, the quality of each PD array indicator can vary greatly depending on how it is coded and used. Use with caution.


