


Written by:

Reviewed by:

Bullish
- May 9, 2024
- 10 min read
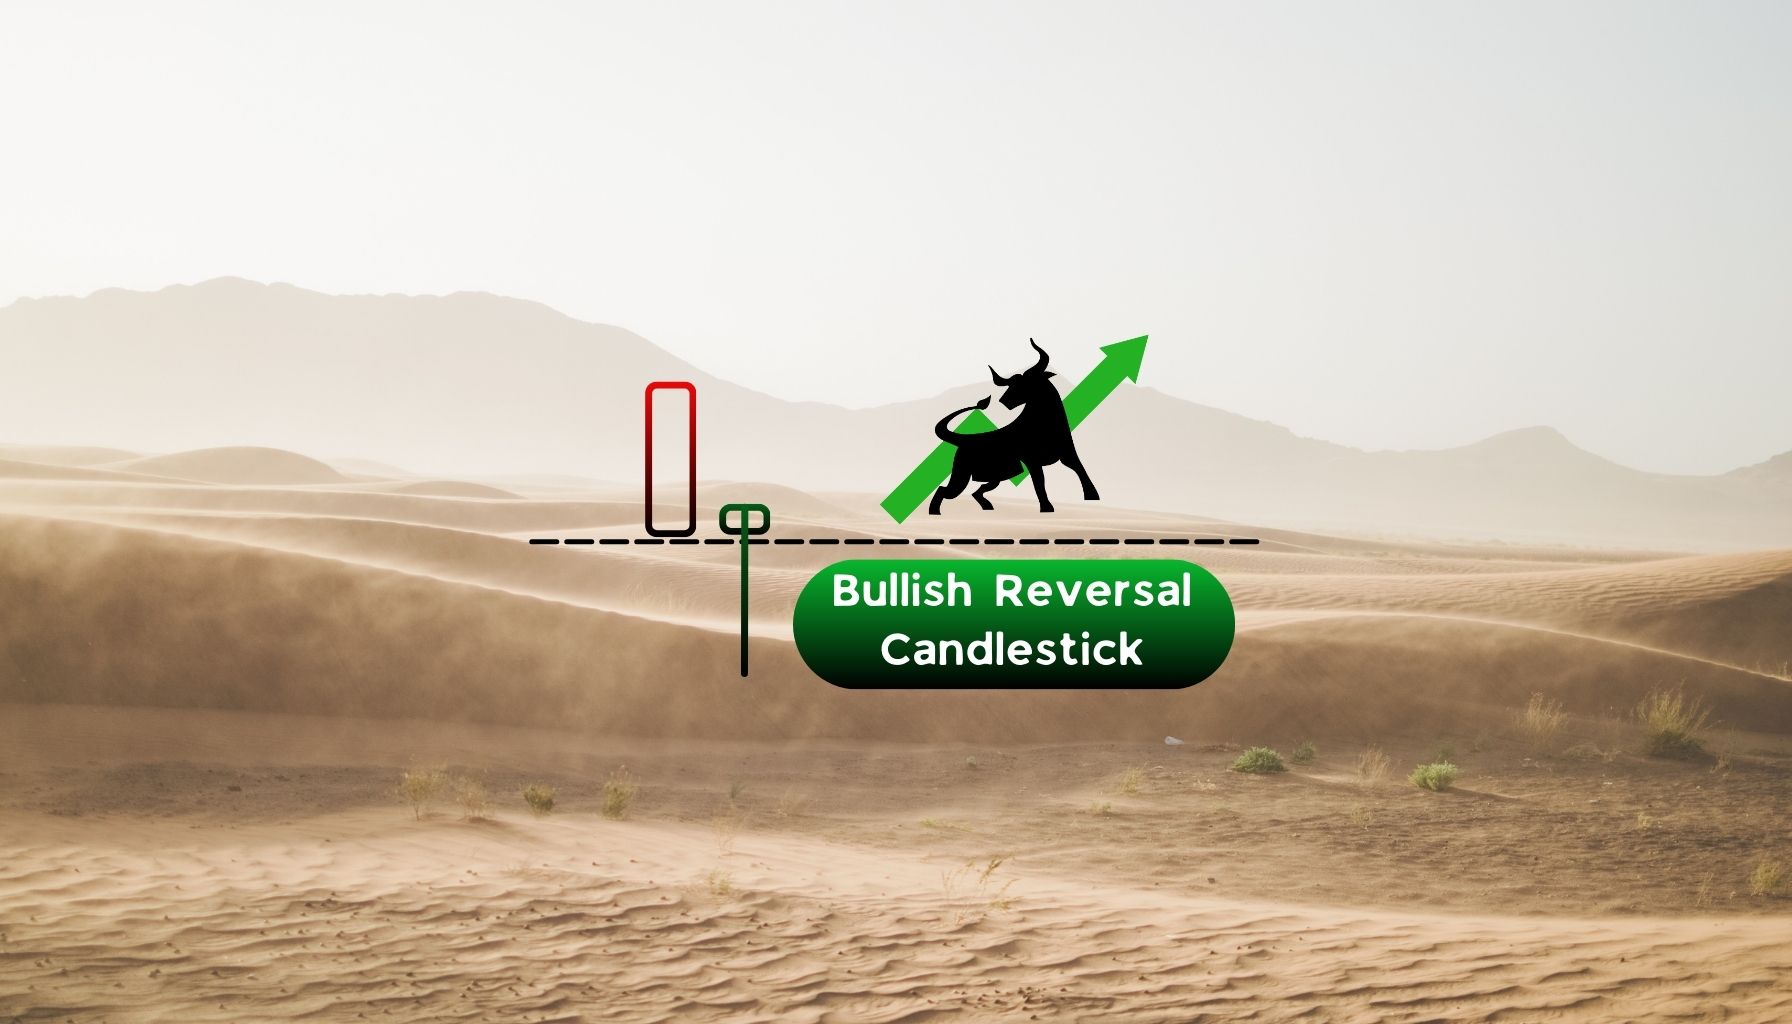
Hammer Candlestick Pattern – Strategies Included
Explore the secrets of the hammer candlestick, an easy-to-identify pattern that plays a crucial role in revealing a bullish reversal.
This article breaks down the pattern with clear explanations and visuals to give traders a comprehensive understanding.
What is a Hammer Candlestick Pattern?
The hammer is a Japanese candlestick pattern used in technical analysis to signal a potential bullish reversal after a downtrend. The primary function is to indicate when a downtrend could change to an uptrend.
This pattern consists of a single candlestick, making it incredibly easy to identify. The candle will have a long lower shadow, and a small candle body formed at the top. This unique formation resembles the shape of a hammer, thereby giving the pattern its name.
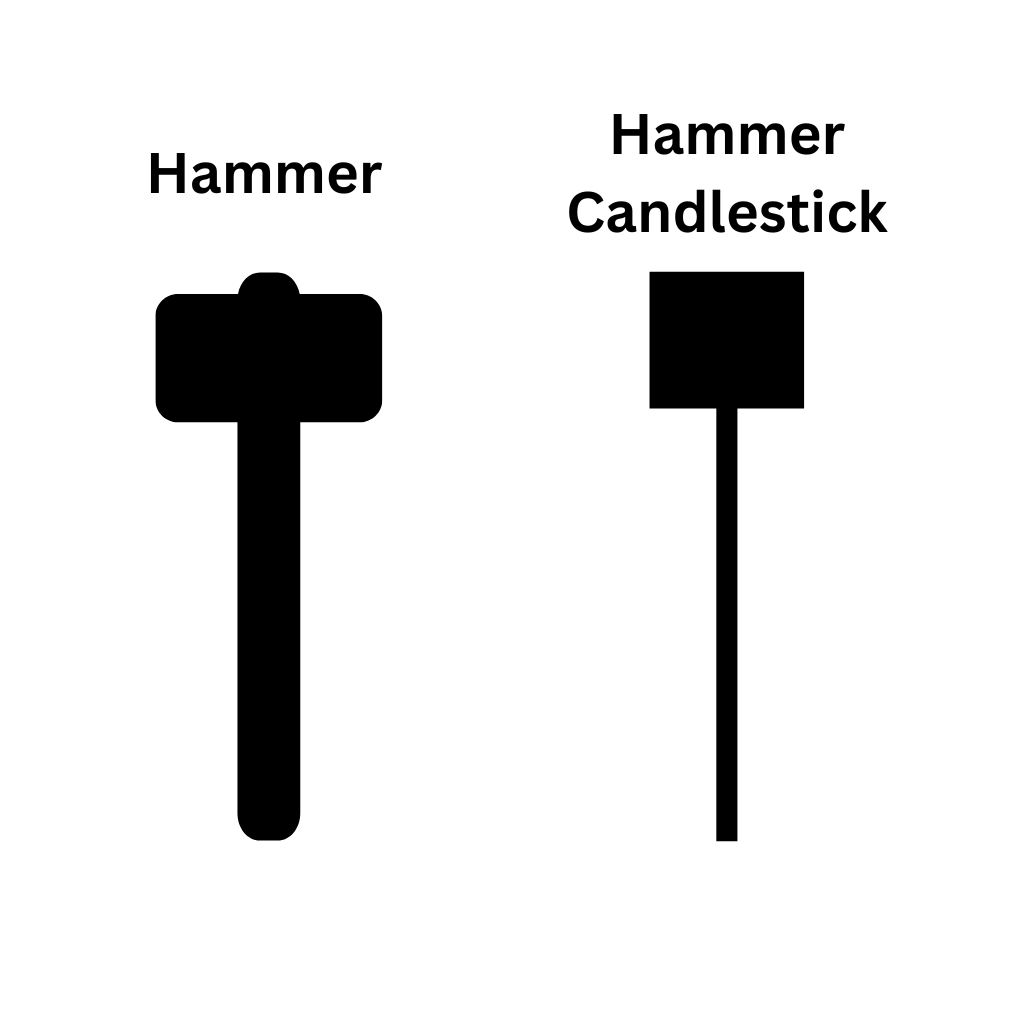
What Does a Hammer Candlestick Look Like?
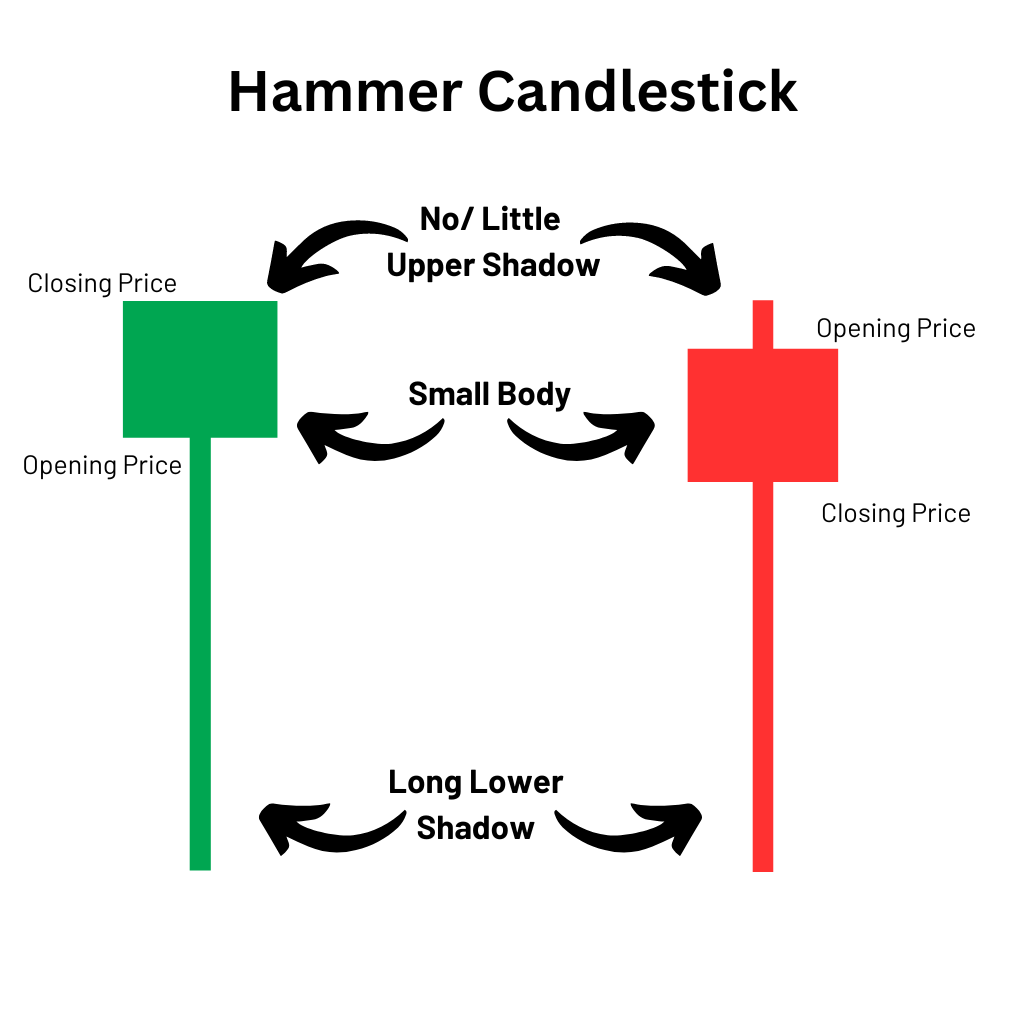
A hammer candlestick can easily be identified because of its distinct shape resembling a hammer. It features a short body at the top, a long lower shadow at least twice the size of the body. The upper shadow can be incredibly short or even non-existent.
The hammer often appears as a green candlestick, but can also appear as a red hammer. The key aspect to keep in mind is that the pattern should still resemble a hammer.
The small body is formed because the opening and closing prices are now close to each other, after significant buying pressure from the lows of the candlestick. This signals that sellers are losing momentum, with the buyers aiming for the price to push higher.
The Bullish Hammer Candlestick Example
A classic example of a bullish hammer formation occurs can be seen on the S&P Index Chart:
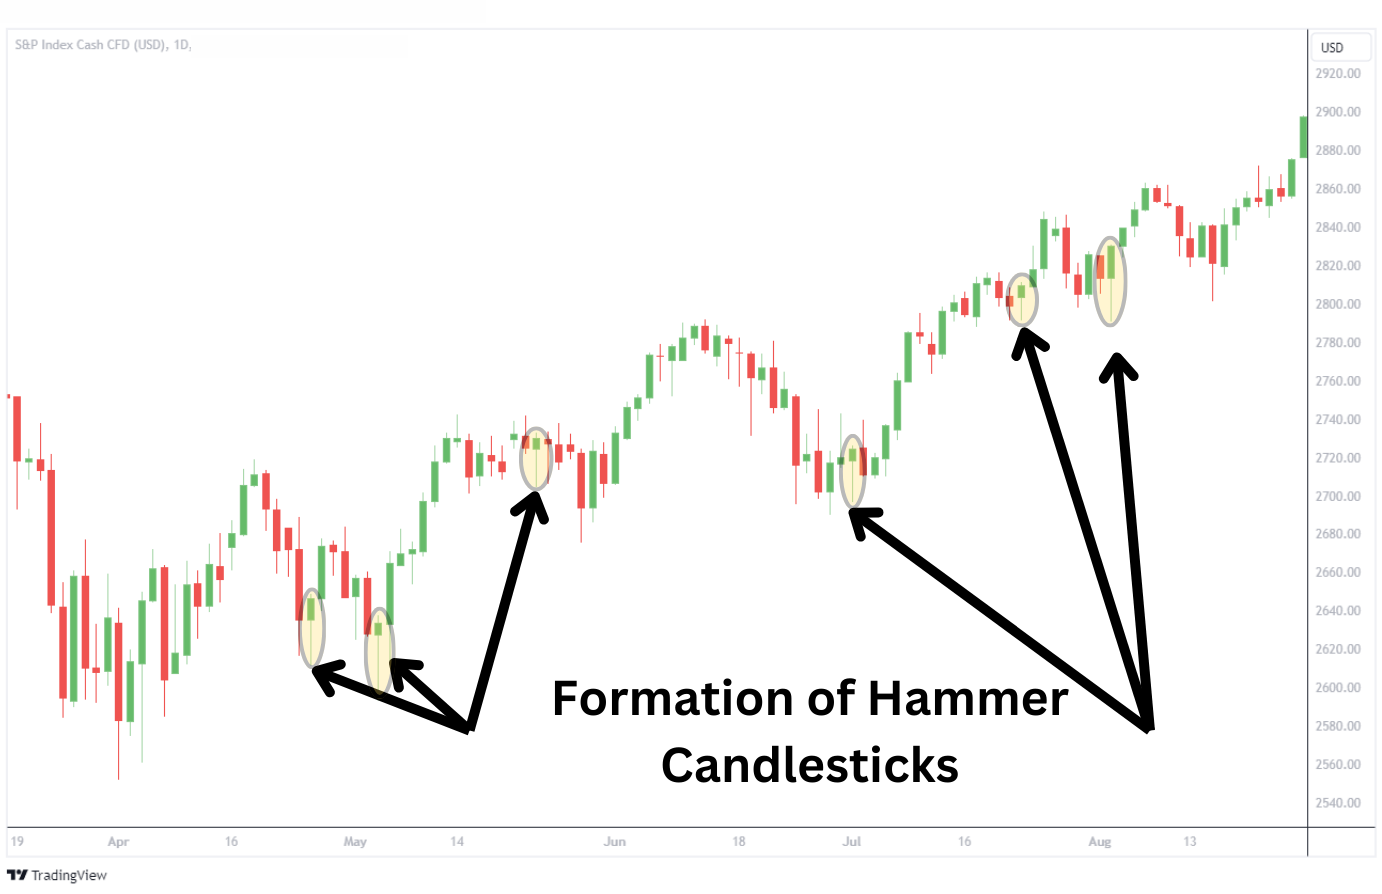
Here, we see multiple formations of hammer candlesticks, after a sustained downtrend of 4-10 days. These hammers end up being great reversal signals, resulting in a subsequent move to the upside.
Hammer Candlestick Trading Strategies
The hammer candlestick provides extra clarity as to when to expect a bullish price reversal. Depending on your trading style and preferences, there are many ways to work this pattern into your strategies.
Let’s get into it.

One effective strategy would be to combine the hammer candle with another strong confirmation candle. The GBPUSD chart above shows the formation of subsequent bullish candlesticks after the hammer, which results in the bullish price reversal from a bearish trend.
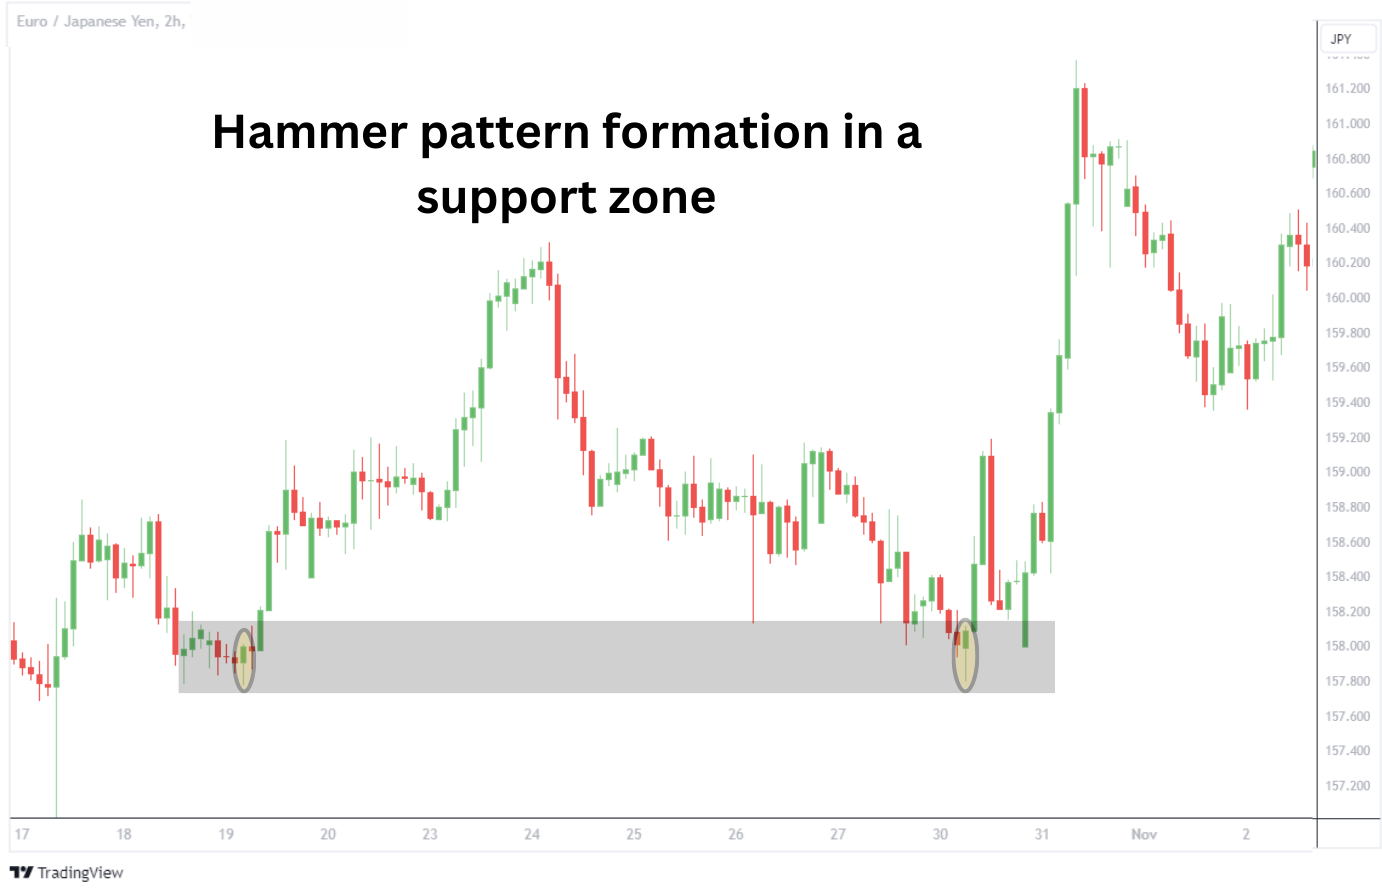
Look for the hammer pattern to form near key support levels such as horizontal support, sloped trendlines, or moving averages. When occurring near support zones, the doji candlestick becomes an indication for a bullish reversal.
Advantage of Hammer Candlesticks
Here are some advantages of the hammer that make it a reliable trading tool for traders.
1) Visually Distinct: The “hammer” looking shape with a small body and long lower shadow is unique. The fact that the hammer is a single candlestick pattern makes it easily noticeable.
2) Popularity: This candlestick pattern tends to appear frequently in the price charts regardless of the market conditions. This make the hammer candlestick formation a popular indication traders look for across different timeframes and strategies.
3) Versatility: The hammer candle applies to all financial instruments like stocks, commodities, currencies, and cryptocurrencies. It appears in all timeframes but is more influential in larger ones. This pattern supports various trading strategies, from intraday to swing trading.
Disadvantage of Hammer Candlesticks
Though popular, trading the hammer candlestick by itself carries some risks. Some key disadvantages are as follows:
1) False Signal: Though reliable, the hammer candlestick can provide false signals for a bullish reversal. This can be somewhat mitigated by waiting for a subsequent bullish candle (After the hammer) to confirm the reversal.
2) Extra validation: Waiting for the next bullish confirmation candle may result in entering the trade at a higher price. The delay comes with the possibility that the market might already be trending upward, giving you a poorer entry.
3) Limited Power: The reversal may not be as strong as anticipated due to the volatility of the markets. To combat this, set conservative take profit targets, placed before your ultimate reversal target. However, this comes at the cost of potentially missing out larger profits.
When to Take Profit for the Hammer Candlestick Pattern
Generally, the take profit level of the hammer candlestick is placed on the nearest resistance using the same time frame that the pattern formed. However, there are a couple of ways to further refine that strategy.
Let’s explore two take-profit strategies below.
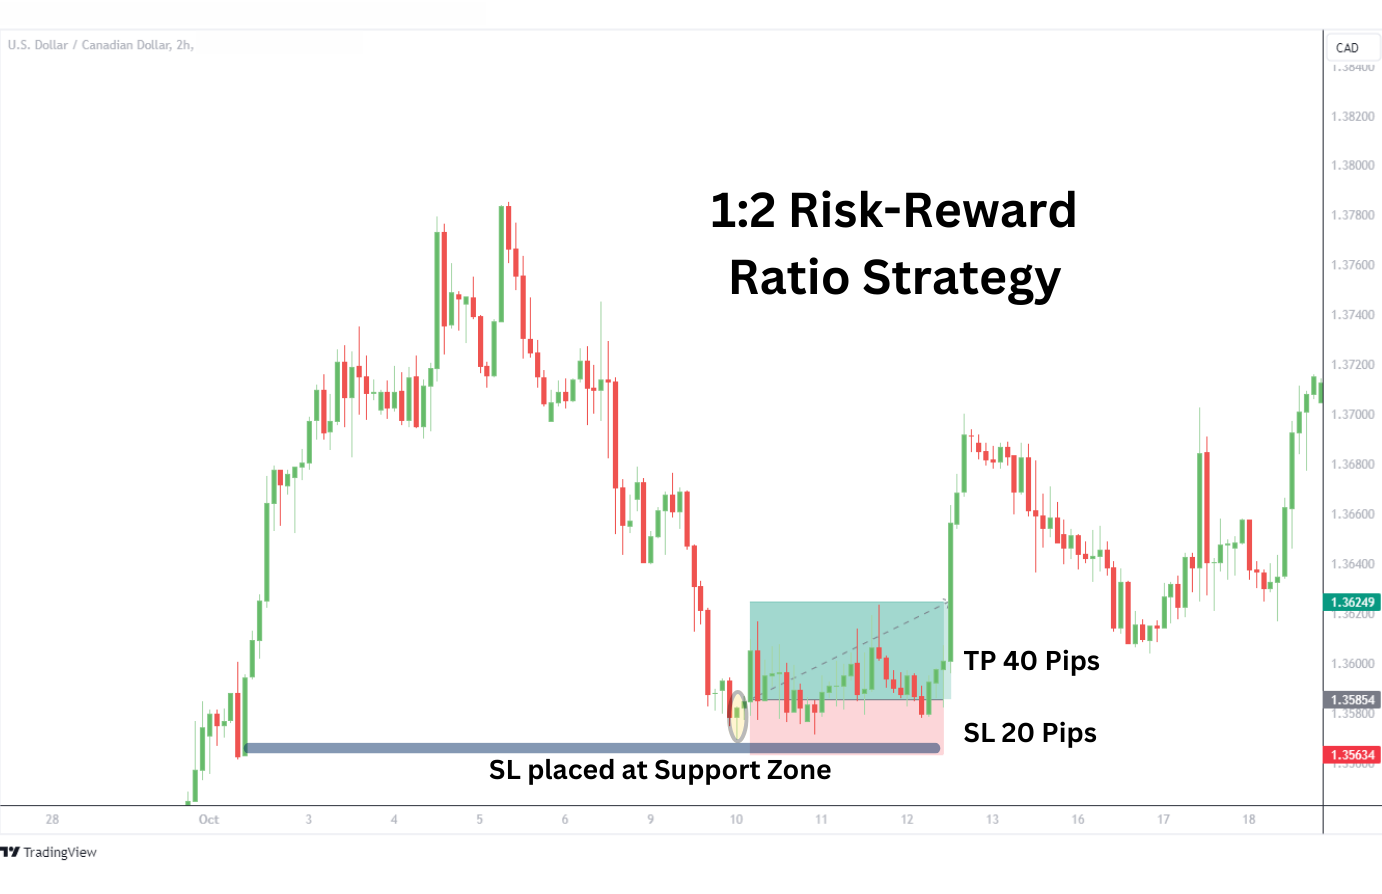
Strategy 1: 1-to-2 Risk-to-Reward Ratio
This is a common risk management strategy that is practiced by traders where the profit target of the trade is set as twice the distance of the stop loss.
For example, the chart below is a USDCAD trade after the formation of hammer indicating a bullish reversal candlestick. The take profit was set for 40 pips with a 20 pip stop loss yielding a 1-to-2 risk-to-reward ratio.
Strategy 2: Two-Lots
The idea of the two-lot strategy is to divide your position size in half. One-half of the position will have a reasonable profit target, while the second half of the position is allowed a larger profit level or even to dynamically trail in case a large trend develops.
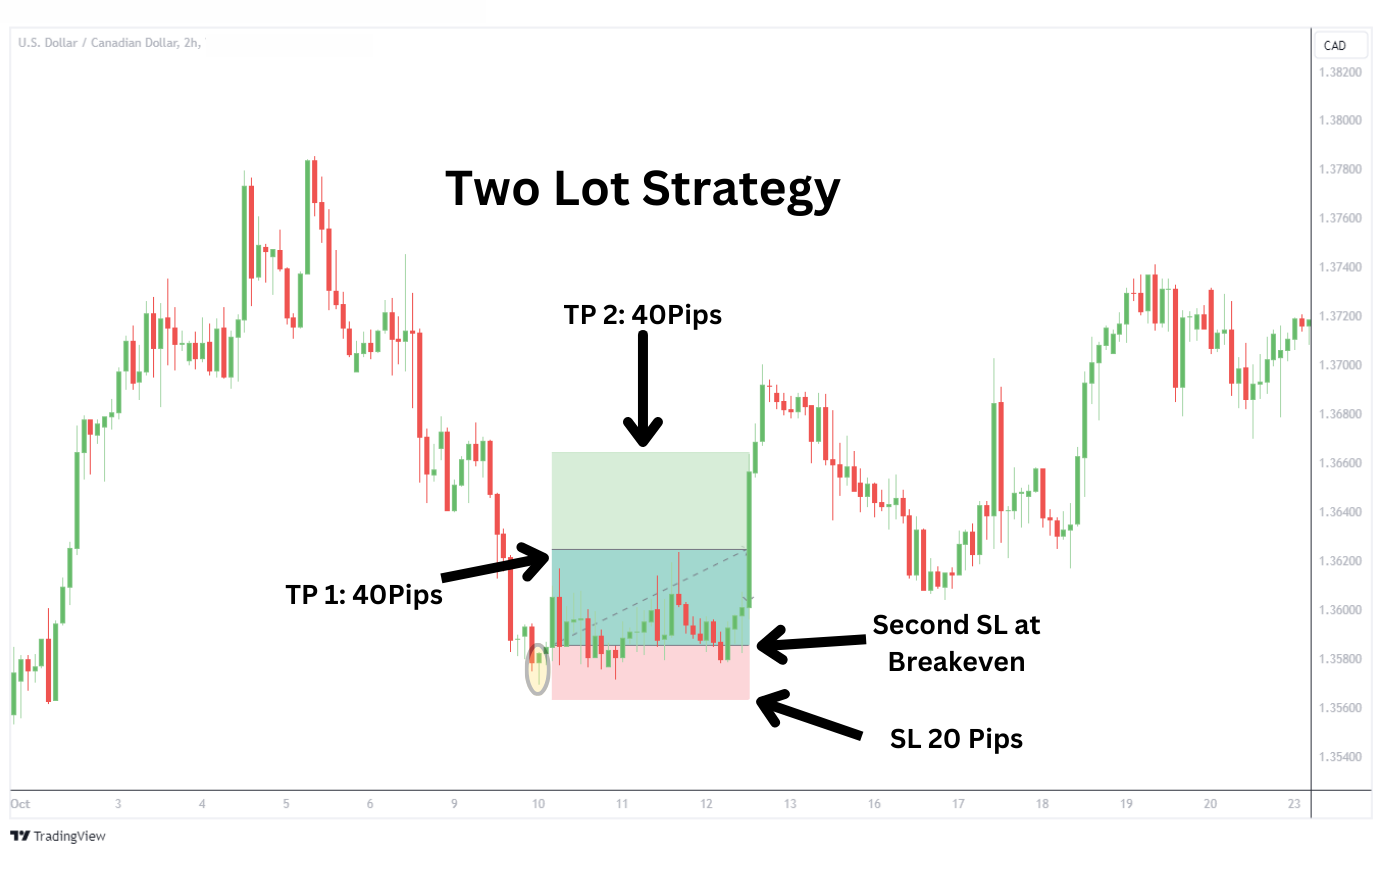
Let’s look at the chart USDCAD above. This is the same chart as the previous strategy.
For this strategy, set the first profit target to a reasonable ratio, such as 1:2, and close the first lot when the profit target hits (TP1). The second lot is allowed to extend for more profits (TP2) with the condition that the stop loss level is moved to breakeven to lock in profit overall for the two lots.
Protecting Your Trade With A Stop-Loss Placement
A stop-loss order should be placed below the hammer’s low. The strategy behind this placement is to minimise the losses incurred when the market moves against your expectations. Let’s consider some factors when applying stop-loss:
1) Volatility: A wider stop loss should be placed during volatile market conditions, such as before a major economic event, to avoid being stopped by fluctuations.
2) Risk Tolerance: You can set the stop loss according to your own risk tolerance. For most traders, this would be at a price level that would risk only 2% of their account balance.
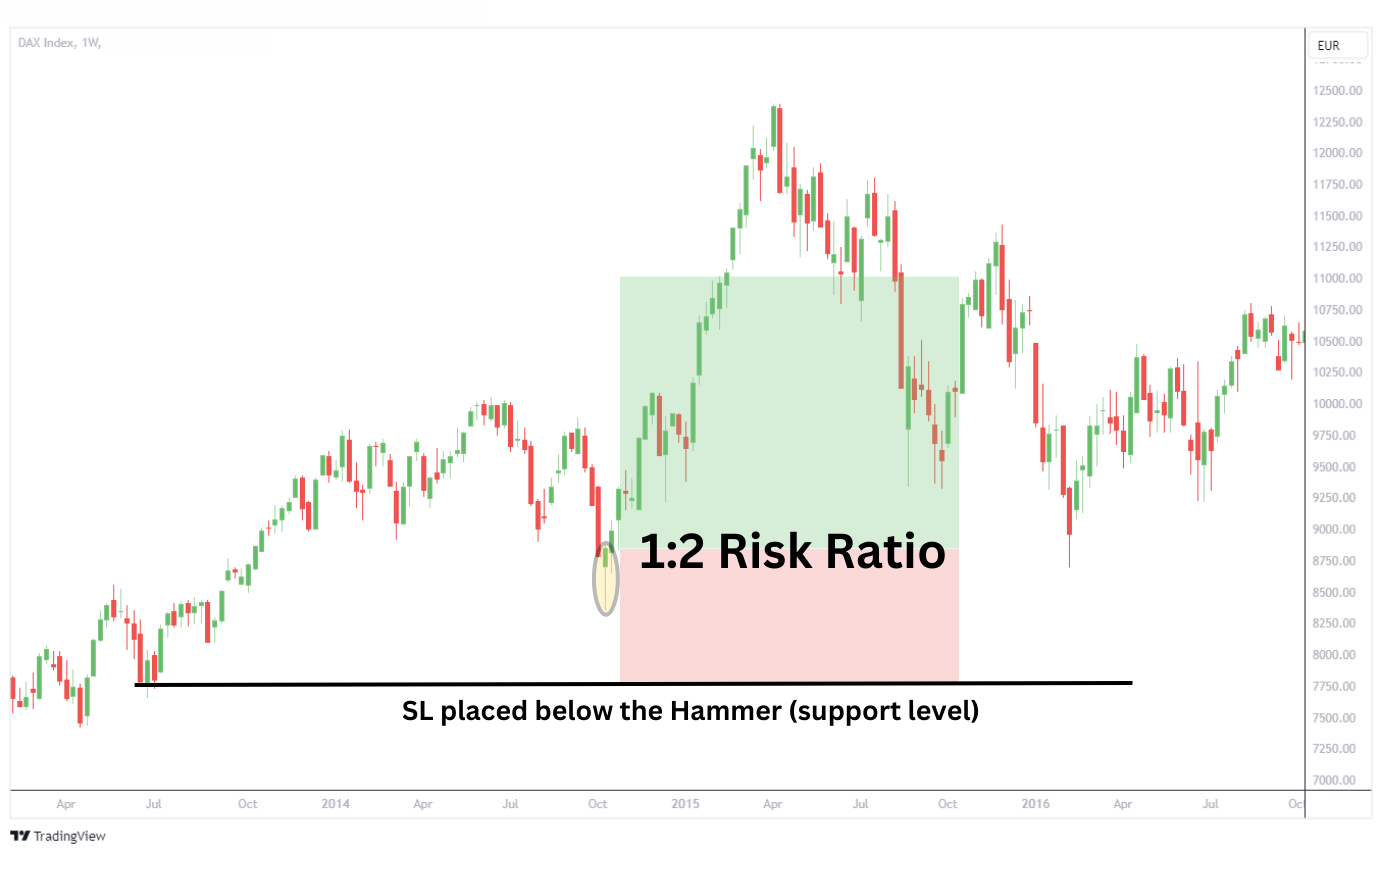
3) Technical Levels: Consider placing a stop loss below technical levels near the hammer, such as below the hammer candlestick, pivot points, or support levels. The example of the DAX Index below demonstrates setting a stop loss (SL) below the hammer and below the technical support of 8500 to protect our trade.
What is The Difference Between A Hammer Candlestick And A Shooting Star?
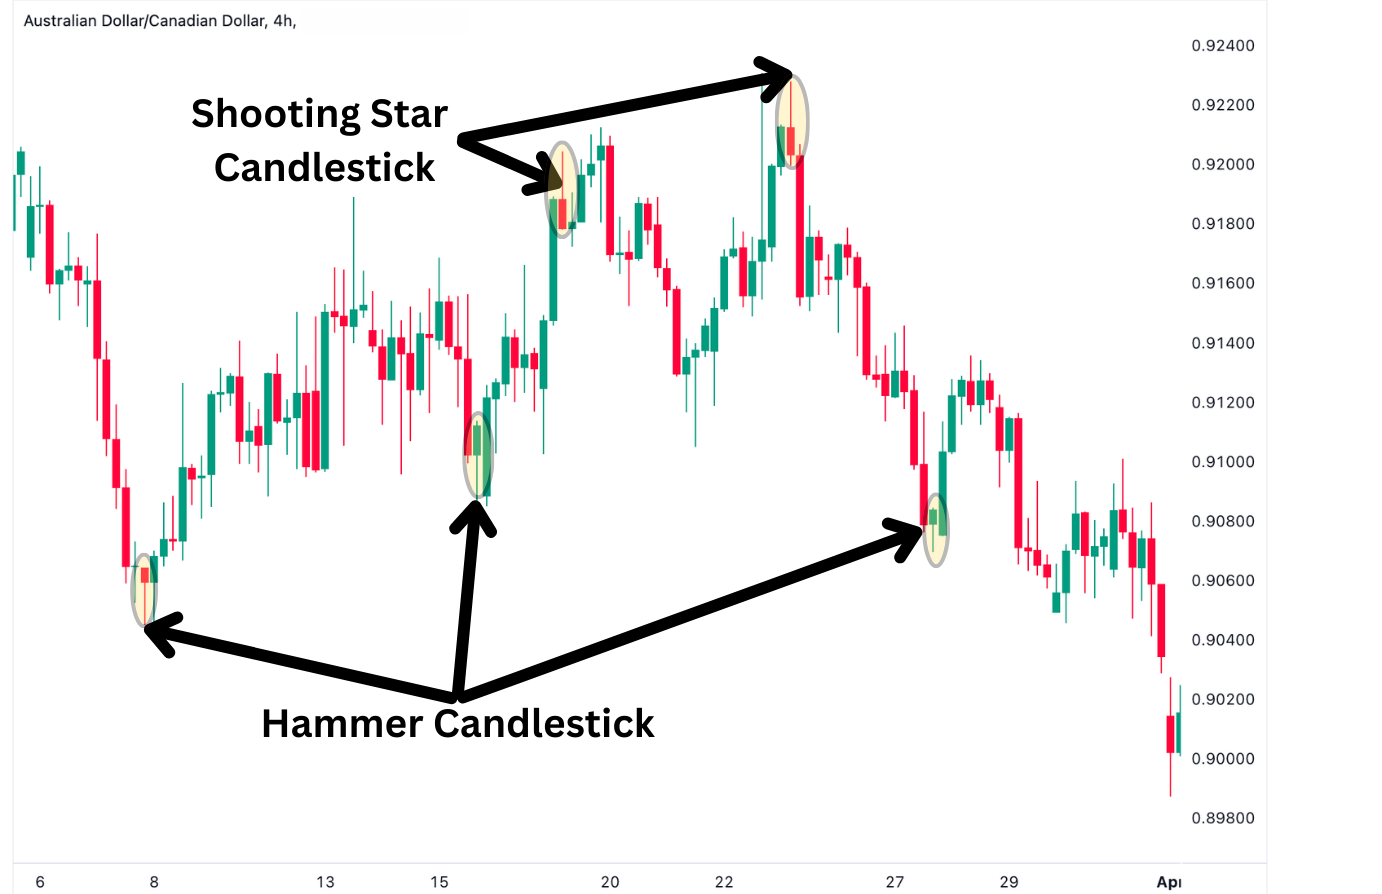
The hammer candlestick and shooting star patterns have a similar look but with a couple of very distinct features that differentiate them. The shooting star consists of a long upper shadow, a short body, and little or no lower shadow, which is similar to the inverted hammer pattern.
The shooting star pattern occurs at the end of an uptrend, hinting at the possibility of a bearish reversal as opposed to the hammer candlestick, which forms at the end of a bearish trend and suggests a bullish reversal. Both patterns involve the struggle between buyers and sellers in which the shooting star indicates that sellers are in control after initial buying spree.
The example above on the AUDCAD chart clearly shows effective formations of hammers at the end of a downtrend and shooting stars near the end of an uptrend. Both patterns indicate potential trend reversals.
The Difference Between a Hammer Candlestick And A Doji
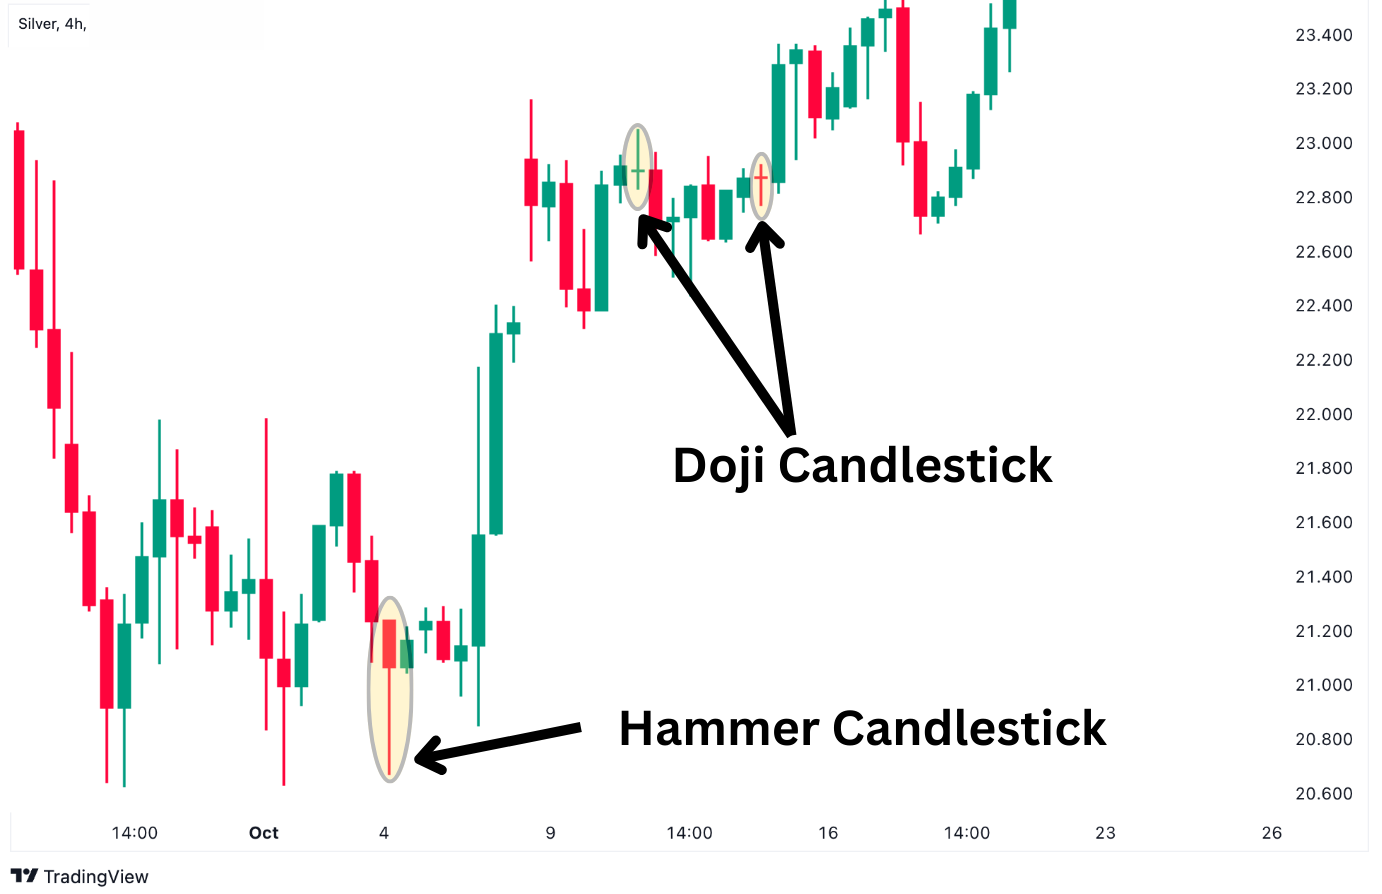
A hammer and a doji have unique shapes that make them easy to spot, even in a series of chart patterns. First, the simple visual differences – the hammer looks like a hammer while the doji looks like a cross. Beyond that, hammers only appears at the bottom of a downtrend, while dojis can appear anywhere in a chart.
The shadows of these patterns also have visual differences. Doji candles have shadows often of similar length visible on both the top and bottom. The hammer, on the other hand, simply has a long lower shadow with little or no upper shadow.
A doji represents indecision in the market, where both buyers and sellers try to gain strength and fail. The formation of a doji can indicate price moving either way, depending on the market structure and price action, unlike the hammer.
In the silver chart example above, there is a formation of hammer near the end of the bearish move, and prices rally shortly thereafter. However, the doji forms during a sideway range and prices do not make major movements due to indecision.
Hammer Vs Inverted Hammer Candlestick
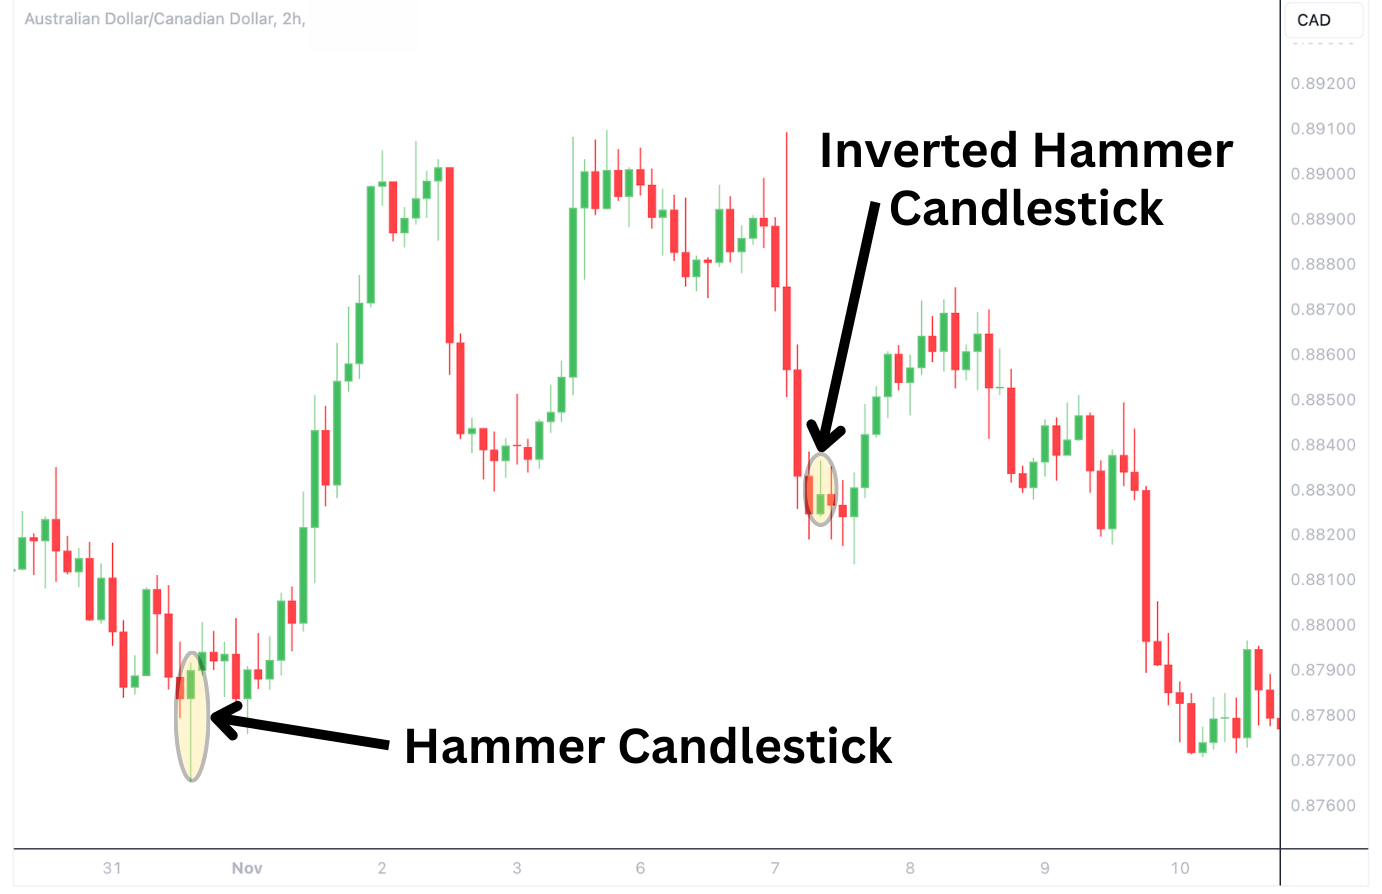
The inverted hammer is, just as the name suggests, an upside-down image of the hammer.
On a price chart, the inverted hammer consists of a small body at the bottom with a long wick extending upwards. On the other hand, the hammer is the exact opposite with a small body at the top and a long wick shooting downwards.
Even though the inverted hammer is the opposite shape of a hammer, the results of the inverted hammer are similar to the hammer. Both patterns, when found after a downtrend, suggest a bullish reversal. The example above on the EURUSD chart shows how prices start rising after the formation of hammer and the inverted hammer candlestick during a downtrend.
Hammer vs. Hanging Man
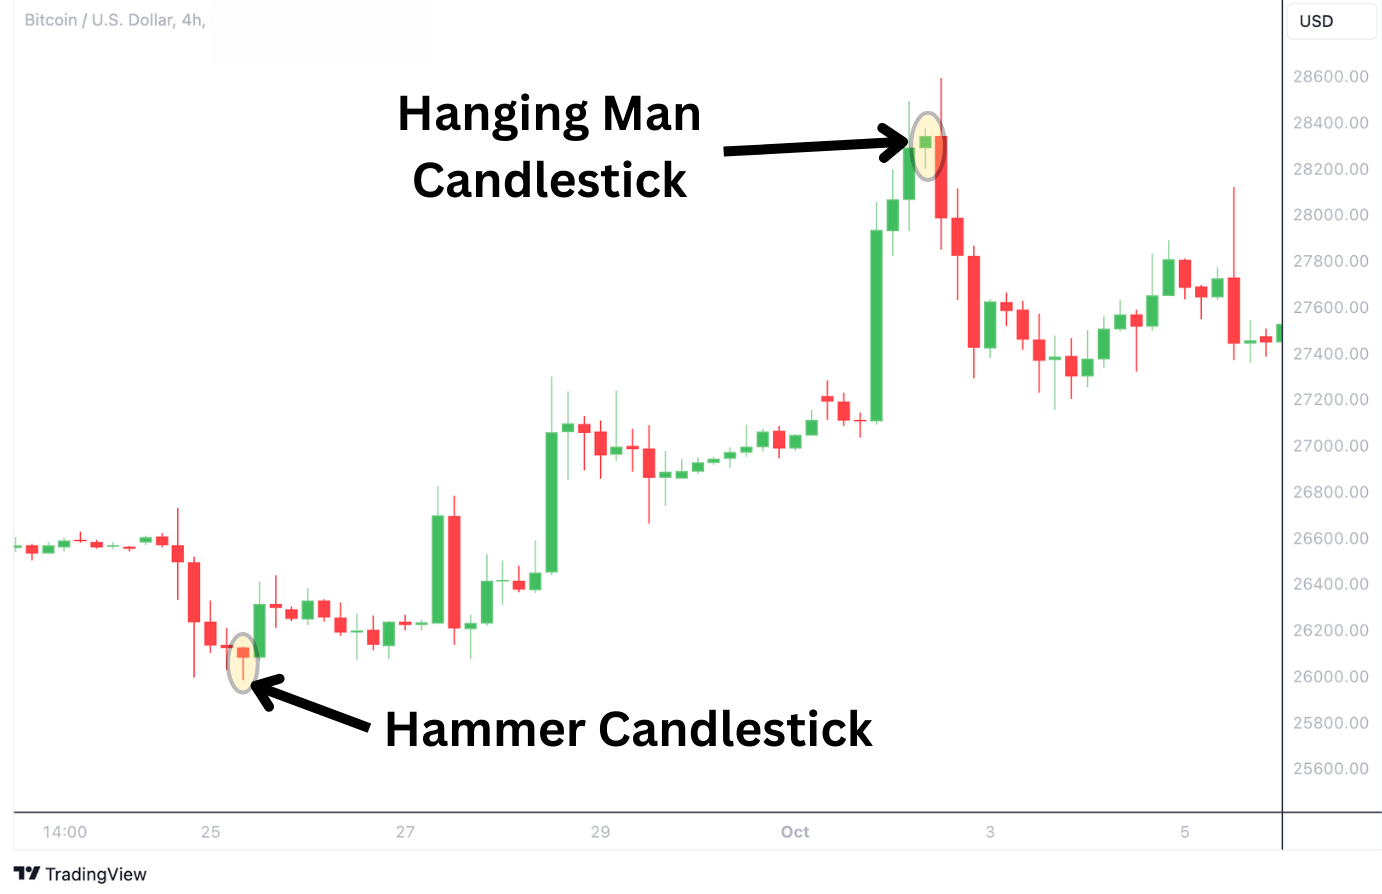
The hammer and hanging man both have similar features: a small body at the top and a long lower wick. Although both these patterns come with similar structures, traders should take note of where they form relative to the larger trend as they can hint at price reversal in opposite directions.
A hanging man appears at the top of an uptrend, whilst a hammer appears at the end of a downtrend. It is present when the buyers lose momentum and the sellers take over indicating a potential bearish reversal. In contrast, hammer formation can signal a bullish signal.
In the Bitcoin chart above, the formation of the hammer caused the price to push higher, while the formation of the hanging man pressed the price to a bearish correction.
FAQ
How often does the hammer candlestick appear?
The hammer candlestick is a relatively common occurrence in financial markets. This pattern can form across various chart time frames, from 5-minute bars to longer durations like quarterly or yearly bars. Hammers can be found in all types of financial markets.
Is the hammer candlestick bullish?
Yes, the hammer candlestick is considered a bullish pattern, but only when it is spotted at the end of a downtrend.
What are some common hammer mistakes to watch out for?
Undoubtedly, the hammer pattern presents a good trading opportunity. However, traders should be aware of some common mistakes to watch out for:
- Misidentification of Patterns: Traders sometimes get confused between similar-looking candlesticks like the inverted hammer, hanging man, spinning tops, or doji thus, leading lead to wrong trading decisions.
- Trading Without Confirmation: Most traders fail to wait for additional confirmation candle or signals after spotting a hammer.
- Impatient Trading: Traders execute trades based on a hammer pattern that hasn’t fully formed which may result in misjudging the market sentiment.
What are other types of candlestick patterns traders also use?
The most popular Japanese candlestick reversal patterns that traders use include bullish and bearish engulfing, shooting star, inverted hammer, and hanging man. These patterns are especially useful if they appear near their appropriate support or resistance level.
What is the psychology behind the hammer candlestick pattern?
The hammer is at the tail end of a bearish trend when bears quickly push prices lower. Within the same candle, the buyers take control and the price rallies to close near the opening of the candlestick time frame drafting a long wick to the downside. The shift from sellers to buyers signals a shift in trend sentiment.


