


Written by:

Reviewed by:

Bullish
- April 7, 2025
- 25 min read
Double Bottom Pattern Explained with Examples
The double bottom is a well-loved and recognised pattern in technical analysis. Its use not only permeates to CFD trading, but also finds a home in traditional investing as it can signal the start of a major bullish rally. Find out how to spot and trade this pattern today!
Key Takeaways
- Double Bottom patterns are bullish reversal patterns, signalling the potential for a new uptrend.
- Divergence indicators such as the RSI, MACD, and ATR are incredibly useful for confirming the double bottom.
- The typical risk-to-reward for a double bottom is 1:1, but can be tweaked to be at least 1:2 with the right adjustments.
What is a Double Bottom Pattern?
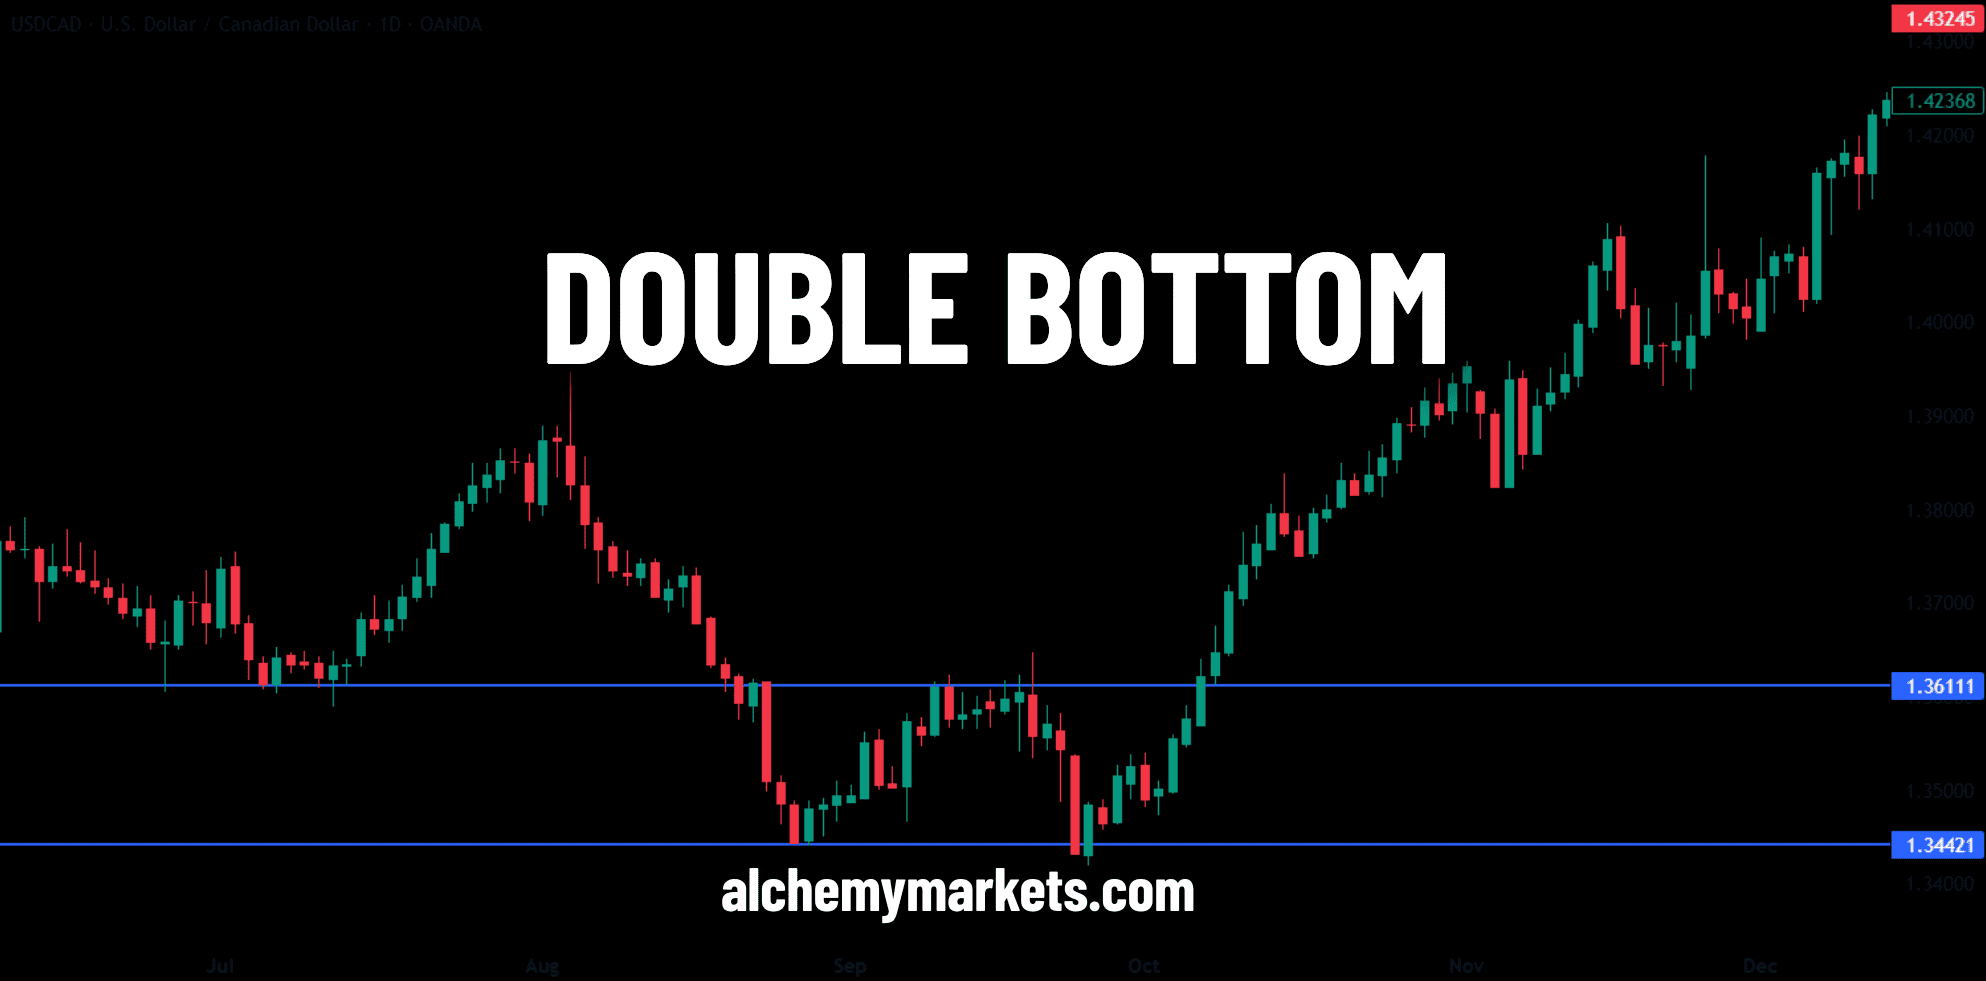
The double bottom is a reversal chart pattern used by technical traders to spot potential bullish reversals when two lows form near the same price level. The pattern can be found in forex, stocks, gold, crypto and a variety of other markets. It can be found on any asset and any timeframe, making it a universal pattern.
The pattern occurs when the price moves lower twice, but is unable to break any further below. This inability to break lower highlights the significance of the previous low as a support level, indicating where buying pressure may emerge after a downtrend. This hints at the end of a bearish trend and the potential beginning of a new rally. When this occurs, traders are alerted to the possibility of initiating a long position to profit from upside movement.
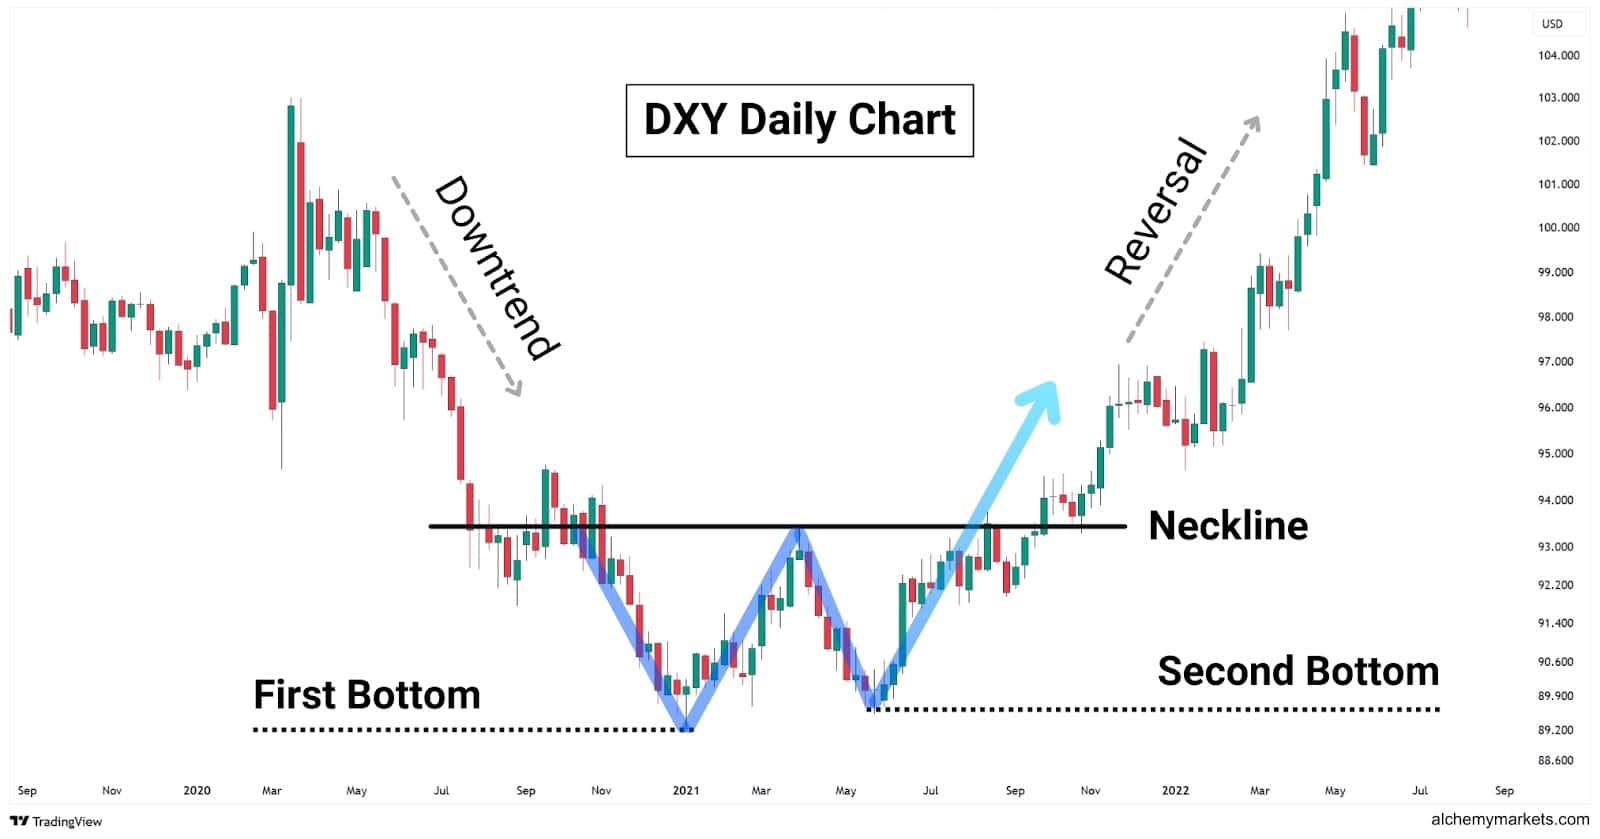
Alternatively, traders can use the double bottom reversal chart pattern on non-tradeable indices, such as the DXY—the Dollar Strength Index—to gauge the strength of relevant markets. For example, if the DXY is showing a double bottom pattern, it means that the US Dollar may be gaining strength. This alerts us to the possibility of buying the US dollar against other currencies like EUR (EUR versus the US dollar).
The double bottom is one of several bottom reversal patterns such as the inverse head and shoulders, triple bottom, and cup with handle. As the name implies a bottom reversal pattern is a formation that suggests the market has bottomed and is ready to rally.
How to Identify the Double Bottom Pattern?
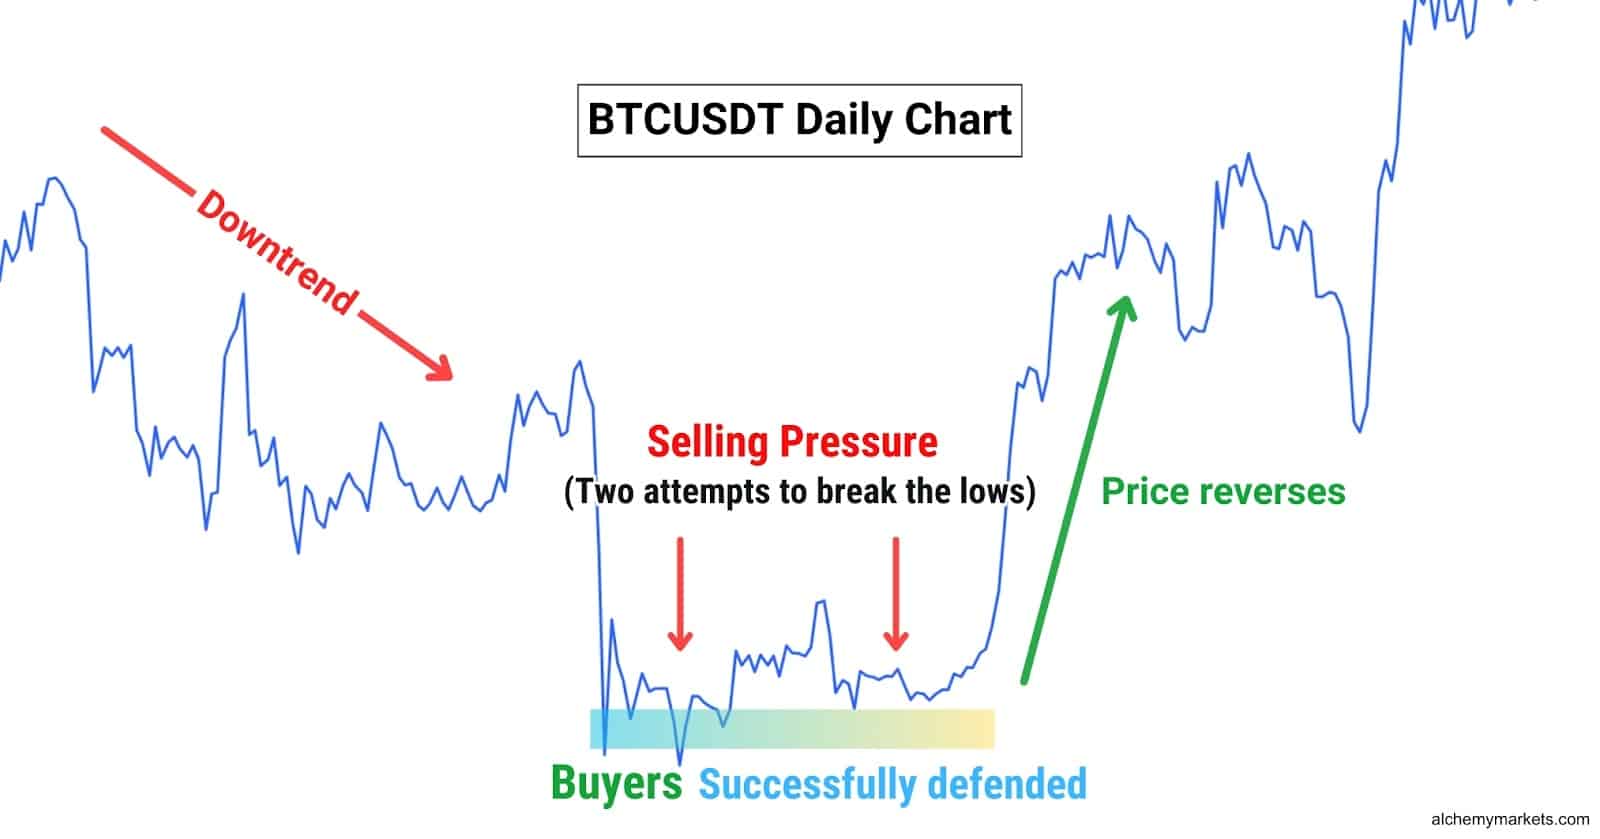
The double bottom reversal pattern appears as a “W” at the lows after a downtrend. The market will move lower in a bearish trend due to strong selling pressure twice to roughly the same price area, only to fail in breaking lower, then reverse to the upside.
To identify a double bottom, start by looking for the pattern after selling pressure drives the price down to support levels such as horizontal or a support trend line. When the price bounces heavily from the first low, the potential for a double bottom to signal the end of a bearish trend increases.
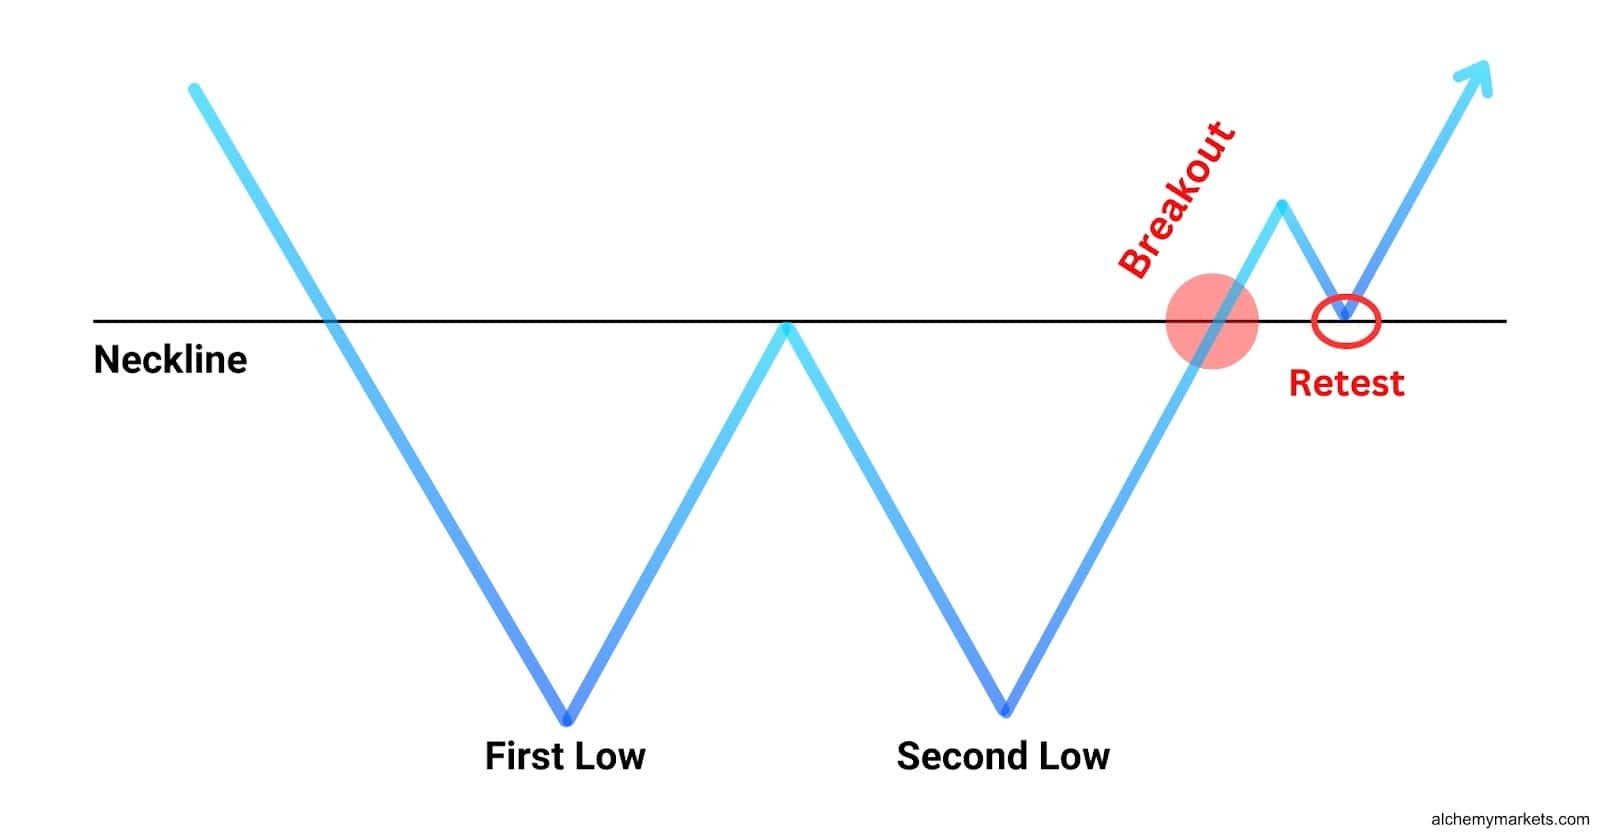
Take note of where the price pauses after the initial bounce: this will serve as the neckline (confirmation line) of the pattern. Once the second low forms, if the price revisits and breaks above the confirmation line, the double bottom pattern is confirmed creating a buying opportunity.
Is The Double Bottom a Reversal Pattern?
The double bottom is considered a bullish trend reversal pattern. The scale of its reversal depends on the price range of the double bottom. If a double bottom pattern has the price range of $400, then the breakout is expected to also move $400. This rough estimation is called the measured move target, and helps traders set clear take profit levels.
Key Characteristics of the Double Bottom Pattern
A double bottom pattern looks like a ‘W’, which has two significant lows, a midpoint, and a neckline—a horizontal area defined by the midpoint’s height. A true double bottom is confirmed and a buying opportunity is created when prices rise above the highest point of the formation. Keep in mind that the confirmation line is technically resistance, until it is broken to the upside.
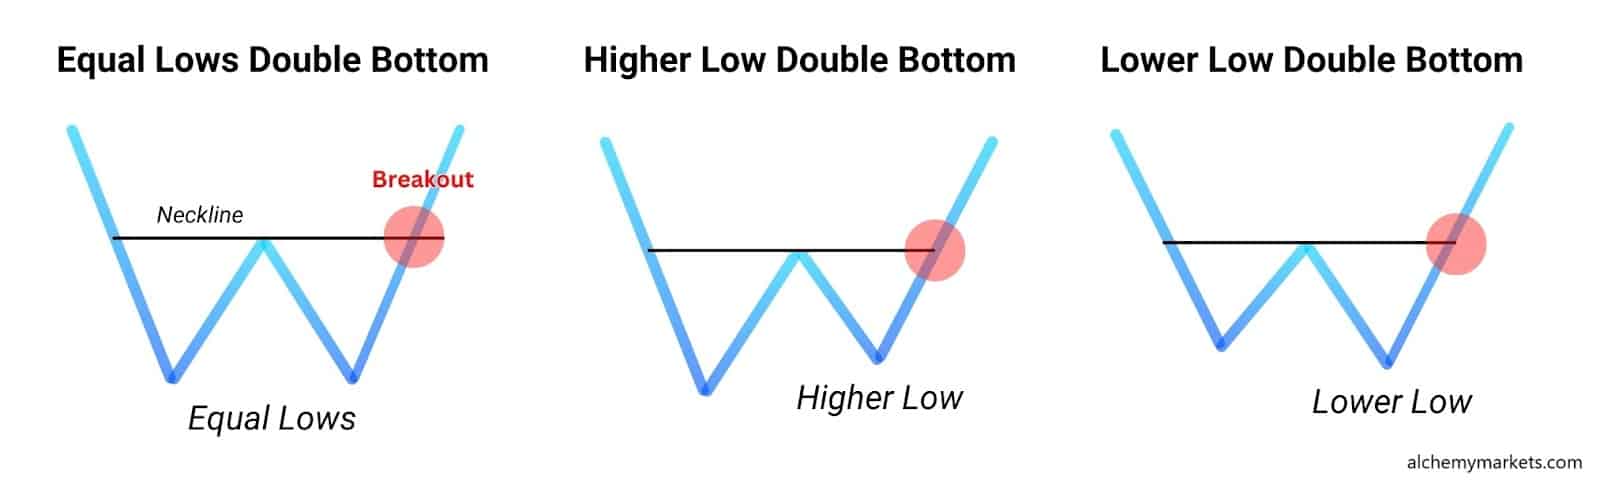
The lows should appear at similar price zones, however, deviations can sometimes occur. This often leads to imperfect double bottoms, where the two lows are clearly not at equal height:
The Equal Lows, Classic Double Bottom
Equal lows double bottoms occur when the second low appears near the same price level as the previous low at similar price levels, creating a classic ‘W’ shape pattern. This pattern signals a potential reversal, especially if accompanied by increased volume at the breakout.
The Unequal Lows Double Bottom
Unequal lows double bottoms form when one low is lower than the other, creating an asymmetrical ‘W’ shape. This could be the second low forming below the previous low or the second low reversing above the previous low. These patterns are considered stronger reversal signals, as they often indicate a liquidity grab before the trend reverses upward.
What Does a Double Bottom Tell You?
A double bottom tells us that sellers have made two failed attempts to push prices lower. This signals two things: potential exhaustion from bears (sellers), and the presence of strong buyers (bulls) in the market. These factors, combined, help the buyers overwhelm the sellers and leads to a reversal of the downtrend.
Think of it like a football game. The opposing team charges in twice, trying to score, but our goalkeeper blocks both shots. Momentarily exhausted, they start falling back. This is where our team seizes the moment, and drives forward to score a goal.
Importance of Double Bottom Pattern
A double bottom can be a powerful entry or exit signal, depending on a traders’ current active trades. If a trader is sitting in a profitable short position (sell), they may consider exiting the position if a double bottom forms. Conversely, traders can also look to open longs, as soon as the double bottom breaks above the neckline. Recognizing recurring patterns like the double bottom can assist traders in their strategies as it can predict future price movements.
That being said, not all double bottom patterns are created equal. Some lead to powerful reversals, while others barely move the market. The difference comes down to timeframe, context, and the broader trend.
- Timeframe – Higher timeframes (daily, weekly) are more reliable, while lower timeframes (5-min) are choppier.
- Context – Stronger if formed at key support (e.g., previous all-time high) and reinforced by confluences like RSI divergence, Fibonacci retracement levels, or trendlines.
- Broader Trend – More effective during the pullbacks of a broader uptrend. This leads to cleaner breakouts.
The strongest double bottoms check all three boxes: higher timeframe, strong support, and trend alignment. This gives the signal more weight, and the best shot at delivering a powerful reversal.
Double Bottom Pattern Example
In this EUR/USD example, notice this double bottom pattern has a higher low. After breaking past the neckline at approximately $1.235, Euro-Dollar shoots up to new highs, breaking the downtrend and shifting into an uptrend.
Let’s talk about the measured move target, highlighted in purple. This is a rough estimation of how far a chart pattern’s breakout will go. Traders use this to set take profit orders, simplifying decision-making. It’s also used in trading bull flag and symmetrical triangle.
How to get Measured Move Target
- Take the distance from highest to lowest point of the double bottom.
- Then, apply that same distance to the breakout direction.
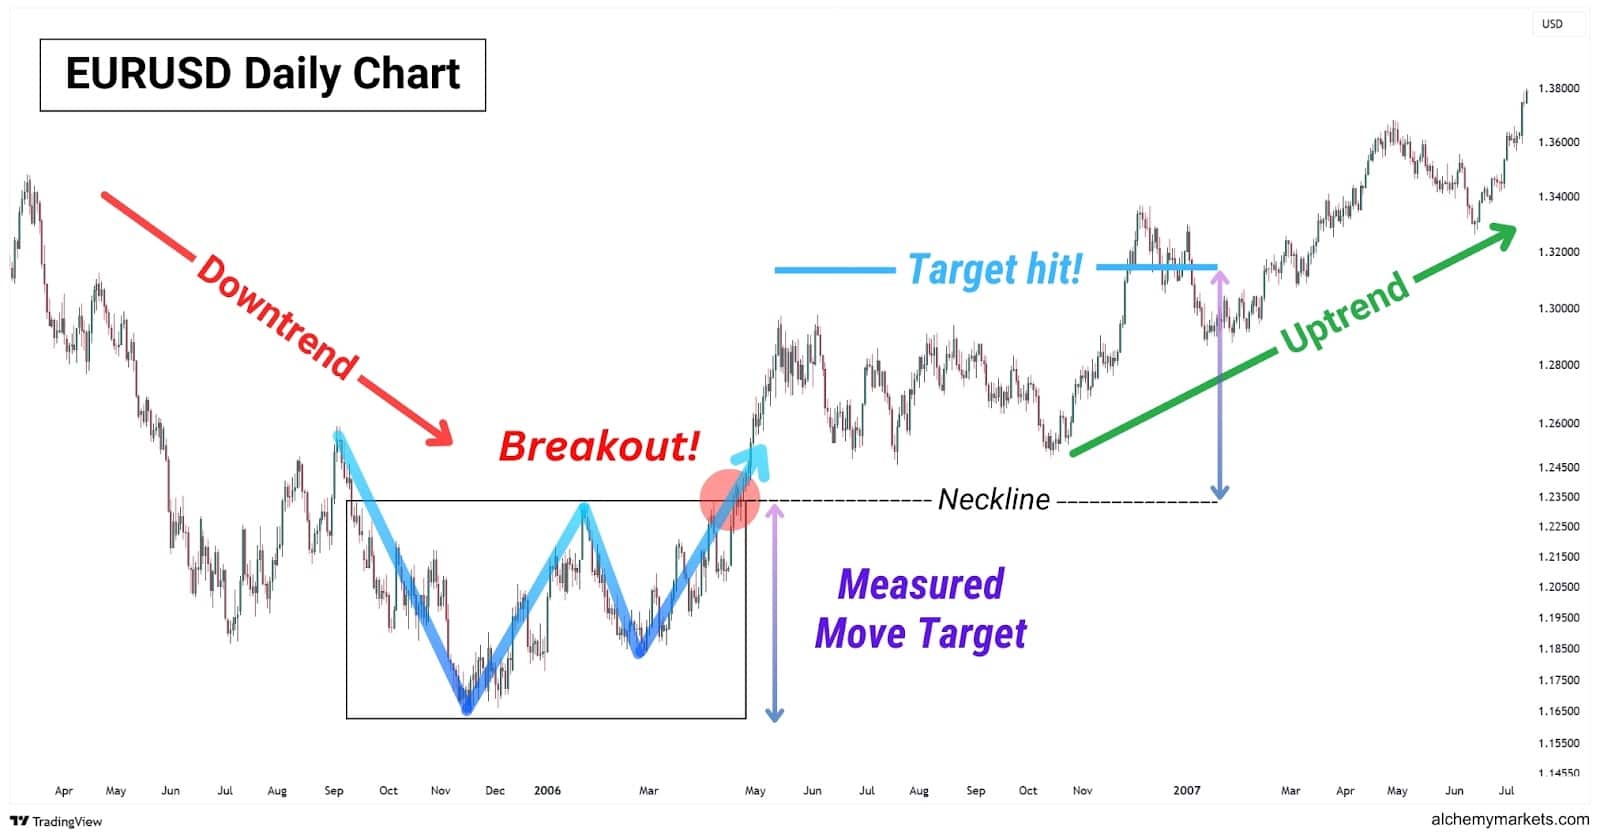
Note that measured move targets (MMT) are just rough estimations. It is not guaranteed that prices will reach the MMT, and therefore traders should also consider previous highs as alternative targets.
Where to Set Stop Loss and Take Profit
Our take profit of a double bottom should be at the measured move target. The stop loss, however, will be a little more complex.
Generically, the stop loss of a double bottom is set below the pattern. This ensures that we are not stopped out prematurely, and only exit the trade when our idea is false (double bottom has broken to the downside).
However, a glaring issue of this classic stop loss method is that our risk-to-reward ratio (RR) is usually going to be 1-to-less than 1, meaning that we risk more than we stand to earn. This is not a good standard practice for RR.
Instead, try adjusting your stop loss to the middle of the pattern range. Not only will this provide plenty of wiggle room, it leaves us with a healthier risk-to-reward ratio of 1:more-than-1.
Double Bottom Pattern Trading Strategies
Fading the Breakout
When a pattern breaks in a direction, we always need to be cautious that it is a false breakout, or fakeout. Fading the breakout refers to the act of counter trading a breakout, with the core idea that price trades in a range about 70% of the time. With that in mind, a reversal may appear at the confirmation line or near the lows of the pattern.
Fading the Breakdown Below Support
This strategy is an aggressive approach to trading double bottoms, whereby we’ll trade the second rise within the double bottom, rather than trading the bullish breakout itself. This is not the conventional way to trade a double bottom, but it offers an opportunity to get into a trade with a tighter stop loss, and higher RR.
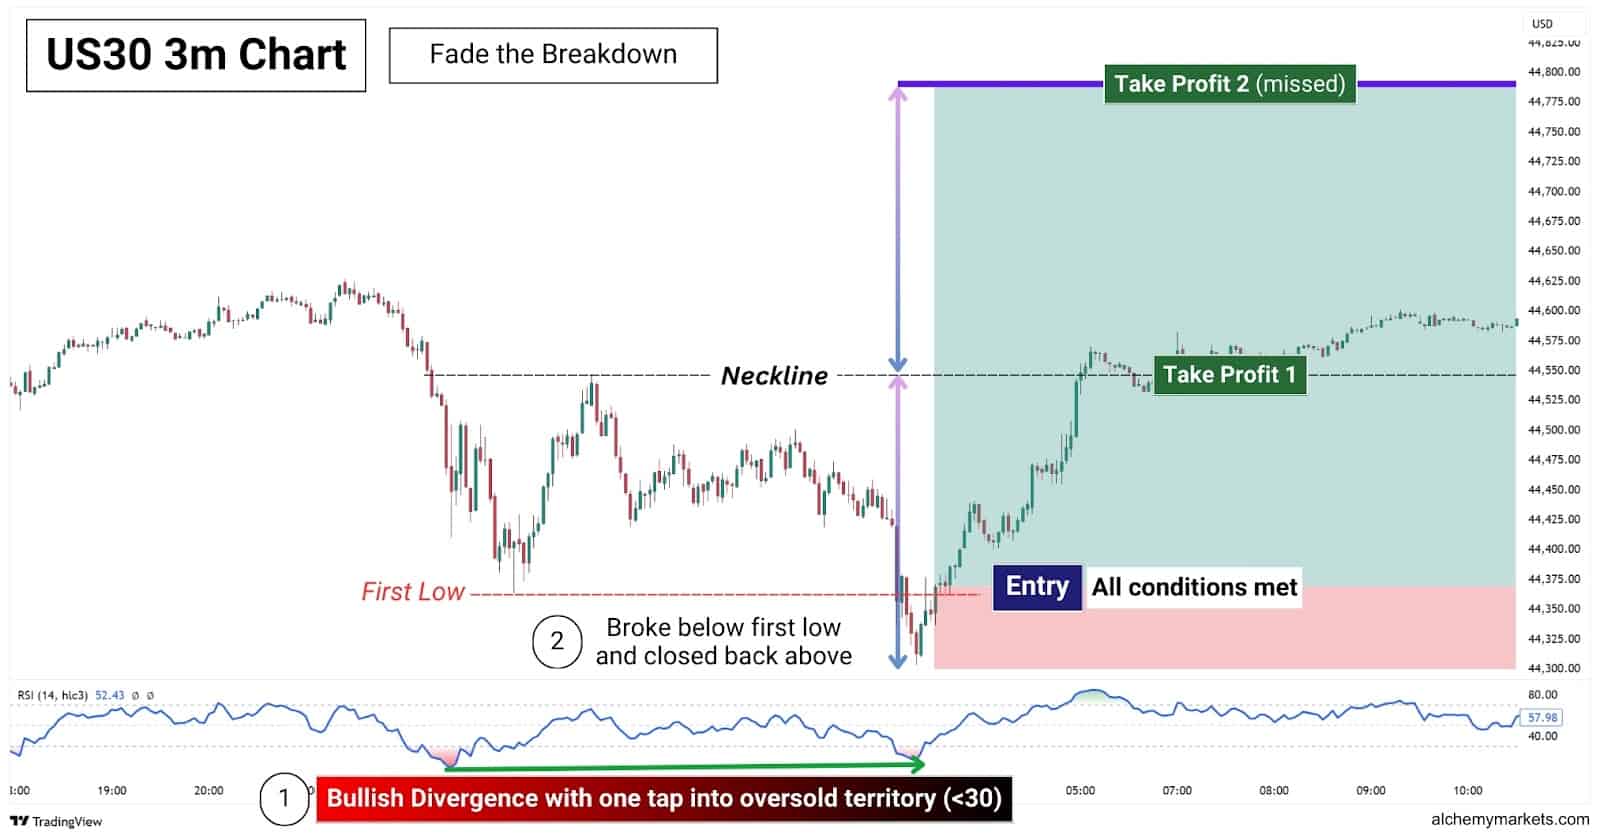
In this US30 (Dow Jones) 3-minute chart, notice how the double bottom formed a lower low. This means the first low was broken, and early buyers were stopped out of their positions. Upon reclaiming the first low’s price level with a Bullish Divergence, we’ll enter a long position targeting the neckline, then the measured move target.
Notice how in the example above, the use of two take profit targets help us protect our profits, and avoids situations where the measured move target isn’t reached. Additionally, the RSI divergence helps add more confidence to this setup.
| Indicators used | RSI indicator (14), or any other momentum indicator for spotting divergences |
| Entry Conditions | A bullish divergence, regular or hidden, forms at the second price drop.The first low or second low is accompanied by an oversold RSI signal.Once price closes back above the first low, enter a long position. |
| Take Profit (TP) | TP1: NecklineTP2: Measured Move Target |
| Stop Loss (SL) | Below the second low |
Fading the Neckline
Fading the neckline refers to anticipating a double bottom pattern to fail, unlike the previous strategy where we’re anticipating a double bottom to form. To properly ‘fade’ the neckline, we’ll need several bearish indications, such as a rejection from the neckline at the second rise, and a bearish divergence (either regular or hidden).
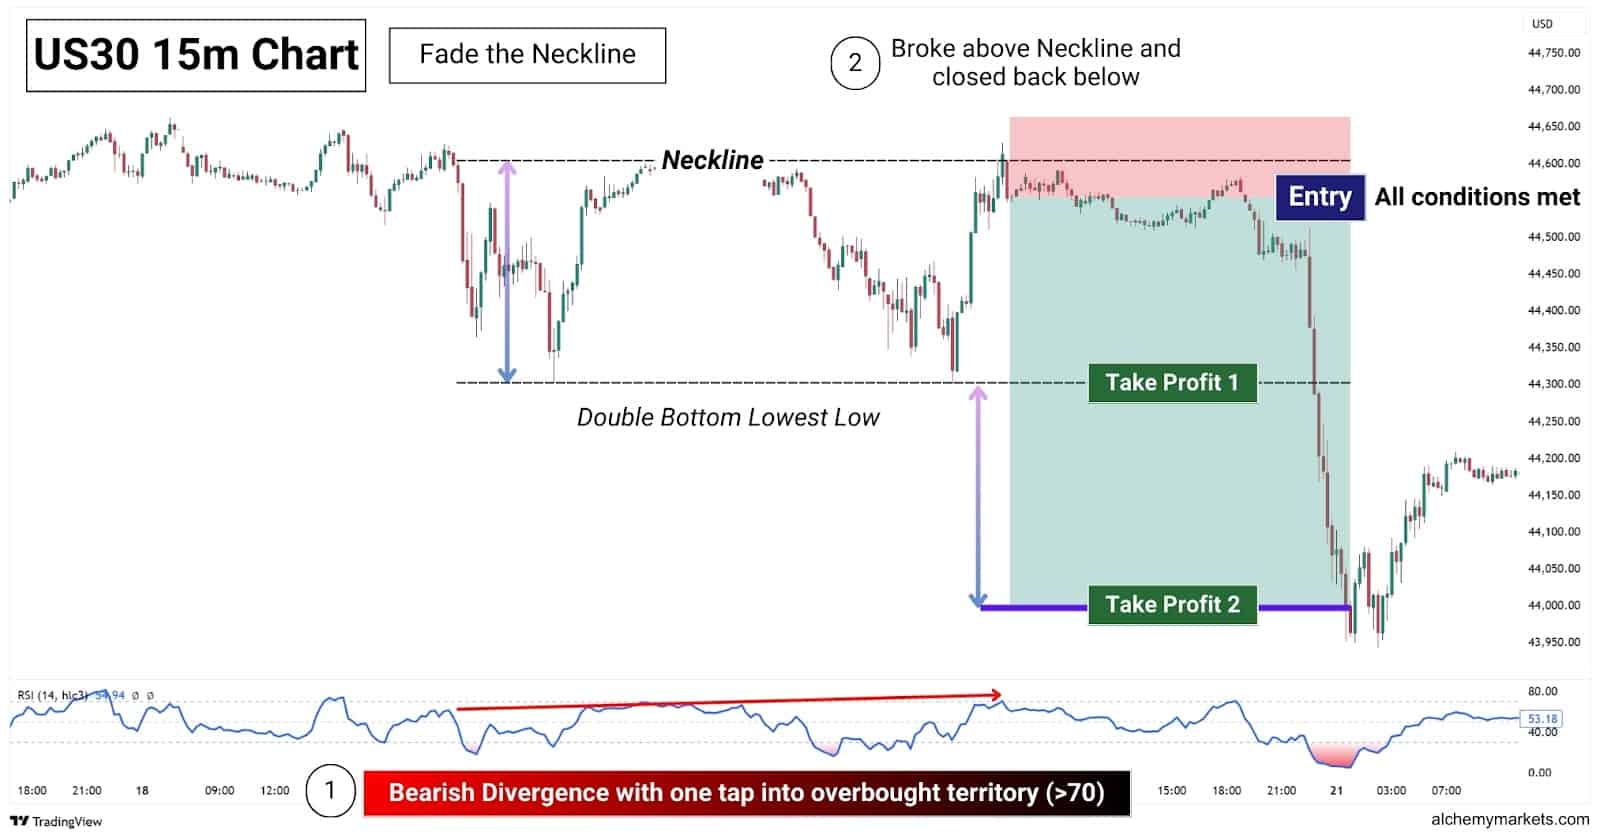
In the US30 (Dow Jones) 15-minute chart, notice how the price was rejected at the neckline, reinforcing its role as resistance until a clear breakout occurs. This rejection presents a shorting opportunity, targeting the lowest low of the double bottom.
This strategy accounts for the potential for a rejection to occur at the neckline, which would align with the prevailing downtrend. In such a scenario, we can use the lowest low, and measured move target as our downside targets.
| Indicators used | RSI indicator (14), or any other momentum indicator for spotting divergences |
| Entry Conditions | A bearish divergence occurs within the double bottom formation.The first rise or second rise is accompanied by an overbought RSI signal.Once a clear rejection occurs at the neckline, enter a short position. |
| Take Profit (TP) | TP1: Pattern’s Lowest LowTP2: Measured Move Target (Downside) |
| Stop Loss (SL) | Above the second rise’s high |
Double Bottom Pattern With RSI
Using the RSI alongside the double bottom, or other chart patterns, is a simple way to add confidence (or confluence) to your trade idea. For this strategy, we will be looking for bullish divergences with the RSI, this signals that bearish momentum is weakening, and a potential rise is on the horizon.
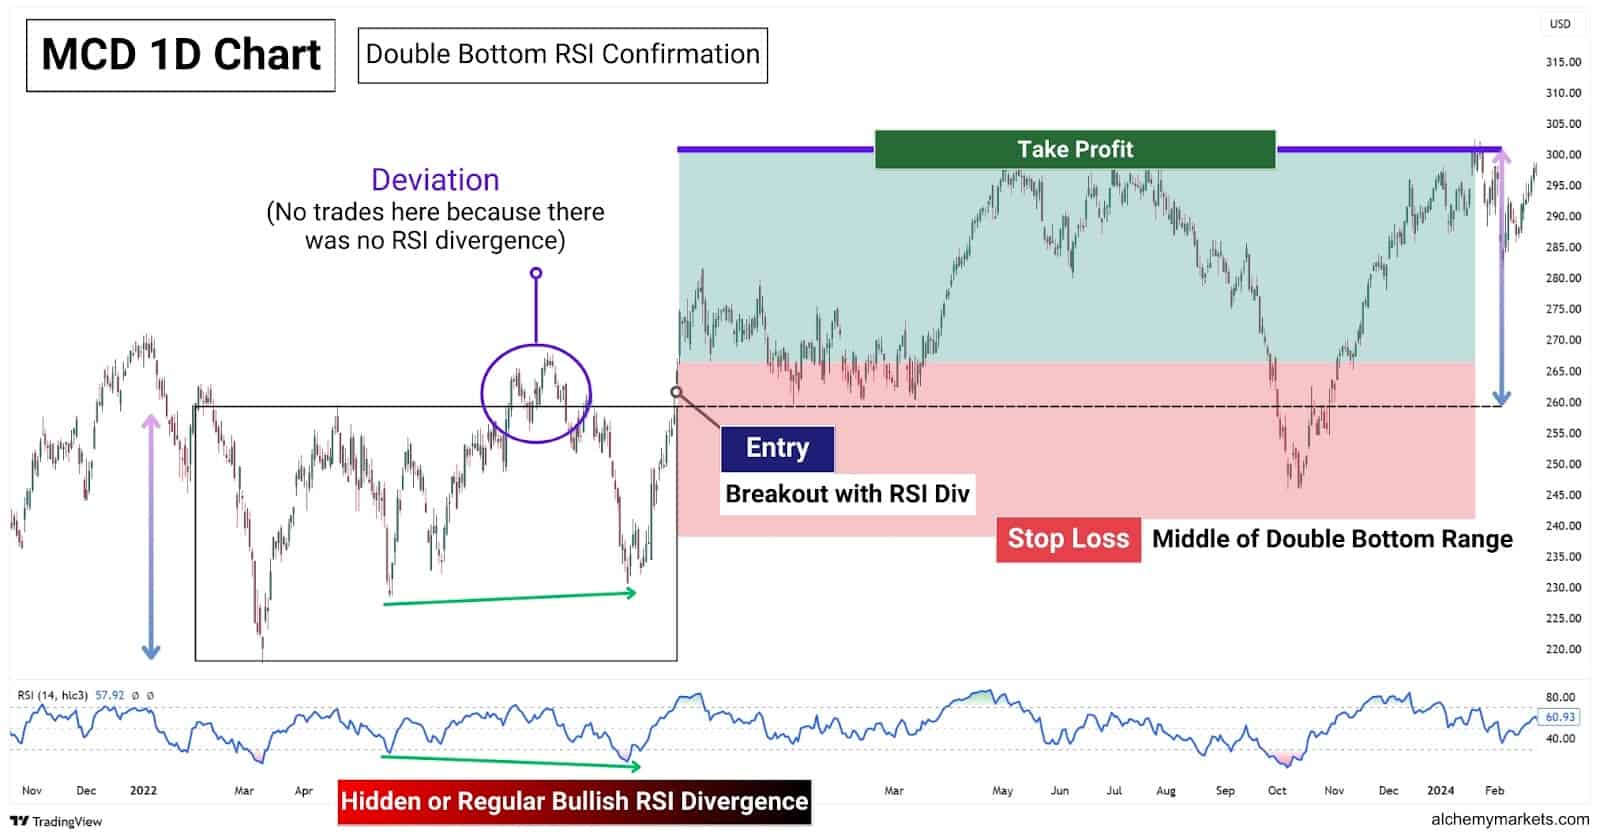
In the McDonald’s daily timeframe chart, notice how a breakout initially occurred, highlighted in purple. However, this was a weak breakout that quickly fell back within the range. The second breakout attempt was supported by a hidden bullish divergence, which triggers our entry and the trade quickly moves in our favour.
With the RSI divergence acting as our filter, we can avoid trading false breakout signals or deviations. Then, we will set our exits using the measured move target and adjusted stop loss method.
| Indicators used | RSI indicator (14), or the RSI Divergence indicator (14) |
| Entry Conditions | Look for a bullish divergence inside the double bottom pattern.Wait for the price to breakout, after a bullish divergence has formed.Once the price closes above the confirmation line, enter a long position. |
| Take Profit (TP) | Measured move target or other resistances |
| Stop Loss (SL) | Middle of double bottom range |
Double Bottom Pattern With ATR
The ATR (Average True Range) measures an asset’s average volatility over a given period. When trading a double bottom breakout, an uptrending ATR can confirm the breakout’s strength, showing that volatility is rising as price moves beyond the neckline. Conversely, during the consolidation phase, ATR should decline, signalling low volatility and a lack of strong price movement before the breakout occurs.
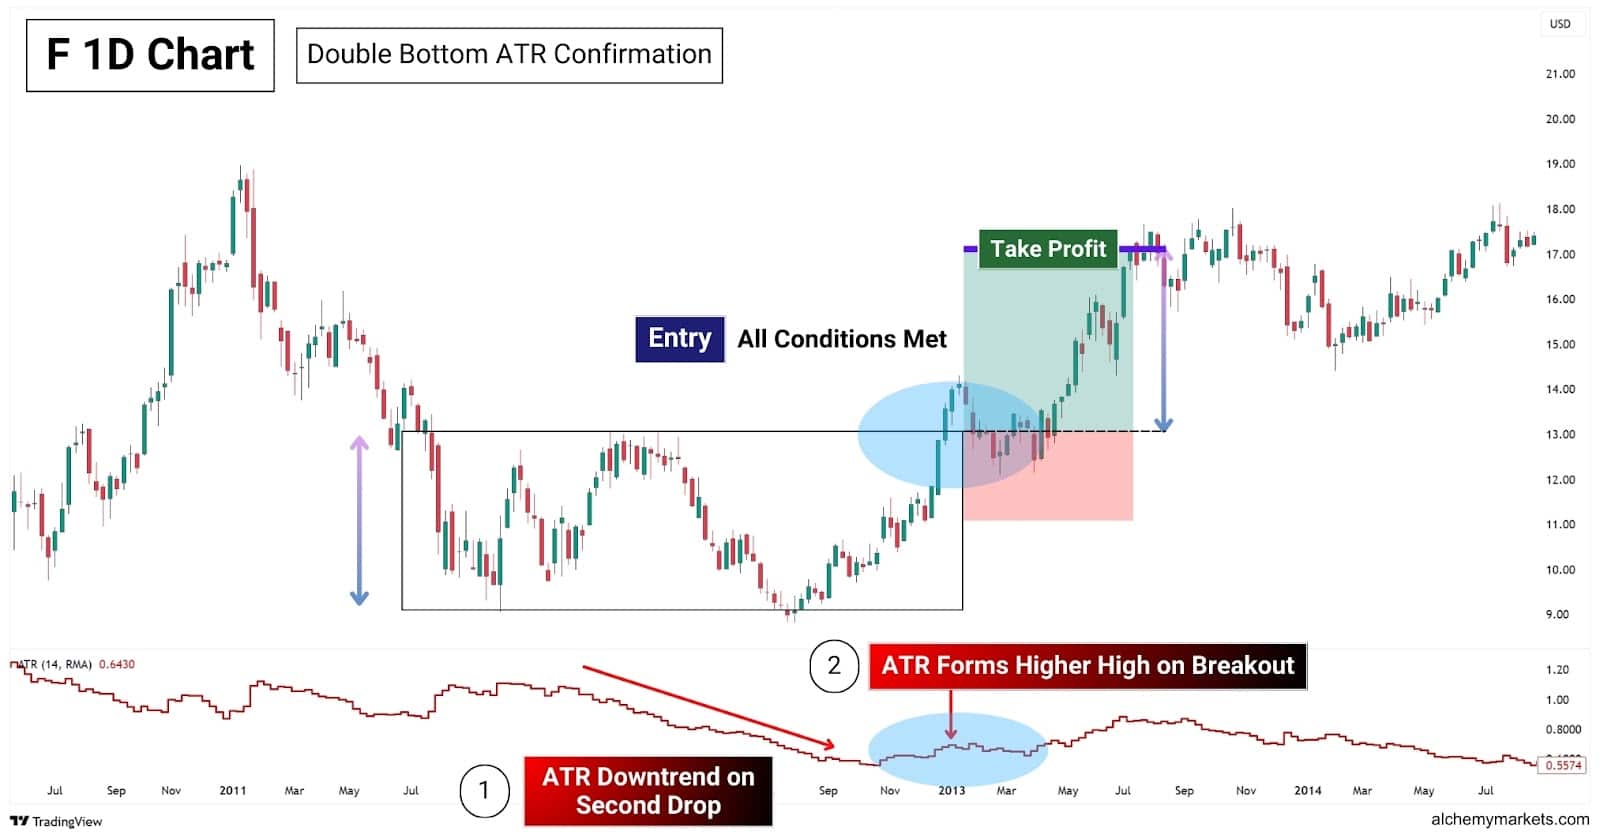
In this Ford daily chart, notice how the ATR was trending lower as the price rejects from the neckline. This implies that the fall is merely a weak, corrective move, making it ripe for a bullish reversal. Then, as the price rises from the second low, the ATR begins to form an uptrend and remains in it as we breakout.
The ATR indicator can be set to a “step-line” view for a clearer visual of volatility changes. However, the key focus should be on its overall trend. As long as the ATR does not trend downward during the second rise or at the breakout, the chances of a valid breakout increase, confirming strong momentum rather than a potential fake-out.
| Indicators used | ATR indicator (14, RMA) |
| Entry Conditions | The ATR trends lower as we reject from the neckline.The ATR forms an uptrend in its second leg up, or during the breakout.Once the candle closes above the neckline, enter a long position. |
| Take Profit (TP) | Measured move target or other resistances |
| Stop Loss (SL) | Middle of double bottom range |
Double Bottom Pattern With EMA
The EMA (Exponential Moving Average) strategy helps confirm the validity of a breakout by identifying the short-term trend. If the Fast EMA is above the Slow EMA, it signals an uptrend, while a Fast EMA below the Slow EMA indicates a downtrend.
To ensure a strong breakout, we’ll only take trades when the double bottom breakout aligns with an uptrend. This increases the likelihood of a sustained rally and helps filter out weak breakout signals.
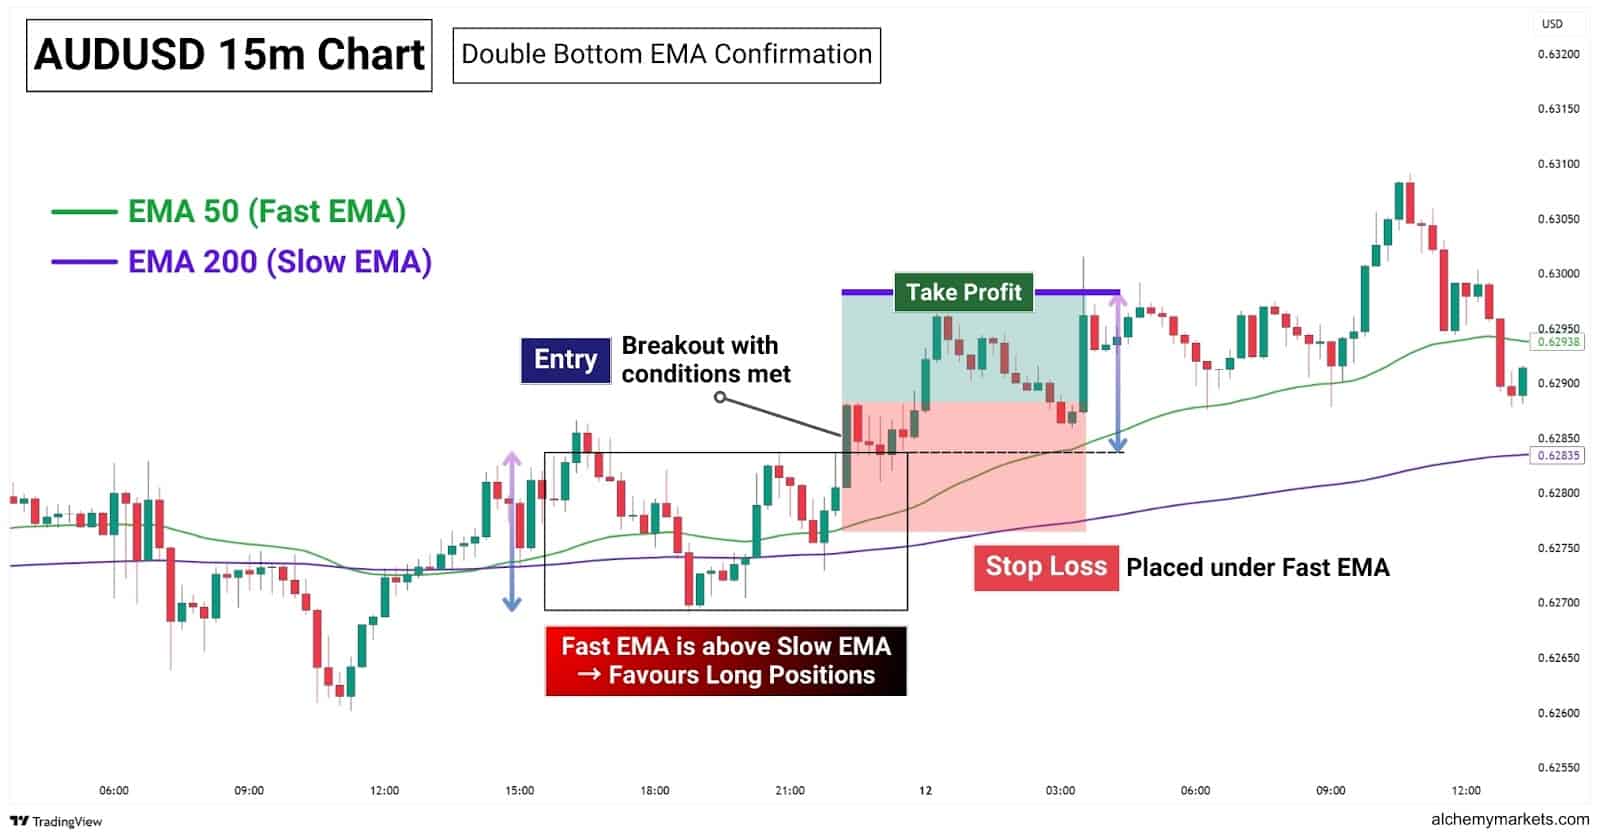
In this AUD/USD 15-minute chart, the 50 EMA is above the 200 EMA at the breakout, confirming the uptrend. Placing a stop loss below the Fast EMA, we enter a long position, and the trade reaches the measured move target.
The core principle of this strategy is using a faster EMA and a slower EMA to compare short-term momentum against the broader trend. For this setup, we recommend the 50-EMA and 200-EMA, as they strike a balance of responsiveness and smoothness. Additionally, when the gap between the EMAs expands, it signals increasing bullish momentum, adding confluence to our trade.
| Indicators used | EMA (50 and 200) |
| Entry Conditions | Price closes above a double bottom pattern’s neckline.If the Fast EMA is above the Slow EMA during the breakout, enter a long position. |
| Take Profit (TP) | Measured move target or other resistances |
| Stop Loss (SL) | Below the Fast EMA at the time of entry |
Double Bottom Pattern With Bollinger Bands
The Bollinger Bands® is a popular indicator used by traders to identify deviations from the average price, which could act as potential support or resistance levels. This aids in finding reversal trading opportunities, should the price reach the edge of the bands.
However, another use of the Bollinger Bands lies in its ability to gauge volatility. For this strategy in particular, that’s where the secret sauce is. Here’s how it works:
- When the bands are expanding, volatility is rising.
- When the bands are tightening, volatility is dropping.
- A large price move tends to happen after the bands tighten.
We’ll pair these concepts with the Bollinger Bands Width indicator (BBW), which helps us clearly see when the bands are expanding versus when it is tightening. A rise in the BBW means the bands are widening, and vice versa.
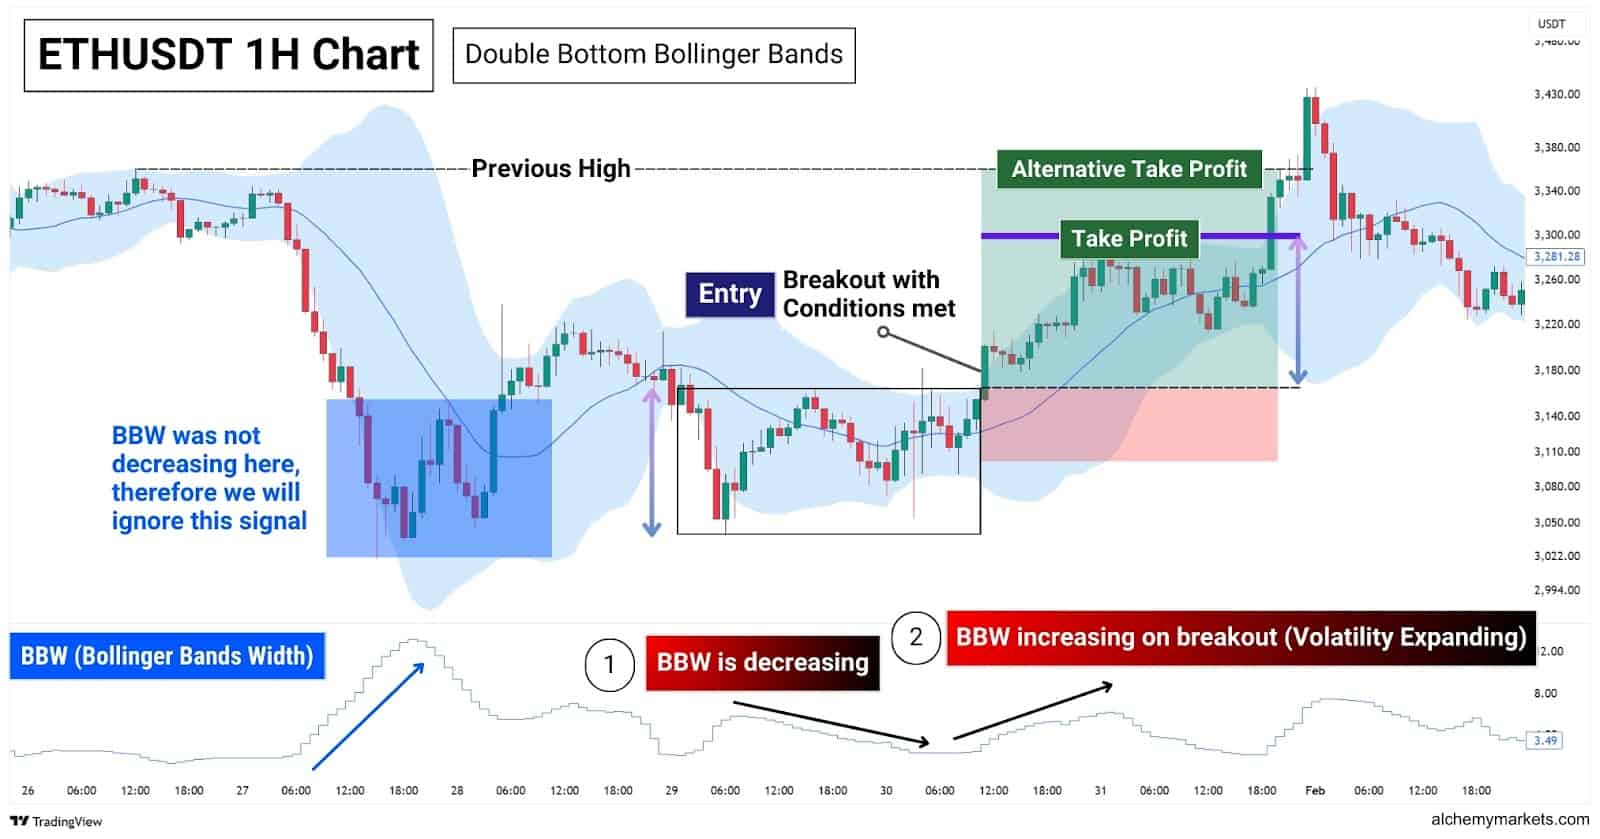
In the ETHUSDT 1H chart, we can see an earlier double bottom pattern (highlighted in blue), but the Bollinger Bands were not contracting. This lack of contraction meant that volatility wasn’t decreasing, leading to a failed breakout with no sustained rally. The second double bottom, however, met our entry conditions—leading to a successful breakout with a sustained rally.
For this strategy, we’ll only look to trade double bottoms that form with decreasing BBW, indicating a drop in volatility, followed by a breakout with increasing BBW, confirming volatility expansion. This filter allows us to highlight and trade higher probability breakouts.
| Indicators used | Bollinger Bands, Bollinger Bands Width |
| Entry Conditions | Observe if the BBW has decreased during the formation of a double bottom.During the breakout or second rise, observe if the BBW is rising and maintains its uptrend.Once the candle closes above the neckline, enter a long position. |
| Take Profit (TP) | Measured move target or other resistances |
| Stop Loss (SL) | Middle of double bottom range |
Double Bottom Pattern With MACD
Moving Average Convergence Divergence (MACD) is an all-in-one indicator that can signal divergences, as well as identify short and long term trend shifts. For this strategy, we’re using the MACD line (blue line), and the histogram to double confirm our entries.
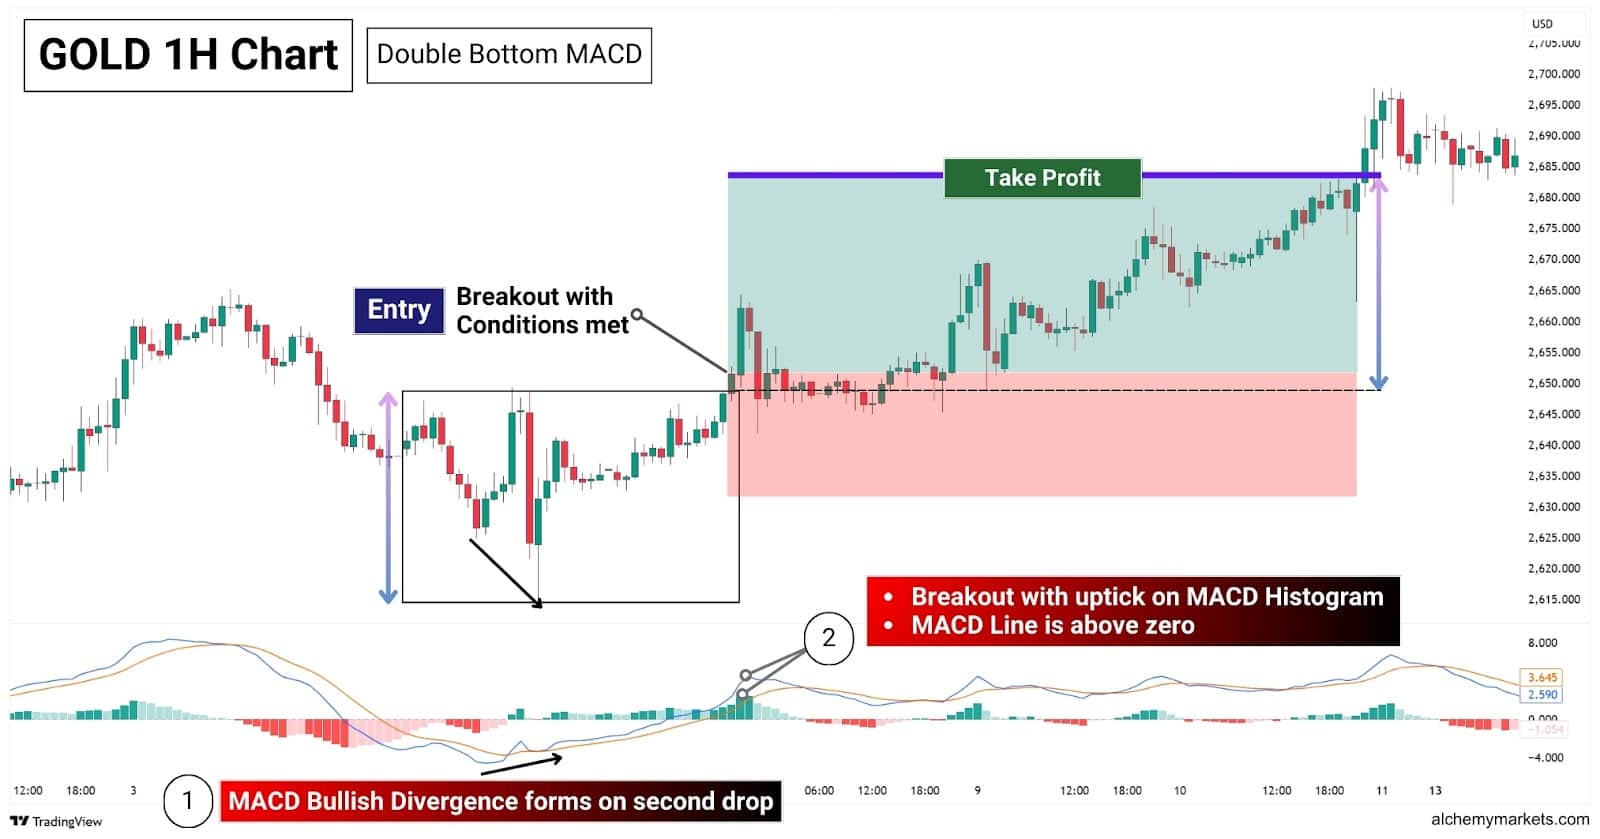
In this Gold 1H chart, notice how the MACD line forms a higher low while the price forms a lower low at its second dip. This is known as a bullish divergence. Then, as the price breaks the neckline, take note of the MACD histogram—it is in the green, and has a greater height than its preceding candle (before the breakout).
This strategy takes advantage of the MACD’s versatility in identifying both long-term trend shifts and short-term momentum changes based on the timeframe:
- MACD line divergence signals a potential long-term trend reversal.
- MACD histogram uptick indicates a short-term rise in bullish momentum.
Paired together, these signals create bullish confluence, strengthening the case for a high-probability double bottom breakout and improving trade confidence.
| Indicators used | MACD (12, 26, 9) |
| Entry Conditions | Look for a bullish divergence within the double bottom pattern.Confirm the breakout by observing an uptick on the MACD histogram.Observe if the MACD line is above 0 during the breakout.Enter a long position if all conditions are met. |
| Take Profit (TP) | Measured move target or other resistances |
| Stop Loss (SL) | Middle of double bottom range |
Advantages of Trading the Double Bottom Pattern
The double bottom is highly effective, making it one of the most popularly understood and traded patterns. The clear advantages of trading a double bottom include its simplicity, versatility on any timeframe/asset, and historical reliability.
Simplicity: It looks like a “W” shape, making it iconic and easy to understand.
Versatility: Double bottoms can be found on any timeframe and any asset.
Reliability: Double bottoms have a longstanding history of reliably identifying bullish reversals.
Disadvantages of Trading the Double Bottom Pattern
Despite all its advantages, the double bottom pattern isn’t without flaws. Trading it without using any confirmations can be dangerous, and the classic recommended stop loss placement is less than ideal.
Requires Confirmations: Without confirmations, it can be prone to fakeouts, leading to early entries and losses.
Poor Risk-to-Reward: The classic stop loss method of a double bottom leads to a 1:1≤ RR, which is not ideal.
Prone to noise: A double bottom pattern can form amidst another chart pattern, leading to confusing signals (i.e. triple bottom).
What Indicator is Best to Trade with a Double Bottom Pattern?
The best indicator to trade a double bottom pattern is one that you’re comfortable with, and helps best confirm the validity of a breakout. Typically, you’d want to use a momentum indicator to observe how strong the breakout is. Additionally, being able to identify divergences will help you identify strong or weak breakouts.
For example, I like using the Bollinger Bands® and BBW (Bollinger Bands Width), because I understand the concepts well and simply feel more comfortable trading with it. I also pair this with the RSI indicator to look for divergences, in case of a fakeout, which sets up the “Fade the neckline” trade strategy.
The key takeaway? Use the strategy and the indicators you naturally gravitate towards. And if that isn’t working out for you, move to the next option. Each trader is different, and the timezone, market session, and market you trade in will affect how effective you are in trading the double bottom.
Common Double Bottom Pattern Mistakes to Watch Out
The most common mistakes traders make are hopping too early into a trade, not treating the neckline as a proper resistance, and overall being too optimistic about a reversal. The key to successfully trading a double bottom is understanding the market context, and properly waiting for a breakout, alongside multiple confirmations.
These confirmations can come in the form of volume analysis, momentum analysis, or even identifying significant support levels, where a double bottom is most likely to form. For instance, a previous all-time high would be a significant support level. Or, significant psychological levels on an asset that likely trigger governmental action, such as the EUR/USD reaching parity at 1 dollar.
To sum it up, be careful not to make these mistakes:
- Being overly optimistic about the double bottom’s success.
- Not treating the neckline as a proper resistance level, this relates to our previous point.
- Trading without any confirmation factors, such as volume, momentum, or key support.
- Lack of partial take profits at significant resistances, before the measured move target is reached.
- Lack of market context, such as news that may continue to drive the price of an asset lower, so double bottoms become less significant. This applies more for Forex and Commodities.
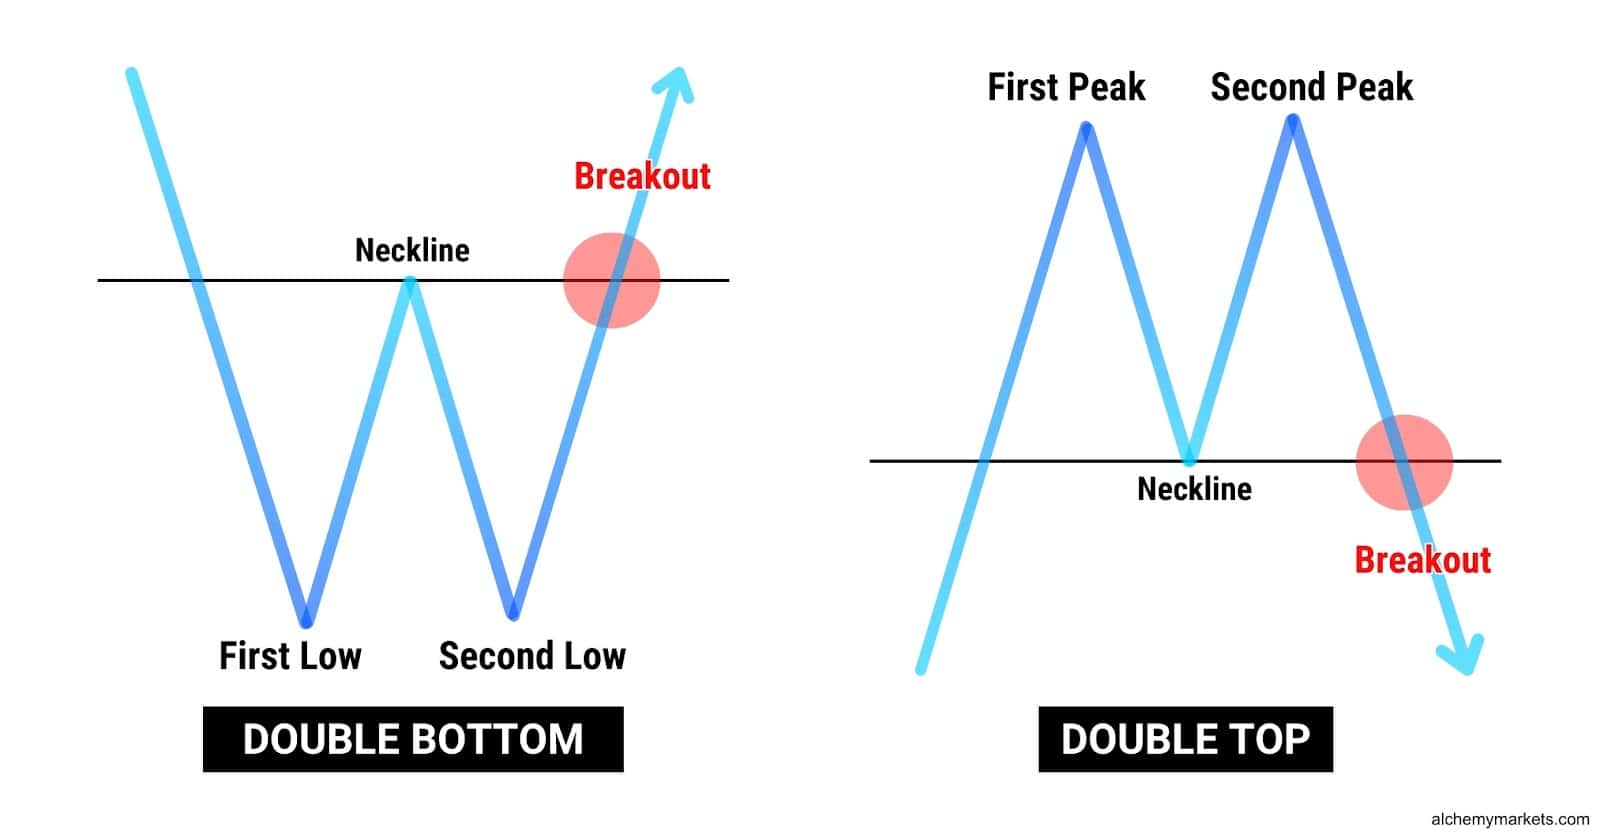
Double Bottom vs Double Top
Double top patterns are bearish reversal signals, rather than bullish trend reversal signals like the double bottom. A double top formation consists of two peaks that signal a resistance level. Instead of two hits to the lows, the double top has two hits to the highs, indicating that bulls failed in pushing price higher on two occasions.
This signals potential exhaustion from bulls, giving bears a higher probability of seizing control and pushing price lower.
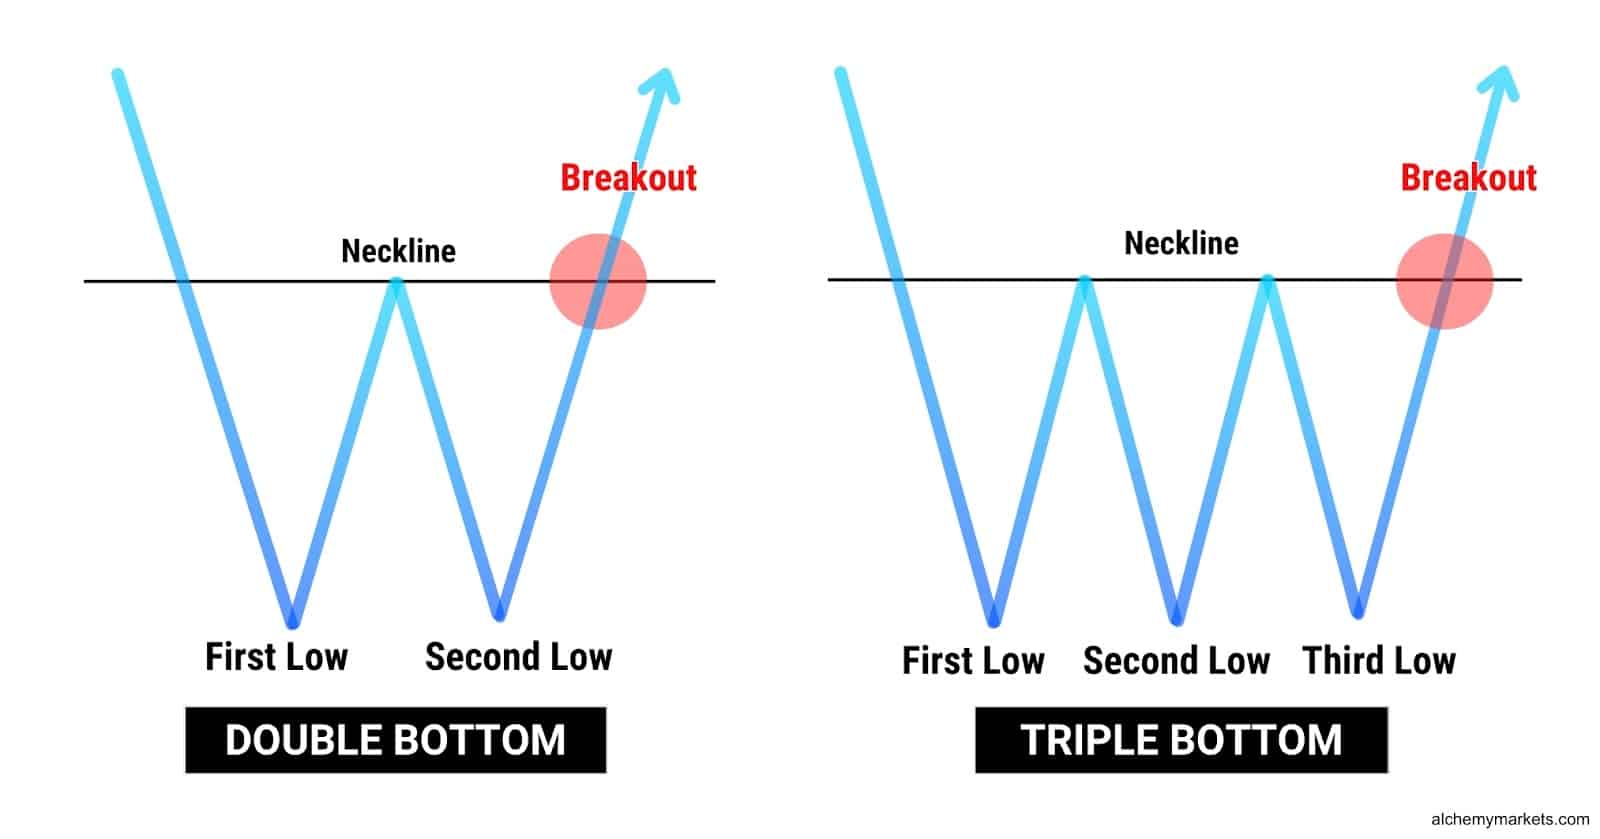
Double Bottom vs Triple Bottom
A double bottom has two hits to the lows, while a triple bottom has three. Both chart patterns share a neckline, which, if broken, should lead to a bullish reversal, with a measured move target equal to the distance between the highest point and the lowest point.
Triple bottoms breakouts are often considered more powerful, since the additional bounce at the support level shows more buyer conviction, and reduces the likelihood of a false breakout.
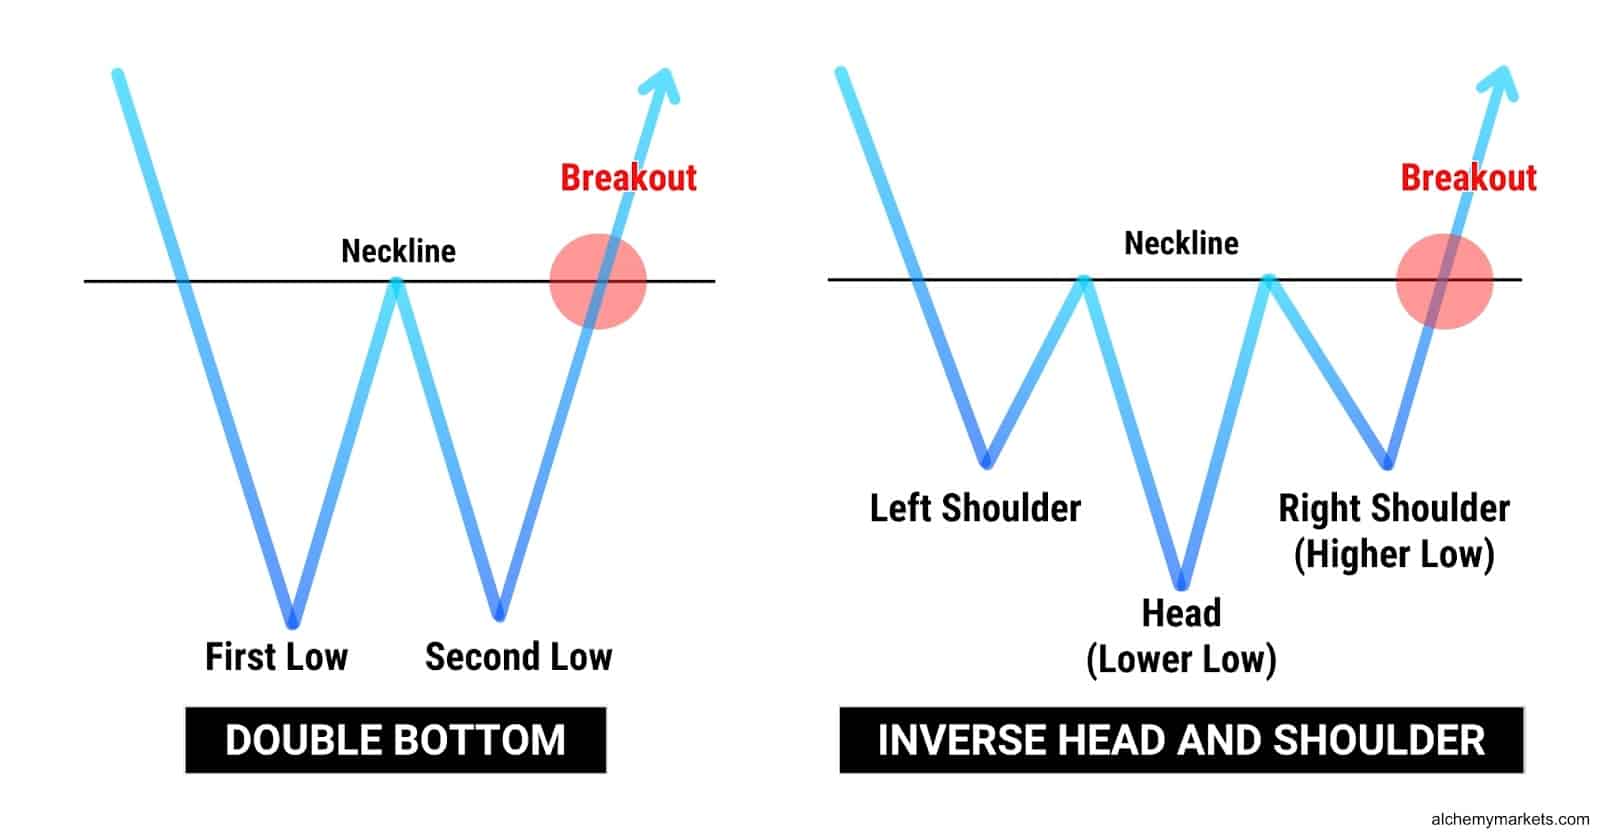
Double Bottom vs Inverse Head and Shoulders
Like a double bottom, an inverse head and shoulders is a bullish reversal pattern with a neckline and a measured move target equal to the pattern’s range. However, instead of two lows forming the bottom price, this pattern forms with three distinct dips: the left shoulder, head, and right shoulder.
The head forms as the lowest point in the pattern, marking the deepest pullback. In relation, the left and right shoulder develops as higher lows, at around the same prices. All three dips must experience a pullback to the neckline in order for this pattern to be valid, signalling that sellers are losing control and a potential trend reversal is likely.
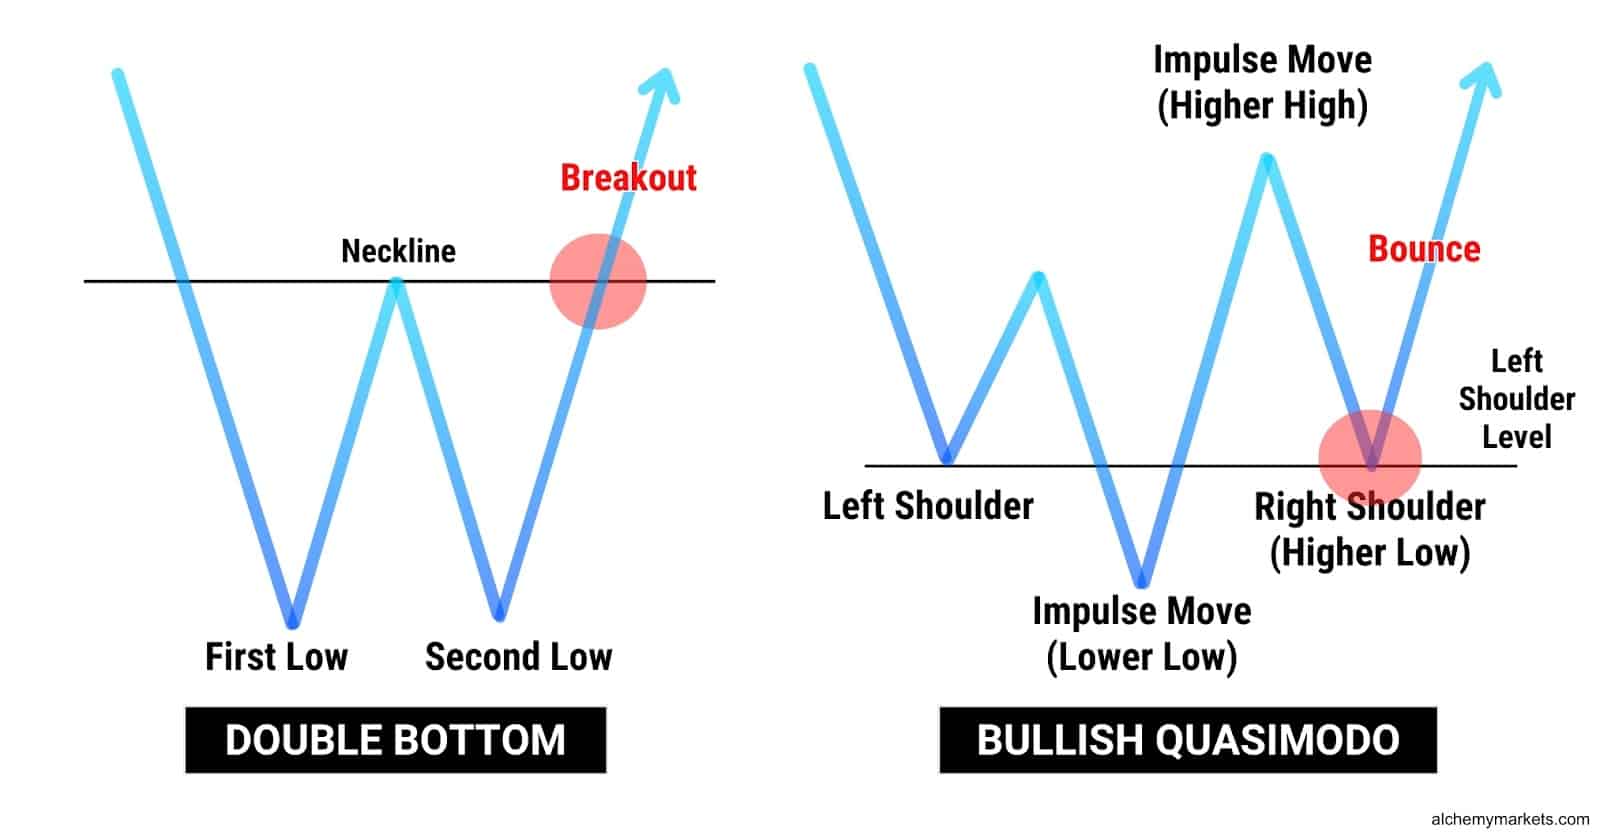
Double Bottom vs Bullish Quasimodo
The bullish quasimodo is more similar to inverse head and shoulder, rather than similar to the double bottom. It shares the quality of having three hits to the low, but instead of looking for a breakout at the neckline, we’re looking for a bounce at the left shoulder level.
Additionally, the quasimodo has two impulsive moves, with the first creating a lower low, and the next creating a higher high—signalling indecision. It’s only when the price forms its right shoulder at where the previous left shoulder was, that we confirm the direction.
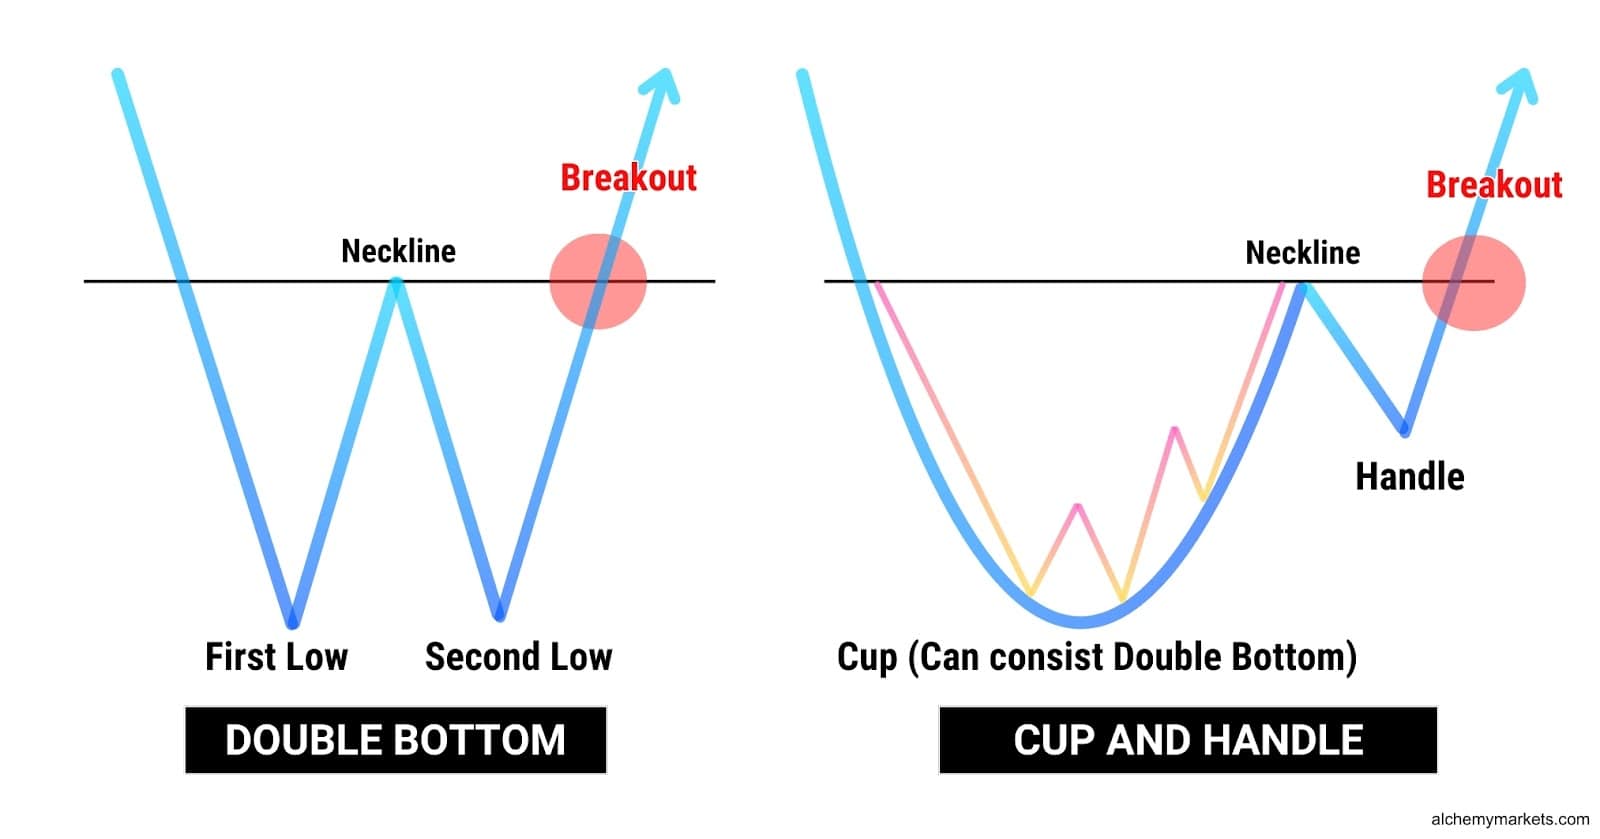
Double Bottom vs Cup and Handle
A double bottom can sometimes form as the “Cup” portion of a cup and handle pattern, which is also a bullish pattern. A cup and handle usually occurs within an uptrend, and signals further continuation.
The “cup” portion of the pattern is a collection of lows, that end up forming a rounded bottom kind of appearance in the chart, and the “handle” portion is a small retracement from the neckline, that eventually retests the neckline for a significant breakout.
As mentioned earlier, the double bottom can be formed during the “cup” portion of the pattern—as highlighted by the pink outline below. Such an occurrence can add even more strength to the bullish Cup and Handle chart pattern.
Double Bottoms and Volatility
The double bottom is a reversal chart pattern. It can be challenging to determine when a market is turning from a bearish trend to a bullish trend which is why traders wait for confirmation. Above, we’ve discussed a breakout above the neckline which provides the needed confirmation.
Oftentimes, prior to a breakout, volatility deadens and the market moves sideways. Then, as the market conditions become more active, the potential for a successful breakout increases. Therefore, it is not uncommon for market conditions to lull traders to sleep prior to market conditions becoming more active on a double bottom neckline breakout.
FAQ
What is the best time frame to use for the Double Bottom pattern?
The double bottom can be used on any timeframe, making it a versatile trading pattern to spot. On larger timeframes such as the daily timeframe, a double bottom pattern can signal the end of a bear market, making it an invaluable tool for swing traders and investors alike.
Must the two bottoms of the lows in the Double Bottom Pattern be the same?
The two lows of the bottom price in a Double Bottom do not, and rarely will, be formed at the same price level. It’s extremely likely that the second low will be formed as a higher low, or lower low. This would not disqualify the pattern from being a double bottom, but it is important to note that the wick of the second low should visually be close to the first low — thus forming the shape of a “W”.
Is the double bottom shape like a ‘W’ pattern?
The double bottom is shaped like a W pattern, but can sometimes form deviations, making it appear like a triple bottom or squiggly “W”. A realistic double bottom pattern will have multiple zigzags within its formation, but the overall shape and direction should contain:
- An impulsive move lower, forming the first low.
- A corrective pullback, forming the neckline.
- Another move lower, starting from the neckline, to a region that is close to the first low’s wick.
- A final move up towards the neckline, where price could either break out or consolidate.
Is the Double Bottom Pattern one of the classic technical analysis formations?
Yes, the double bottom pattern is a widely recognised, classic trading pattern that is known to many traders. It remains highly popular due to its accuracy and ability to signal major trend shifts.
Does the Double Bottom pattern follow a major or minor downtrend?
A double bottom pattern typically follows a major downtrend, signalling a potential reversal. However, it can also form within an uptrend during a pullback. In fact, a double bottom within a broader uptrend is highly effective, as it indicates the market’s refusal to let prices drop further, reinforcing bullish momentum.
Does the Double Bottom pattern signal the reversal and the beginning of a potential uptrend?
Yes, the double bottom pattern is primarily known as a bullish reversal signal, marking the potential end of a downtrend and the start of an uptrend. However, its effectiveness depends on the timeframe and market context:
- On lower timeframes (1H or smaller), a double bottom after an uptrend is often a double top in disguise, especially when the peaks are forming at resistance.
- On higher timeframes (daily, weekly), a double bottom after a bullish rise, within a bull market can act as a continuation pattern. This is because the larger timeframe suggests that the consolidation is a corrective phase, gradually absorbing bearish pressure and allowing bulls to regain control for the next leg higher.
- A double bottom forming after a bullish rise can also be a bull flag, particularly if the second low is slightly lower than the first. This structure still leans bullish but suggests consolidation before further movement.
Ultimately, while the double bottom is a strong bullish signal, traders must consider the timeframe and market structure to determine if it’s a reversal or a continuation pattern.
Is the Double Bottom pattern bullish or bearish?
The Double Bottom pattern is bullish, but can often be confused with the Double Top pattern, which is bearish. Understanding the context of the market then becomes extremely important for recognising a double bottom, versus a double top pattern.
As stated above, sometimes a double bottom pattern on a higher timeframe.


