


Written by:

Reviewed by:

Bullish
- May 9, 2024
- 15 min read
Bull Flag Patterns – Comprehensive Guide for Traders
The bull flag pattern is a common chart formation used in technical analysis, signifying a potential continuation of an asset’s upward price movement. This guide explores the identification, key characteristics, and effective trading strategies for leveraging bull flag patterns during bullish market trends.
What is a Bull Flag Chart Pattern?
A bull flag is a chart pattern used by technical traders to signal when the market is likely to rally further. This pattern usually appears when prices undergo a short-term corrective phase within a broader uptrend, indicating that the asset is likely to experience a further rise in price. The pattern unfolds in specific phases, starting with a significant upward surge caused by a strong influx of buying pressure. This initial movement can be a reaction to positive sentiment, fundamental news, or market dynamics that favour an increase in the asset’s value.
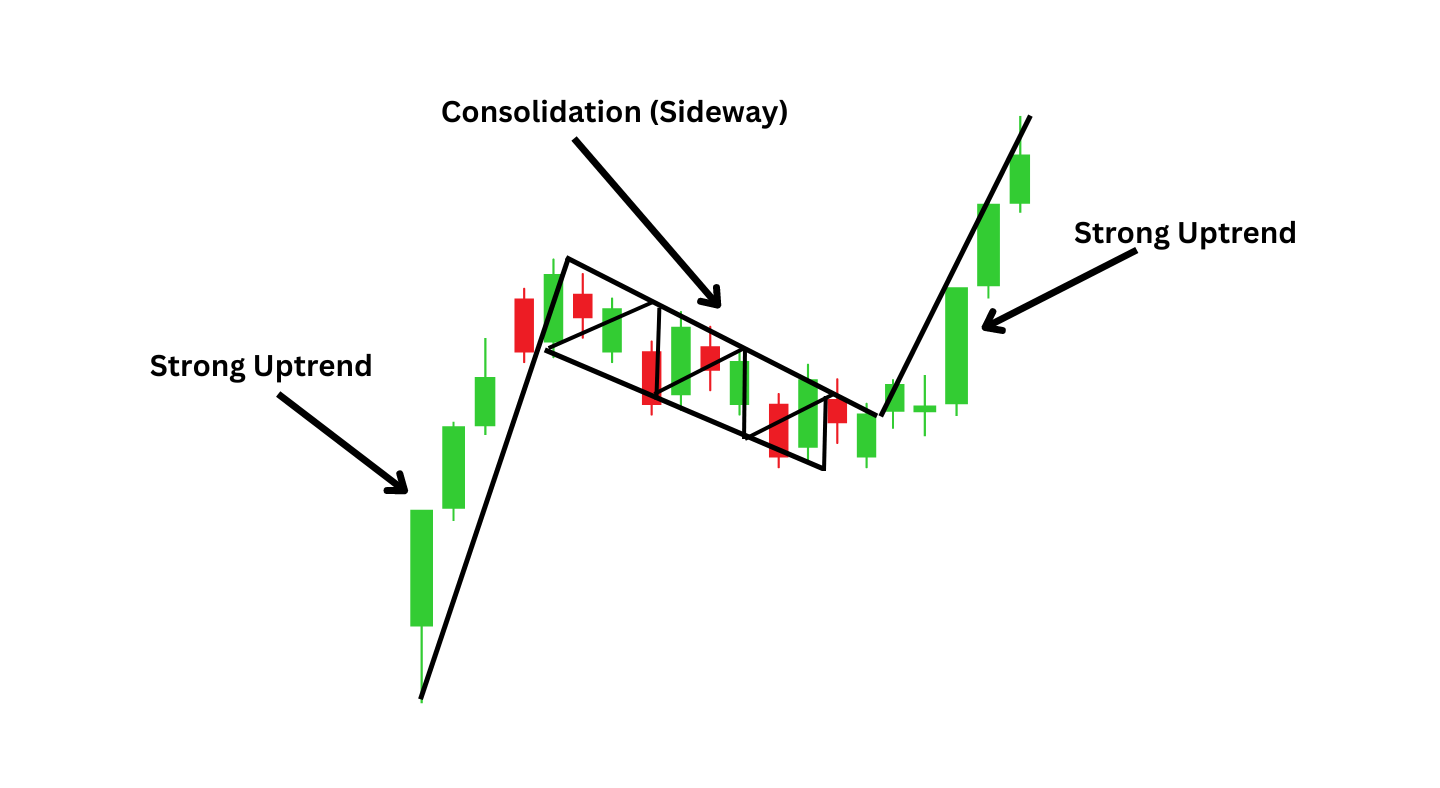
After a surge in price, the asset usually enters a consolidation phase. This means the price may experience a slight dip, a pullback, or a correction. However, this consolidation does not necessarily mean the asset’s upward momentum has stopped. Rather, a temporary pause allows traders and investors to reassess the asset’s value. During this period, the market is simply digesting the recent gains, which does not indicate a reversal. The structure of the price patterns provides you with a hint of whether the flag portion is a consolidation leading to a continuation or simply a reversal pattern. Notice the flagpole is a strong impulsive rally where the price moves higher rapidly. On the other hand, the flag consolidation drifts lower. A full reversal pattern likely corrects lower at a more aggressive rate and the flag portion simply drifts indicating its a consolidation of the previous uptrend.
The pattern completes with a decisive breakout above this consolidation phase. The breakout is driven by renewed buying interest, pushing the price to rally further. This point is crucial and is often accompanied by increased trading volume, reinforcing the pattern’s validity and indicating that the asset’s upward trend will probably continue.
How to Spot a Bullish Flag
The bullish flag pattern undergoes three distinct phases of development. As a trader, you’ll try to pick up on the bullish flag at the second phase and trade it through the third phase. Here’s how you can spot each of these phases.
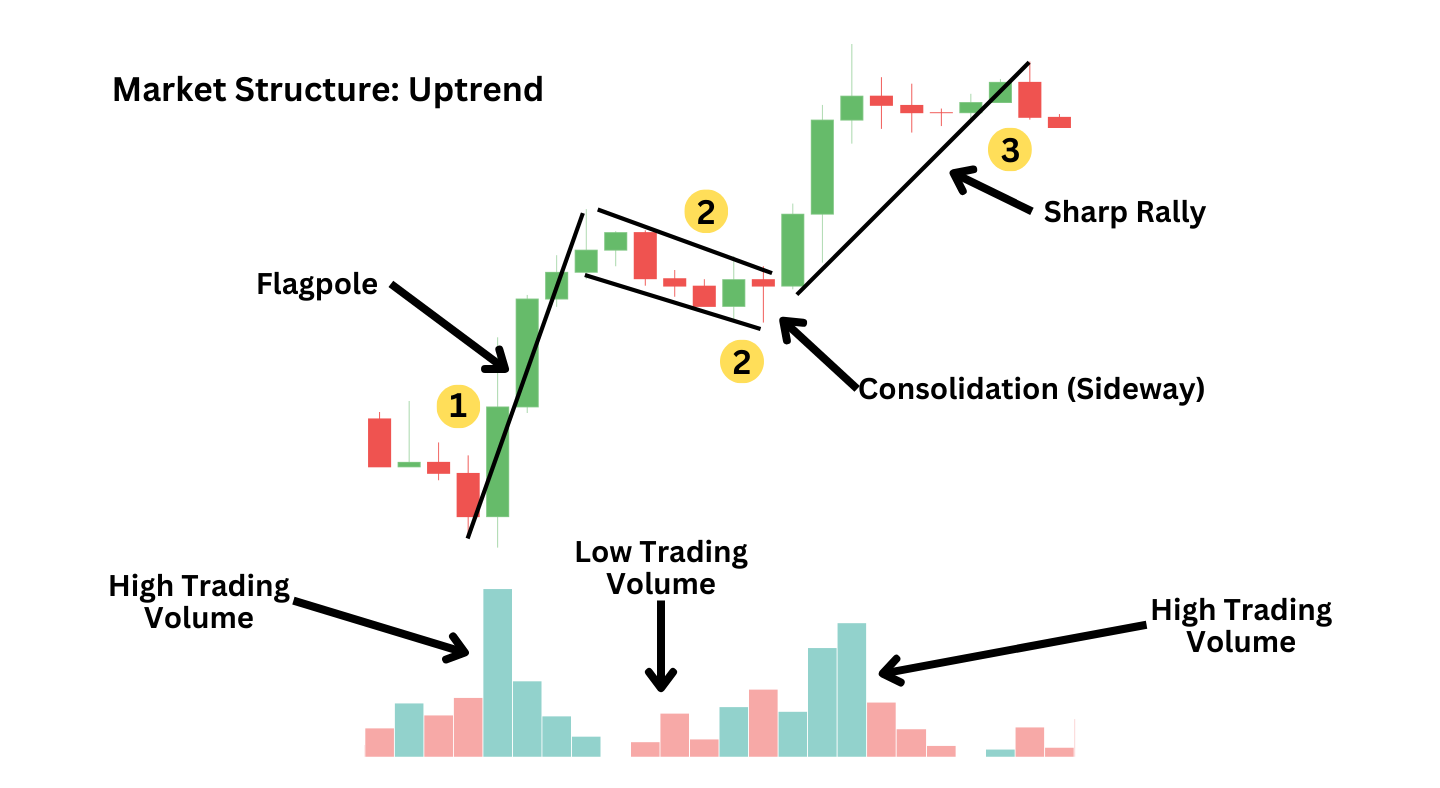
Phase One – The Flagpole: The appearance of a bullish flag starts with an evident display of upward momentum, characterised by a substantial rise in prices. This rally is marked by a notable increase in volume, with the price reflecting strong buying pressure.
Phase Two – The Flag: Prices consolidate and move slightly downward within a narrow price range after an initial surge. This phase resembles the shape of a flag marked by a series of lower highs and lower lows, creating a channel that slopes downwards as the volume decreases.
Phase Three – The Breakout: The pattern completes with a break above the upper boundary of the consolidation range, indicating a continuation of the initial uptrend. This breakout point is critical, as it validates the bullish flag pattern and signals the continuation of the upward momentum, ideally on increased volume.
How to Trade a Bull Flag Chart Pattern
Identify the Market Trend: The first step is to verify that the market trend is bullish, as the bull flag pattern is a continuation pattern that must appear within an existing uptrend. If you’re not sure if the trend is higher, use a common technical tool like a moving average. You’ll want to see the flag pole and most of the flag holding above the moving average.
Spotting the Flag: Watch for a slight downward, horizontal consolidation phase after the sharp rally. This consolidation should not retrace more than 50% of the initial surge.
Volume Analysis:
Flagpole Formation: Look for a significant increase in volume, indicating strong buyer interest that drives the price upward.
Flag Formation: Volume should decrease, suggesting a lack of selling pressure and a consolidation rather than a reversal.
Breakout Volume: As the price breaks above the flag, a resurgence in volume is essential. This confirms that the breakout is supported by new buying interest, increasing the likelihood of a successful continuation.
Entry Point: The ideal entry point is upon a clear breakout above the upper boundary of the flag. To avoid false breakouts, wait for a candle to close above the flag, confirming the breakout’s validity. This method ensures you enter the trade based on confirmed momentum rather than preliminary excitement.
Stop Loss: To manage risk effectively, place a stop loss just below the lowest point of the flag. That way, if prices continue to break lower, then the pattern has failed and you’ll want to be taken out of the position.
Take Profit: Calculate the take profit level by projecting the distance of the flagpole upwards from the breakout point.
Bullish Flag Pattern Example
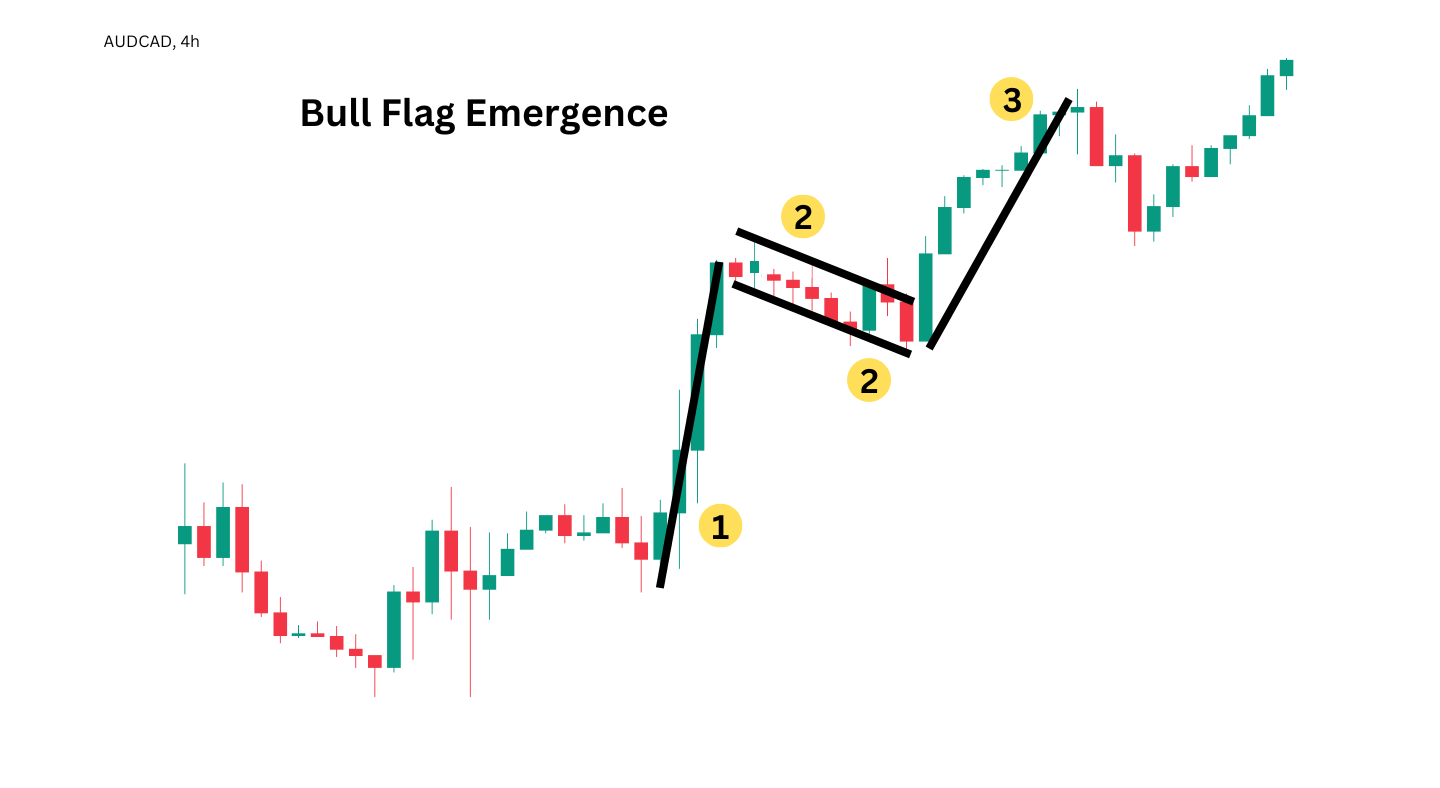
The bull flag pattern’s emergence is characterised by a sharp price rise followed by a slight downward consolidation. This indicates the potential for a rally, creating higher highs. The AUDCAD 4-hourly chart above is an example of this pattern.
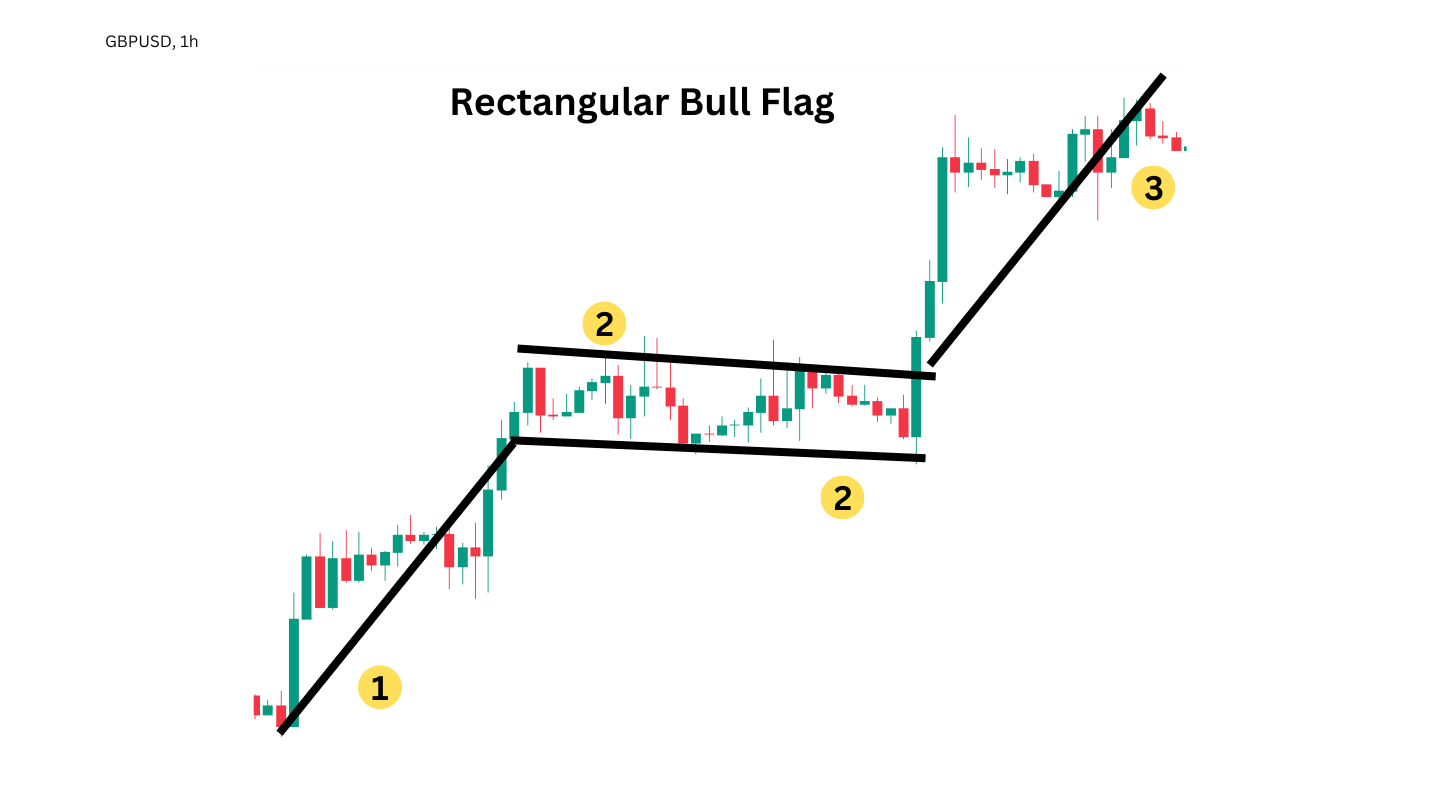
In the 1-hour GBPUSD chart, a rectangular bull flag pattern forms during the consolidation phase. This pattern appears as a rectangle and indicates price movements within a specific range, bound by parallel support and resistance levels.
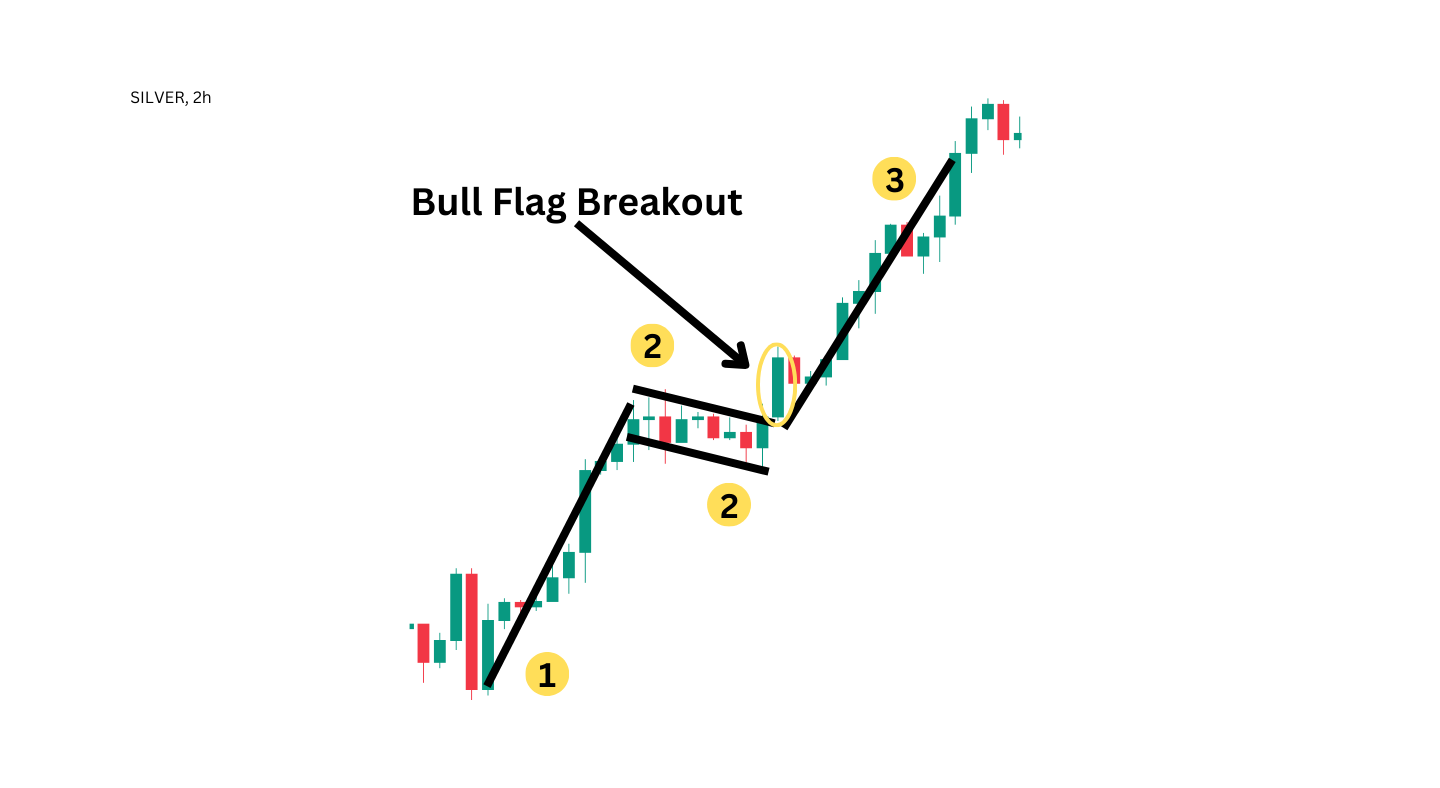
The bull flag breakout occurs when a strong bullish candle breaks above the flag’s upper boundary, confirming the bullish trend’s continuation. This strategy can be seen in the Silver chart above.
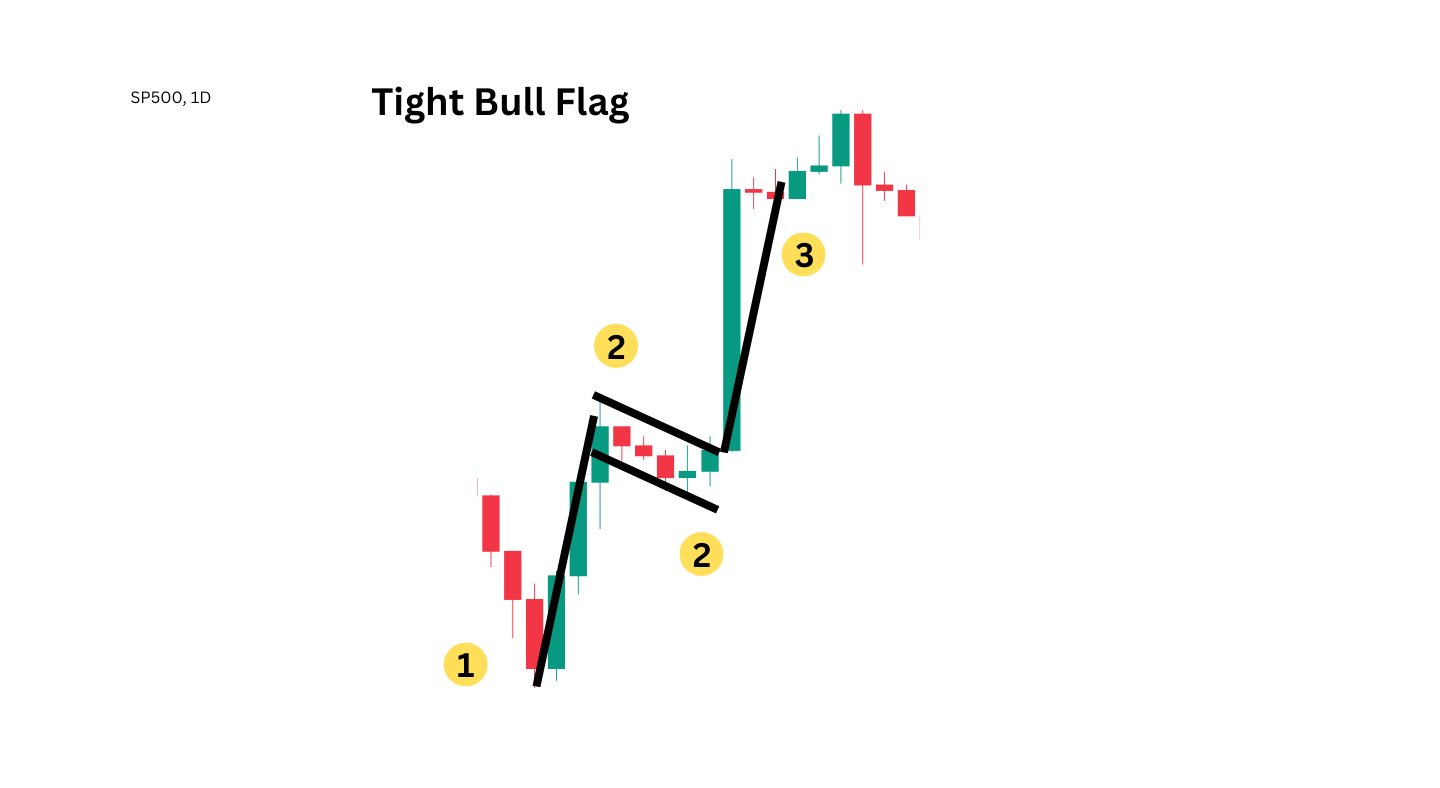
A short and narrow consolidation phase characterizes the tight bull flag pattern after the initial market rise. This pattern usually indicates strong market momentum with lower volatility during consolidation, often leading to a quicker trend continuation. An example of this pattern can be seen in the SP500 chart above.
Bull Flag Strategies
Several bull flag trading strategies have been commonly traded. Below, we will review three of the easier strategies to implement.
Breakout Above the Flag Resistance
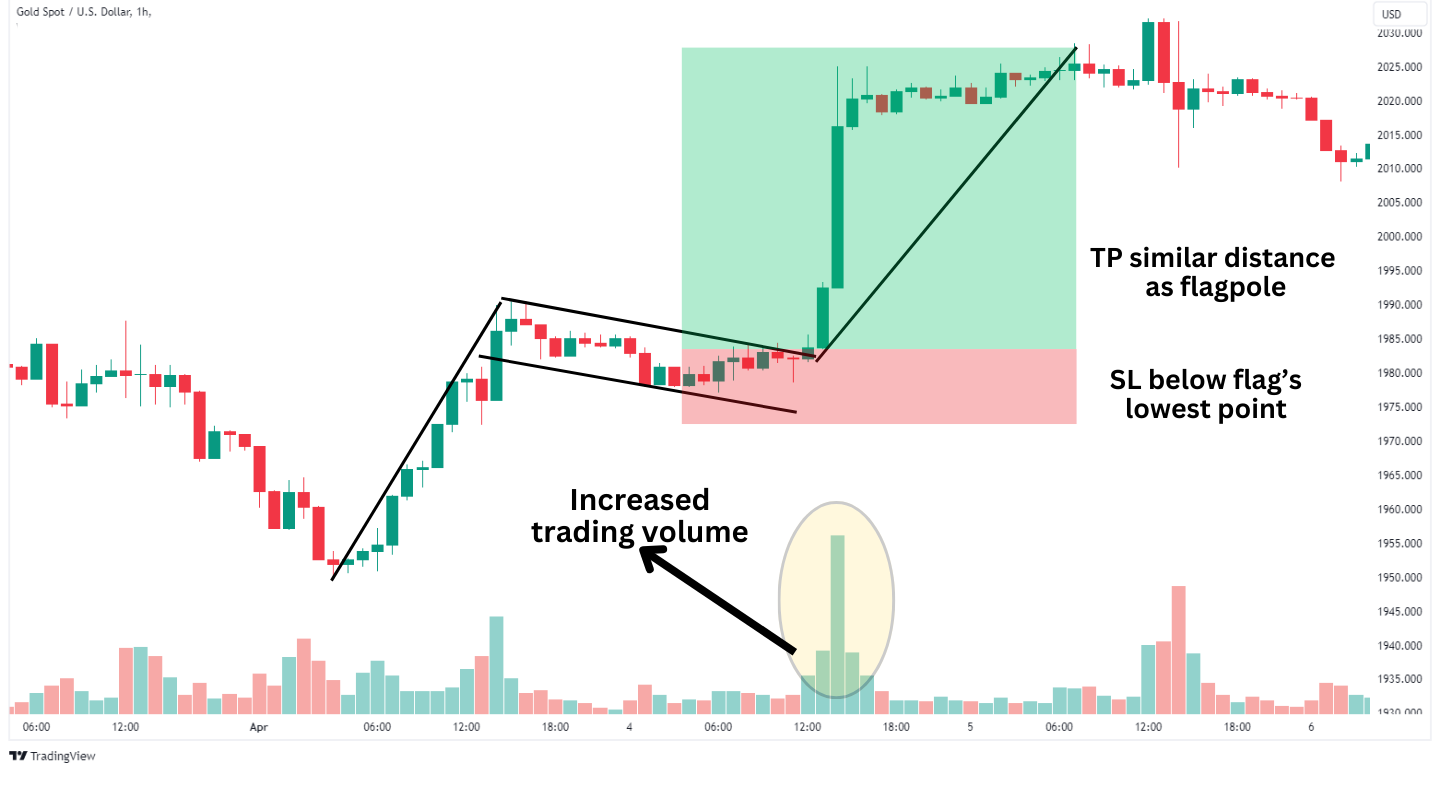
To trade a breakout above flag resistance, wait for the price to surpass the descending upper trendline of the flag. Additionally, ensure the breakout is supported by increased volume for pattern confirmation. Aim for a risk-reward ratio of at least 1:2, where potential gains are at least double the risk.
Set your profit target by measuring the flagpole’s height and extending this distance from the breakout level. Minimize risks by placing a stop loss below the flag’s lowest point. The Gold Spot examples above show the price rallying after breaking above the upper boundary of the flag.
Retest Horizontal Break
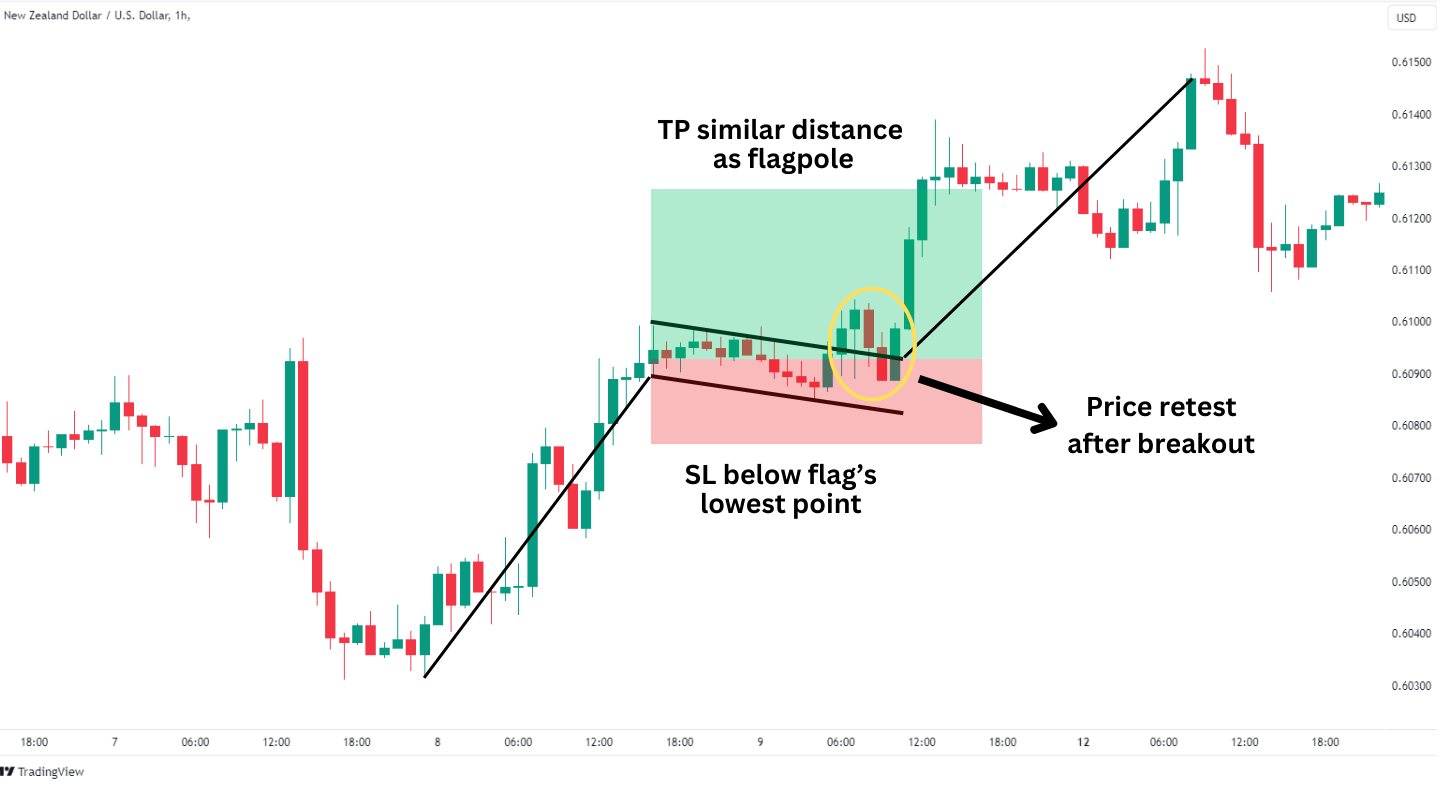
For a retest horizontal break strategy, initiate a trade when the price revisits the area just above the flag pattern’s upper horizontal boundary after an initial breakout. This may signal a continuation of the bullish trend. Determine your take profit by extending the flagpole’s height from the breakout upwards. Place your stop loss below the flag’s recent low to exit with a small loss in case the breakout fails.
The NZDUSD hourly chart above is an example of the Retest horizontal break strategy where the price breaks above the upper boundary, signaling a rally, but the price returns to the flag. This strategy involves executing a trade during the retest period with clear entry and exit levels.
Anticipate the End of Flag
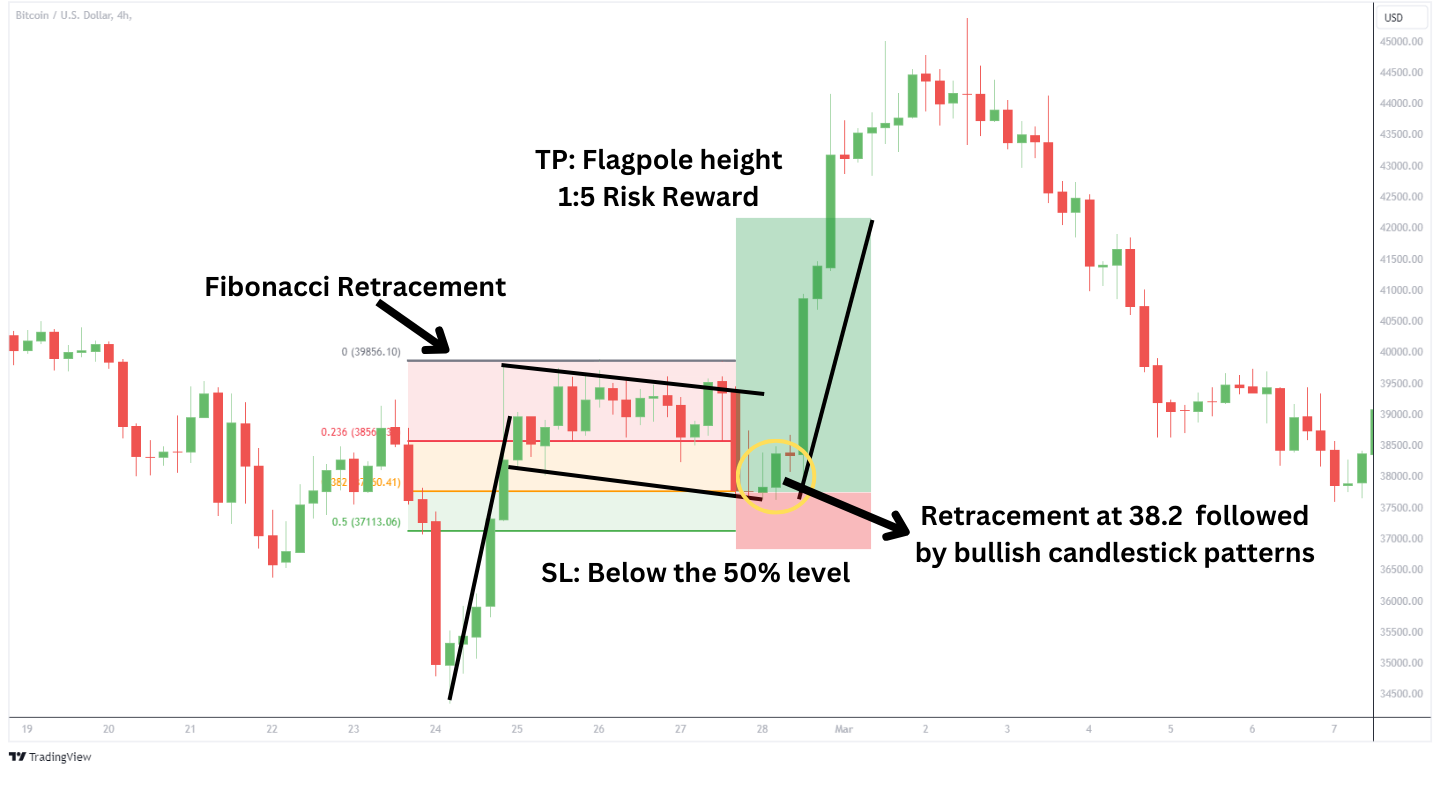
Anticipating the End of the Flag strategy involves using the Fibonacci retracement tool and bullish candlestick patterns to identify potential bullish reversals before they occur. After a strong rally, the market will consolidate those gains and typically find support at a Fibonacci retracement zone.
Trading the bull flag is more reliable when it forms in the upper half of the flagpole. Therefore, common retracement levels that may provide support are the 23.6% or 38.2% Fibonacci retracement zones.
This strategy is simple. As the flag develops, focus on a dip in price down to the 38.2% retracement level. As the flag approaches the 38.2% level, look for bullish candlestick patterns to form like a hammer or bullish engulfing. This will hint that the market respects the 38.2% retracement level, and the price might try to break higher out of the flag.
The conservative stop-loss placement would be below the 50% Fibonacci retracement level. If the price falls below 50%, the chance of a successful breakout is diminished. Take profit based on the measured move of the flagpole. As a result, this can produce better than a 1-to-5 risk-to-reward ratio opportunity. The Bitcoin chart above can best explain the strategy.
Advantages of Bull Flag Pattern
The bullish flag candlestick pattern offers several advantages for traders, such as
- Easy Identification: Traders can spot bull flags conveniently due to the pattern’s distinctive feature, a long and visible flagpole, followed by a downward corrective parallel price channel for the flag.
- Entry and Exit Points: The bull flag pattern provides a relatively clear and objective setup for entry and exit points. The breakout point above the flag is a precise entry signal for traders. At the same time, the length of the flagpole provides a straightforward method for determining take-profit levels.
- Versatility: Effective in multiple time frames, the bull flag pattern serves both day and swing traders, offering flexibility and the opportunity to tailor strategies to individual trading styles and goals.
Disadvantages of Bull Flag Pattern
The bullish flags pattern is without fault. Here are some disadvantages of the bull flag pattern:
- Unreliable Volume Data: Markets like crypto and forex often lack reliable volume data, which can be used to confirm the pattern. Traders must evaluate the pattern’s strength without this indicator, which may complicate the analysis.
- Deep Retracements: The bull flag pattern risks losing reliability if the flag retraces more than 50% of the flagpole. Traders must stay vigilant for such deep retracements, as they can lead to the pattern’s invalidation and increased trading risk.
- Risk-Off Markets: A sudden increase in market volatility can lead to abrupt trend reversals. Oftentimes, the bull flag is a product of risk-on-market sentiment. That sentiment can fade and cause prices to reverse, making for an invalid pattern.
Trading Bull Flags with Volume Confirmations
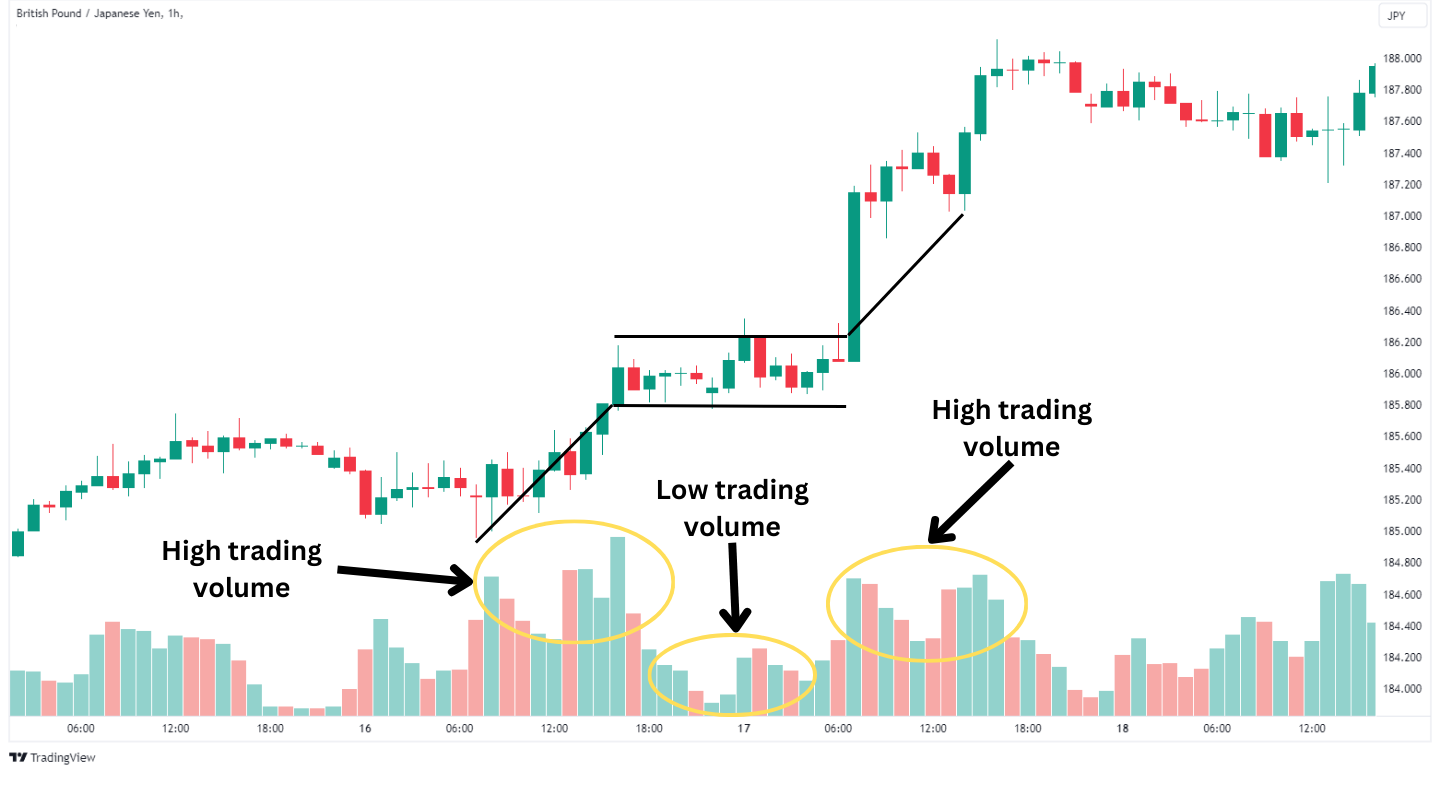
Volume plays an important role in identifying reliable bull flag pattern and distinguishing them from potential false breakouts.
The price rally that forms the flag pole is accompanied by high trading volume, reflecting strong buying pressure. As the pattern develops, there’s often a noticeable decrease in volume during the flag’s formation, right after the flag pole. This drop in volume suggests a pause in the uptrend rather than a trend reversal.
As the bull flag pattern concludes and the price breaks above the flag’s upper boundary, an increase in volume should be evident. This spike in volume signals the buyers regaining control, likely leading to a continuation of the uptrend. A breakout with significant volume increase lends credibility to the bull flag, whereas a breakout lacking volume support may indicate a lack of conviction and a potential false signal.
It’s important to remember that direct volume data may not be the most reliable in certain markets, like forex and crypto. In such scenarios, bull flag chart pattern can still emerge despite the potential ambiguity in volume indicators. Traders should pay closer attention to price action and the flag’s positioning to validate the pattern.
Bull Flag Pattern vs Bear Flag Pattern
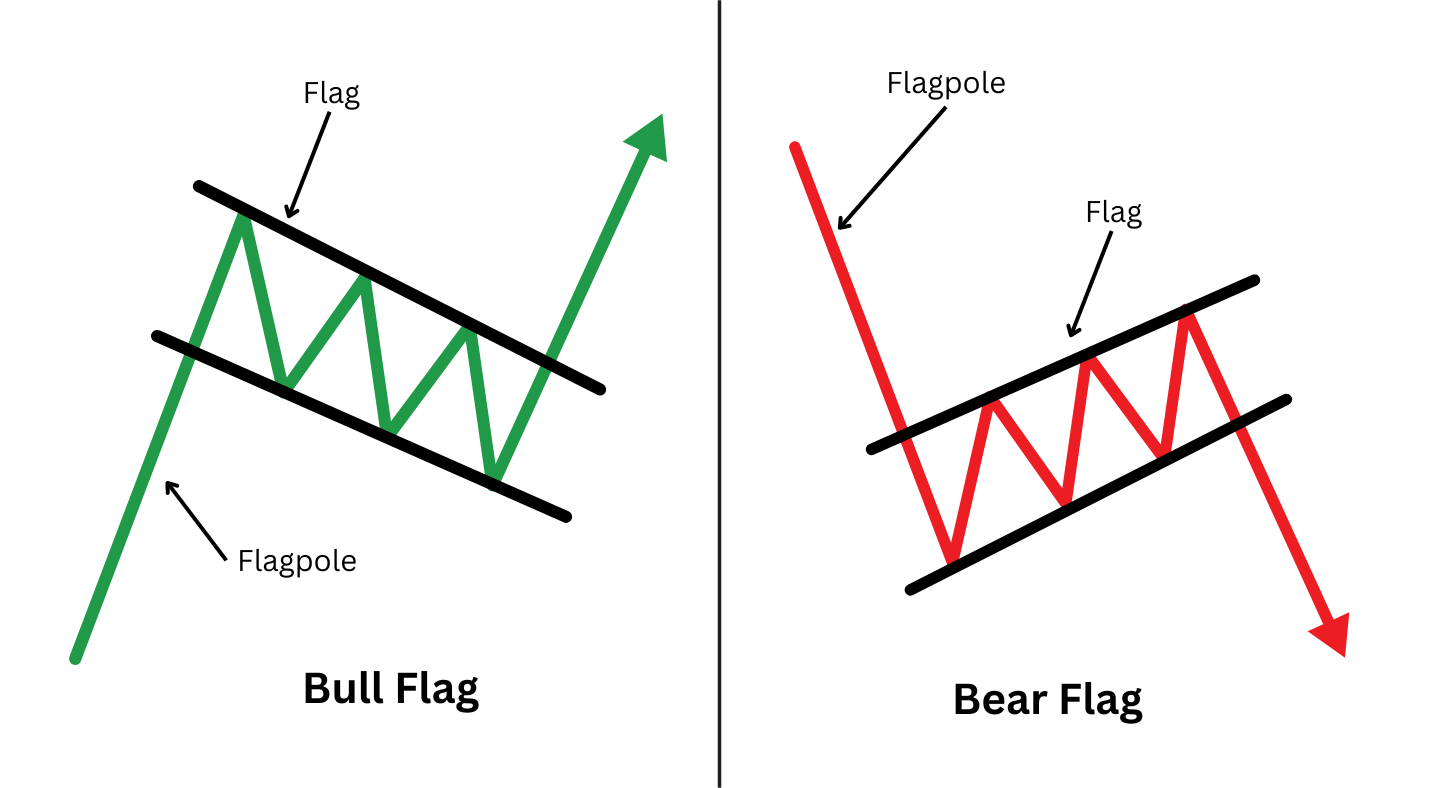
Distinguishing between bull and bear flag patterns is essential for traders who leverage market trends effectively. Both patterns serve as continuation signals but indicate movements in opposite directions.
A bull flag pattern is formed within a near-term uptrend. The pattern is characterized by a swift upward price movement, followed by a brief period of consolidation with a slight downward slope. Its occurrence signals the potential continuation of the uptrend.
On the flip side, the bear flag pattern emerges during a downtrend. It begins with a sharp decline followed by a formation of the flag, which slopes slightly upwards. Like the bull flag pattern, volume diminishes during consolidation and increases as the price breaks downward. The bear flag indicates bearish momentum, anticipating the downtrend’s prolongation.
Bull Flag Pattern vs Flat Top Breakout Pattern
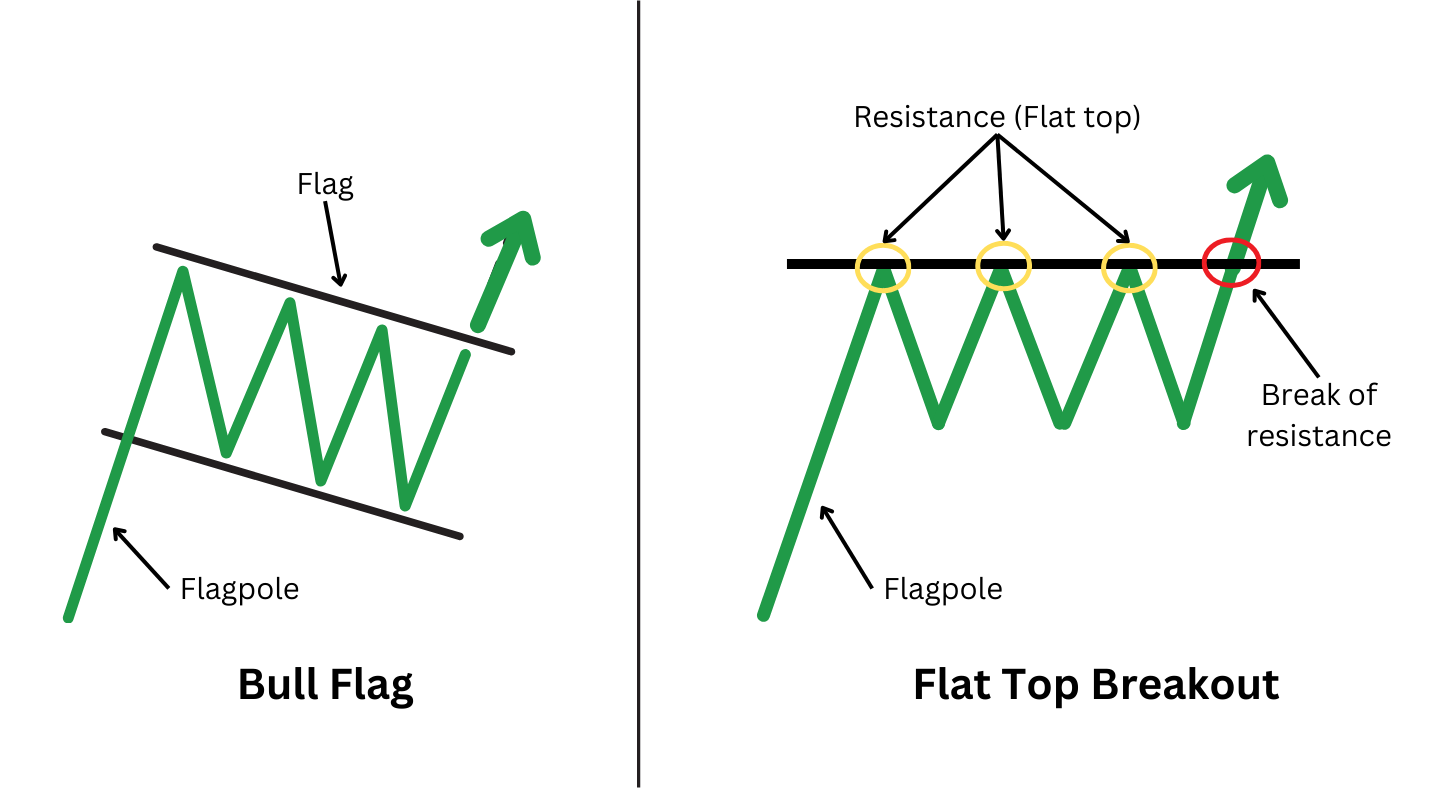
The bull flag pattern signals a continuation of an uptrend, featuring a sharp price increase followed by a brief consolidating period that slopes downwards before breaking higher. A bullish signal suggests the prior uptrend will likely resume after a short pause.
A flat top breakout pattern is identified by a resistance level that the price struggles to surpass on several attempts, creating a ‘flat top.’ The breakout happens when the price closes above the flat top’s resistance, typically on high volume. This indicates the resumption of the uptrend.
Bull Flag vs Bull Pennant Pattern
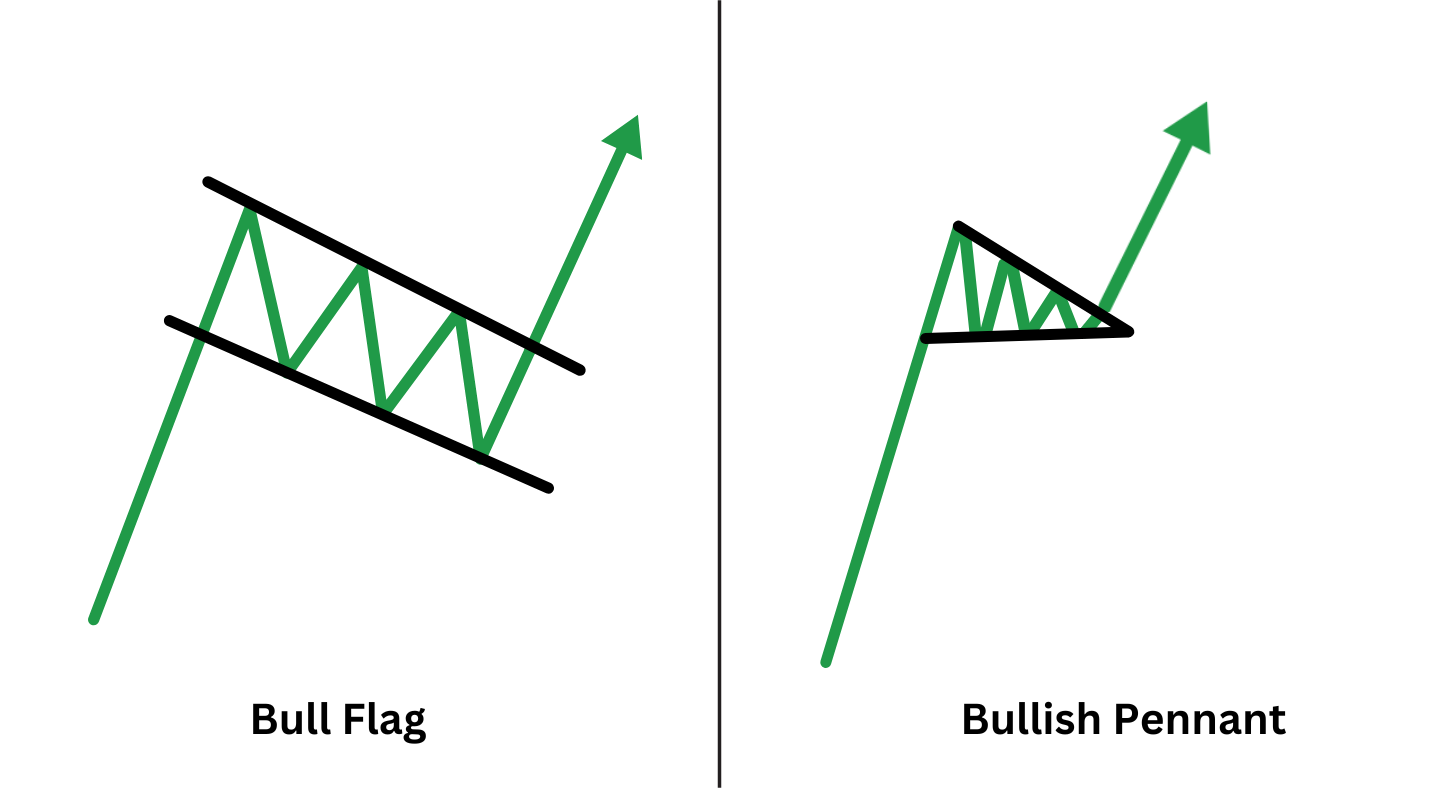
As we already know, the bullish flag consists of the flag pole and the flag, indicating a continuation of the rallying price. A downward-sloping consolidation characterizes the flag formation.
In contrast, the bull pennant pattern also signifies a continuation of an uptrend but differs in its consolidation shape. After a significant upward move, the price consolidates in the shape of a small symmetrical triangle that resembles a pennant with converging trendlines and typically less volume. This pattern suggests that the market is consolidating in a tighter range than the bull flag pattern, often leading to a breakout in the direction of the prevailing trend.
Common Bull Flag Pattern Mistakes to Watch Out For
Deep Retracement Level: A common mistake involves initiating trades when the flag’s retracement is excessively deep. Ideally, the flag should form in the upper half of the flag pole. A retracement beyond 50% means the asset requires more energy to reach its previous high. Running on fumes, the asset is more likely to struggle to break higher, increasing the likelihood of a false breakout or bearish reversal.
Overlooking Volume Dynamics: A notable decrease in volume during the flag formation, followed by a significant upward spike on the breakout, illustrates buyers are still interested. A different volume profile can misjudge the pattern’s strength, potentially resulting in premature or misguided entries.
Stop Loss Levels: Properly setting stop-loss orders is important to managing risk. Placing the stop loss just below the flag’s lower boundary can help safeguard additional account losses against deeper downward price movements. However, setting it too close to the entry point may lead to unnecessary exits due to normal price fluctuations, while placing it too far might expose you to higher potential losses.
What Is The Psychology Behind The Bull Flag Chart Pattern
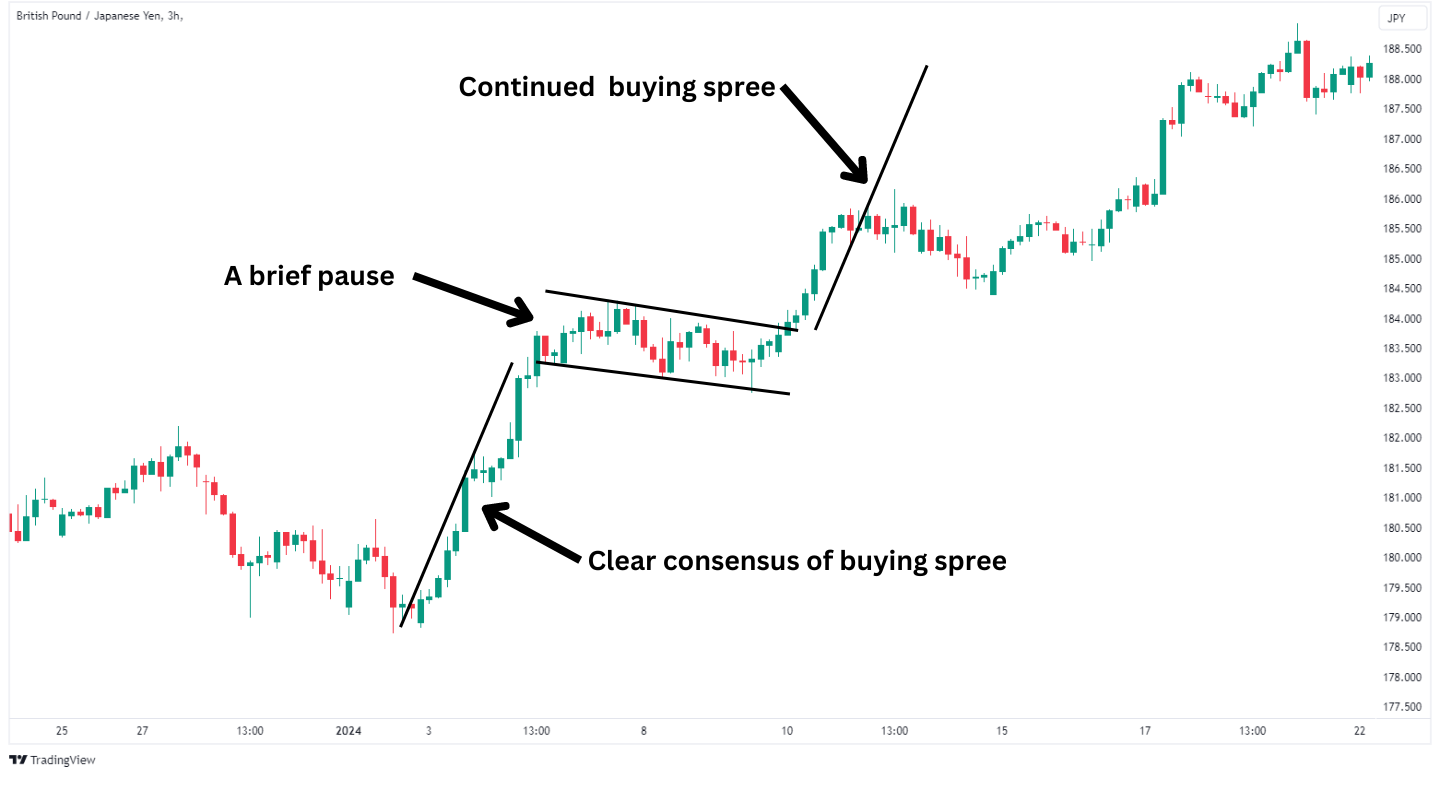
The bull flag chart pattern reflects the psychology behind the bullish market sentiment. It begins with a sharp price increase, forming the flag pole and indicating a strong bullish response from traders who drive the price up. This price rally suggests buyers are aggressively bidding prices up and they are overwhelming the sellers.
After the initial surge, the flag phase represents a brief consolidation period, allowing the market to catch its breath after the rapid ascent. This consolidation is not a signal for reversal but a momentary respite within an ongoing bullish trend. Here, some sellers might enter the market thinking the price has rallied too far. Additionally, previous buyers might sell some to lock in profits. In essence, the buying stops and a few sellers enter the picture and the price drifts lower.
Then, volume dries up to where the sellers are absent. Buyers see this as a signal that the price may rally and they return to purchase more.
FAQ
How reliable is the bull flag pattern?
The reliability of the bull flag pattern depends on a few factors plus when the trader spots and enters the trade. The reliability of the pattern is enhanced by an increase in volume during the breakout. Also, when a trader can enter as close to the point of breakout as possible, it will help keep the risk-to-reward ratio in check.
When do bull flag patterns fail?
Bull flag patterns are more susceptible to failure when the flag corrects more than 50% of the flagpole’s advance. This is due to a lot of energy spent to rally prices back up to the old high leaving little energy for a successful breakout higher.
What is a failed bull flag?
A failed bull flag pattern occurs when prices fail to produce the expected outcome of generating a measured move break higher. In lieu of continuing the uptrend, the price breaks down below the lower boundary of the flag portion. This is part of the reason why we suggest a stop loss price level just below the flag.
How often do bull flag patterns occur?
Bull flags, and their cousin the bull pennant, tend to occur frequently in markets experiencing strong uptrends. This is usually the result of a market event that has caused a large bullish shift in pricing in a short period of time.
Is a bull flag pattern a continuation or reversal pattern?
A bull flag pattern is considered a continuation pattern, signalling that the prior uptrend is likely to resume after a brief period of consolidation.
What technical analysis indicators are used with bull flags?
Technical analysis indicators commonly used with bull flags include volume for breakout confirmation and the Fibonacci retracement tool to determine the depth of the flag.
What timeframe of price charts do bull flag patterns form on?
Bull flag patterns can form on various timeframe price charts, from short-term intraday charts like 1-minute or 5-minute charts to longer-term daily, weekly, or monthly charts, making them versatile for different trading strategies.


