


Written by:

Reviewed by:

Bullish
- May 10, 2024
- 16 min read
Falling Wedge Pattern – Strategies for Savvy Traders
The falling wedge is a naturally occurring pattern that can be found on any price chart. It often forecasts a bullish reversal and has a 68% chance of breaking out successfully. Learn about how it works, and how you can trade falling wedges effectively in this article.
Key Takeaways
- A falling wedge is a bullish chart pattern that forecasts a price rise.
- The price target of a falling wedge is the top of the pattern.
- Falling wedges can overshoot or undershoot their price targets.
What is a Wedge Pattern?
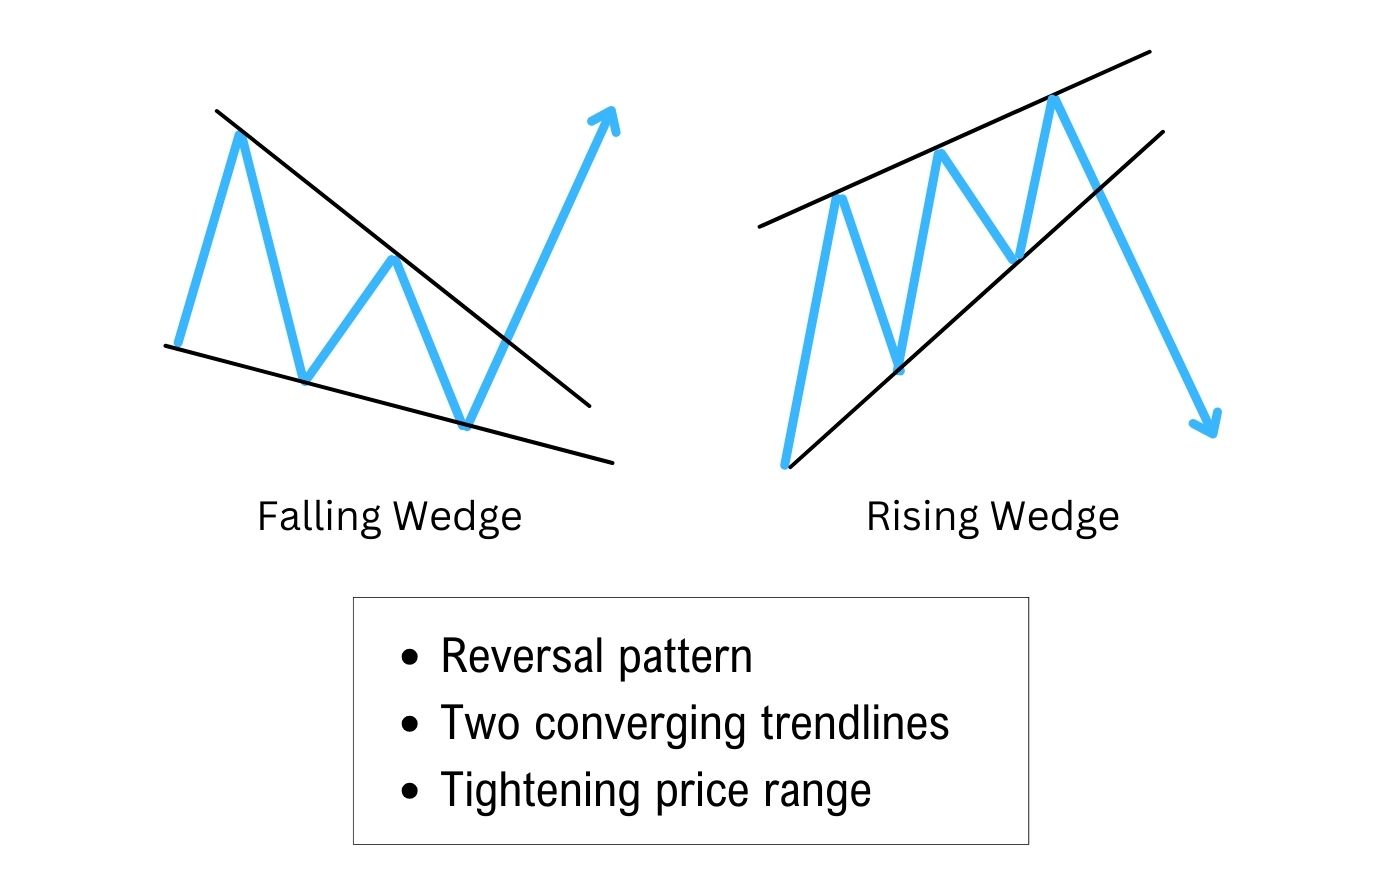
A wedge pattern is a reversal pattern that emerges from a downtrend. It’s recognisable with its distinct shape of two trend lines that are downward-sloping and converging. As the trend lines get closer, the price bounces between them, coiling up like a spring, which leads to an eventual breakout.
There are three types of wedge patterns, the falling wedge, rising wedge, and broadening wedge.
What is a Falling Wedge Pattern?
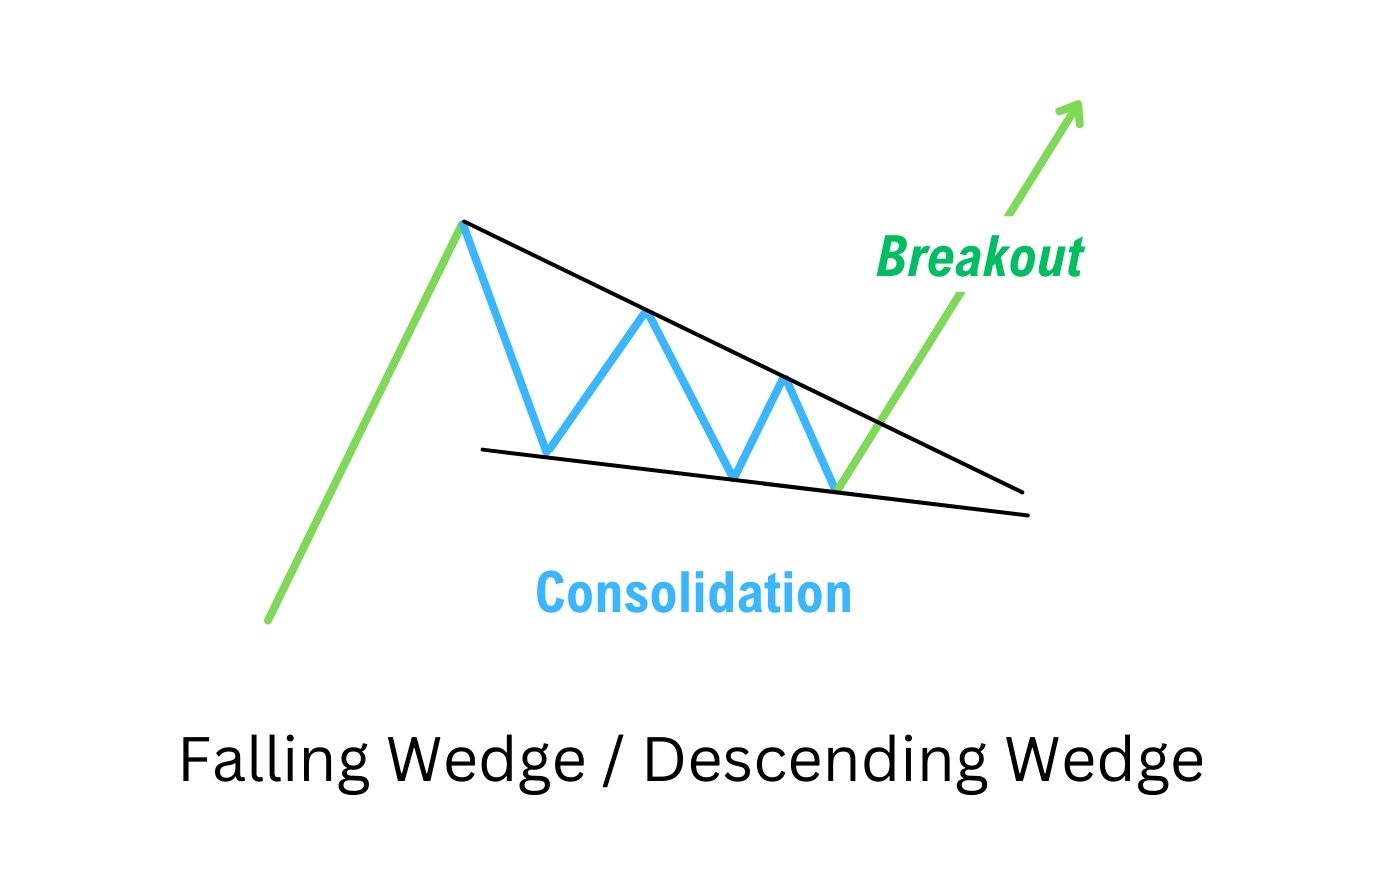
The falling wedge, also known as the descending wedge pattern, is a technical analysis pattern that signals the end of a downtrend, and a possible bullish trend reversal.
The falling wedge pattern signals a bullish reversal when forming during a downtrend and has two trend lines which are sloping downwards. These trend lines are converging together, which means they will eventually cross at some point in the future.
This pattern is versatile and can be found on any timeframe, and appears during an overall uptrend, or an overall downward trend.
How often does a Falling Wedge Pattern break out?
Falling wedges are high-probability patterns that mostly break out to the upside. According to Liberated Stock Trader, the pattern is 74% accurate in detecting a significant move – with 68% of these breakouts occurring to the upside, and 32% occurring to the downside.
How to Recognise a Falling Wedge Pattern
A falling wedge is best identified when an asset is trending lower. Take note of the locations of the pivot highs and pivot lows – are they getting closer and closer?
If they are, then you may have a falling wedge in the making. To confirm this, draw a trend line that connects the pivot highs. Then, draw another trend line that connects the lows.
Both lines should be moving towards each other and slanted downwards, which creates the unique shape of a falling wedge.
What are the Characteristics of a Falling Wedge Pattern?
A valid falling wedge meets the following criteria:
- Trendlines: Both trend lines converge on each other and are pointed downwards.
- Downtrending: The price is forming a downtrend (higher lows, lower lows).
- Consolidation Zone: At least 3 touchpoints at the trendlines.
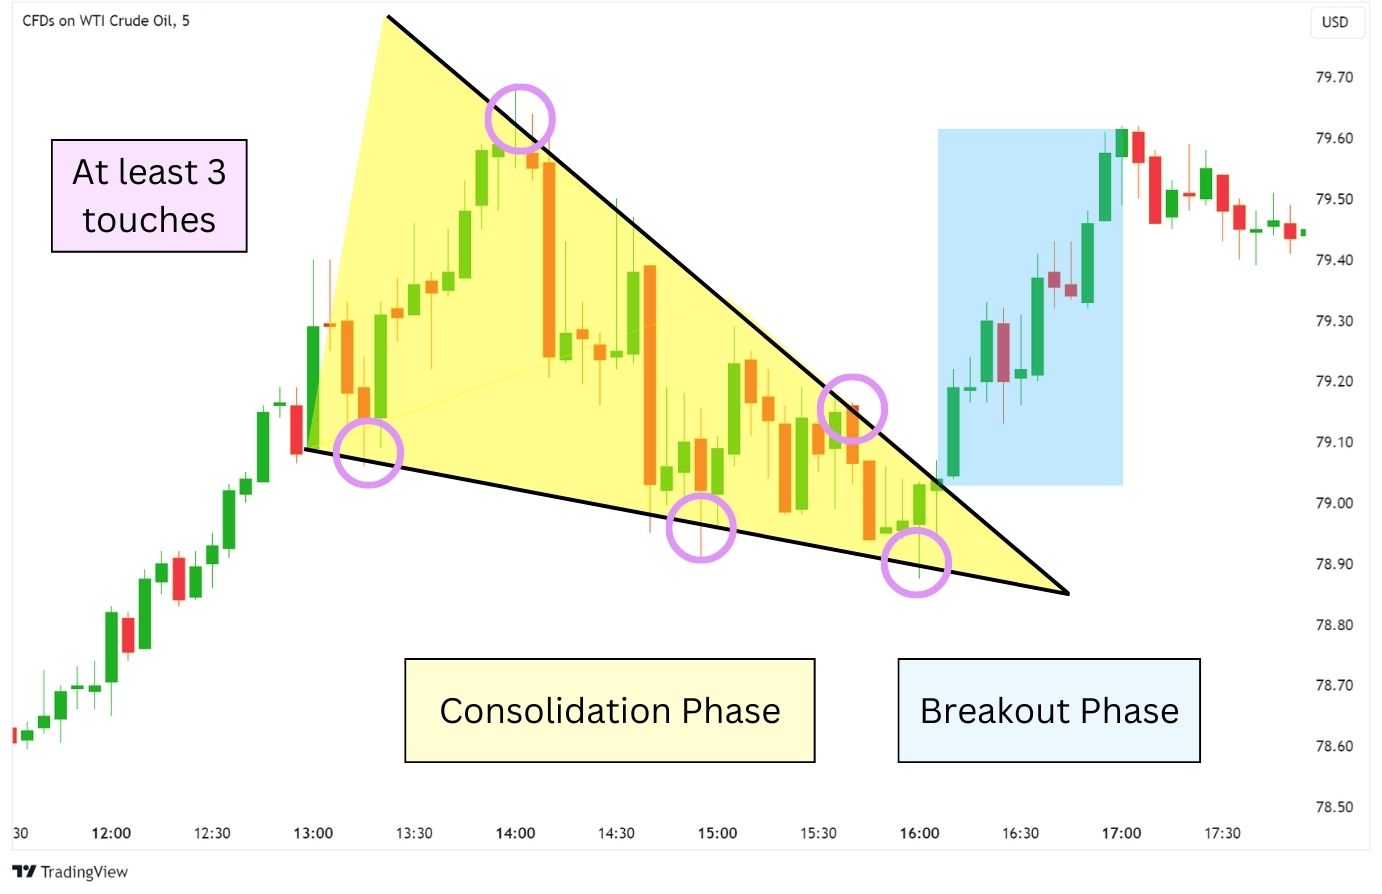
Additionally, the falling wedge has a consolidation phase and a breakout phase. During the consolidation phase, candlesticks will move in between the range created by the trendlines.
During the breakout phase, a candlestick should successfully close above the pattern – eventually bringing the price up to approximately the highs of the wedge. This typical price target of a breakout is also called the measured move target.
What happens after the Falling Wedge Pattern?
After reaching its price targets, an asset may behave as follows:
- Overshoot the target and form a new high.
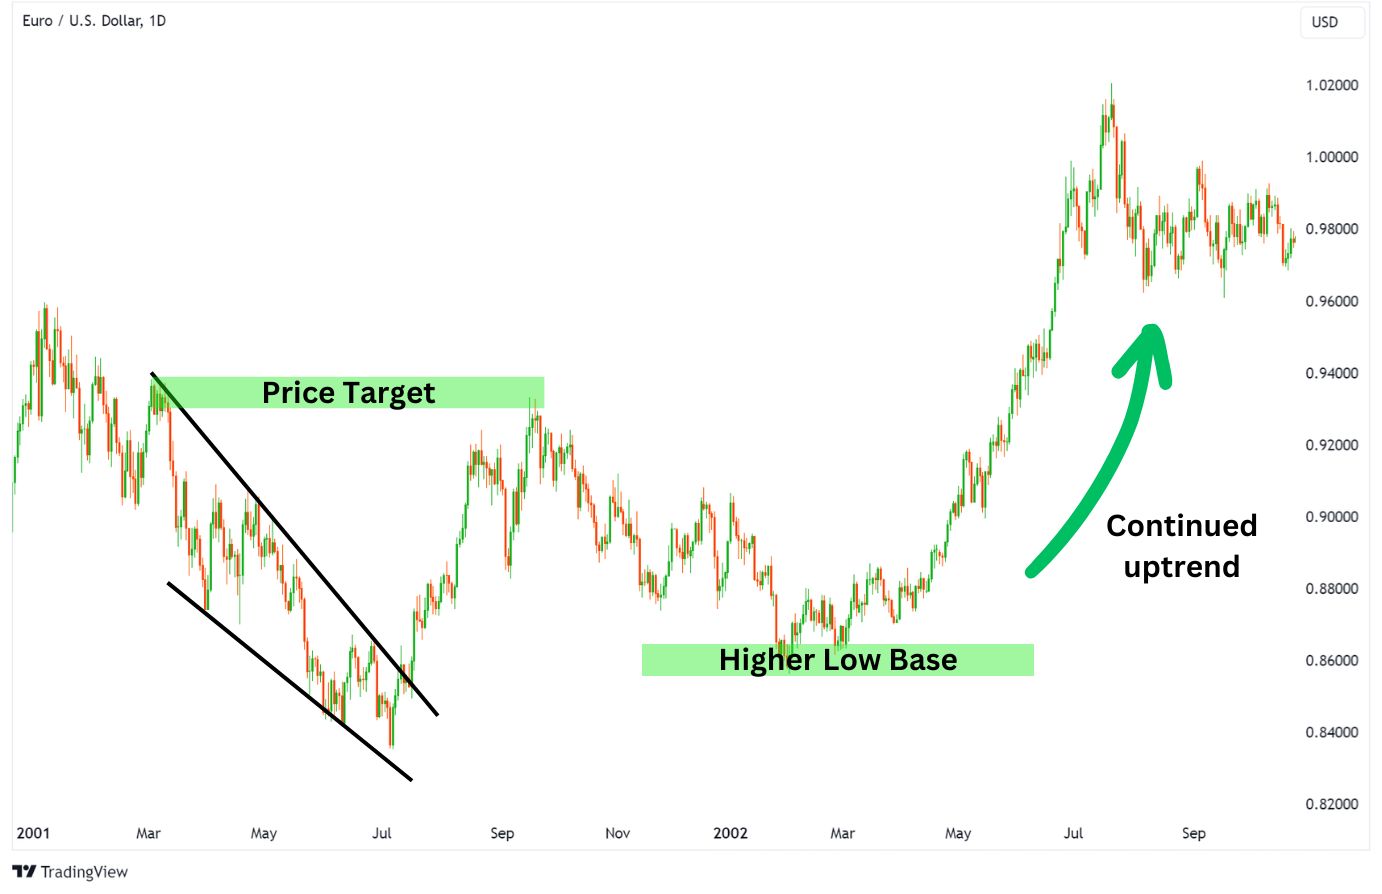
- Get rejected, form a base in a higher low, and reverse into a continued uptrend.
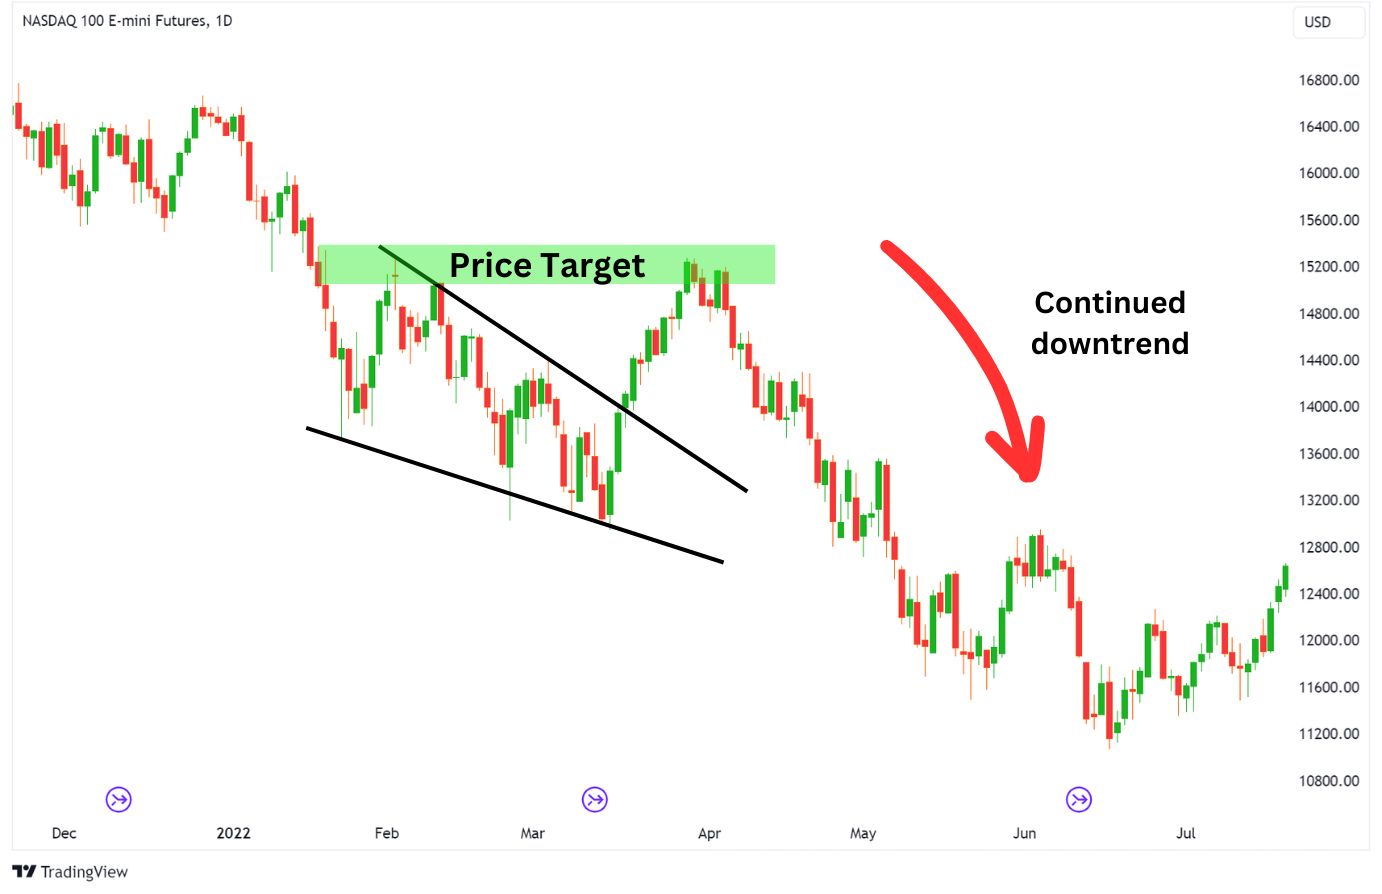
- Get rejected and resume a downtrend.
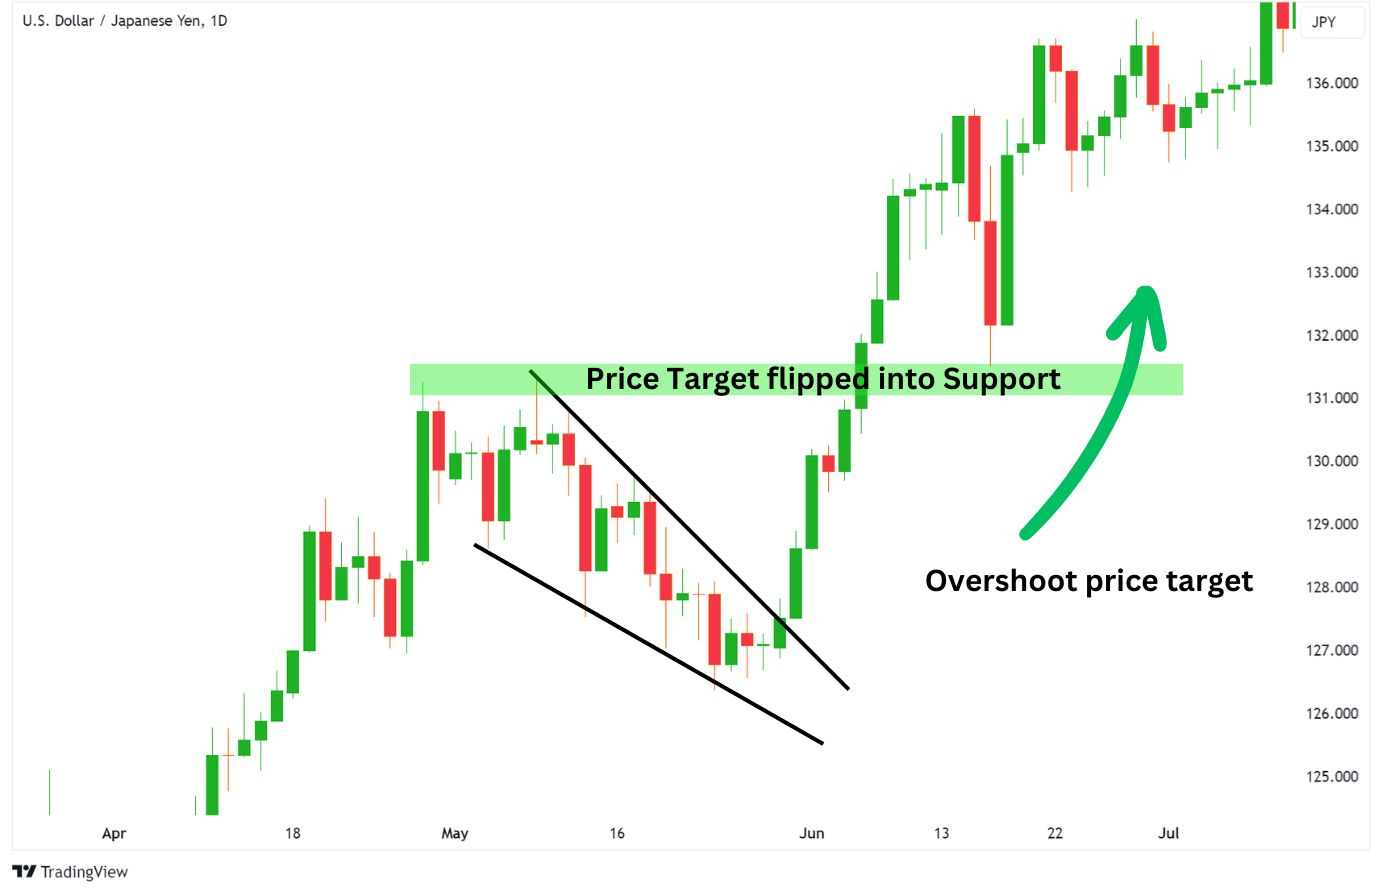
The likelihood of each scenario will depend on the overall, bigger trend direction. If the broader trend direction is up, then the falling wedge will be seen as a continuation pattern suggesting that new higher highs are around the corner. That would lead towards price overshooting the target to form a new high.
The wedge as a continuation pattern could also lead to scenario #2 above where a higher low base is formed resulting in higher highs.
Conversely, if the broader trend direction is down, The falling wedge could be seen as a bullish reversal pattern that leads to new higher highs in price. However, be mindful that a falling wedge within the context of a downtrend may lead to price getting rejected at its price target zone (or even earlier) and resume a downtrend.
When to Trade a Falling Wedge Pattern
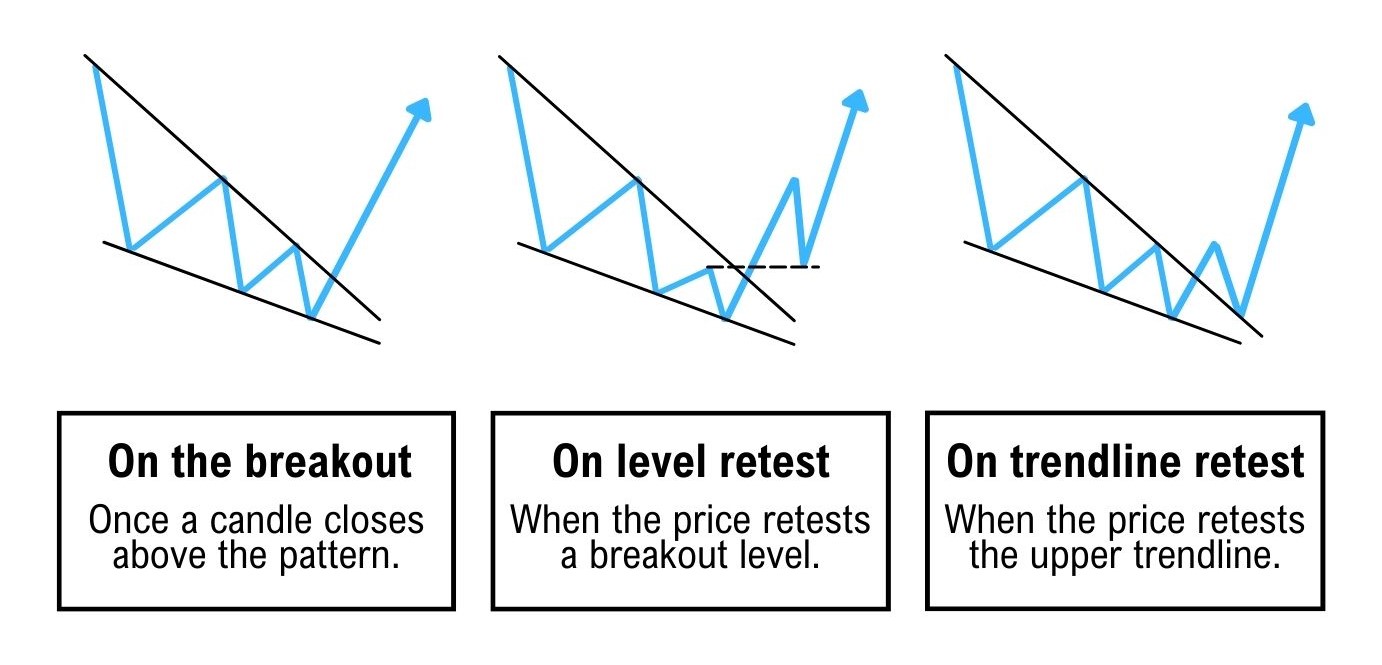
There are three main ways to trade the falling wedge:
- Wait for a candle to close above the upper trend line of the pattern.
- Wait for a retest of the breakout level (usually coincides with previous high).
- Wait for a retest of the upper trend line.
A falling wedge pattern should only be traded when the price breaks above the upper resistance line and when there is a confirmed candle close above the pattern. This adds confidence to the trade’s success.
If you missed the initial breakout, you can always look for a retest as an alternative entry.
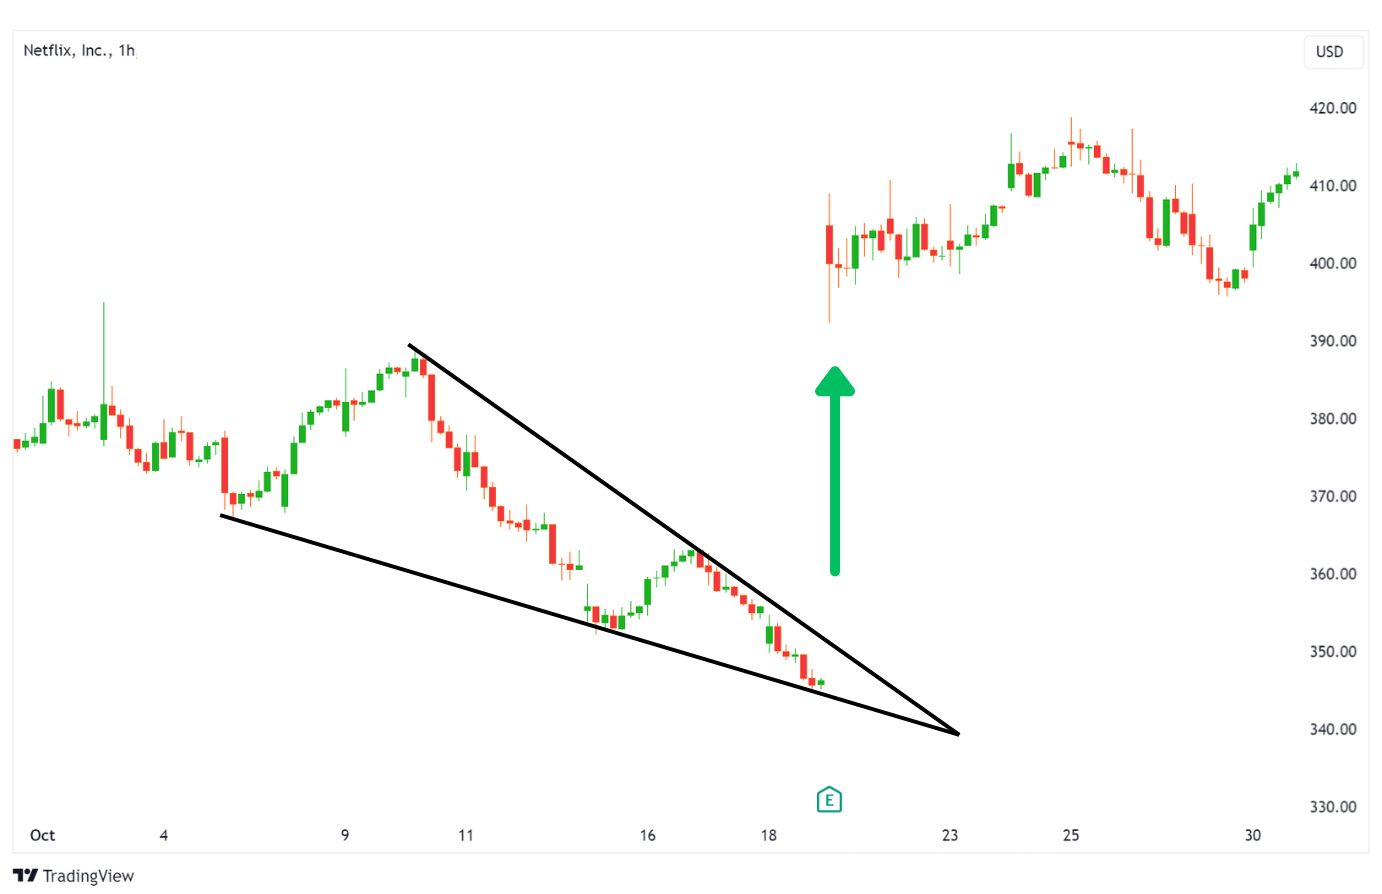
Falling Wedge Pattern Example
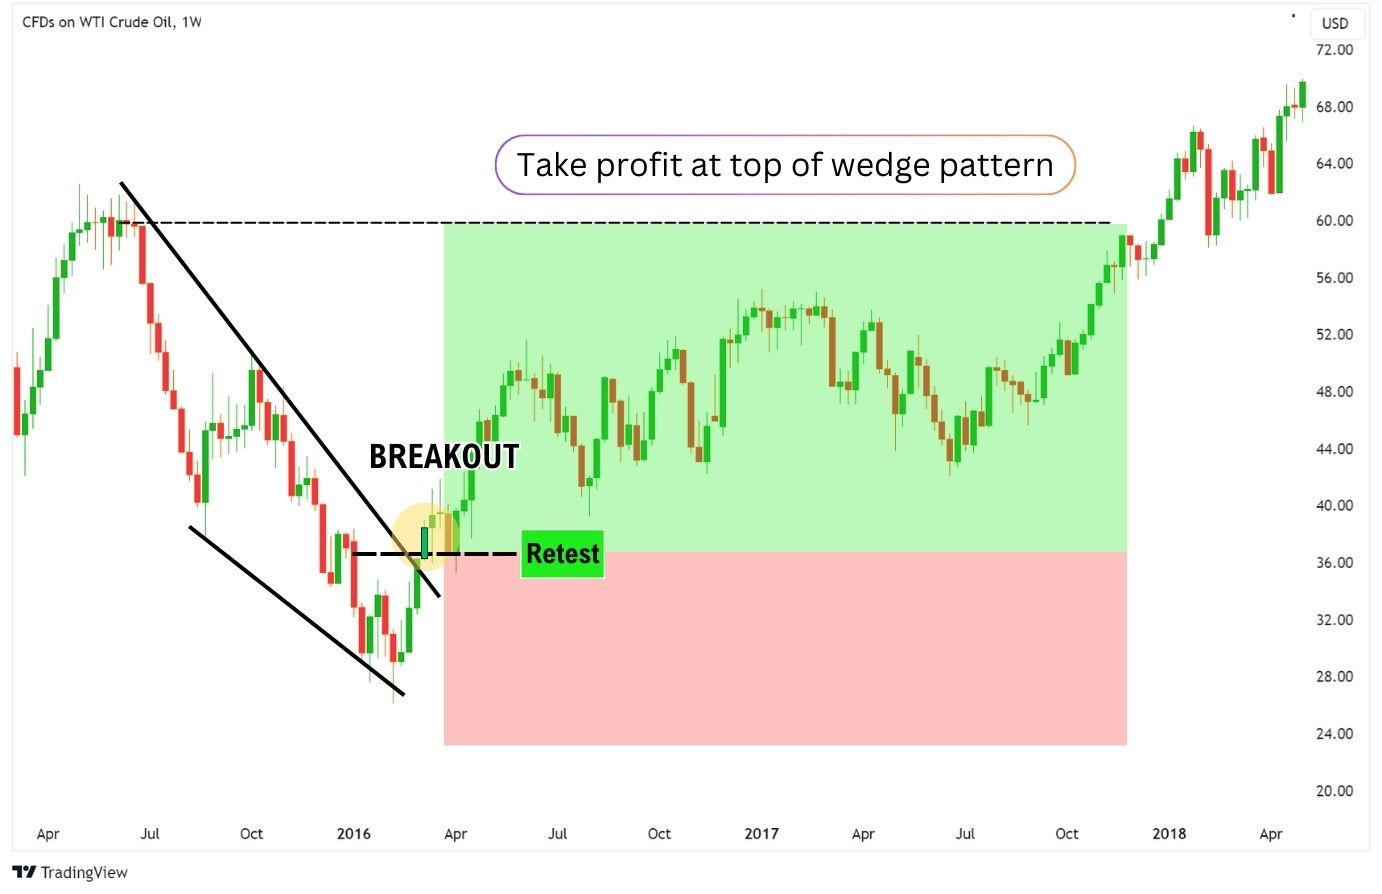
Here is an example of a falling wedge on the USOIL price chart, on the 1-week time frame. Notice how the falling wedge has the following characteristics:
- Two converging downward trend lines form the falling wedge.
- At least 3 touchpoints on the trend lines.
- A successful green candle closed above the pattern.
After a confirmed break of the falling wedge, we can start looking for long positions either at market price, or wait for a retest. In this case, the price comes back to retest the breakout level, giving us an entry at approximately $37.
The price rallies to the top of the wedge at approximately $60, a rally of nearly 62%.
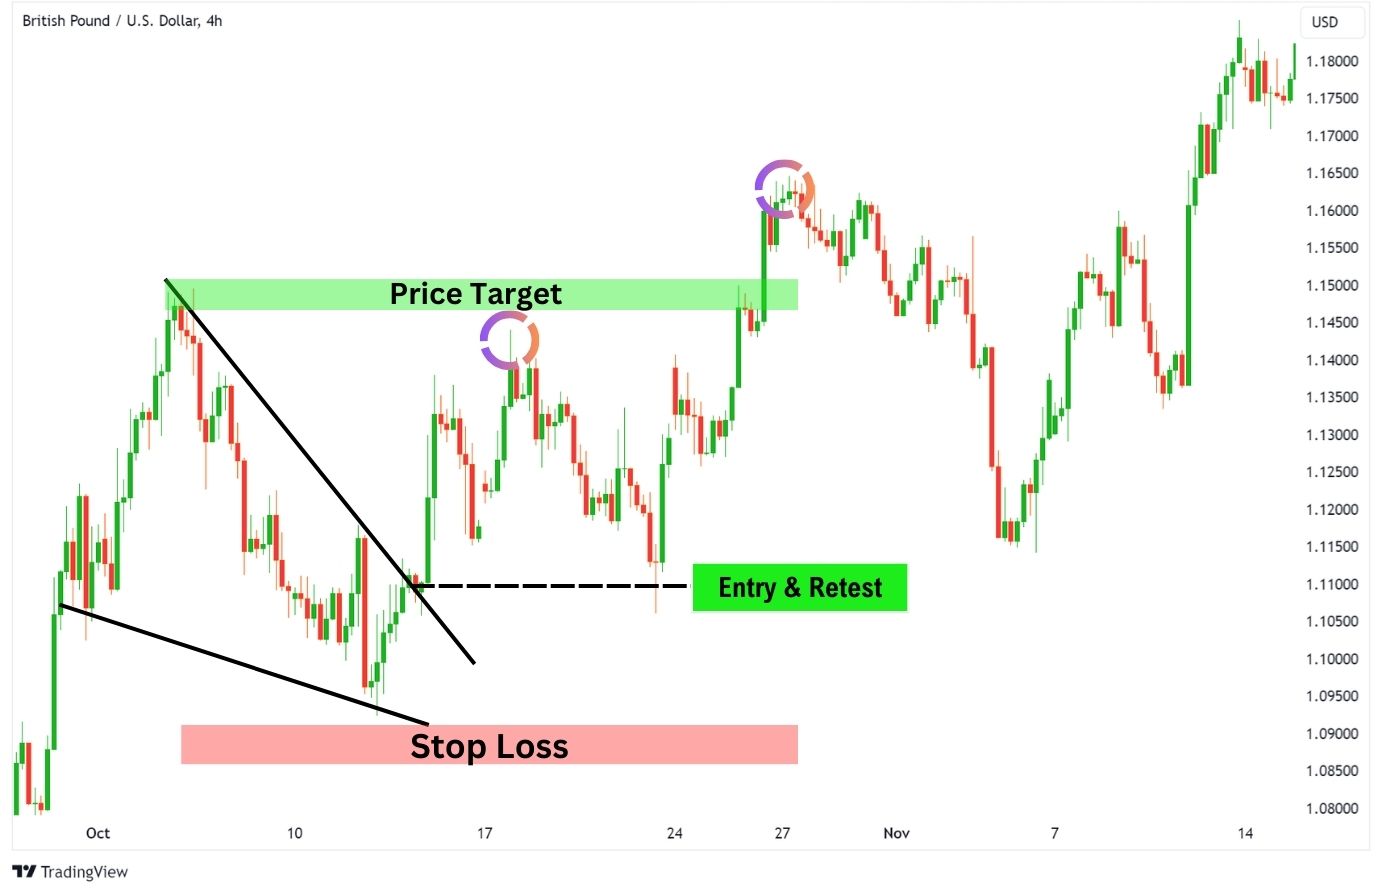
What is the Take-Profit Target for a Falling Wedge Pattern?
A falling wedge’s take-profit target is at the top of the pattern. However, it is not uncommon for the price to front-run or overshoot the price target. These deviations happen because the falling wedge is a manually drawn chart pattern, which means price targets will differ from trader to trader.
To avoid your take-profit not being met, we recommend placing the take-profit just a little lower than your price target. This will allow you to capture the majority of the price move the wedge tends to experience.
See how the price undershoots the initial target on the GBPUSD example, only to then retest the breakout level and overshoot the target. If you had taken profits initially, you could have reentered the trade and made profits from the second price rise.
What is the Stop-Loss for a Falling Wedge Pattern?
A falling wedge’s stop loss is placed below the most recent pivot low, which is usually below the entire pattern. This will provide a decent risk-to-reward ratio that is close to 1:2 or better.
What is the Best Trading Strategy for a Falling Wedge Pattern?
There is no so-called “best strategy” for trading a falling wedge, as results can vary based on the timeframe and the asset’s volatility.
However, you can improve your ability to spot falling wedge opportunities by using indicators, such as the RSI, MFI, and MACD. You can also use moving averages to help you only take breakouts going in a bullish direction.
Using Exponential Moving Averages
Moving averages are common methods of identifying the market environment. They can also act as dynamic support and resistances. When the price is above a moving average, it is considered bullish. When it’s below, it’s considered to be bearish.
One of the most commonly used Exponential Moving Averages (EMA) are 20, 50, 100, and 200 periods. In this strategy, we will be using the EMA 20.
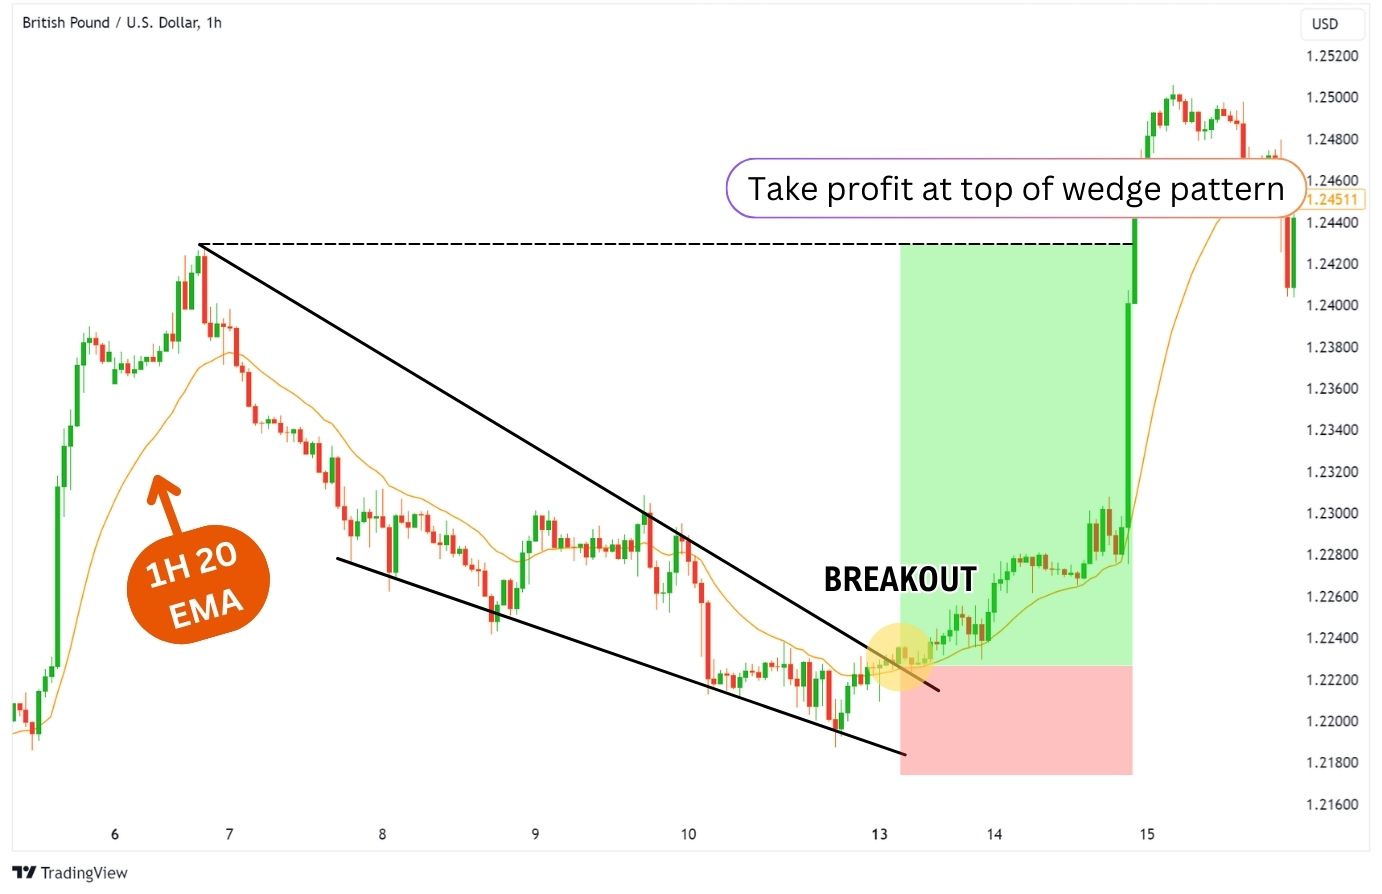
The idea with this strategy is to only enter a long position when the price has broken above the pattern and also stays above the 20 EMA. This tells us that the moving average is no longer acting as a resistance, and is supporting the price for further upside.
- Enter a trade when the price is above 20 EMA, and has broken out of the falling wedge.
- Take profit at the wedge top.
- Stop loss at the previous pivot low.
Using Divergences with Other Indicators
Divergences can often reveal weakening momentum in a price move. The existence of a bullish divergence can alert us to a possible falling wedge formation. Furthermore, it adds confidence that the falling wedge’s bullish reversal will be successful.
1. Using Divergences with RSI
For instance, in this TSLA 1D price chart, we can see the price made lower lows while the RSI made higher lows. This indicates that selling pressure is weakening.
When combined with the signal of a falling wedge and above-average volume, this makes the breakout more reliable.
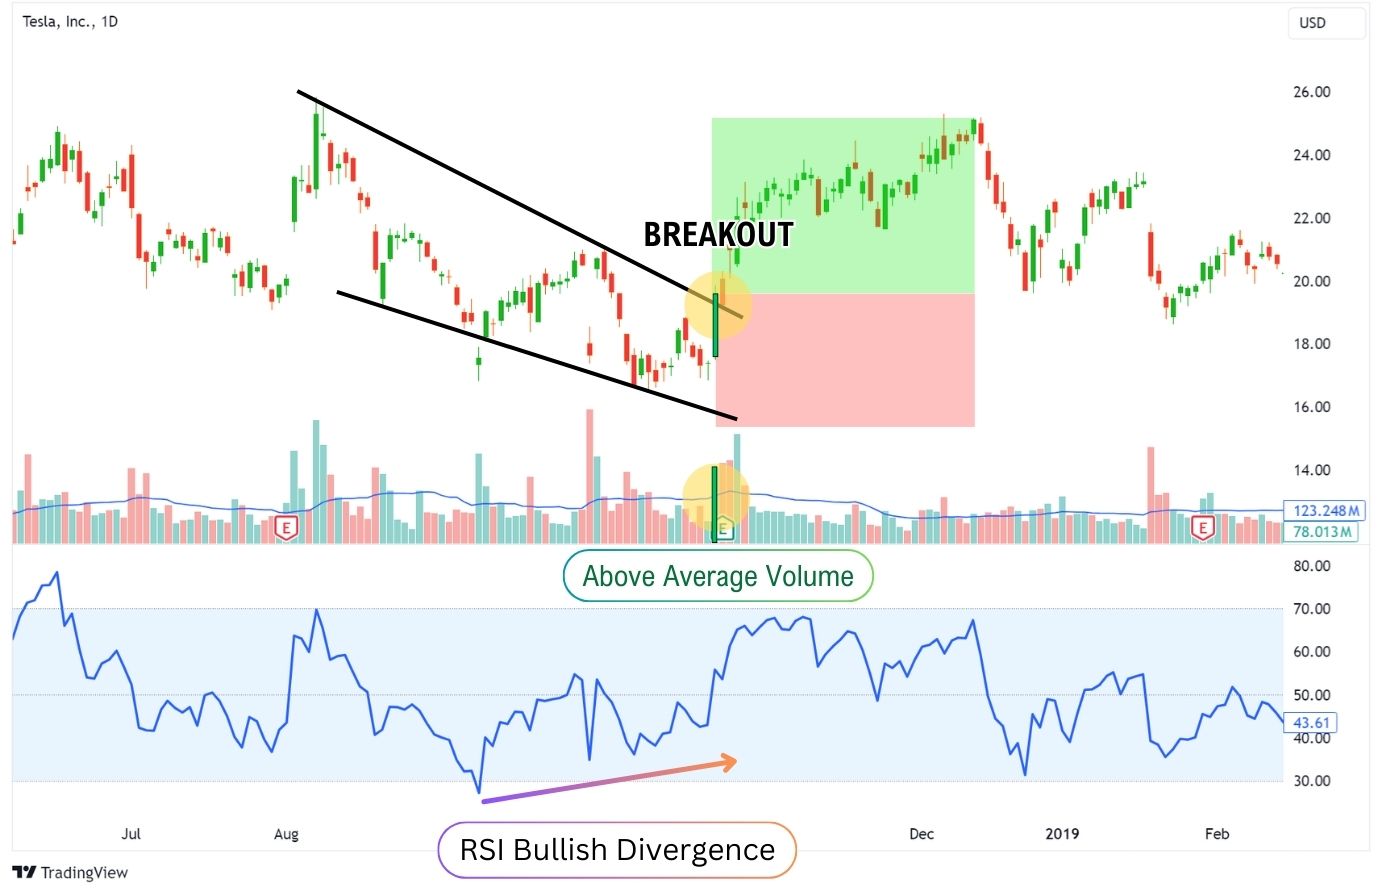
| Quick note on volume: Higher volume can be defined as a volume candle bar that exceeds the volume moving average, which is set to 20 periods on TradingView. |
2. Using Divergences with MFI
However, what if we don’t find a divergence using the RSI? Fortunately, the use case of divergences isn’t limited to the RSI alone.
Let’s take a look at the Money Flow Index (MFI).
The MFI represents how much money is entering or exiting the market. The higher the MFI is, the higher the buying pressure is, and it suggests that price is likely to move up due to money “flowing” into the market.
When you combine this concept with the falling wedge, you can find more confidence in entering, or even staying in a long position.
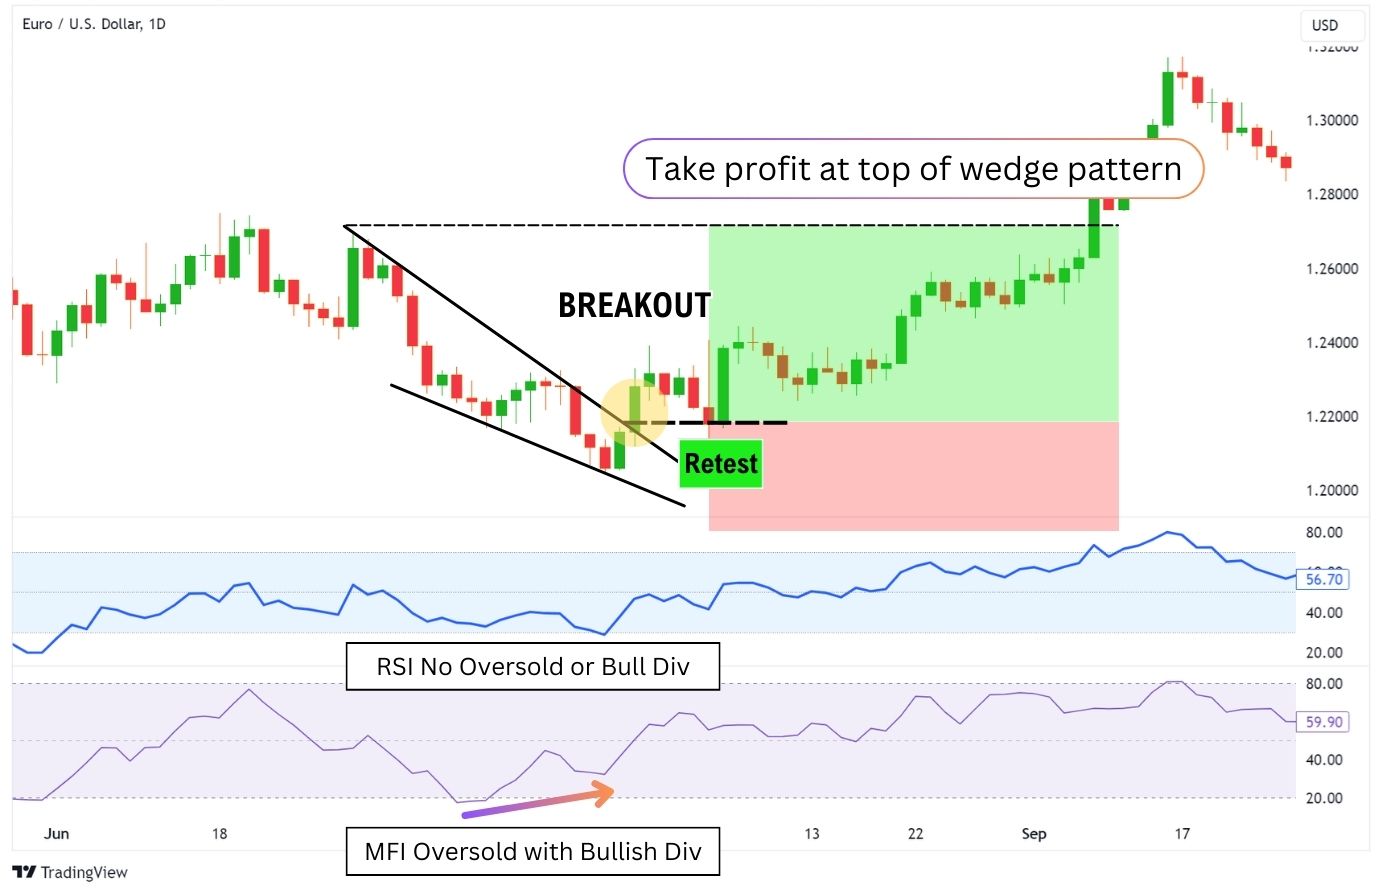
In this EURUSD example, the falling wedge is formed with a MFI bullish divergence, leading to a breakout from $1.22 to newer highs at $1.32 – an impressive 1% gain!
3. Using Divergences with MACD
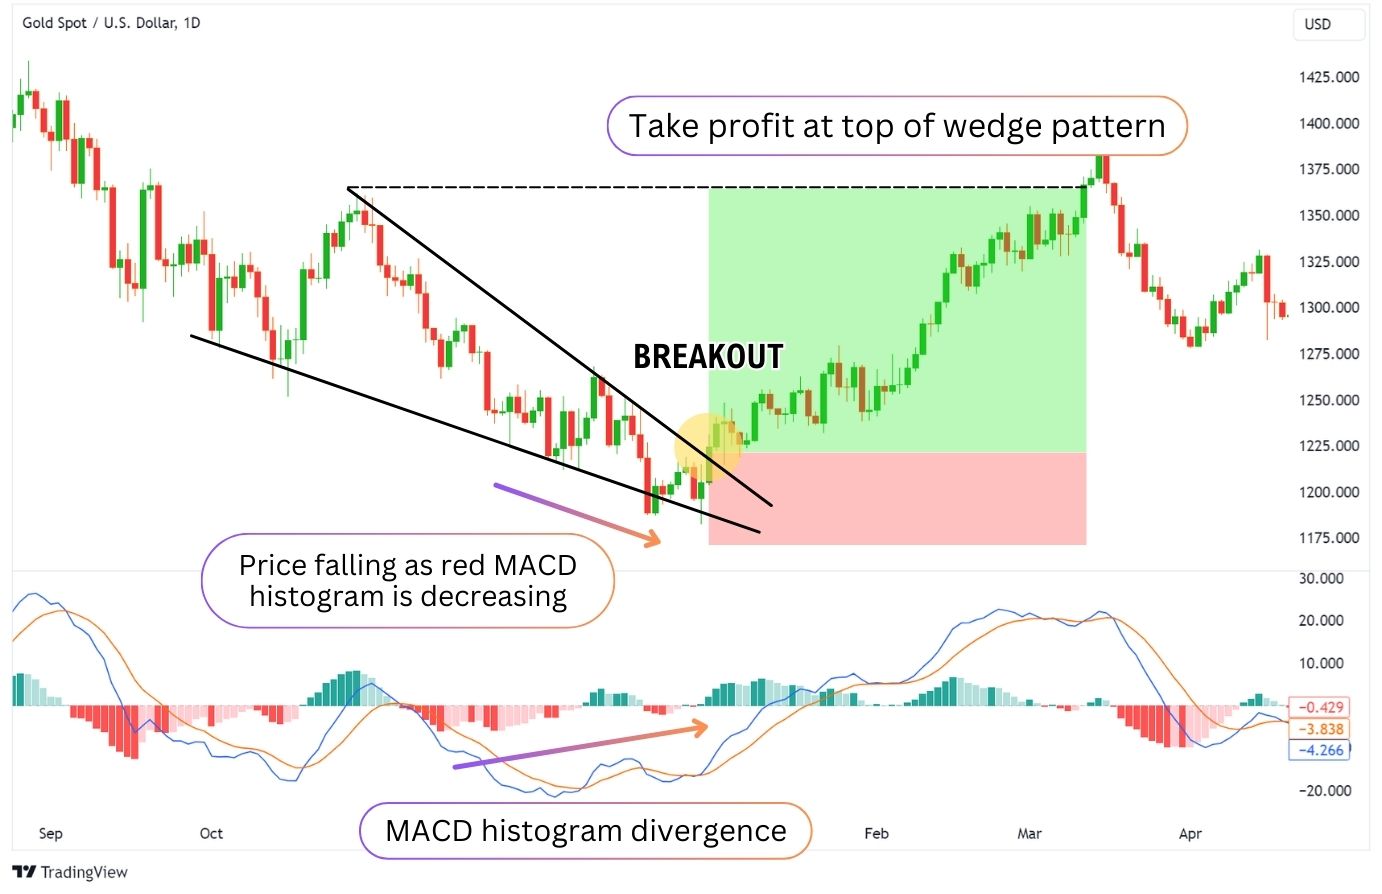
Similarly, the ultra-versatile MACD can be used as a divergence indicator. You can either look at the lines, or the histogram (the green and red bars that look like waves) to find a divergence.
In this example, we’ll be using the histogram. The red and green “waves” represent the distance between the two lines. Whenever the wave is green, it means there is stronger bullish momentum. Conversely, whenever the wave is red, it means the bears are in control.
However, the best way to interpret the histogram is by looking at the height of the waves in relation to its previous heights. If the red waves are getting smaller, this means that bearish momentum is decreasing.
When the price is falling while the red waves are decreasing, we have what’s known as a bullish divergence. This tells us that the price fall is slowing down, and we may begin to see a reversal soon.
Overall Notes on Falling Wedge Divergence Strategy
Overall, these would be the key factors you would use to trade the falling wedge with divergences:
- Look for a bullish divergence as the price is falling.
- When there is a confirmed breakout candle, enter a long position (or enter on retest).
- Take profit at the wedge top.
In essence, a bullish divergence tells us that selling pressure is slowing down, and/or buying pressure is picking up. This provides us with extra confidence that the trade will work out.
Remember, you can trade the falling wedge without indicators. They are only here to help you:
- Identify the potential formation of a falling wedge.
- Gain more confidence in entering a long position.
Indicators do not raise the falling wedge’s success rate to 100%, meaning that risk management is still going to be your number one priority as the trade has a chance of not working in your favour.
What Trading Indicators Are Best to Use with a Falling Wedge Pattern?
When trading the falling wedge pattern, combining chart patterns with technical indicators can enhance the accuracy of your trades. The most useful indicators include:
- Volume:
A volume surge during the breakout from a falling wedge validates the pattern’s predictive power. A significant increase in volume suggests strong buyer interest and a higher probability of a successful breakout. - Oscillators with Divergence:
Indicators like the Relative Strength Index (RSI), Moving Average Convergence Divergence (MACD), and Money Flow Index (MFI) are useful for spotting divergences. Divergence occurs when the price makes a new low, but the indicator does not, indicating weakening downward momentum and a potential reversal. - Moving Averages:
Moving averages come in several types: SMA, EMA, VWMA, RMA… the list goes on. It’s about finding the moving average indicator that you are most comfortable with using. Most traders rely on the SMA or EMA to help them determine a trend, or find dynamic support and resistances.
Falling Wedge as a Reversal Pattern
Sometimes wedges appear at the end of long downtrends. As the market is falling aggressively, buyers become more tempted to step in due to the apparent cheap and oversold levels. At this point, the pace of the downtrend begins to slow down, and the price slops around. The aggressive downtrend then morphs into a choppy downward drift creating the descending wedge pattern.
This combination of market trends sets the table for a bullish reversal carrying prices back up to the top of the wedge pattern.
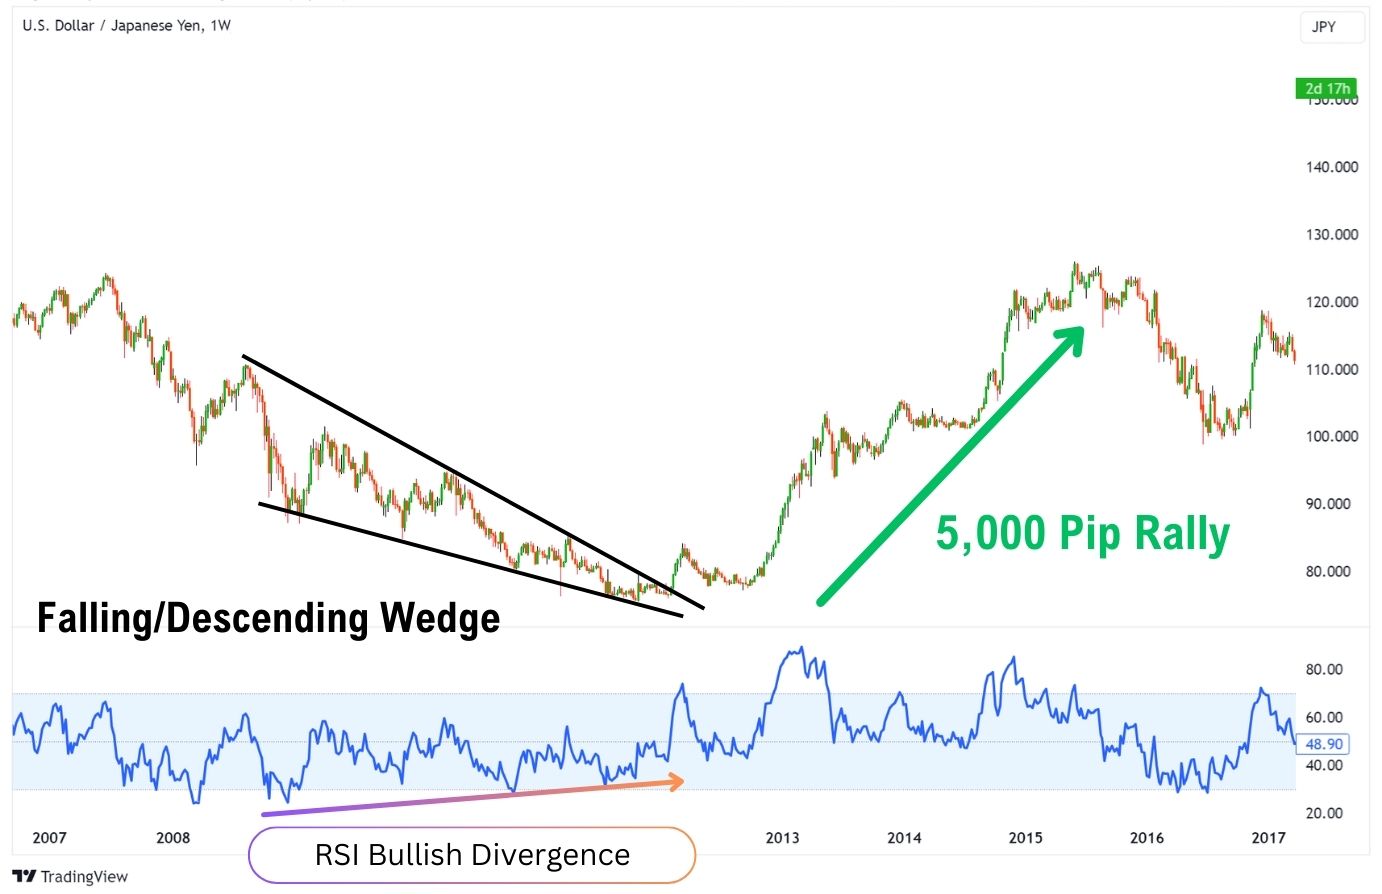
Above is USDJPY from 2007-2017. Towards the end of a long decline, a descending wedge pattern formed. Simultaneously, RSI divergence appeared. The falling wedge pattern then led to a large reversal of nearly 5,000 pips over the next several years.
Falling Wedge as a Continuation Pattern
During powerful uptrends, a falling wedge can form as prices are falling. This is very bullish and suggests a level of FOMO (fear of missing out) from market participants, as they are reacting to discounted prices and hurrying to buy it up as it declines. Eventually, there will be fewer sellers than buyers, which leads to a breakout and continuation of the uptrend.
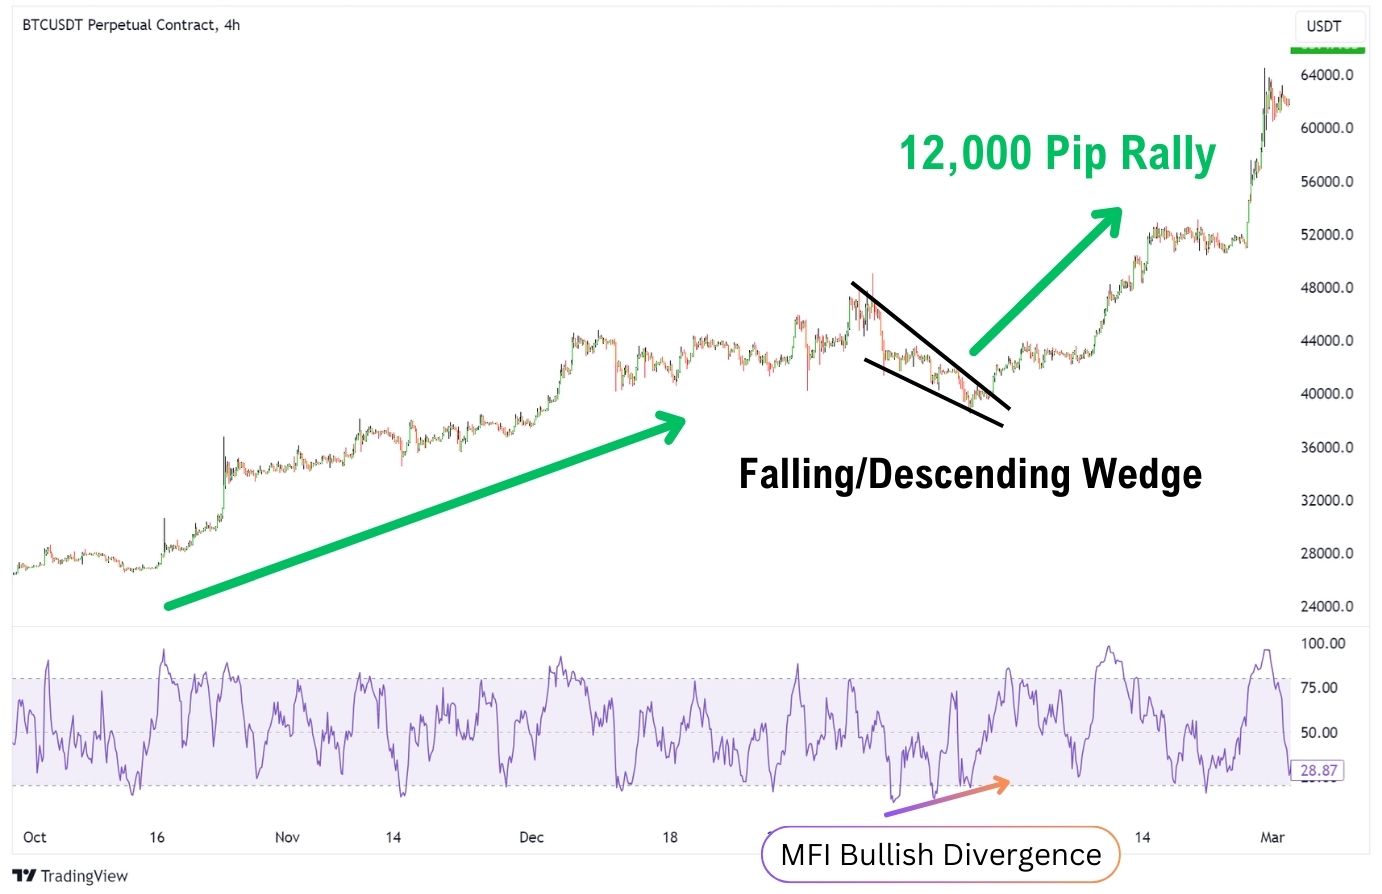
Above is BTCUSDT from October 2023 to March 2024. Towards a temporary peak on January 15th, 2024, Bitcoin begins to retrace for the entire remaining month of January. Simultaneously, MFI divergence appeared. The falling wedge then led to a breakout of approximately 12,000 pips over a month’s time, before once again consolidating.
Advantages of Trading the Falling Wedge Patterns
- High Risk-to-Reward Ratio (RRR) for Swing Trading:
On 4-hour price charts or higher time frames, the falling wedge can provide a high RRR swing trading position. In the context of a broader uptrend, a falling wedge can be a great entry into a buy-and-hold position, making for a comfortable trading experience. - High Probability of Success:
The falling wedge pattern is known for its reliability, offering a high chance of a positive outcome. This can be further improved with the use of indicators. - Suitable for Scalp Trading:
Scalp traders can also use the falling wedge pattern to make quick, small trades. This pattern’s flexibility means it can be applied to short-term trading, letting traders take advantage of slight price movements. However, the risk-to-reward ratio in scalping may be lower, requiring precise timing for entering and exiting trades.
Disadvantages of Trading the Falling Wedge Patterns
- Challenging to Spot:
Spotting a falling wedge pattern early can be tricky because its formation is subtle and gradual. Traders often notice the pattern only when it’s close to completion or after the price has already broken out, potentially missing the best entry points.
- Drawing Trendlines Can Be Tricky:
Identifying this pattern accurately depends on drawing trend lines that connect highs and lows correctly. However, shifting price action might require adjusting these lines, making it challenging to identify the pattern confidently.
- Risk of False Breakouts:
Although the falling wedge is generally reliable, there’s a risk of false breakouts where the price moves in the opposite direction of the expected trend after breaking out. This scenario highlights the need for additional confirmation, like volume analysis or other indicators, to ensure the breakout is genuine before making a trade.
Common Falling Wedge Mistakes to Look Out For
- Ignoring Market Structure:
Entering trades without considering the overall market structure, such as resistance levels just above the pattern, can lead to failed breakouts. - Setting Take-Profit (TP) Too Early:
Exiting trades too early, without observing the market structure for potential support levels, can result in missing out on larger gains. - Over-Reliance on Volume Confirmation:
While volume is an important confirmation signal, waiting only for a significant volume increase can lead to missed opportunities, especially in markets where volume might not spike as dramatically (e.g., Forex, gold). - Inadequate Stop-Loss (SL) Placement:
The falling wedge can be prone to significant retracements, so having a small stop loss would put you at risk of a premature stop-out. - Not Waiting for Retest:
If the breakout move is extensive, waiting for a retest of the breakout level can offer a better risk-to-reward ratio entry point.
FAQ
How Accurate is the Falling Wedge Pattern?
A good falling wedge pattern is considered highly reliable, with studies showing a significant probability of correctly predicting bullish reversals. However, like all trading strategies, it’s not 100% accurate and should be used with other technical analysis techniques.
Is the Falling Wedge Pattern Reliable?
Yes, the falling wedge pattern is a reliable indicator of potential bullish reversals, especially when spotted in a broader uptrend. Its reliability is higher with increased volume and bullish divergences.
Can a Falling Wedge Pattern Break Down?
While the falling wedge is typically a bullish pattern, it can occasionally break down, especially in strong downtrends with increasing momentum or when the breakout lacks volume confirmation.
Why is Volume Important in Confirming a Falling Wedge Breakout?
Volume plays a critical role in confirming breakouts from the falling wedge pattern. A breakout accompanied by high volume indicates strong buyer interest, enhancing the breakout’s credibility and the likelihood of continuation.
How Long Should the Preceding Downtrend Be for a Falling Wedge to Qualify as a Reversal Pattern?
There’s no fixed rule, but a significant downtrend that allows the pattern to develop over time gives the falling wedge more reliability as a reversal signal. Look for the price to touch the upper or lower trend line at least three times.
What is the Difference Between a Falling Wedge Pattern and a Descending Triangle Pattern?
The key difference lies in their trend lines: a falling wedge has converging trend lines with a downward slope, indicating a bullish reversal. In contrast, a descending triangle has one horizontal trend line acting as the support, and one downward-sloping trend line (resistance), typically indicating bearish continuation.
Who First Identified the Wedge Patterns?
Wedge patterns have been a part of technical analysis for many decades, possibly emerging from the foundational work of pioneers like Charles Dow in the late 19th and early 20th centuries. However, the specific attribution to the original identification of wedge patterns is not well-documented, suggesting a gradual evolution within the technical analysis community rather than a single inventor.


