


Written by:

Reviewed by:

Bearish
- May 31, 2024
- 18 min read
Rising Wedge Pattern: Strategies for Savvy Traders
If you’re looking for trade opportunities, the rising wedge should be in your glossary of chart patterns to look for. This upwards-sloping formation often forecasts an incoming bearish reversal. In this article, you’ll learn all about the psychology behind the rising wedge, how to detect it, and how to trade the rising wedge.
Key Takeaways
- A rising wedge is a bearish chart pattern that forecasts a price move down.
- The price target of a rising wedge is the bottom of the pattern.
- Always wait for a confirmed break out with a closed candle before trading this pattern.
What is a Rising Wedge Pattern?

Uh oh.
The rising wedge pattern is a technical analysis pattern used by traders to anticipate a significant move down in price. The pattern consists of two upward sloping trend lines that will eventually connect with each other.
While the rising wedge is mostly looked at as a reversal pattern, it can also be a continuation pattern. The formation of this pattern tells us that buying power is weakening in the market, and eventually, the price may begin to fall.
So if you’re in a long position while a rising wedge is forming… watch out!
How to Recognize Rising Wedge Patterns on a Price Chart
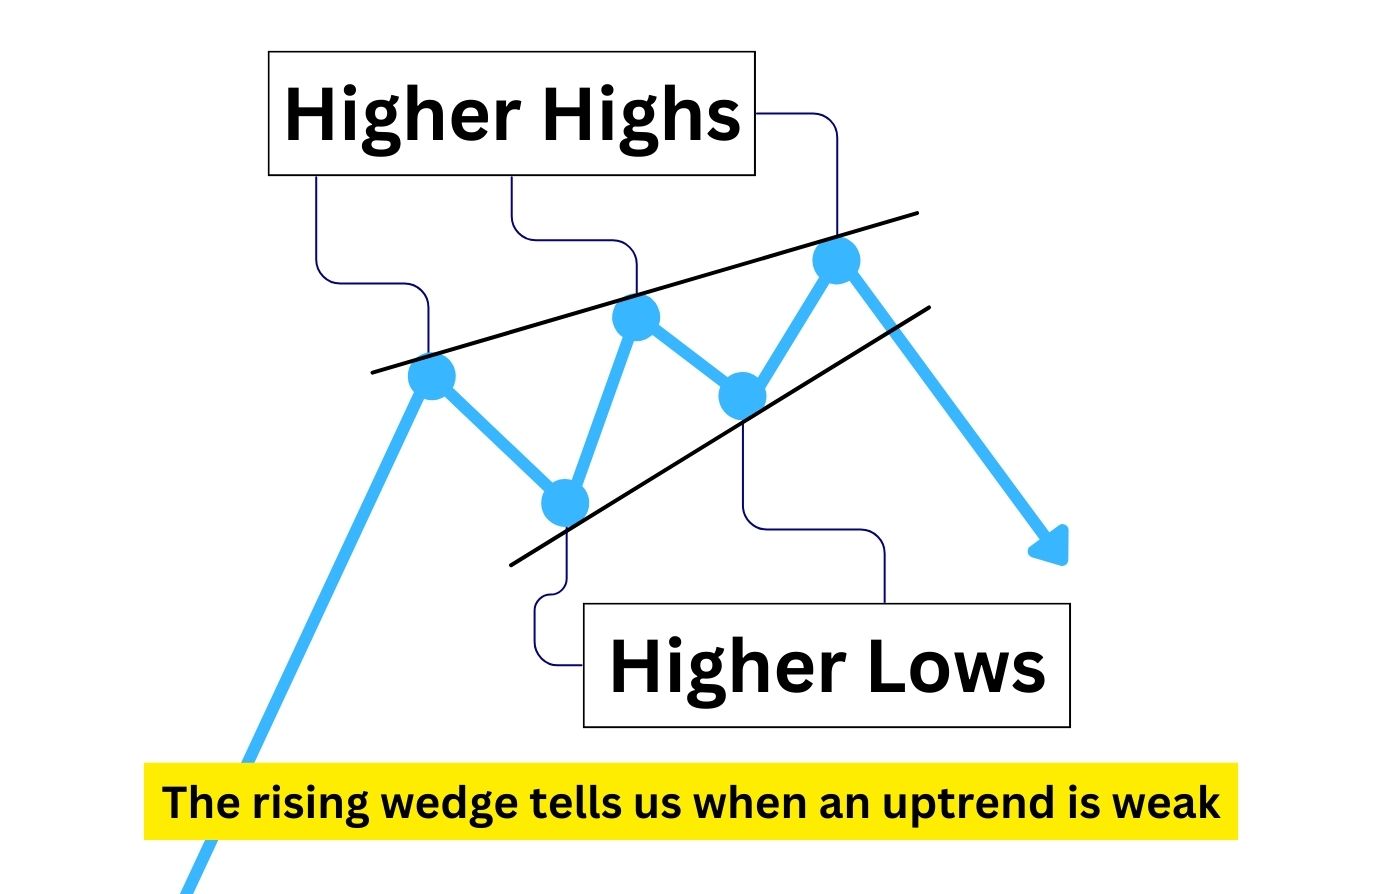
The rising wedge, also known as the ascending wedge, is shaped like an upward diagonal spike. To identify the pattern, start drawing one trend line that connects the highs, and a second trend line connecting the lows. These two trend lines should eventually meet and form a rising wedge.
As you look at the chart, you’ll notice the price range tightening. This is the result of higher lows being formed more aggressively than higher highs, which creates a unique wedge shape.
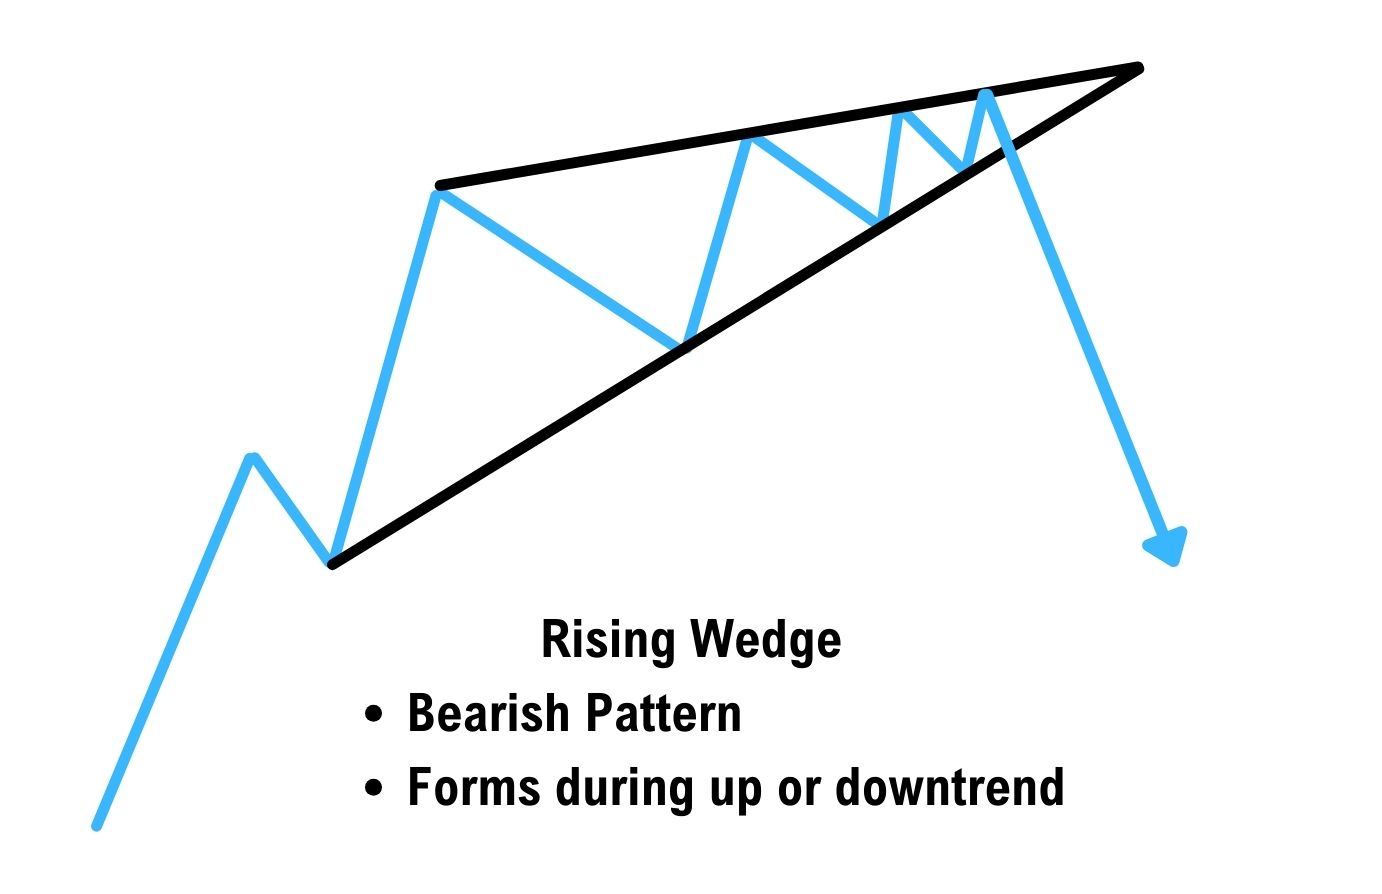
Within the rising wedge, you’ll also notice a repeating structure of reversal pivots. Valid rising wedges typically have at least five pivots with 3 highs and 2 lows, with some extending to 7 or 9 pivots.
As the price moves towards the apex where the trend lines converge, the likelihood of a breakout increases. The pattern acts like a spring coiling up, ready to make a powerful move to the downside.
Key Characteristics of a Rising Wedge Pattern
Understanding key characteristics of a rising wedge can help traders spot it in the charts. This will alert traders to start looking for a short opportunity and be careful with their long trade positions.
The first and most prominent feature is two converging trend lines pointing upwards. Converging means that when extended infinitely, the trend lines should eventually connect.
As the pattern matures, you’ll see this tight, narrow trading range as the two trend lines meet at the apex.
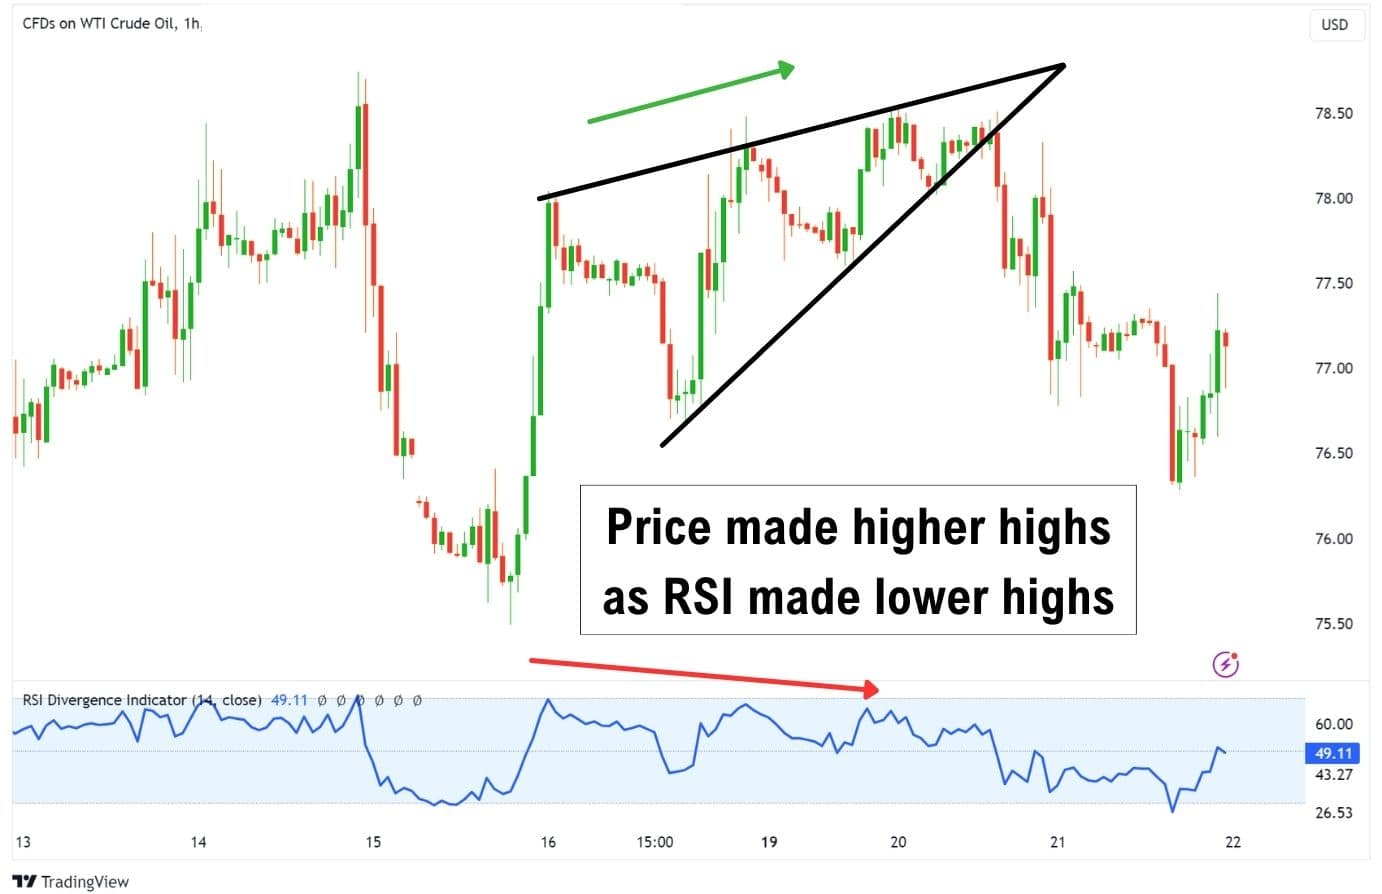
Many times, oscillators like the relative strength index (RSI) show a bearish divergence as price action enters the final phase of the rising wedge. Bearish divergences are helpful to watch as they tell us that bullish momentum is slowing down, which is a key ingredient in a rising wedge.
What Does a Rising Wedge Pattern Signal?

The rising wedge, also known as the ascending wedge pattern, often signals a potential bearish breakout, while the falling wedge pattern signals a possible bullish reversal.
A rising wedge pattern can signal a trend reversal or continuation depending on the market context.
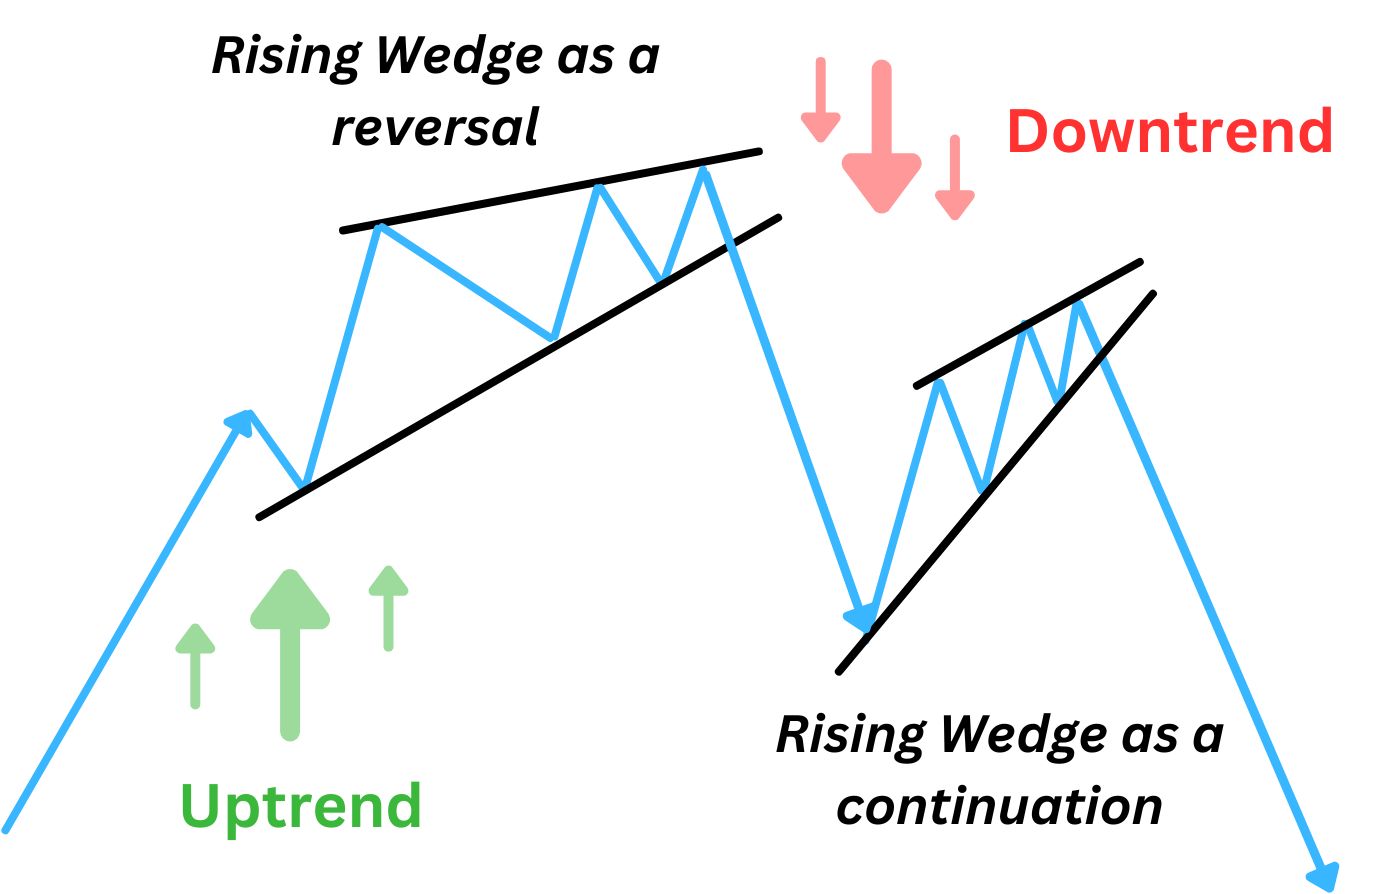
Conversely, in a downtrend, the rising wedge can function as a continuation pattern, which tells us the price will continue dropping. These hints can signal to traders to be careful with long/buy positions, or even switch to the mindset of looking for shorts.
Trading Tactics for the Rising Wedge Pattern
One of the most crucial tactics is waiting for a confirmed breakout before entering a trade. This is because we don’t know when exactly the price will begin to decline. Trying to catch the top of a rising wedge with a leveraged short trade is very, very dangerous.
Personally, this is how I’ve lost a lot of my capital as a trader.
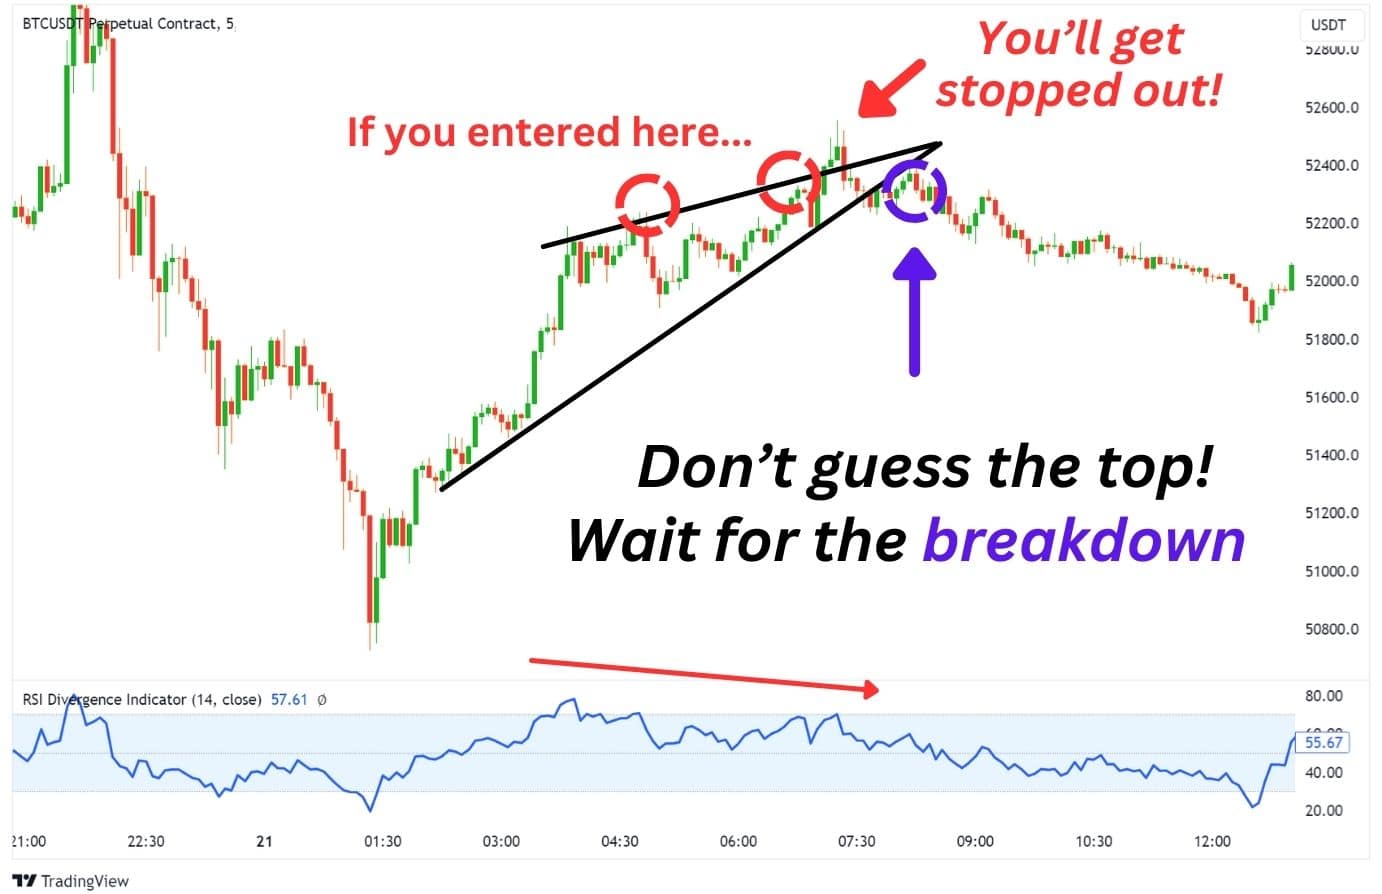
A bearish breakout is confirmed when a candle closes below the wedge’s lower trend line. This confirmation is important because it reduces the risk of getting caught in a false breakout, which can lead to incorrect trading decisions.
The use of volume for confirmation is another essential tactic. An increase in volume during the breakout of the lower trend line provides additional confirmation for a bearish move.
Alternatively, traders can also consider entering a short position after the price drops below the lower trend line and retests it as resistance.
After the confirmed breakout, traders have the option to execute bearish trades by either selling the security short or using bearish derivatives such as options. These strategies can be used to profit from a downturn in the security’s value.
Setting Take-Profit Targets Post-Breakout
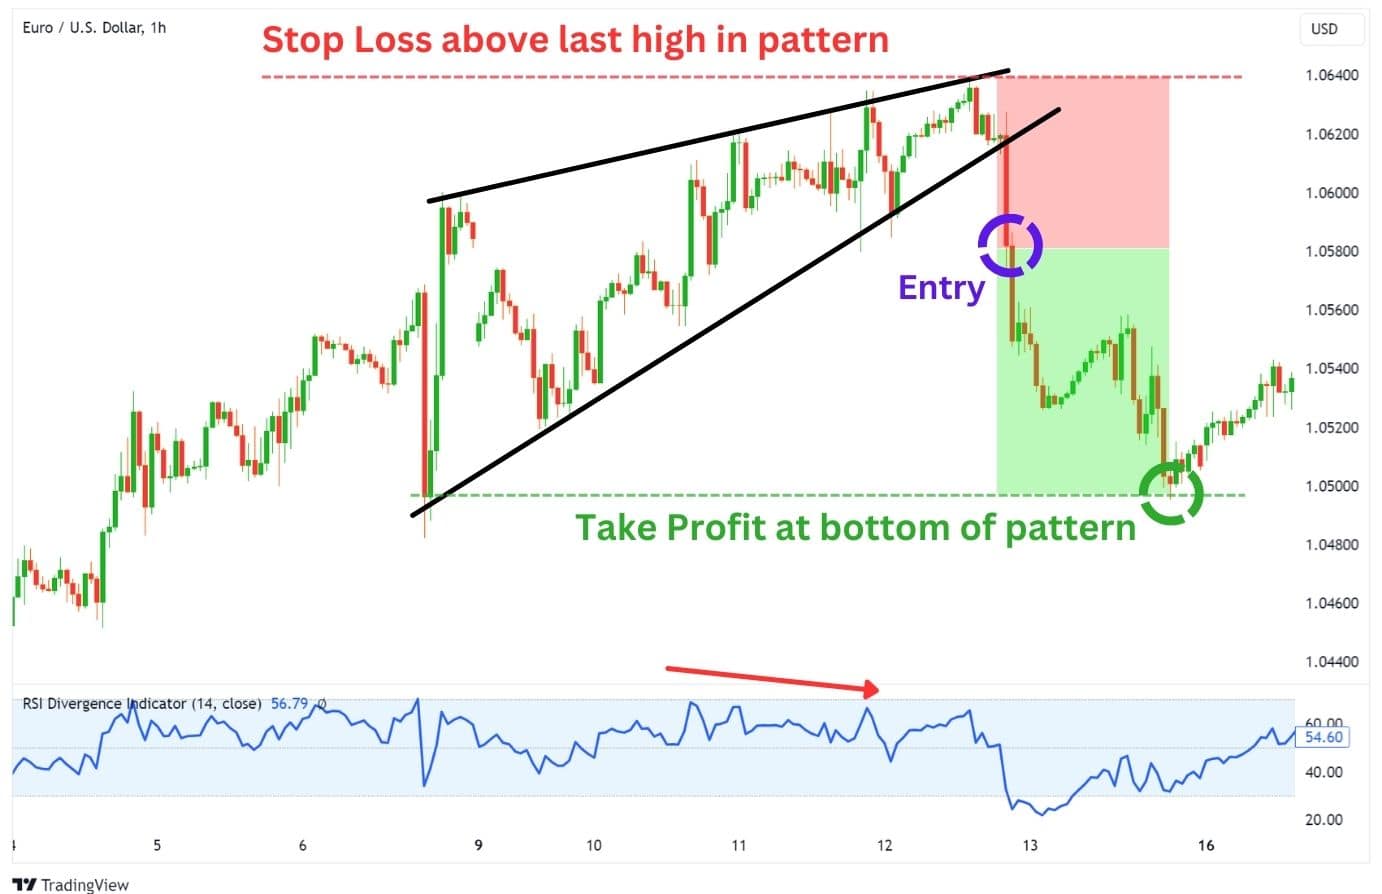
So you’ve entered a trade, where do you take profit? Typically, a rising wedge’s measured move target is at the lowest point of the formation. This should be where you would aim to take most of your profits.
How to Draw a Rising Wedge and Find the Profit Target
To find your take profit, or measured move target for the rising wedge more accurately, follow this systematic approach:
- Find a rising wedge in your chart.
- Draw the upper and lower trend lines, each of which should be connected with 2 or 3 candle wicks.
- Find the lowest touching point with the trend line in the rising wedge.
- Set the take profit above the lowest touching point of the trend line.
Another factor traders do not consider is how an asset’s price feed will have minor differences across brokers or exchanges. This further contributes to how a wedge will be drawn and impacts where your take profit target is placed. By setting the take profit just a little higher, you ensure a higher probability of your target being hit, capturing the majority of the downward move.
Managing Risks with Stop-Loss Orders
When trading a rising wedge, a commonplace to set your stop loss would be above the entire rising wedge pattern, or above the last high within the wedge pattern. See previous chart example for reference.
This gives our trades better risk-to-reward and also provides an adequate invalidation point.
Traders should always be aware of possible false breakouts, whereby the price could reenter the wedge and reverse bullishly. By setting a stop loss to the last high within the wedge, we are using an adequate invalidation point and can stay calm when the trade isn’t going our way.
Case Study: Rising Wedge Pattern Examples
Trading a rising wedge becomes simple once you can identify the pattern. Here are the main factors you should pay attention to when searching for a wedge:
- Two upward-sloping lines that will eventually converge
- The lower line is steeper, while the higher line is flatter, signalling a weakening momentum
- Observe at least 5 touches combined on the two trend lines
- Observe a bearish divergence as the price moves higher (with lower highs on your oscillators like RSI, MFI, MACD)
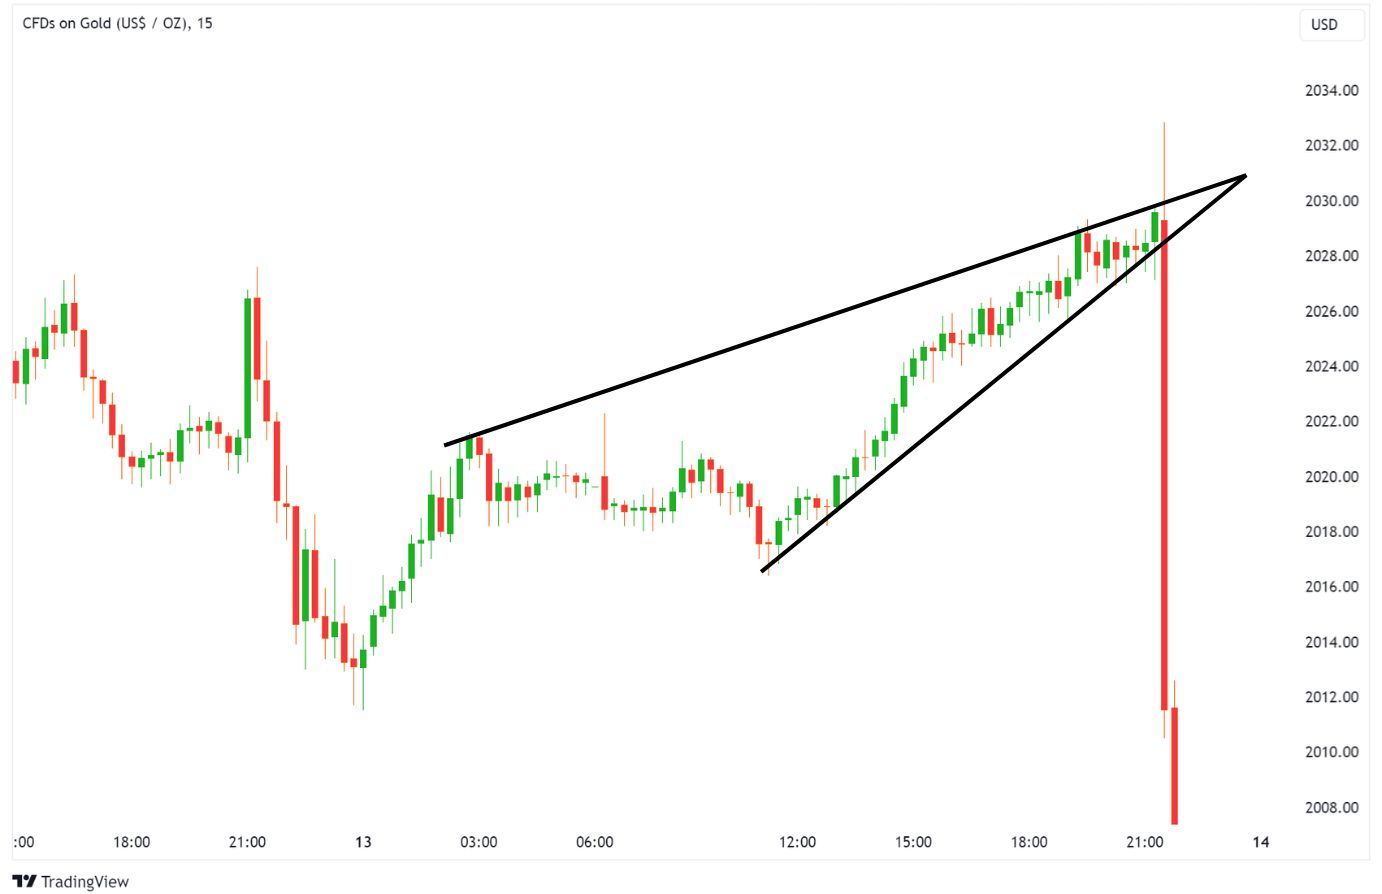
Example 1: Classic Rising Wedge
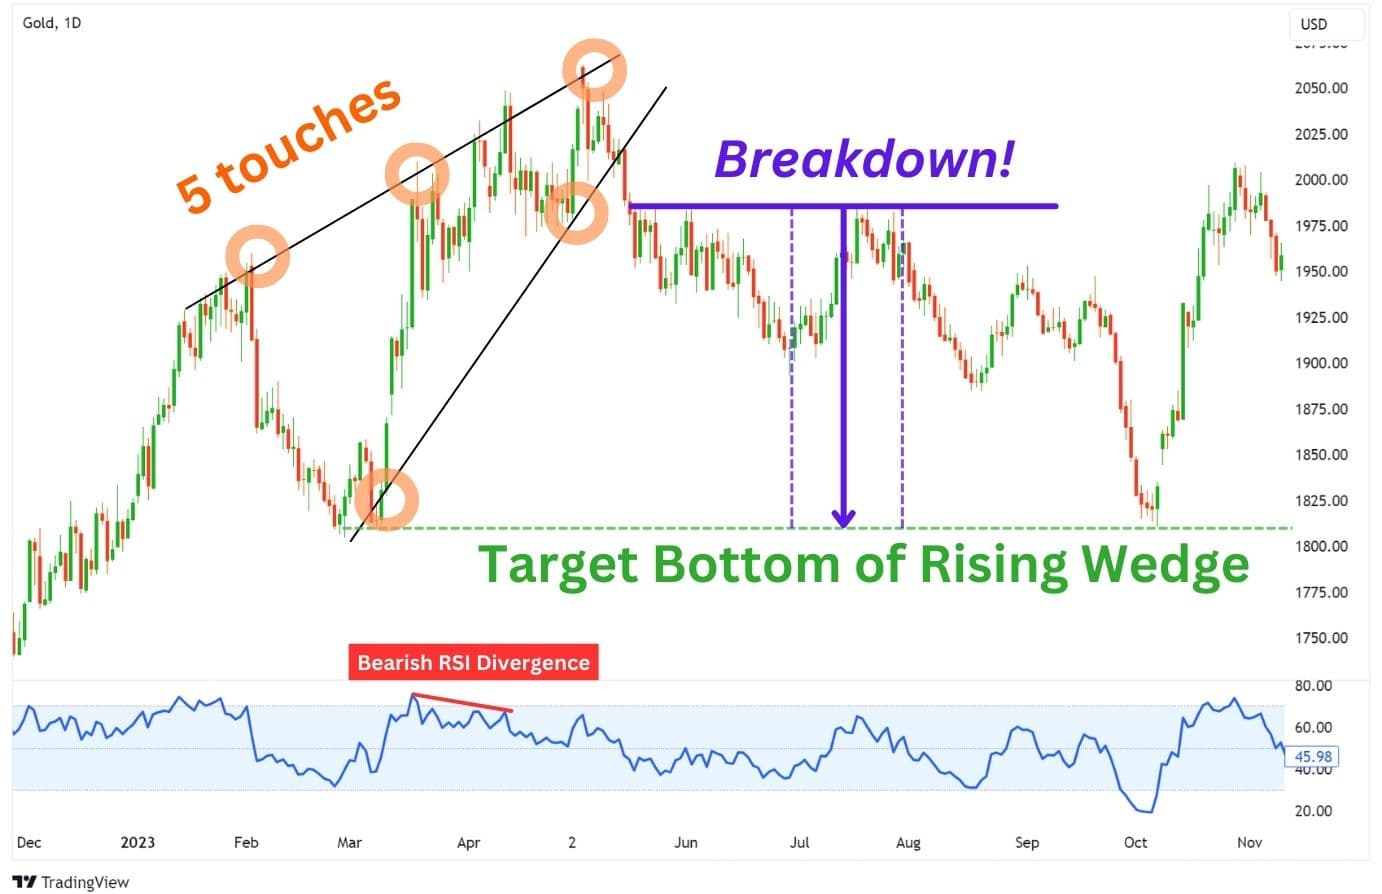
Here, we see 5 touches on the trend lines, highlighted by the orange circles, which makes the rising wedge valid. Another factor you can observe is the RSI for a bearish divergence, the price should form higher highs, while the RSI forms lower highs. This divergence gives us a clue about the slowing bullish momentum of the asset and gives us the confidence to look for a short trade.
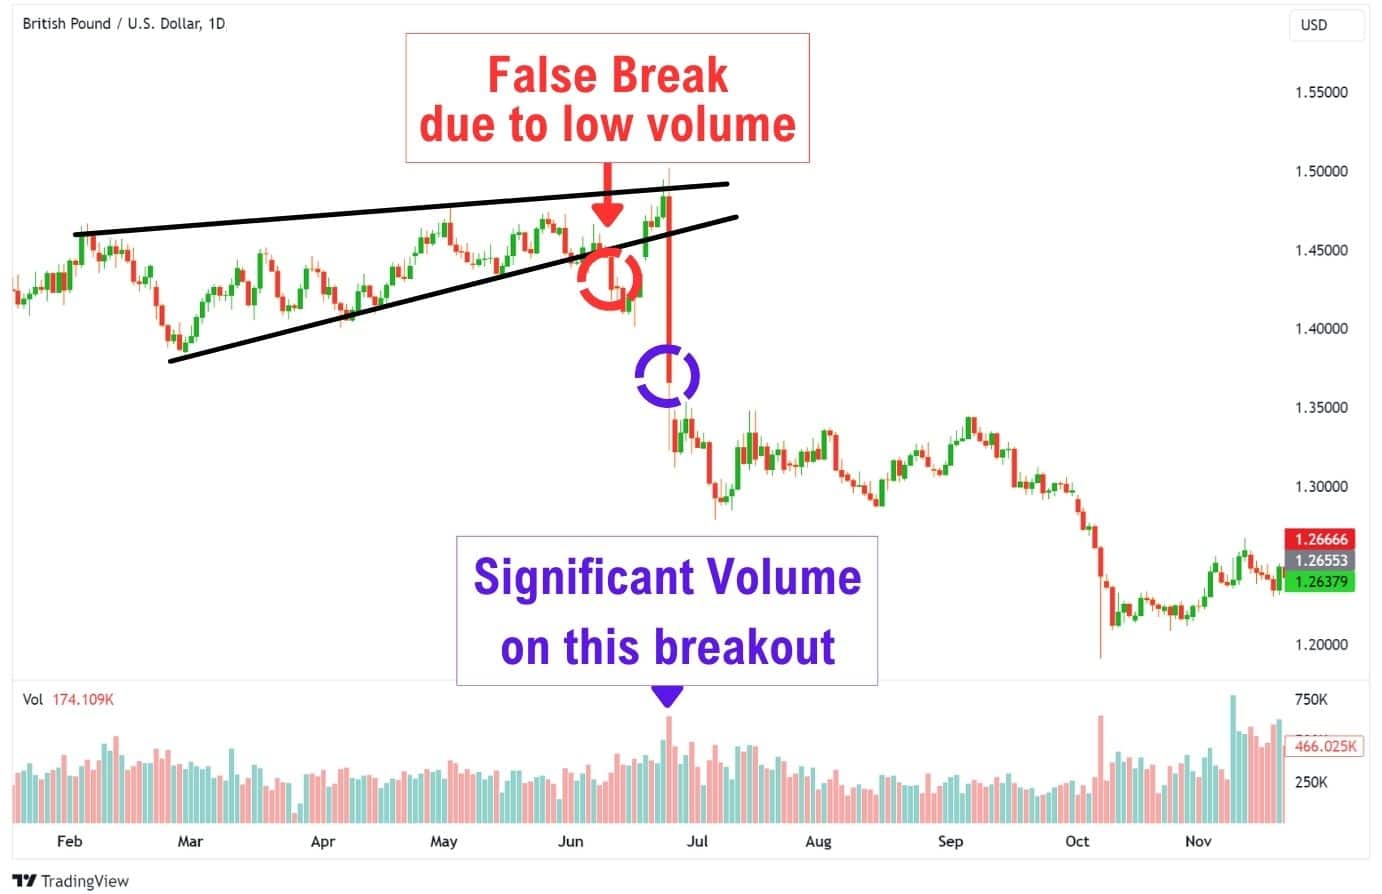
Example 2: Deviated Rising Wedge
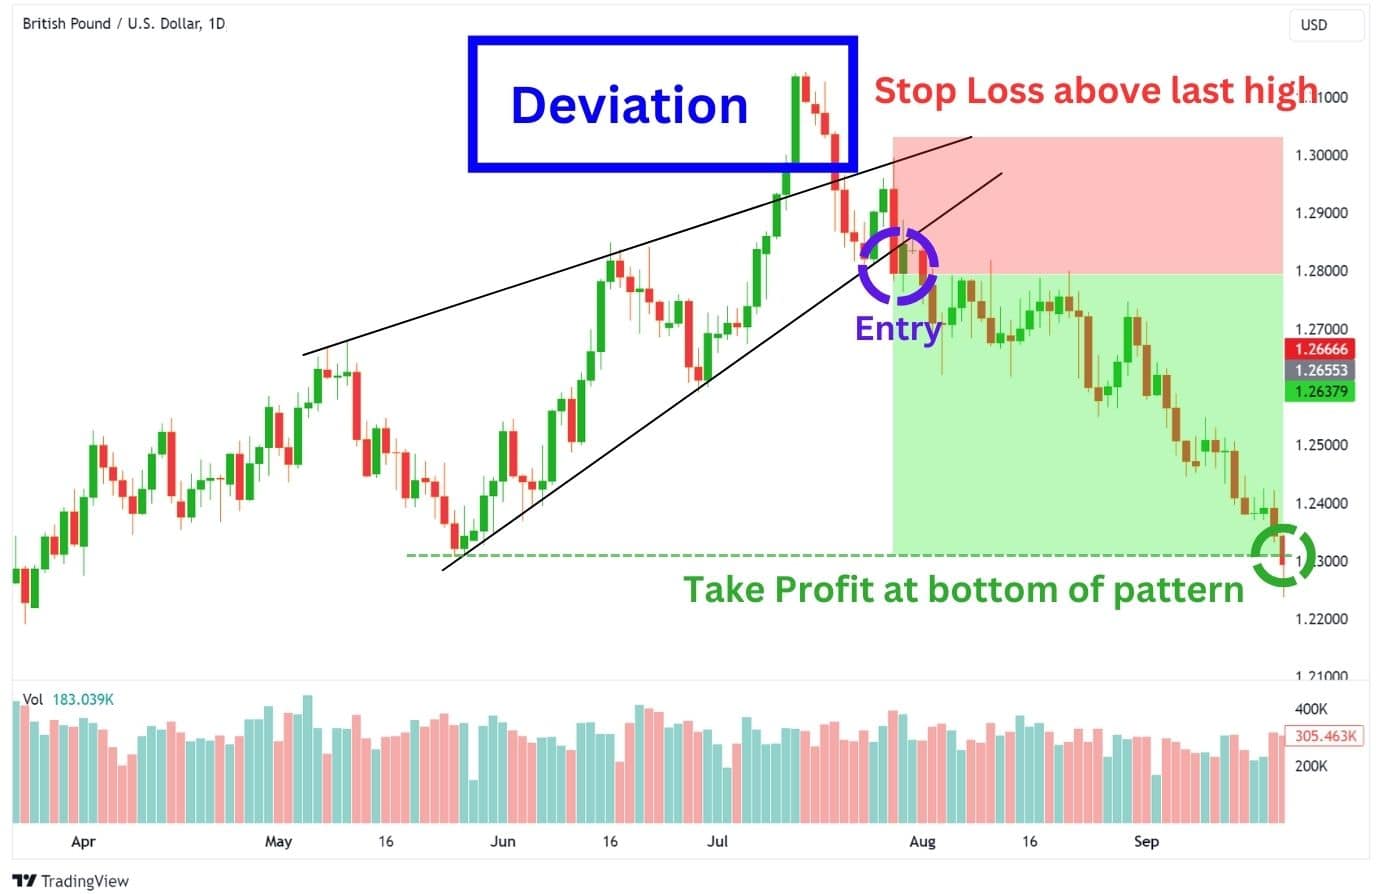
However, during live trading, you’ll frequently observe these patterns emerge with some sort of imperfection – these are referred to by traders as deviations.
Here’s an example of a rising wedge pattern on the GBPUSD 1D chart. Notice how the price eventually closed above the upper trend line and held the price above for more than 5 days. Deviations like this can happen particularly in the last wave up. But eventually, the price collapses back into the pattern and our rising wedge idea plays out perfectly.
In more advanced trading systems such as Elliot Wave Theory, it’s an extremely bearish sign whenever a rising wedge overshoots the upper trend line in its final wave. Another group of traders, using the concepts of liquidity sweeps, may also view this shoot-up as a simple stop-hunt (taking out early short trades), and further confirm their bearish bias.
So how do we stay prepared for this trickery?
One simple way to not get fooled by a deviation is to simply observe if the price re-enters the pattern. Then, if the price breaks the lower trend line and closes below, we can be prepared for a short trade.
The Dual Nature of the Rising Wedge: Continuation vs. Reversal
Depending on the market scenario and where the pattern is emerging, the rising wedge could be a reversal pattern or a continuation pattern. Either way, you would trade it the same.
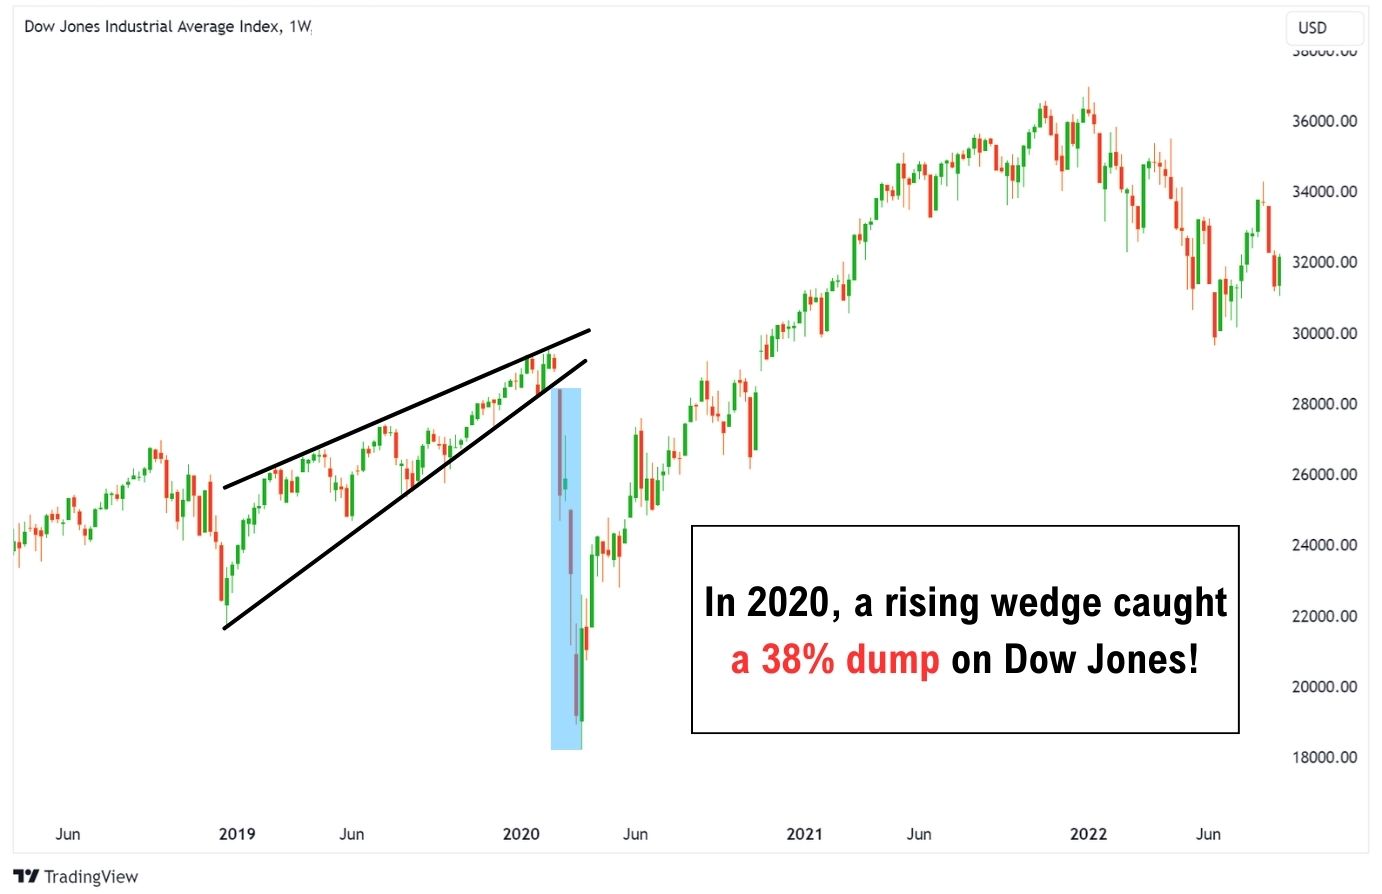
In the context of an uptrend, the rising wedge becomes a reversal pattern, telling us that potentially the markets are about to shift drastically.
In the context of a downtrend, the rising wedge now becomes a continuation pattern, signalling a lot of weakness in the price, and also a lot of selling pressure happening right now.
Rising Wedge in a Downtrend: A Continuation Pattern?
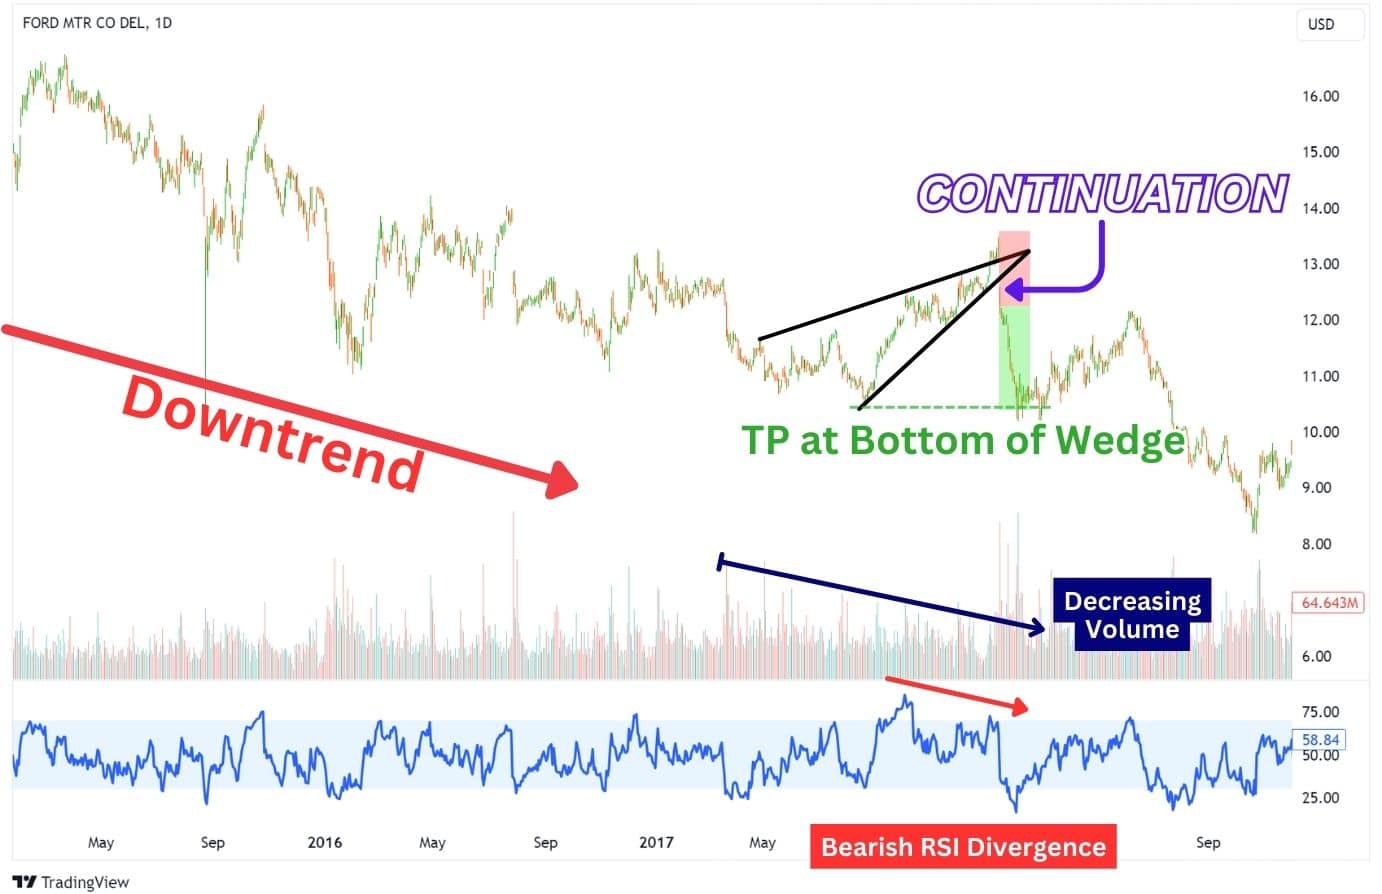
When a rising wedge forms during a downtrend, it’s generally a heavily bearish signal. This is observable in the charts as a slow, but steady upward consolidation, shaped like a spike.
This pattern suggests a further decline in prices once the pattern is completed, and is usually paired with the presence of bearish RSI divergences, and a decrease in trading volume.
Being able to recognise these factors early can tip you off on the formation of a rising wedge, allowing you to plan to enter a short trade, or exit a long trade.
Rising Wedge in an Uptrend: A Prelude to Reversal?
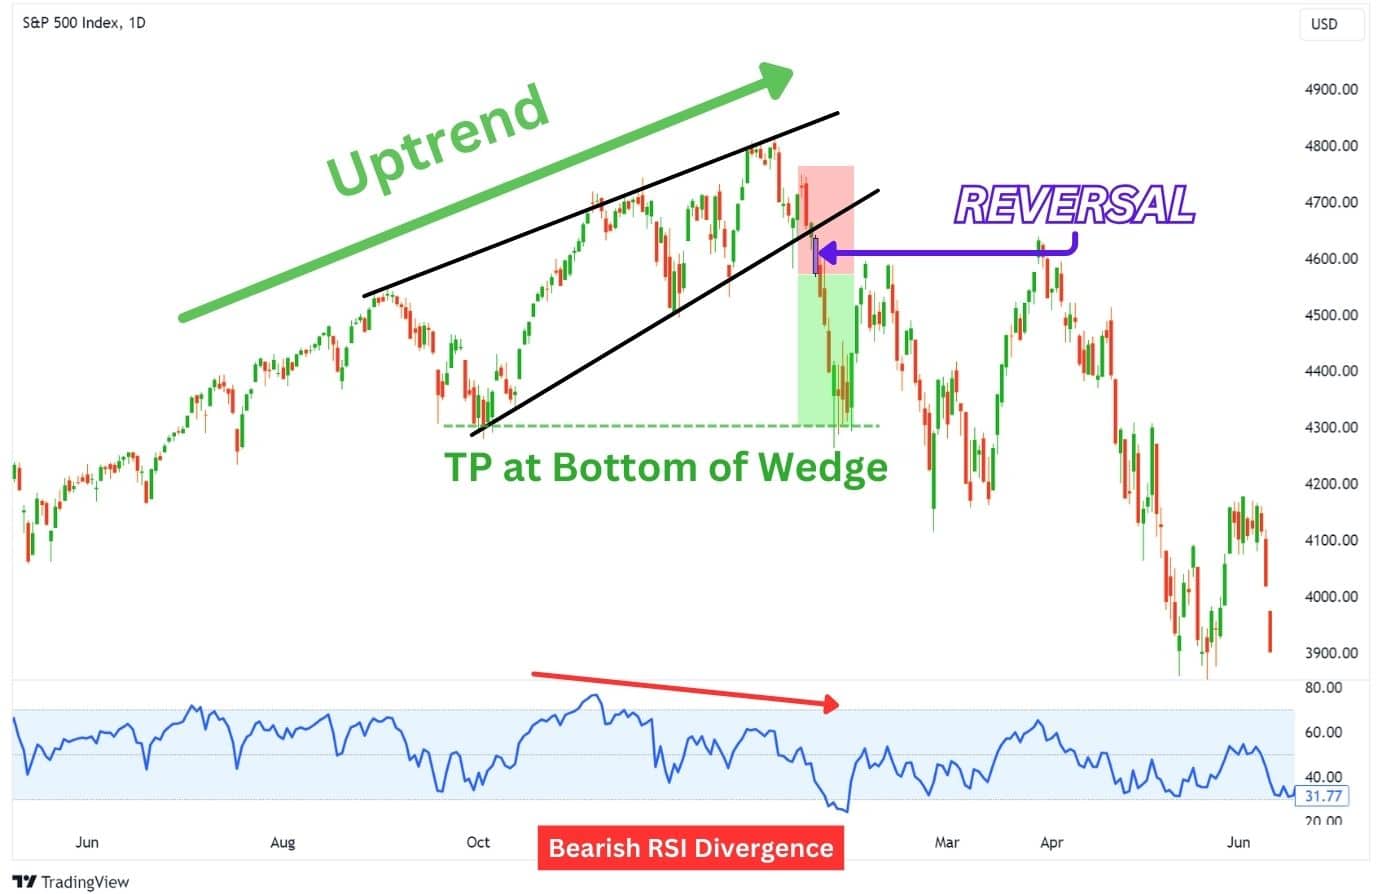
When a rising wedge appears in an uptrend, consider it a warning sign that the price is about to fall soon. In this scenario, the rising wedge is considered a reversal pattern.
However, one key point to note is that even though the rising wedge is a reversal signal, it does not necessarily mean a significant top is in on an asset – just simply that price may reverse for a bit. We should not fall into the trap of being too bearish, just because of a rising wedge being present.
Overall though, the rising wedge is an accurate reversal pattern, when it appears in an uptrend. There might be instances where the rising wedge breaks upward. However, the easier way to trade it is to wait for the support trend line of the rising wedge to break.
Advantages of Trading the Rising Wedge Pattern
There are several benefits to trading the rising wedge pattern:
- The rising wedge is reliable for predicting price reversals.
- The pattern indicates the potential for falling prices after a breakout of the lower trend line.
- The rising wedge has a relatively high risk-to-reward ratio.
- Can be traded on any asset in any time frame.
A key feature of trading the rising wedge is its relatively high RRR. This is because as the price reaches the wedge’s apex, we have a tighter range of movement, and therefore a smaller invalidation point for us to place our stop loss.
Disadvantages of Trading the Rising Wedge Pattern
There are several negatives to trading the rising wedge pattern:
- The rising wedge does not always hit its price targets.
- Can be confused with a bear flag, which usually has larger price targets.
- Price action tends to not be clean around the trendlines, leading to false breakout signals.
- Price can falsely break upwards, fooling many traders out of a short opportunity.
Trading the rising wedge pattern may require a bit of experience, as it is not clear when a rising wedge is forming until around two-thirds (⅔) of its completion. This means you’ll need to actively readjust your views of the market in order to notice the rising wedge pattern.
Finding a rising wedge becomes even harder on smaller stocks, FX pairs, or cryptocurrencies. This is because lower-volume assets can have long wicks, or huge gaps in their price charts, which make the rising wedge even less obvious to the untrained eye.
Enhance Your Trading Strategy with Rising Wedge Patterns

Most traders are introduced to this simple concept when they first begin trading:
“The trend is your friend until the end.”
This simple yet effective concept tells us to trade with the trend. So whenever the market is making higher highs and higher lows, it’s in an uptrend and we should look for longs.
The rising wedge however, helps provide context to the markets when it’s in an uptrend. Notice that even though a rising wedge still follows a bullish market structure (higher highs, higher lows), but is a bearish pattern.
Knowing about the rising wedge pattern can alert traders on when to stay bullish, and when to stay cautious.
Moreover, combining the rising wedge pattern with other technical indicators can provide a more comprehensive view of the markets. For example, volume and momentum indicators can tell us that the uptrend is weakening, clueing traders in on a possible rising wedge.
What Trading Indicators Are Best to Use with a Rising Wedge Pattern?
The best indicators to use with a rising wedge would be volume and oscillators. These indicators can help alert traders to the formation of a rising wedge, and also add strength to the bearish signal.
Volume is a crucial indicator in detecting the rising wedge, as volume typically decreases as the pattern is forming. On the breakout, we can expect high volume, which informs us of the rising wedge’s validity.
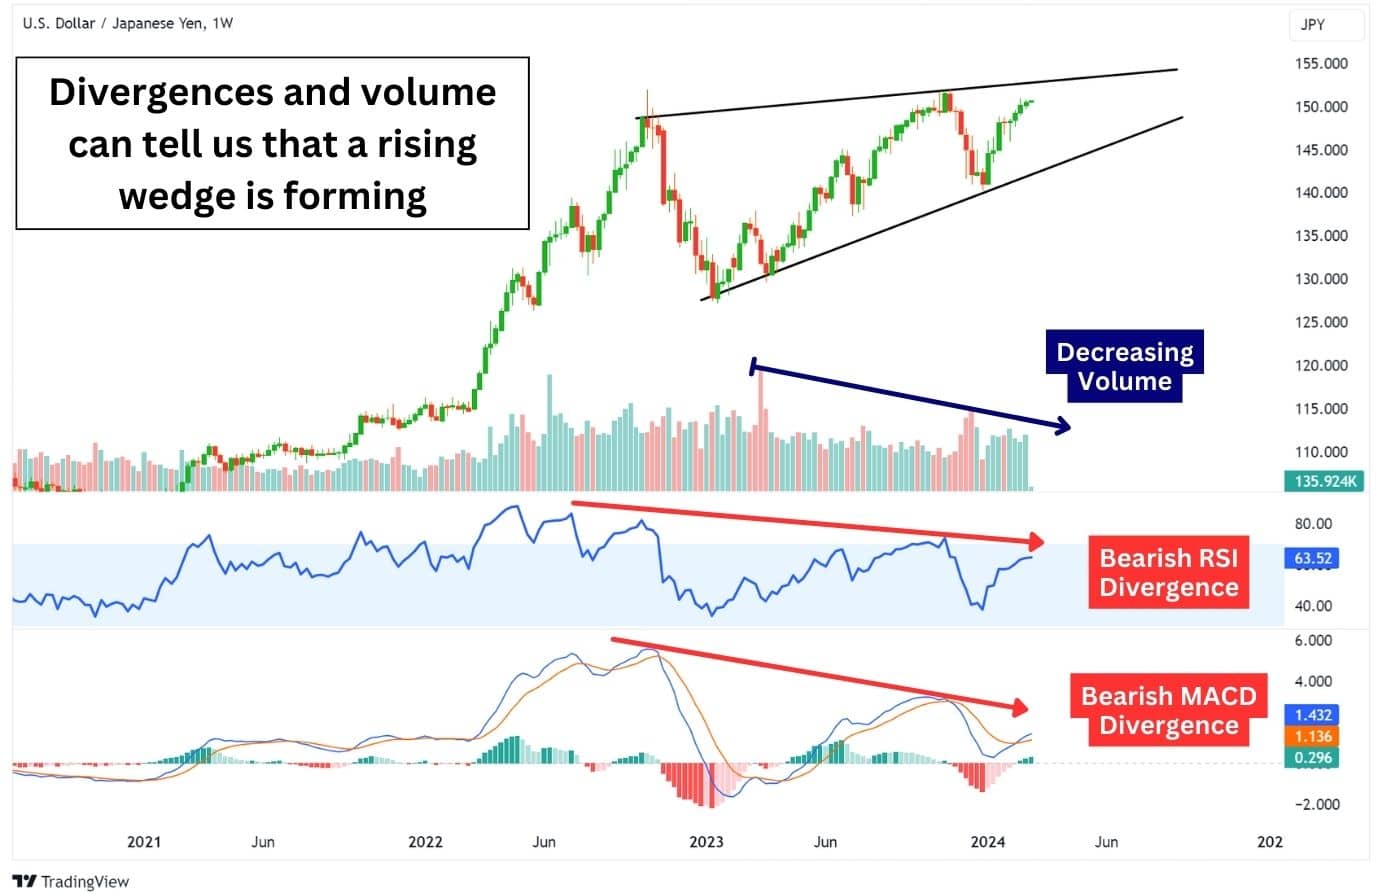
Oscillator-type indicators like the RSI or MACD can be great at detecting divergences in price action and buying momentum. These divergences tell us that even though prices are going higher, the buying momentum is slowing down, and therefore higher prices should be unsustainable.
Divergences don’t always play out, but they can be a great predictor of reversals, and also alert traders to start looking for reversal patterns (such as the rising wedge).
Rising Wedge Mistakes to Avoid

One of the most common mistakes that traders make is the failure to wait for a confirmed breakout. Traders may be tempted to act prematurely upon spotting a potential breakout, but it is vital to wait for a candle or bar to close below the lower trendline to confirm a bearish breakout.
Another common mistake is over-reliance on the rising wedge pattern alone. While the pattern can offer to valuable insights, it should not be the sole basis for trading decisions. The effectiveness can vary with broader market conditions, making the signals not 100% accurate.
Therefore, it’s important to trade rising wedge patterns with other technical indicators, and also consider the broader market context.
Can a Rising Wedge Pattern Occur Within a Broader Trend?
A rising wedge can occur as a minor bearish reversal within a broader bullish trend. This means a 1H timeframe rising wedge can create a bearish trend within the 1H timeframe, but the daily trend can remain in an uptrend.
It’s important to consider the timeframe of a rising wedge some traders are misled to believe that a rising wedge can provide a significant swing trade.
When spotted on higher timeframes such as the daily or weekly chart, a rising wedge can then be perceived as a significant swing trade opportunity. However, it’s important not to expect the same level of trend shifts that a 1H timeframe or 4H timeframe rising wedge can bring.
How Reliable are Rising Wedge Patterns?
Rising wedges are renowned for their high success rate in forecasting trend reversals. Many traders have traded this classic pattern to great effect, which speaks volumes about its reliability.
However, even though the rising wedge has a bearish bias, it’s worth noting it still has the potential to break out bullishly. This is why you should only trade the rising wedge pattern on a confirmed breakout, and also exercise good risk management.
You can improve the reliability of a rising wedge by applying indicators such as volume, RSI, or other momentum oscillators.
Rising Wedge vs. Ascending Triangle: Spotting the Differences
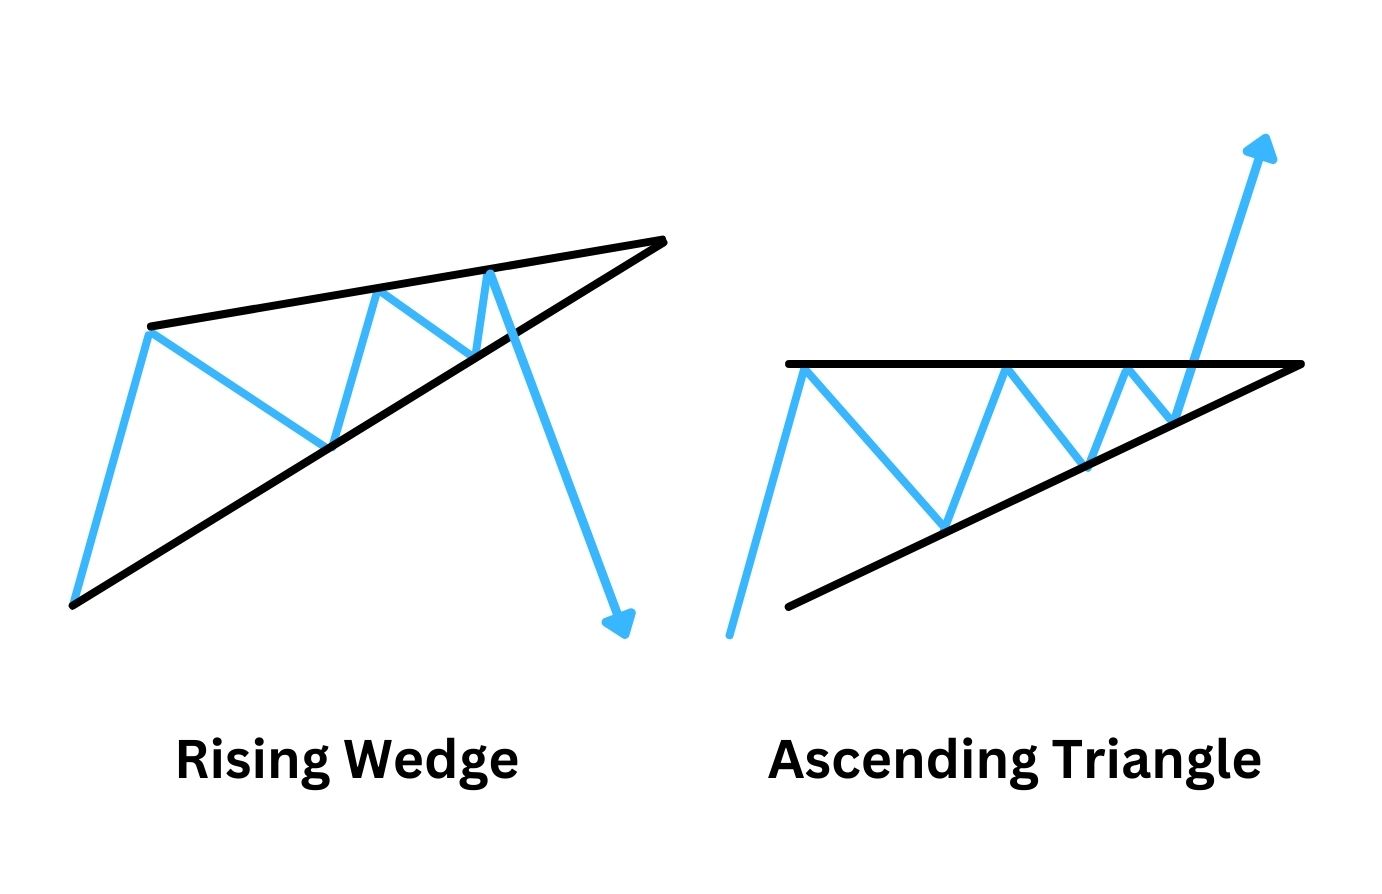
Though the rising wedge and ascending triangle patterns might appear similar, they have distinct differences. The rising wedge pattern is identified by its ascending support and resistance lines that converge, creating a narrowing wedge shape.
Conversely, the ascending triangle pattern is distinguished by a flat resistance line and an upward sloping support line, both converging to form a right angle triangular shape.
Unlike the rising wedge pattern, which typically indicates a bearish trend reversal, the ascending triangle pattern signals a continuation of the existing bullish trend.
Rising Wedge vs Falling Wedge
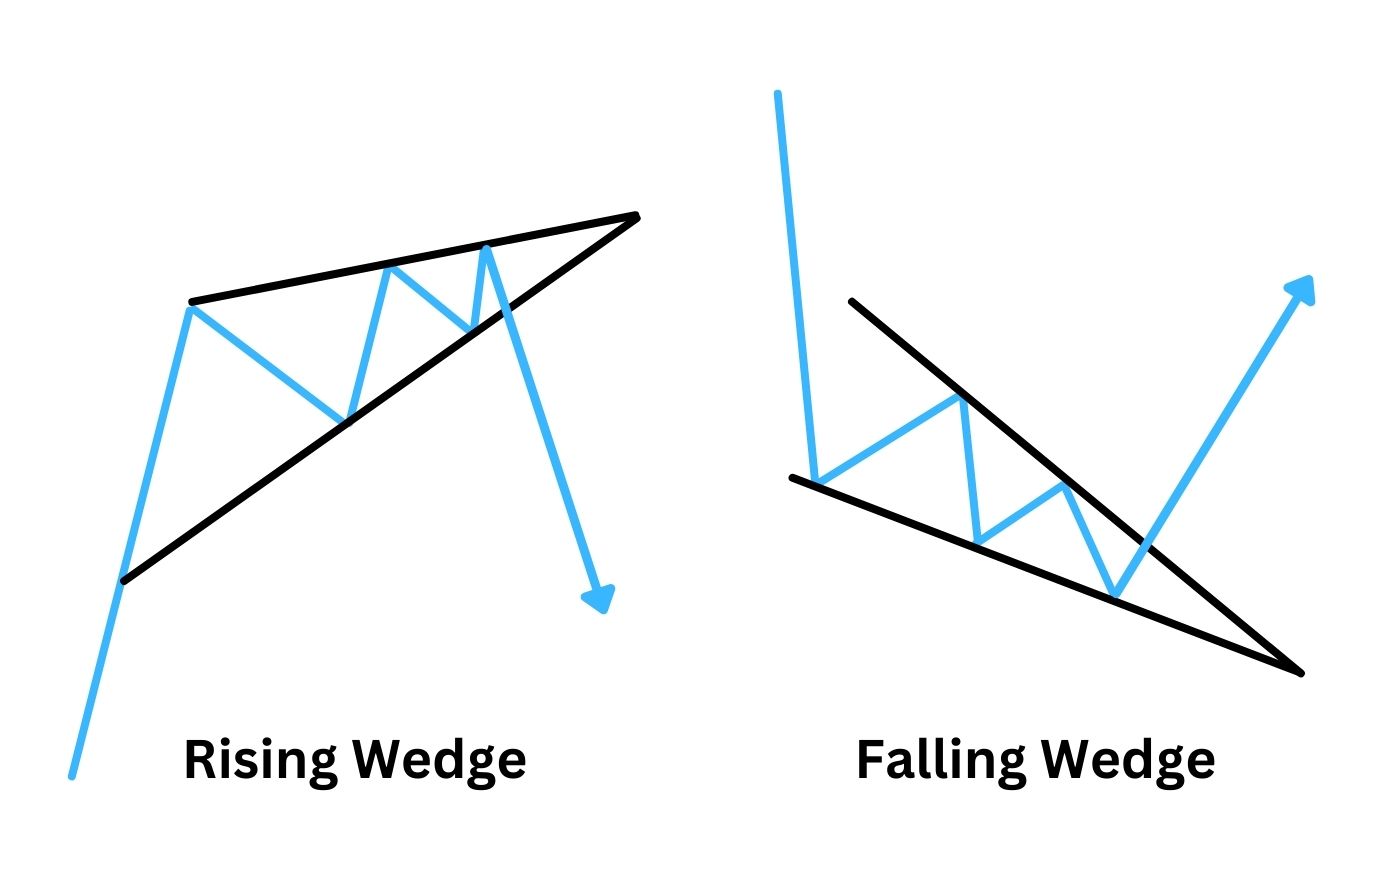
The falling wedge, or descending wedge, works similarly to the rising wedge as it is also a reversal and continuation pattern.
While a rising wedge forecasts a bearish move (price moving down), a falling wedge forecasts a bullish move (price moving up). This is because the formation tells us there is weakening momentum, and so a reversal move is likely to happen.
Just like the rising wedge, the falling wedge will have 5 touch points in the pattern. However, instead of having upward-sloping trend lines, the falling wedge has two downward-sloping trend lines.
Broadening Wedge Pattern
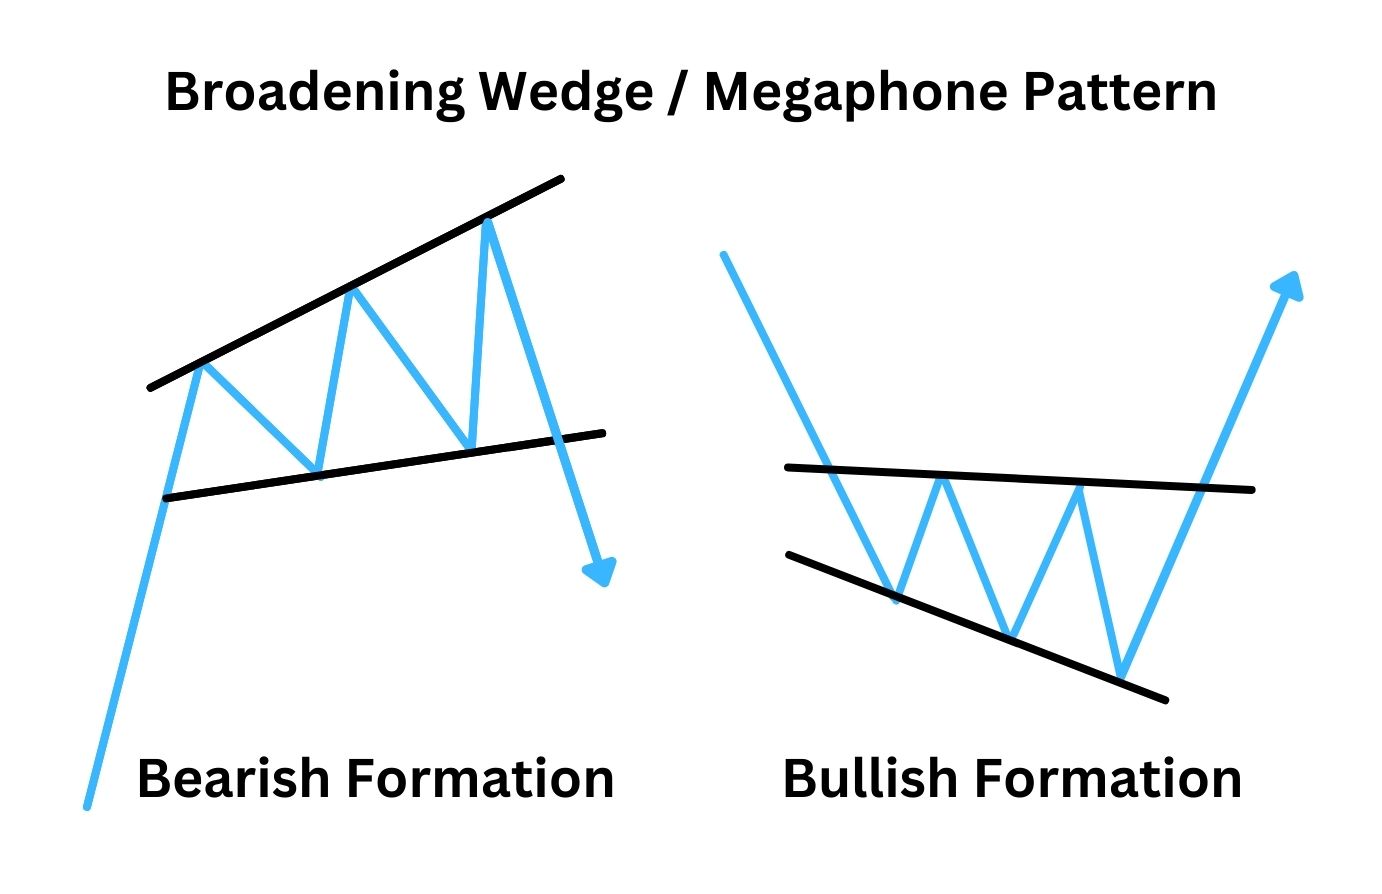
The broadening wedge is another reversal/continuation pattern like the rising wedge or falling wedge. However, instead of the two trendlines converging, they are diverging – moving away from each other.
A broadening wedge will look like a megaphone, hence its other name: the megaphone pattern. It can appear as a downward-sloping megaphone, upward-slating, or even just completely neutral in its angulation.
Like the regular wedge patterns, if the broadening wedge is slanting upwards, it means a bearish move may be coming. If it is slanting downwards, it’s likely a bullish move is about to happen.
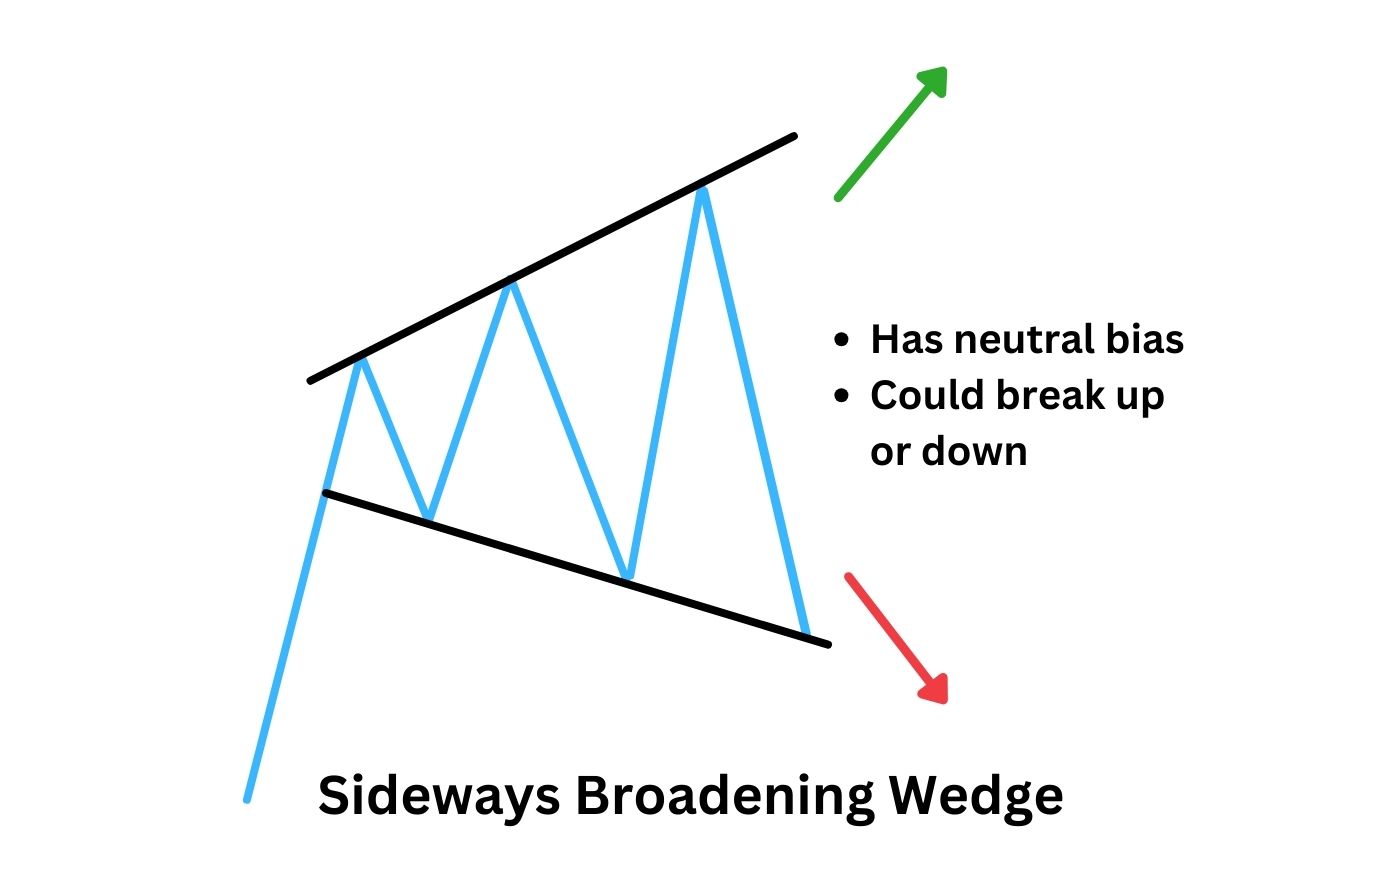
Uniquely to the broadening wedge, the bias is neutral when the pattern consolidates sideways. This means the pattern does not signal a higher probability of breaking out to either side. Therefore, when you encounter this pattern, wait for a proper breakout with high volume before taking a trade.
The Origins of Wedge Patterns in Market Analysis
Although it’s unclear who founded the wedge pattern, but the wedge pattern is a very well-documented chart pattern. The wedge pattern is mentioned in respected books such as “Encyclopaedia of Chart Patterns” (published in 2000) by Thomas Bulkowski, an investor since 1981.
Over time, wedge patterns became a distinct part of technical analysis as traders sought to distinguish them from similar formations, such as triangles, flags, and ascending channels. Today, the rising wedge pattern is recognised as a valuable tool in market analysis, helping traders predict potential reversals or trend continuations.
Frequently Asked Questions
Is a rising wedge pattern bullish?
No, a rising wedge pattern is typically considered bearish as it often signals the beginning of a downward move.
What makes a rising wedge different from a triangle?
Just like the rising wedge, a triangle pattern has two converging trendlines. However, what makes them different is that in a rising wedge, both trend lines are pointed up. A triangle’s lines are sloped in the opposite direct , like a symmetrical triangle, or as a right angle triangle – where one trend line is completely horizontal.
What invalidates a rising wedge pattern?
A rising wedge is invalidated when the price breaks AND closes above the entire pattern with strong bullish volume. This tells us that bulls are in control and that price isn’t likely to decrease.
However, the moment that price falls back into the rising wedge pattern, we have to consider that the pattern perhaps is not invalidated – and that the first close above was just only a deviation before a major price decline.
What happens after a rising wedge pattern?
After a rising wedge pattern, it typically leads to a bearish reversal if it forms after an uptrend, and leads to a continuation if it forms during a downtrend. In summary, a rising wedge pattern often indicates a bearish trend may appear once support is broken.
How do you play the rising wedge pattern?
To play a rising wedge pattern, you can first identify the pattern with an accurate pattern structure, with a minimum of 5 touches on the trend lines. Only enter a short trade when there is a confirmed break out with increased volume, and then set your take profit just above the bottom of the rising wedge.
Remember to only risk 1% – 2% of your account balance per trade, as the rising wedge is prone to fake outs to both sides.
How is a Rising Wedge Pattern recognized on a price chart?
A rising wedge can be recognised with the naked eye as an upwards-sloping, spike-like pattern. When drawing the trend lines, notice if they will eventually converge.
If the trend lines won’t ever converge, that means you’re likely not looking at a rising wedge, but rather looking at a flag or channel pattern. If they do converge, make sure both trend lines are angled upwards, which is a key characteristic of rising wedges.


