Written by:

Reviewed by:

Bearish
Bullish
- June 8, 2026
- 38 min read
50 Bullish and Bearish Reversal Candlestick Patterns
In trading, a reversal is when price stops moving in one direction and starts pushing meaningfully the other way. It is more than just a small pullback. It signals that the current trend is losing control and momentum is starting to shift.
For example, after the S&P 500 peaked on 19 February 2020, it went on to fall about 34% into its 23 March low. So how can we spot these shifts before the full move happens?
That is where reversal patterns come in. They help traders recognise when a trend is running out of steam, when buyers or sellers are getting rejected, and when control may be starting to change hands. These reversal setups come from Japanese candlestick charting techniques used in technical analysis.
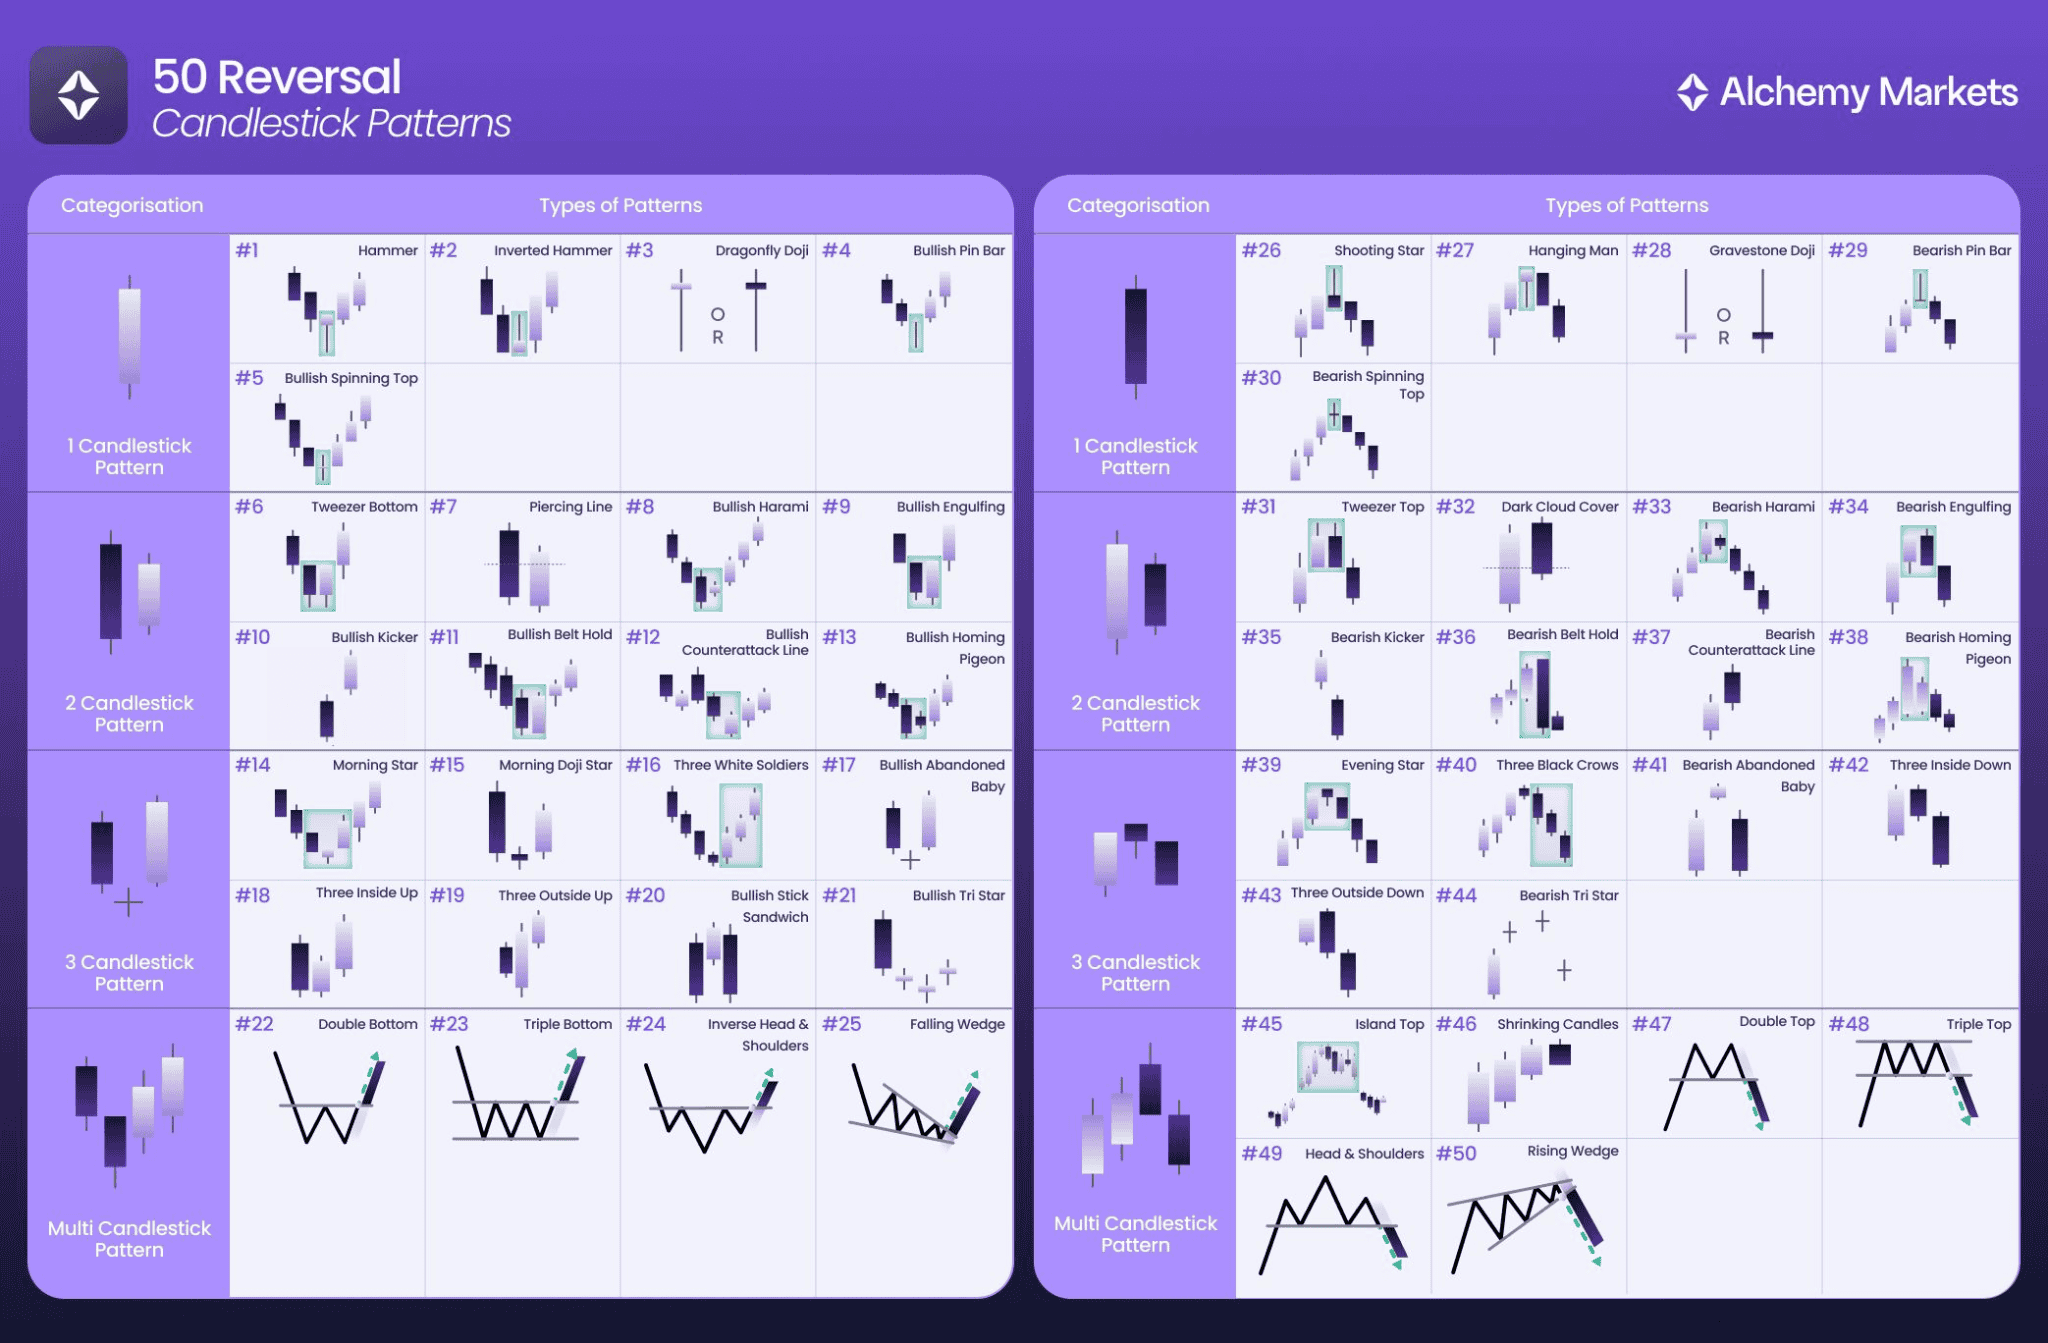
In this guide, we’ll break down 50 bullish and bearish reversal patterns, what they suggest, and how to actually use them in context.
What is a Reversal Candlestick Pattern?
A reversal candlestick pattern are popular trading signals found in stocks, commodities, crypto, and forex trading. They act as a visual clue that market sentiment may be shifting, suggesting that the current price trend could be starting to weaken or reverse.
If a market was dropping aggressively, a reversal candle means it may soon be time for price to recover its losses. Vice versa, if a market was aggressively bought, a reversal candle means people are beginning to sell or lose interest in buying at expensive prices.
These kinds of candlestick patterns tend to form after an intense or prolonged trend.
And while we can’t universally pinpoint a percentage to watch, they tend to form at support and resistance levels.
The most meaningful places they can form are at daily, weekly, or monthly support / resistance levels, where reversals can lead to another prolonged trend.
| i. If reversal patterns form in an uptrend, they warn market participants that a move lower could be upcoming. ii. The opposite is true of when the reversal pattern forms in a downtrend, where it suggests that a move higher could be underway. |
How to Identify the Reversal Candlestick Pattern?
Reversal patterns typically form at significant price points, such as:
| i. Horizontal support and resistance levels. ii. Trendlines. iii. Fibonacci Levels. Iv. Psychological Levels (Round numbers e.g. $100) |
To identify such patterns, pay attention to what kind of candles form at a critical level when the price moves into it.
In general, reversal candlesticks usually show up with either a long wick or a large body. But, some patterns are built across two or more candles, so it’s important to familiarise yourself with these patterns in order to recognise them.
Reversal candles also tend to appear around sudden increases in trading volume, either during the candle itself or shortly after it forms. When the volume comes in after the reversal candle, it can act as confirmation that the move has real weight behind it.
The Significance of Reversal Patterns
Although reversal candlestick patterns have historical roots in Japanese rice trading, they are now widely used in forex trading, equities, crypto, and commodity markets.
This is useful because price often reflects changes in market sentiment before the broader trend fully turns. Adept traders can use reversal patterns to adjust their positions, improve their risk management and take advantage of emerging trends.
Despite not being 100% accurate, reversal patterns are more reliable when used in conjunction with volume, trendlines, support and resistance levels and other indicators.
By recognising reversal patterns early, traders can better time their trades and make more informed decisions.
Reversal Pattern Example
One key note about reversal candlestick patterns is that they appear during a price swing that they will reverse. So, if a pattern appears during an uptrending swing, it acts as a bearish reversal pattern. If it appears during a downswing, it acts as a bullish reversal pattern.
For example, in a bullish engulfing pattern, a small red candle is created in a downtrend, that is then followed by a larger green candle that completely engulfs it.
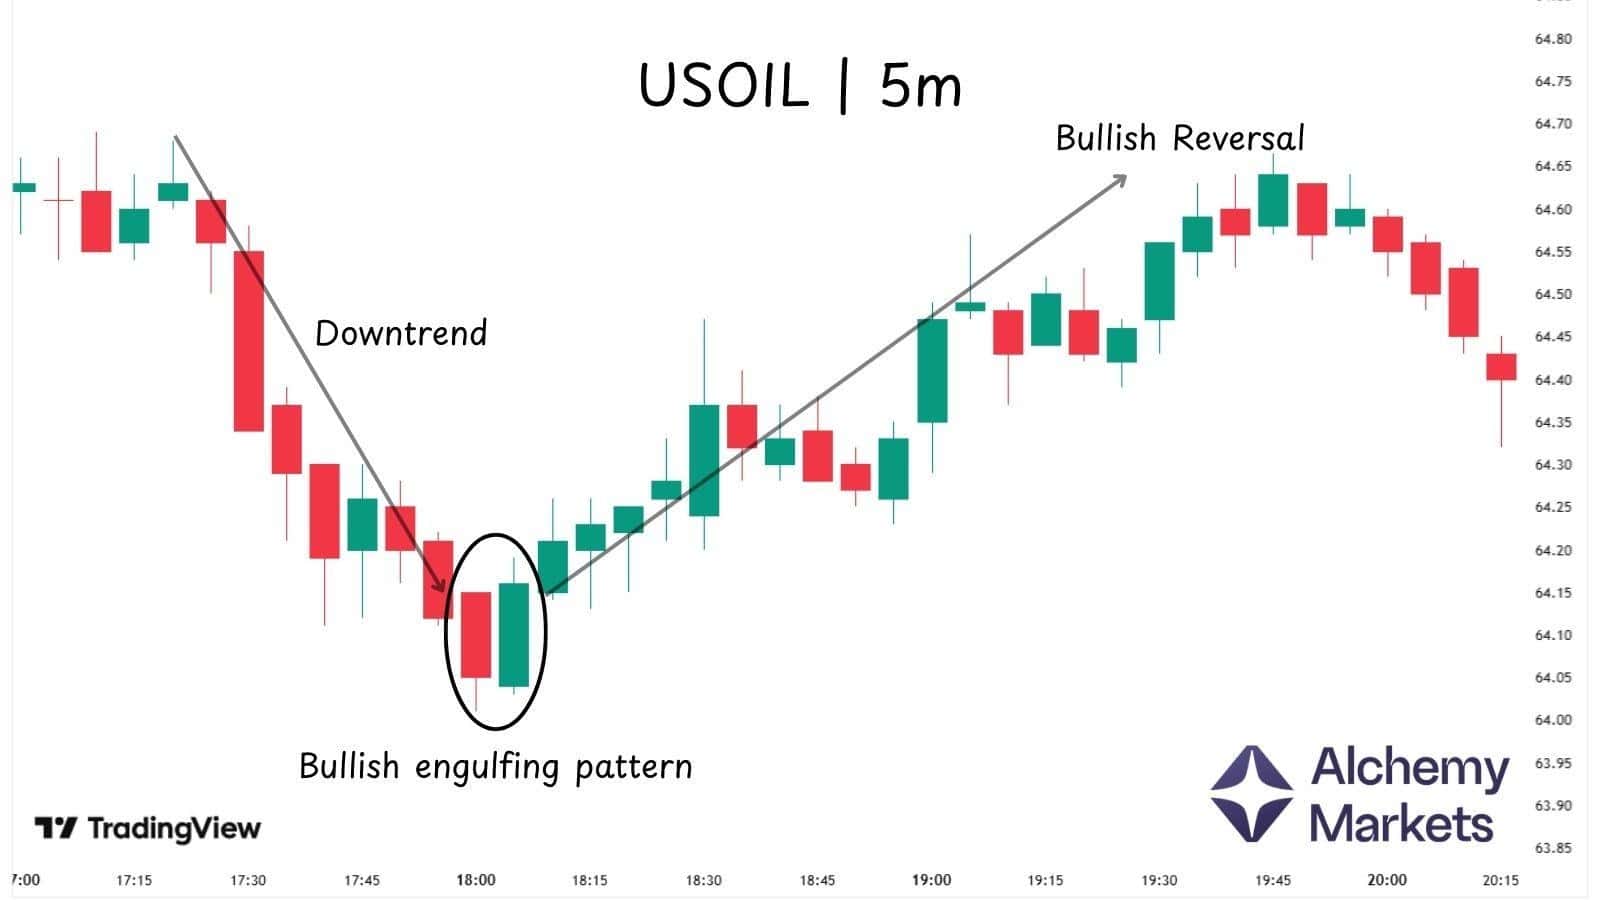
From a market sentiment perspective, this shows a shift from selling pressure to renewed buying interest. The stronger the second candle, the higher the chances of a trend shift.
Bullish Reversal Candlestick Patterns
Bullish reversal candlestick patterns usually occur towards the end of a downward trend as buyers step into the market and attempt to push prices higher.
Here is a detailed look at the various bullish candlestick patterns and how to apply them in your trading strategy.
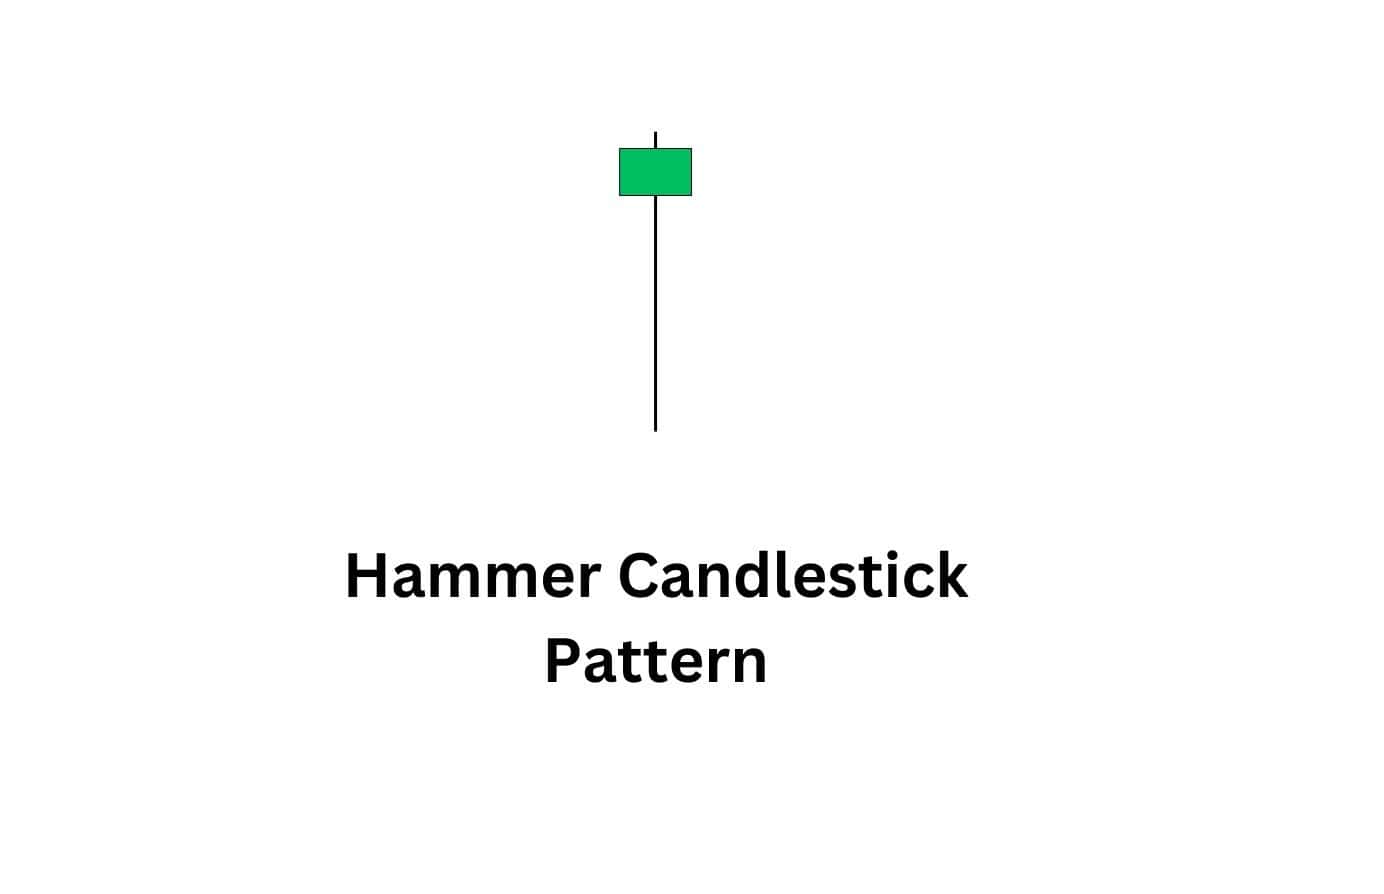
1. Hammer
What is the pattern about?
A hammer appears at the bottom of a downtrend and signals a potential reversal to the upside. It has a small body with a long lower wick, showing that sellers pushed the price down, but buyers fought back and regained control by the close. The longer the wick, the stronger the rejection of lower prices.
When to use it?
Traders look for hammers on key support levels to spot possible trend reversals. Confirmation comes when the next candle closes higher, reinforcing bullish momentum. Adding volume analysis helps filter out weak signals.
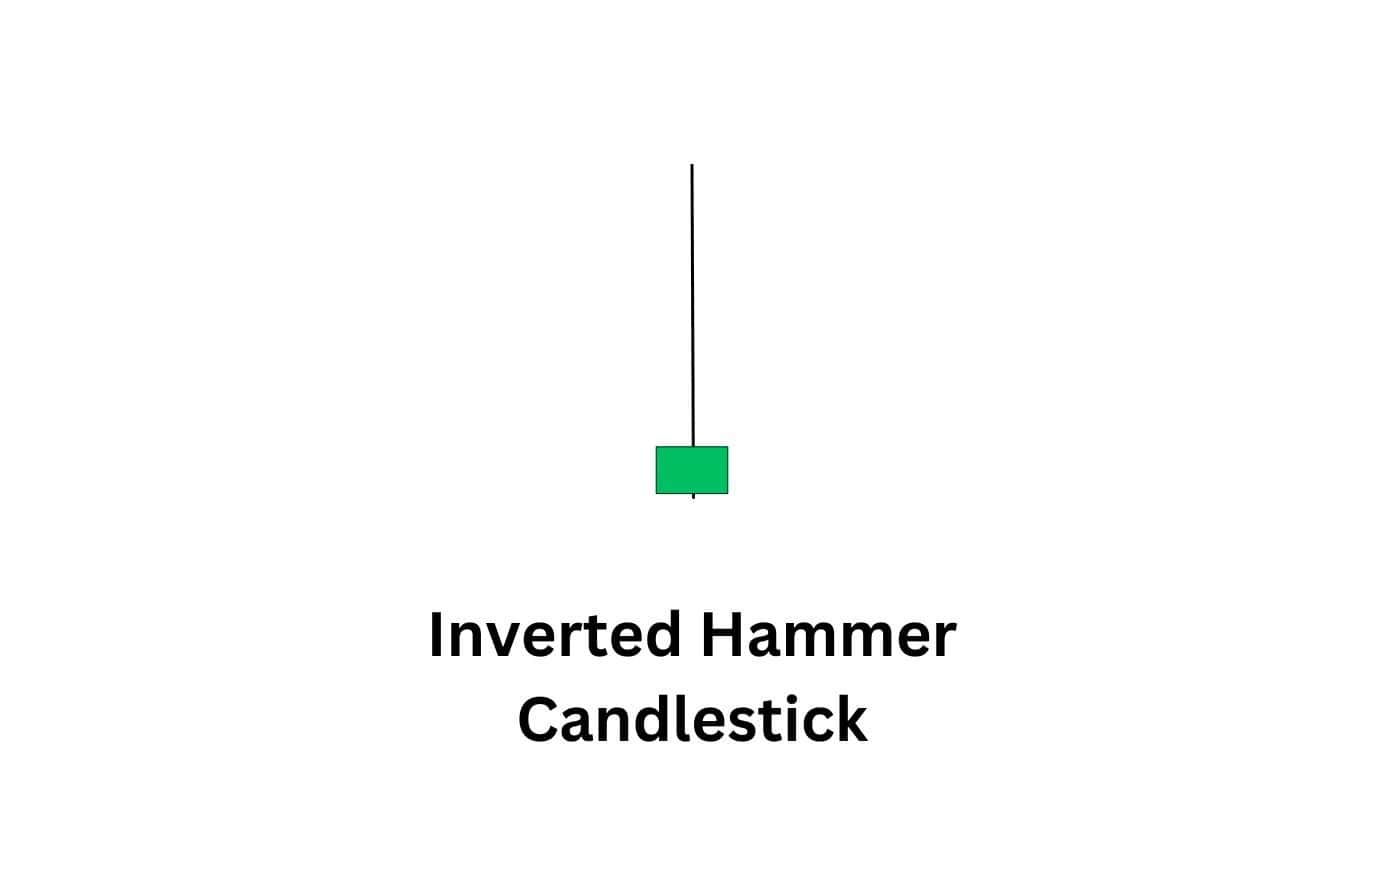
2. Inverted hammer
What is the pattern about?
An inverted hammer also forms at the end of a downtrend but has a small body with a long upper wick. This suggests buyers tried to push prices up, but sellers resisted. Even though the session closes near the open, the pattern hints at a weakening downtrend.
When to use it?
Traders wait for a strong bullish candle after an inverted hammer before entering a trade. It works best when supported by increased volume or confirmation from other indicators like moving averages or trendlines.
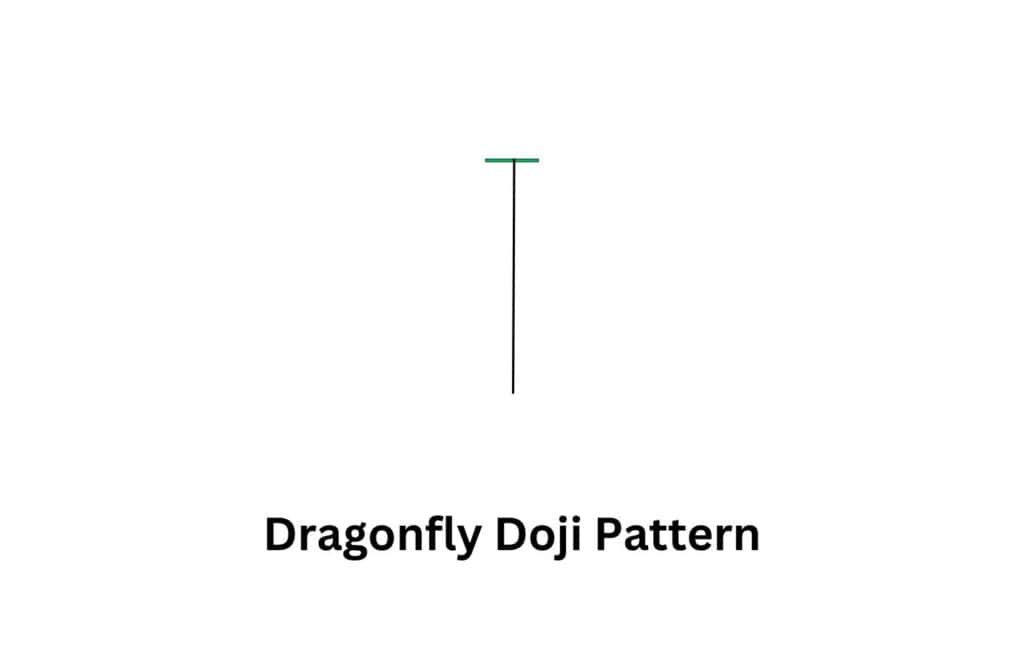
3. Dragonfly Doji
What is the pattern about?
The dragonfly doji has a long lower shadow but almost no upper wick, the prices open and close at or near the high. This shows that sellers led the session initially, but buyers came in to drive the price up by the close.
When to use it?
The pattern is most effective at the bottom of a downtrend, suggesting a possible reversal. In trading, traders wait for a bullish confirmation candle to open a position. The signal is stronger when accompanied by increased volume and support from other technical indicators.
4. Bullish Pin Bar
Here’s how to identify this candlestick pattern:
The bullish pin bar is a single candlestick pattern with a small body, which is bigger than that of a dragonfly doji. The pin bar candlestick indicates that sellers initially pushed prices lower, but buyers stepped in and drove prices higher almost to the point where the candle opened. You can think of the bull pin bar as a hammer with a super long tail.
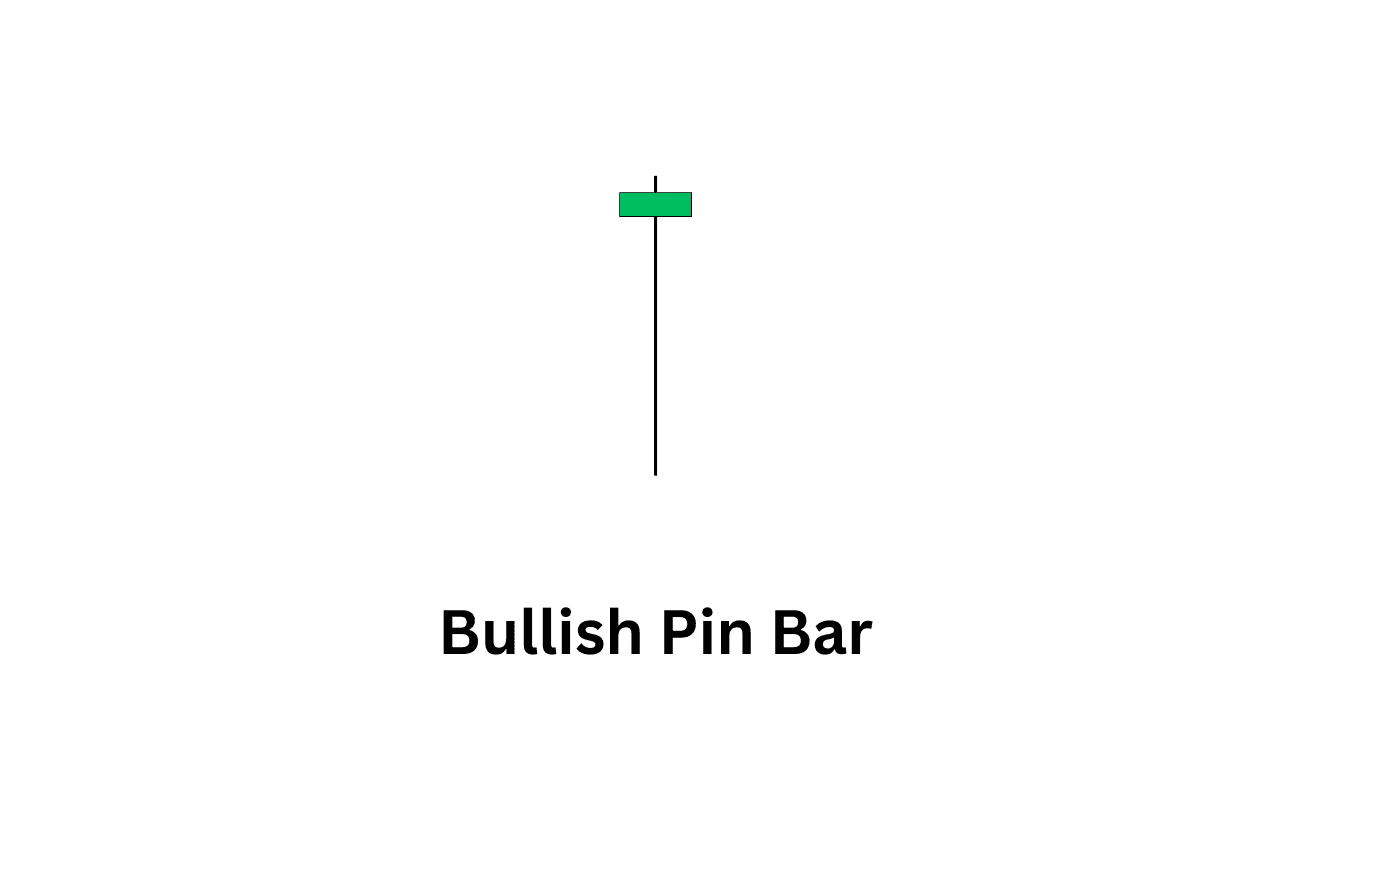
Why this candlestick pattern matters:
This pin bar candlestick chart pattern matters because it reveals buyers are about to control the price. The pattern is more significant if it appears at the end of a downtrend or a support level since it signals that the sellers are losing momentum. It acts as a signal to traders that an uptrend could be about to begin. However, you should not trade this candlestick in isolation; always confirm it with the following candles.
5. Bullish Spinning Top
Here’s how to identify this candlestick pattern:
The bullish spinning top candlestick pattern consists of a single candle with a small real body and long shadows at the top and bottom. The pattern indicates a balance between buyers and sellers. However, its bullish close suggests that buyers might be gaining an advantage.
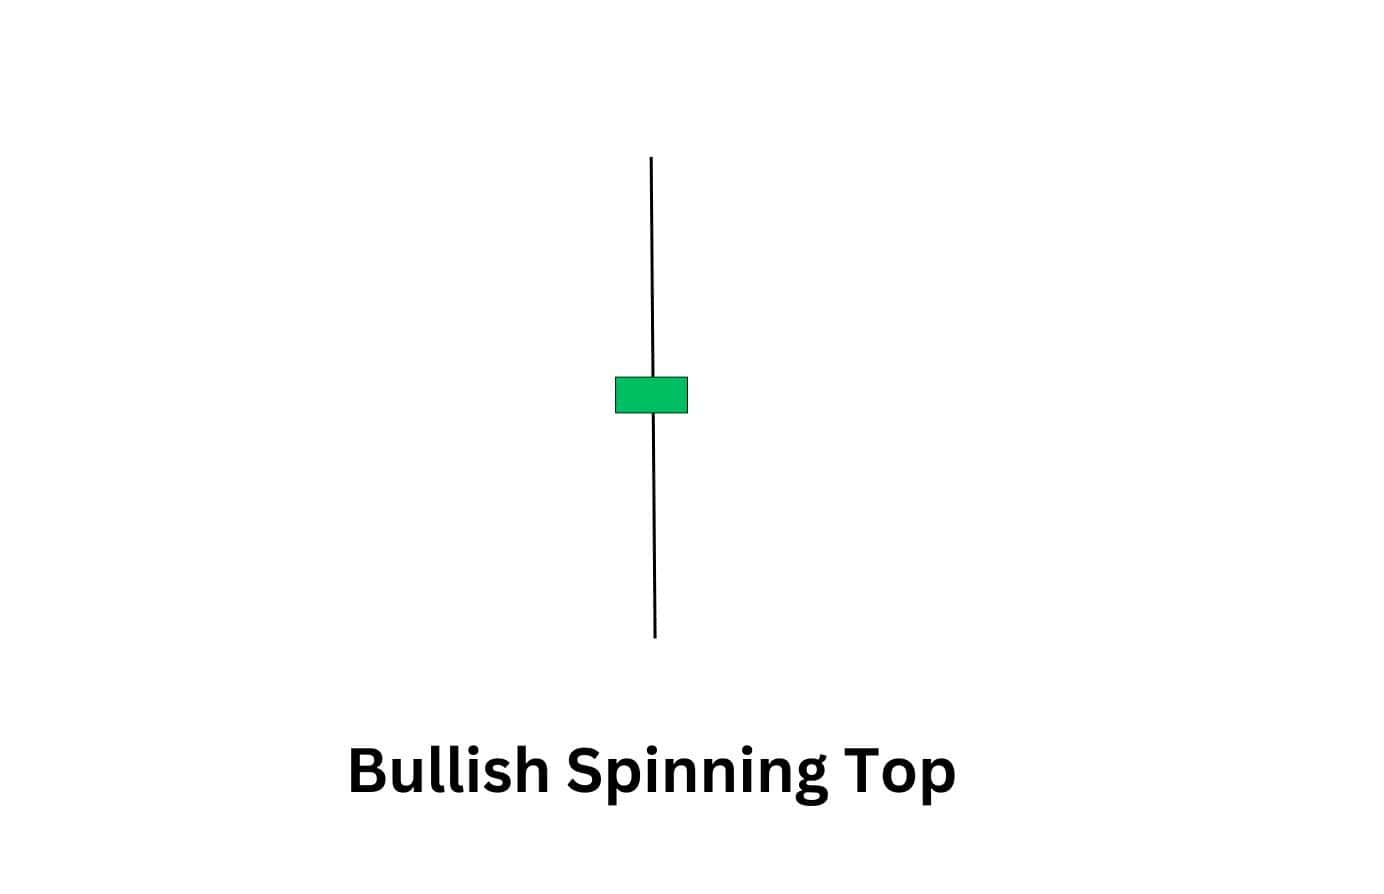
Why this candlestick pattern matters:
The pattern usually indicates a pause in the current downtrend and the potential for a reversal higher. However, it is not the most robust bullish reversal pattern and is considered a subtle clue that an uptrend might begin. This pattern should always be confirmed by the candles that follow it.
6. Tweezer Bottoms
What is the pattern about?
Tweezer bottoms are a two-candle reversal pattern that signals the end of a downtrend. Both candles have similar low points, suggesting that sellers tried to push prices lower but failed twice. The first candle is red, showing continued selling, while the second is green, signaling that buyers are stepping in.
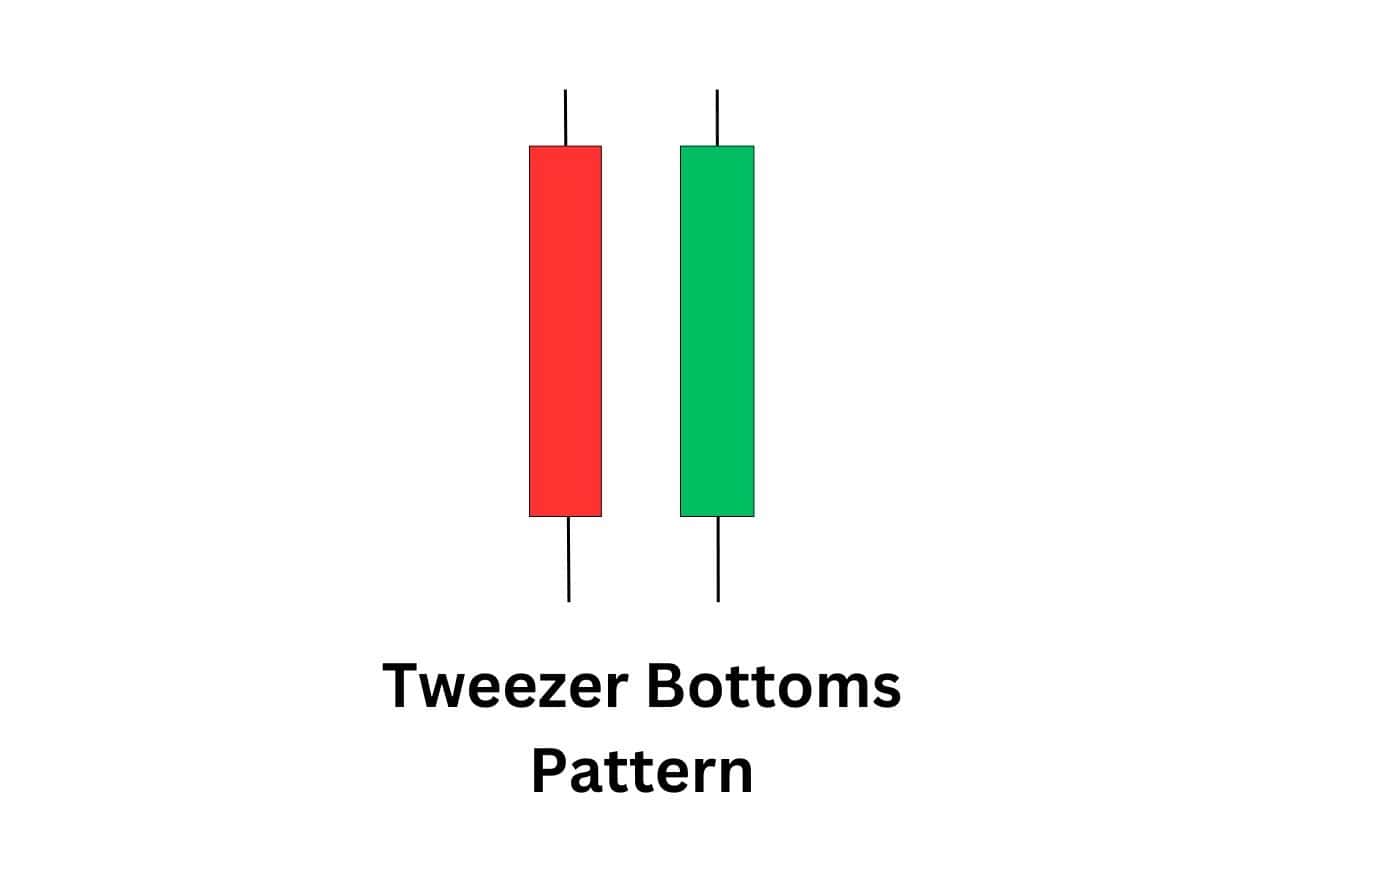
When to use it?
This pattern is most effective when it forms near a strong support level. Traders wait for a bullish confirmation candle after the tweezer bottoms to confirm the reversal. Increased trading volume on the second candle strengthens the signal.
7. Piercing Line
What is the pattern about?
The piercing line is a two-candle bullish reversal pattern that occurs after a downtrend. The first candle is a strong red candle, and then comes a green candle, which opens at a lower level but closes above the midpoint of the previous candle. This shows that buyers are coming in strong after a period of decline.
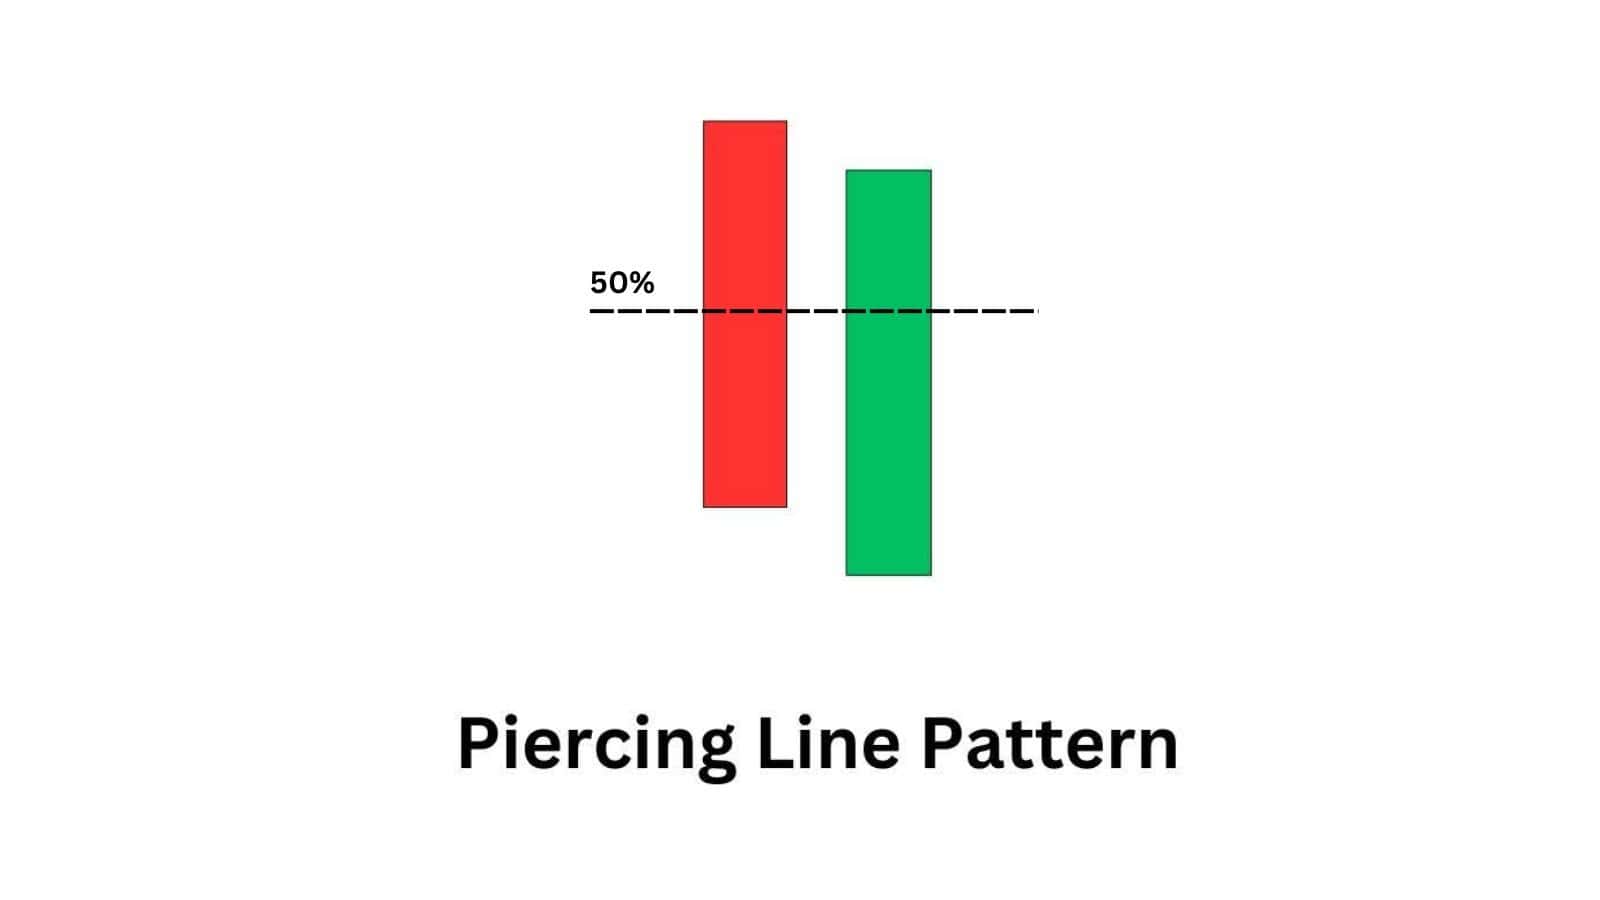
When to use it?
Traders look for this pattern near strong support levels or after a prolonged downtrend. A confirmation candle closing higher than the green candle’s high adds strength to the signal. Higher volume on the second candle increases its reliability.
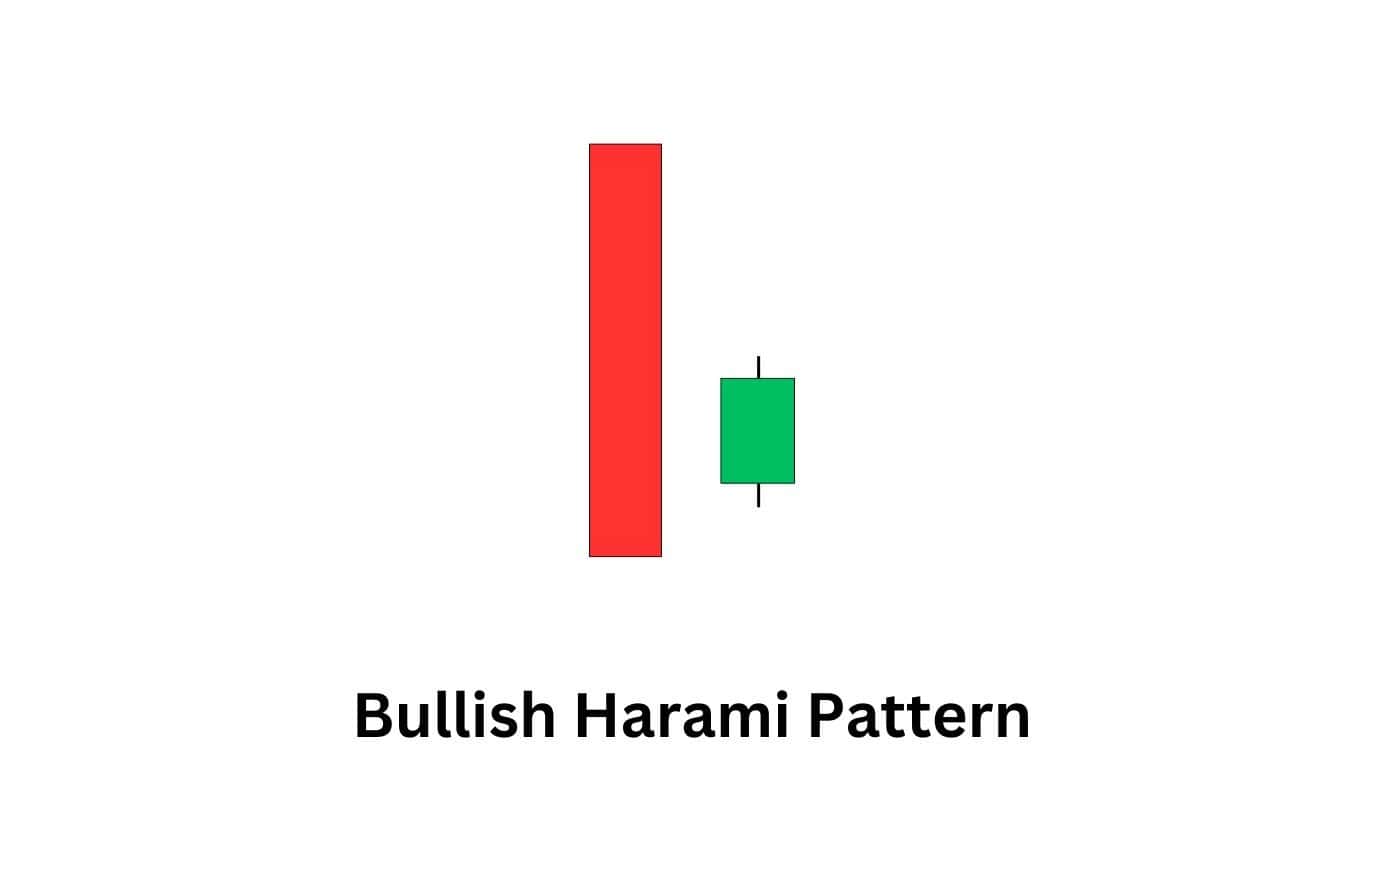
8. Bullish Harami
What is the pattern about?
A bullish harami is a two-candlestick reversal pattern where the second candle, a small green candle, is completely inside the body of the first candle, a red candle. It tells us that selling momentum is decreasing and buyers are trying to take over. Unlike other reversal patterns, a harami reflects hesitation rather than an immediate shift.
When to use it?
Traders use this pattern when a downtrend is losing steam, often near support zones. A confirmation candle closing above the harami’s high increases confidence in the reversal. The pattern becomes stronger when combined with rising volume or additional indicators.
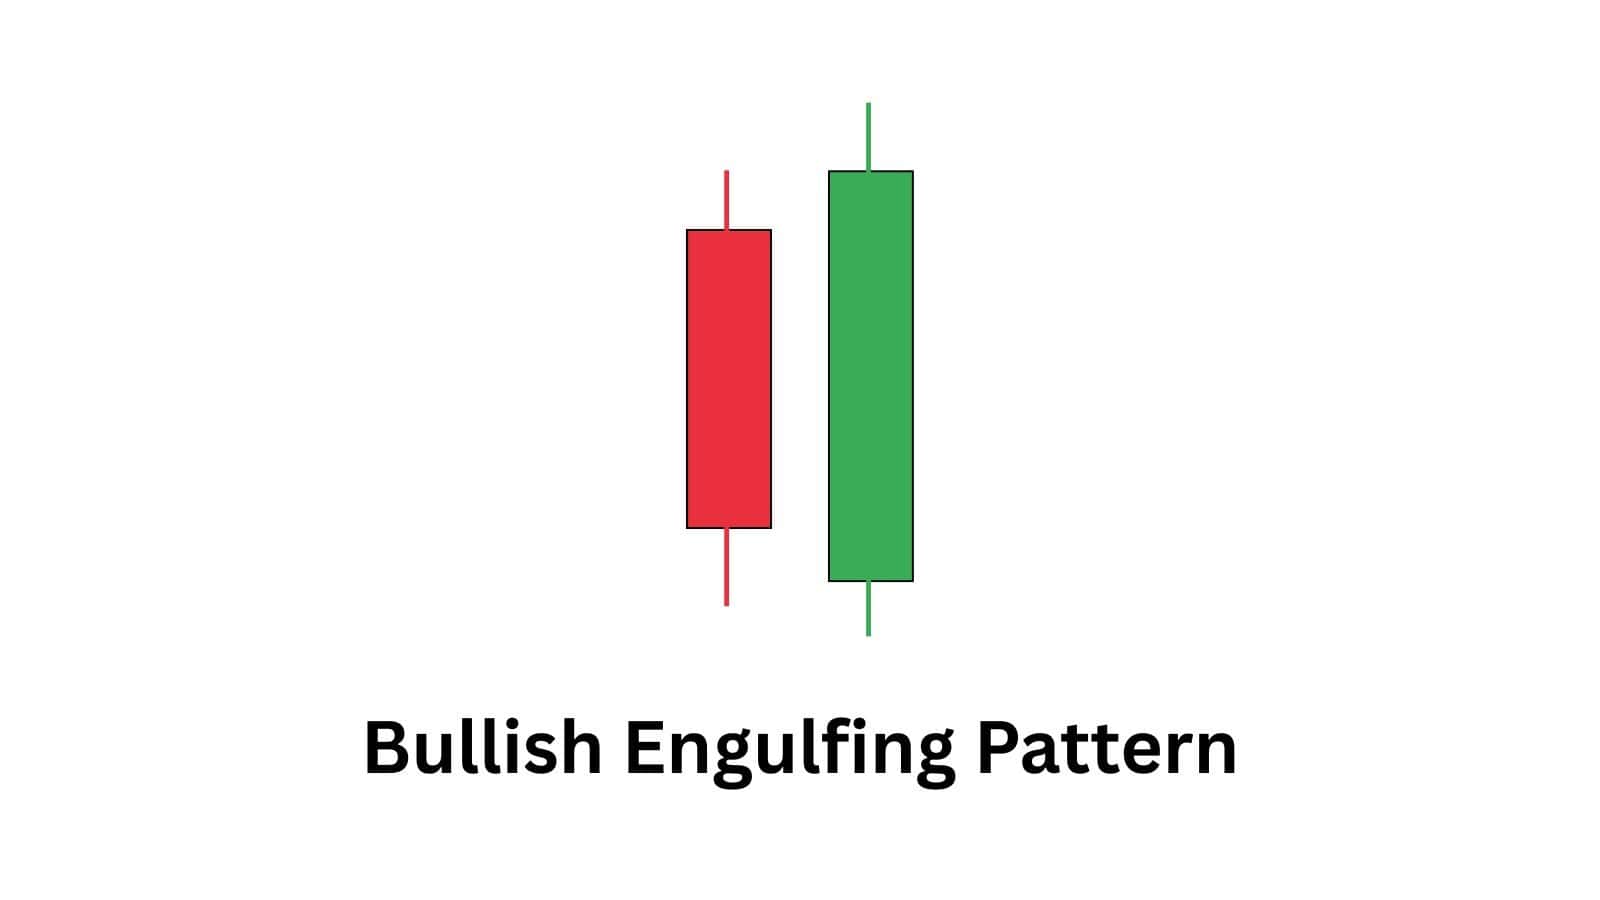
9. Bullish Engulfing Pattern
What is the pattern about?
The bullish engulfing pattern is a two candle reversal signal which forms after a downtrend. The first candle is a small red one and then comes a larger green candle which engulfs the body of the previous candle. This is a sign of strong change in momentum as buyers overwhelm sellers.
When to use it?
This pattern is most effective near key support levels or after a prolonged downtrend. A confirmation candle closing higher strengthens the reversal signal. Increased volume on the second candle adds further credibility.
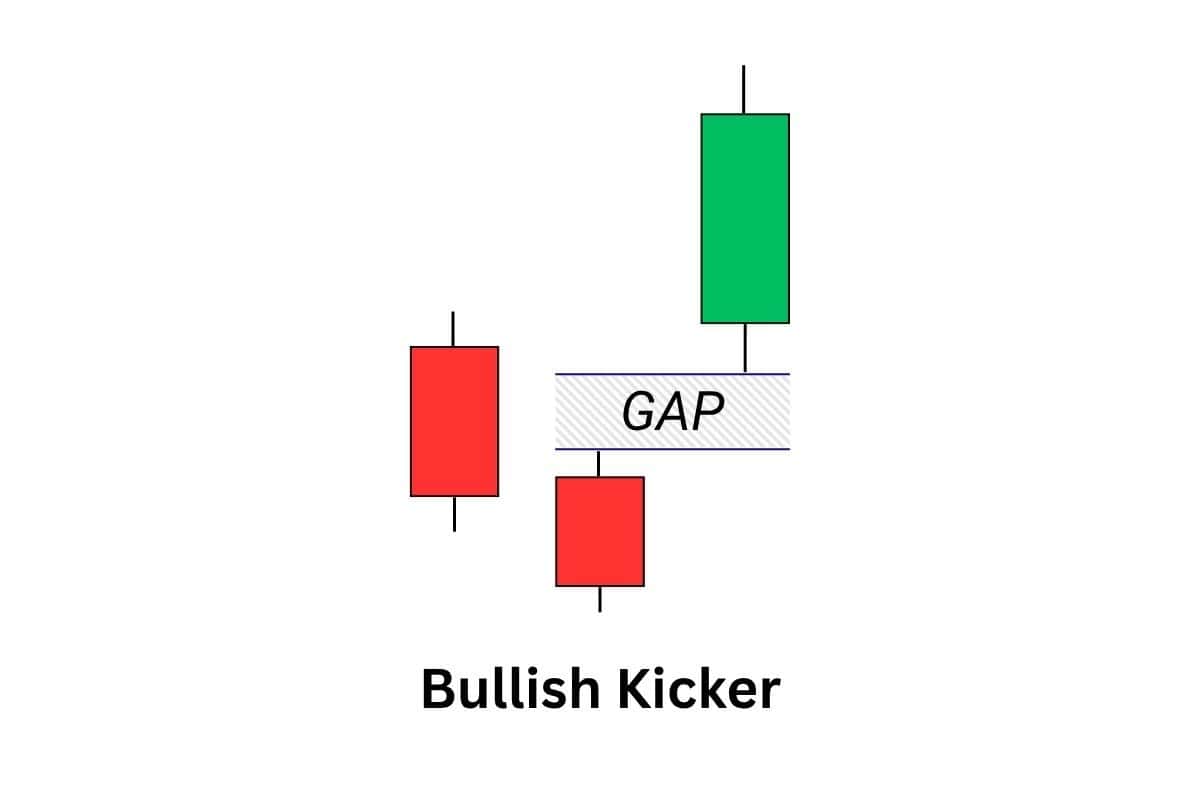
10. Bullish Kicker
What is the pattern about?
A bullish kicker is a two-candle setup that is used to indicate a sudden shift in the market. The first candle is a strong red one, and the second candle is a green candle that gaps up and opens above the close – no touch up. This sudden move is considered a change in sentiment and is usually due to unforeseen news or strong buying pressure.
When to use it?
Traders use this pattern to spot sharp reversals or breakout opportunities. Since it represents a sudden market shift, confirmation isn’t always necessary, but high trading volume on the second candle adds confidence. The bullish kicker is most effective when it appears at major support zones or after prolonged downtrends.
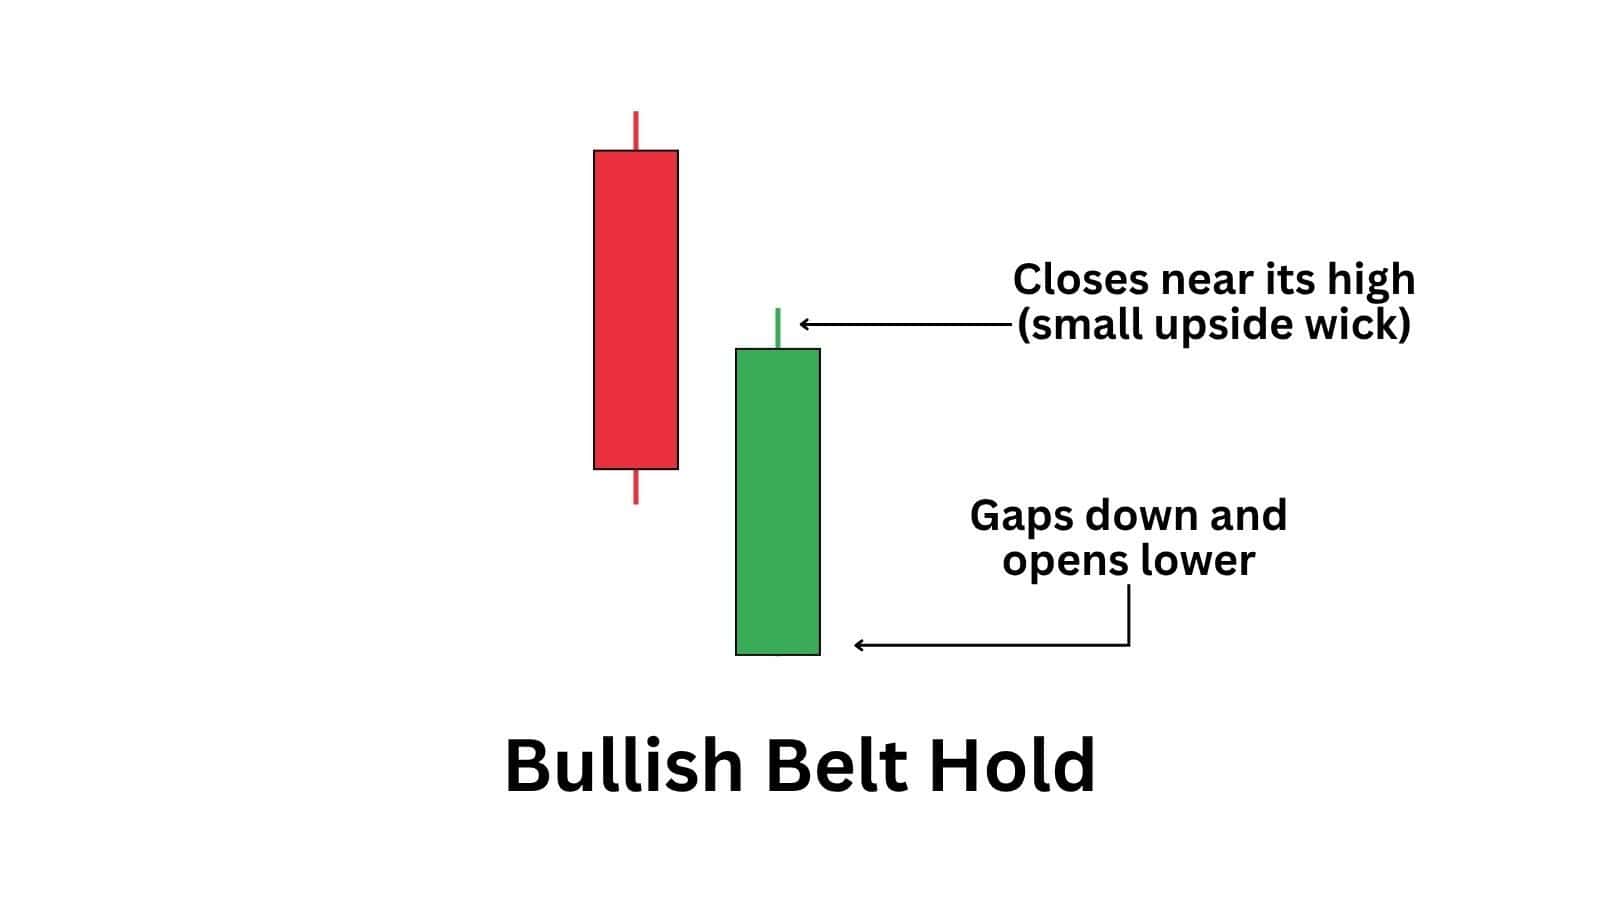
11. Bullish Belt Hold
What is the pattern about?
The bullish belt hold is a single-candle reversal pattern that forms after a downtrend. It opens at or near its low and rallies strongly to close near its high, with little to no lower wick. This shows immediate buying pressure, where price holds the opening level and sellers fail to push it any lower.
A small upper wick is acceptable, but a large one may indicate selling pressure near the highs and weaken the signal.
When to use it?
It works best after an extended selloff or when price reaches key support levels, where the market is already stretched. Rather than entering immediately, traders typically wait for a break above the candle high or a small pullback to confirm continuation.
12. Bullish Counterattack Line
Here’s how to identify this candlestick pattern:
This pattern comprises two candlesticks. The first candle is bearish and extends the downtrend. The second candle is bullish and opens much lower but closes at or near the closing price of the first candle. This creates a counterattack against the bearish pressure or momentum.
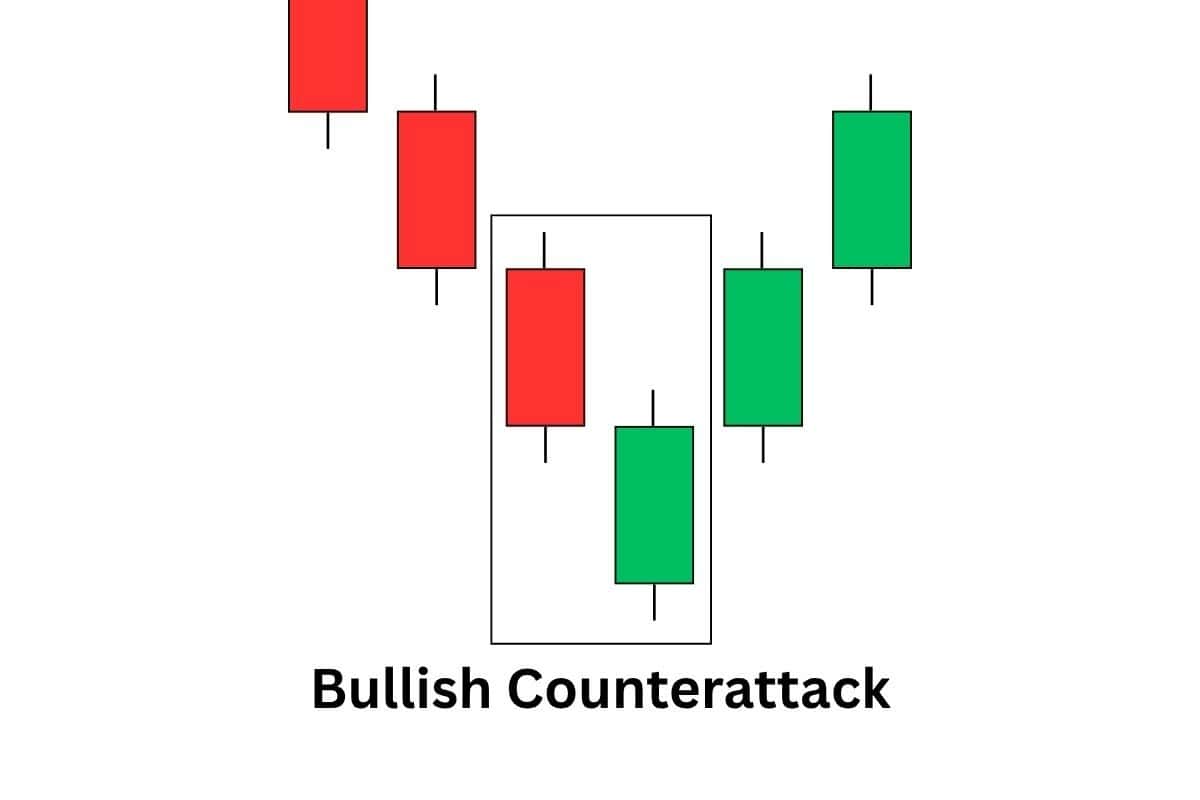
Why this candlestick pattern matters:
The bullish counterattack line pattern matters because it shows that buyers and sellers are fighting to control the price. It also signals that buyers have boldly stepped into the market and are pushing prices higher. The pattern often leads to a price rebound, and traders use it to identify market rebound opportunities.
13. Bullish Homing Pigeon
Here’s how to identify this candlestick pattern:
The Bullish Homing Pigeon is a two-candle pattern. The first candle is a larger bearish one, followed by a smaller bearish candle that is entirely inside the range of the first one. The second candle demonstrates market indecision or weakening bearish momentum. As the bearish sentiment reduces, this could signal the beginning of a new uptrend.
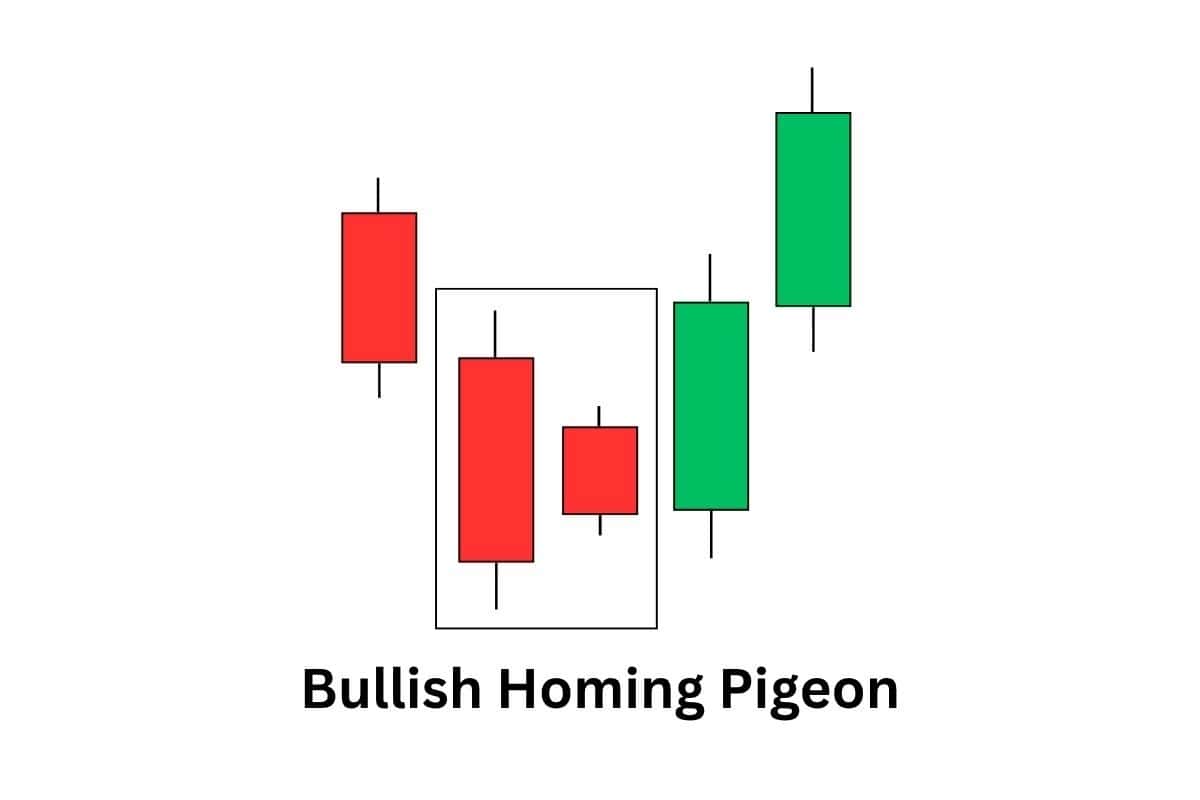
Why this candlestick pattern matters:
This candlestick pattern is crucial since it shows that the bearish momentum could dissipate, and an upward reversal could be underway. Traders regard this pattern as an indicator that an upward trend could begin, but it must be confirmed with other indicators, such as volume indicators.
14. Morning Star
What is the pattern about?
The morning star is a three-candle formation that signals a shift from bearish to bullish sentiment. It starts with a strong red candle, followed by a small-bodied candle showing indecision, and ends with a large green candle confirming the reversal. This pattern reflects a transition from selling pressure to buying strength.
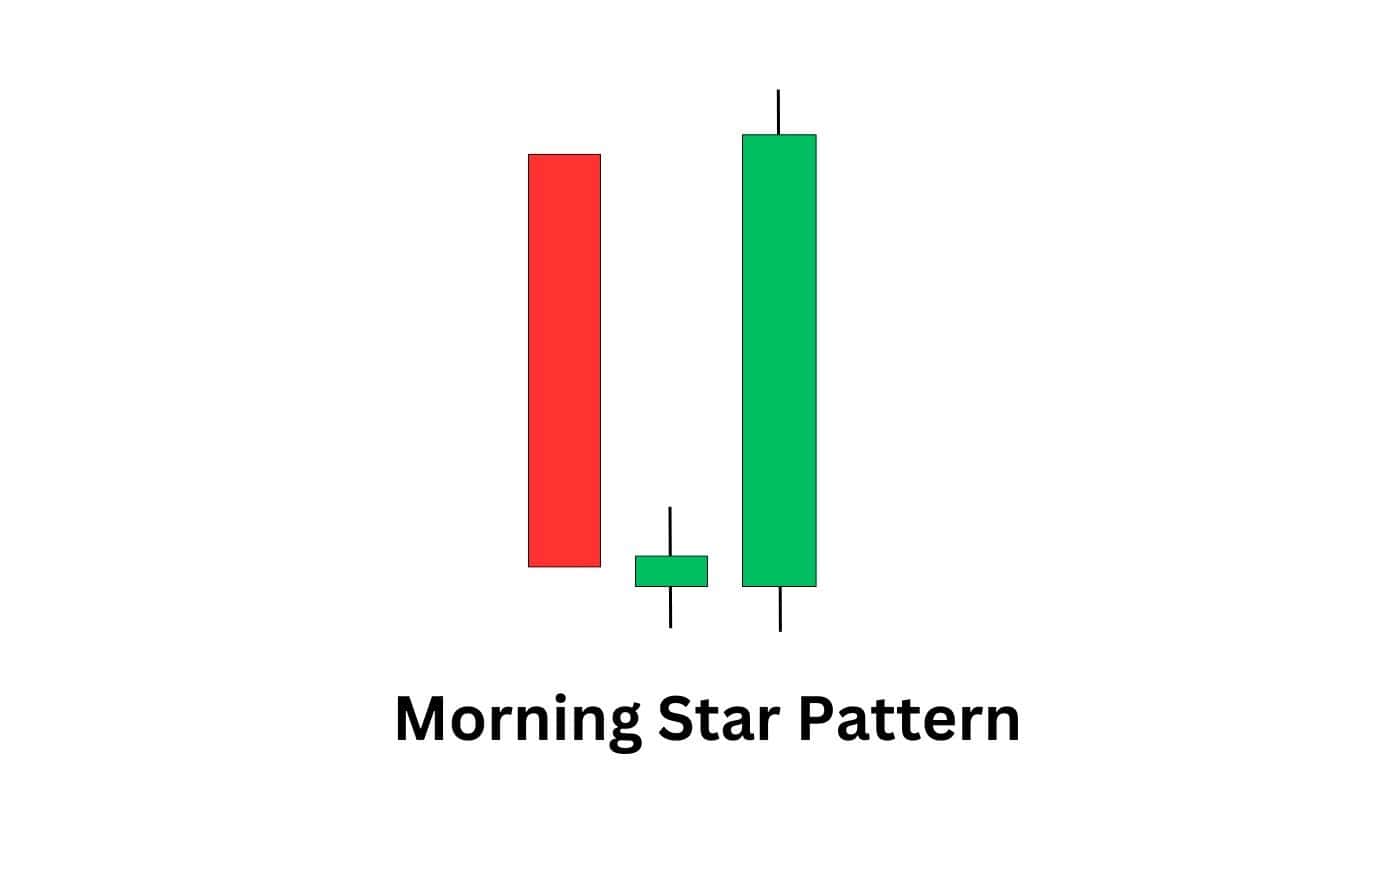
When to use it?
Morning stars work best after prolonged downtrends, especially at major support zones. The third candle closing above the midpoint of the first candle strengthens the signal. Volume spikes further increase reliability.
15. Morning Doji Star
What is the pattern about?
A variation of the morning star, this pattern replaces the middle candle with a doji, which means the market is highly uncertain. Sellers dominated at first, but indecision took over before buyers finally regained control in the third candle.
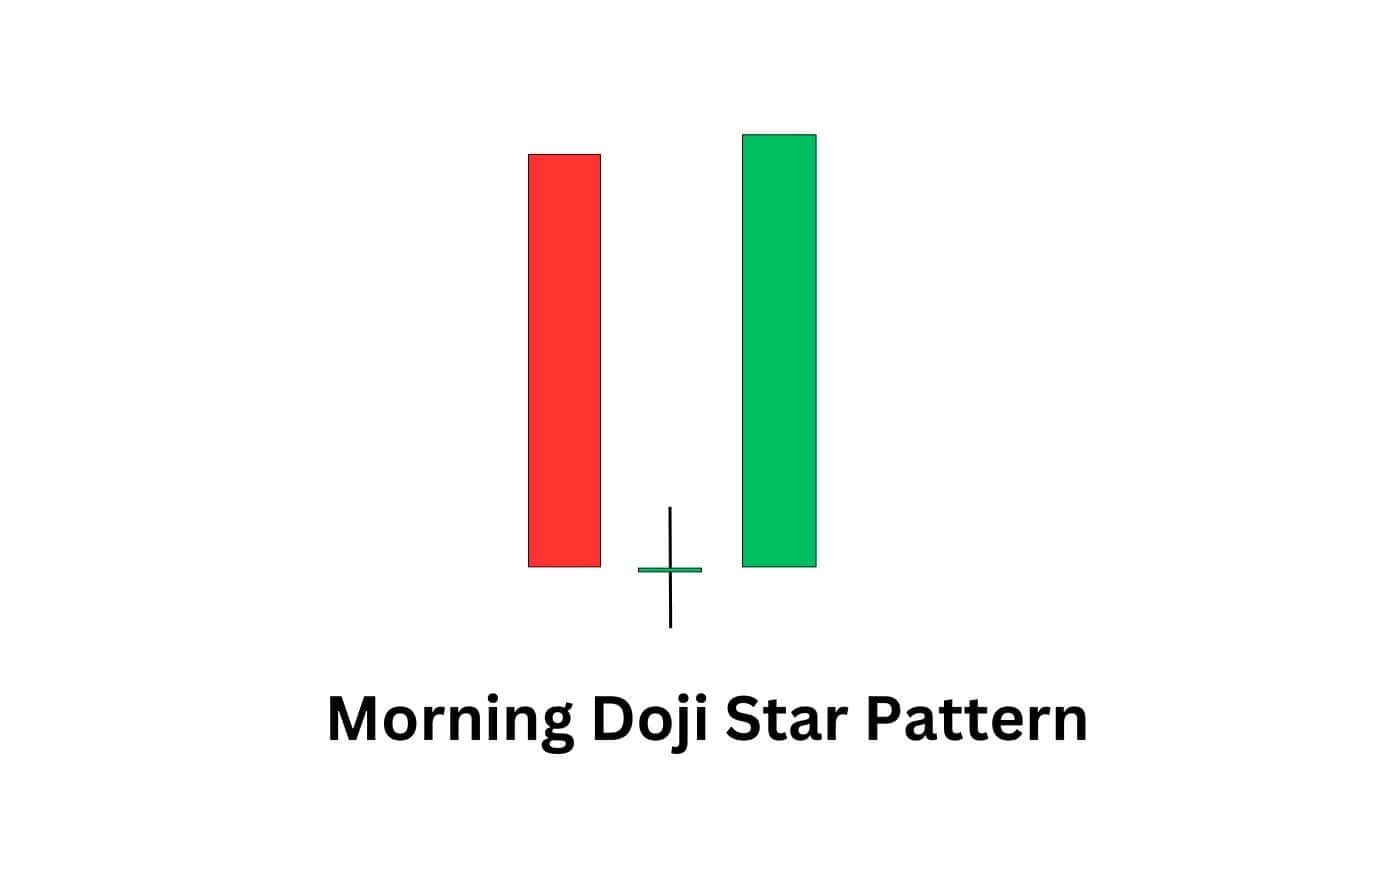
When to use it?
The morning doji star is a stronger reversal signal because the doji highlights market hesitation before the shift. Traders look for a strong bullish candle after the pattern and higher volume to confirm the new uptrend.
16. Three White Soldiers
What is the pattern about?
The three white soldiers pattern is made of three small green candles in a row, during which each candlestick opened within the body of the previous one and closed at a higher price. This pattern is a sign of the robust buying pressure and a possible trend reversal from the bear market.
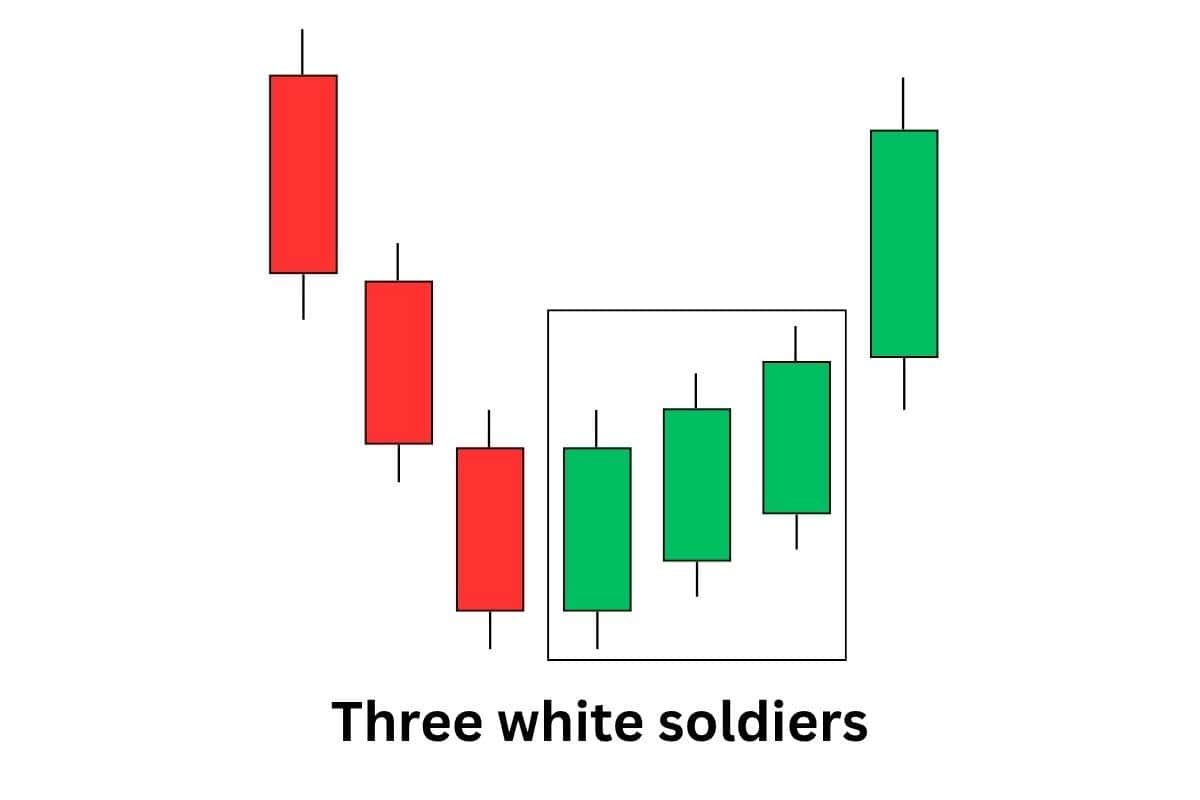
When to use it?
Traders use this pattern when looking for trend reversals or strong breakout signals. It works best when supported by rising volume and appears near support levels. Avoid chasing trades if the pattern forms after an extended rally, as overbought conditions may lead to a pullback.
17. Bullish Abandoned Baby
What is the pattern about?
An abandoned baby bottom is a three-candle reversal pattern that signals a potential bullish shift. It starts with a strong red candle, then a doji that gaps down (a sign of uncertainty), and then a very strong green candle that gaps up, showing that buyers have taken control.
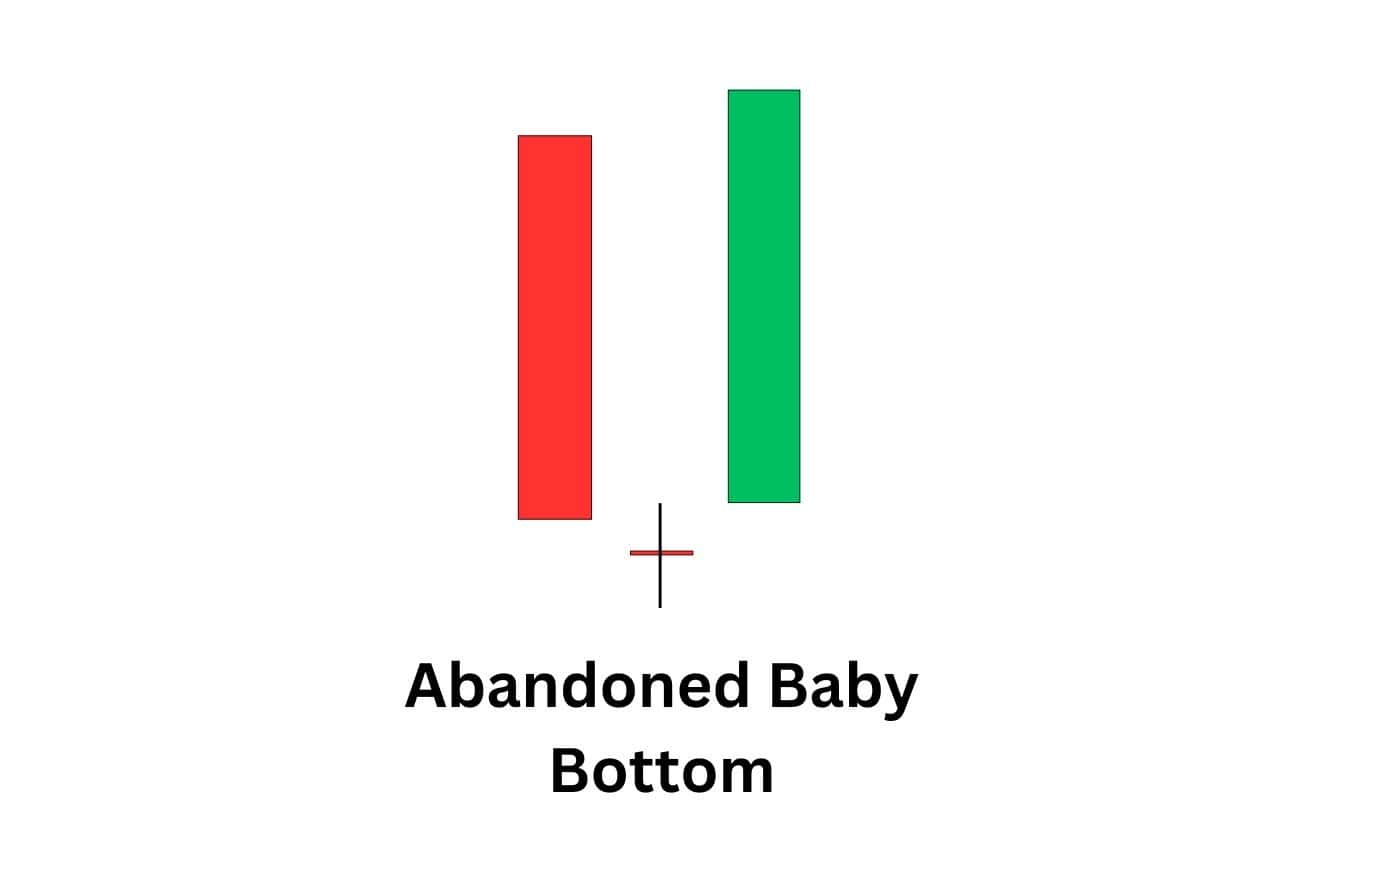
When to use it?
This pattern is rare but highly reliable. Traders use it when a downtrend has been exhausted, especially when the final green candle has strong volume. It works best when combined with key support levels or other bullish indicators.
18. Three Inside Up
What is the pattern about?
The three inside up is a three-candle bullish reversal pattern. It opens with a large red candle, followed by a small green candle that moves within the body of the first candle, and finishes with a third green candle above the first candle’s high. This shows the transition from downward momentum to upward pressures.
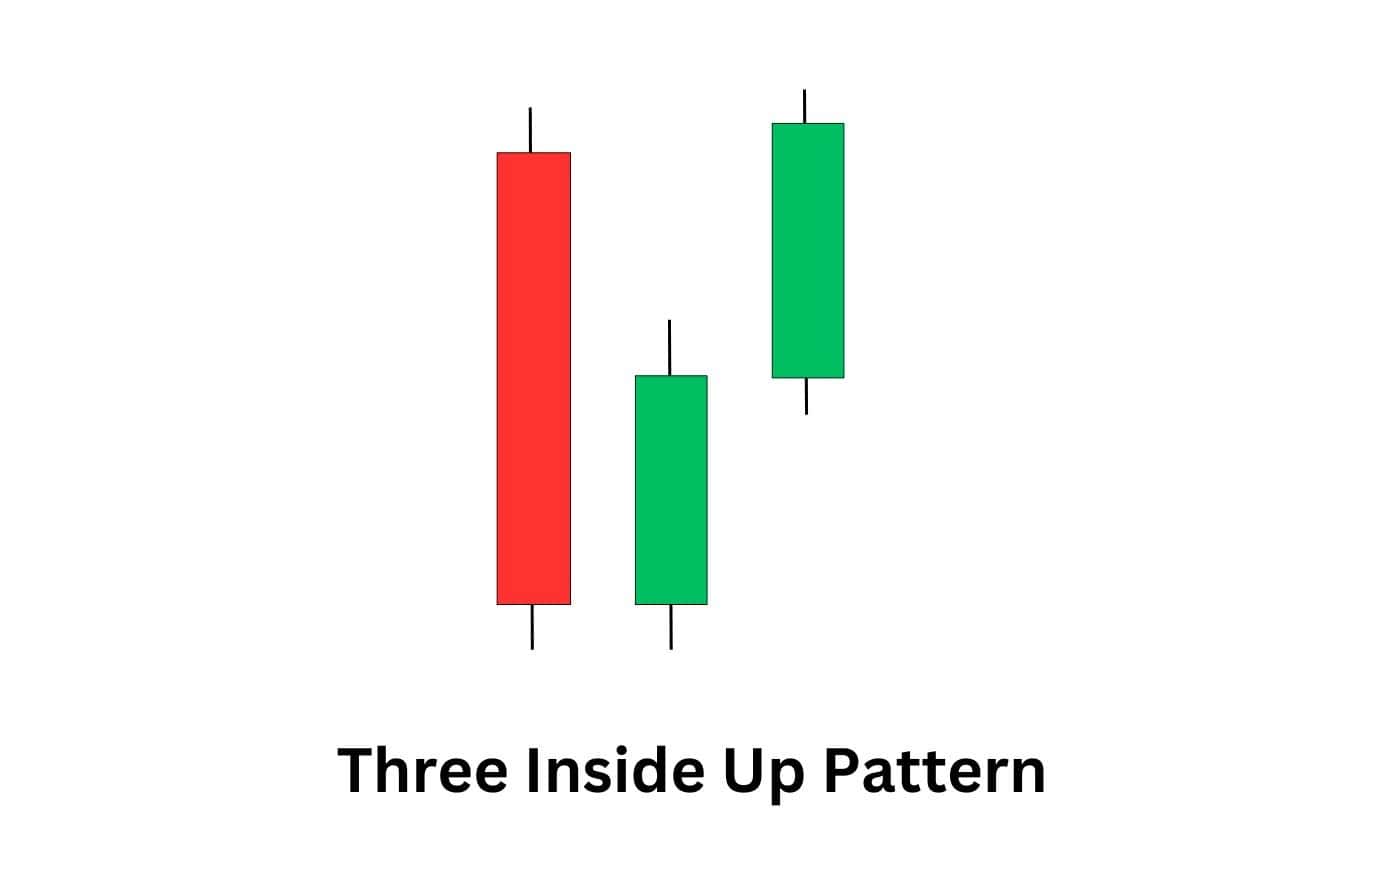
When to use it?
This pattern is useful when a downtrend is weakening, especially near support levels. Traders wait for the third candle to confirm the reversal before entering long positions. A rise in volume during the third candle increases confidence in the pattern.
19. Three Outside Up
What is the pattern about?
The three outside up is another three-candle bullish reversal pattern. It starts with a small red candle, then a big green candle that absorbs the whole first candle, and then another green candle that even closes higher. This shows a strong transition from bearish to bullish sentiment.
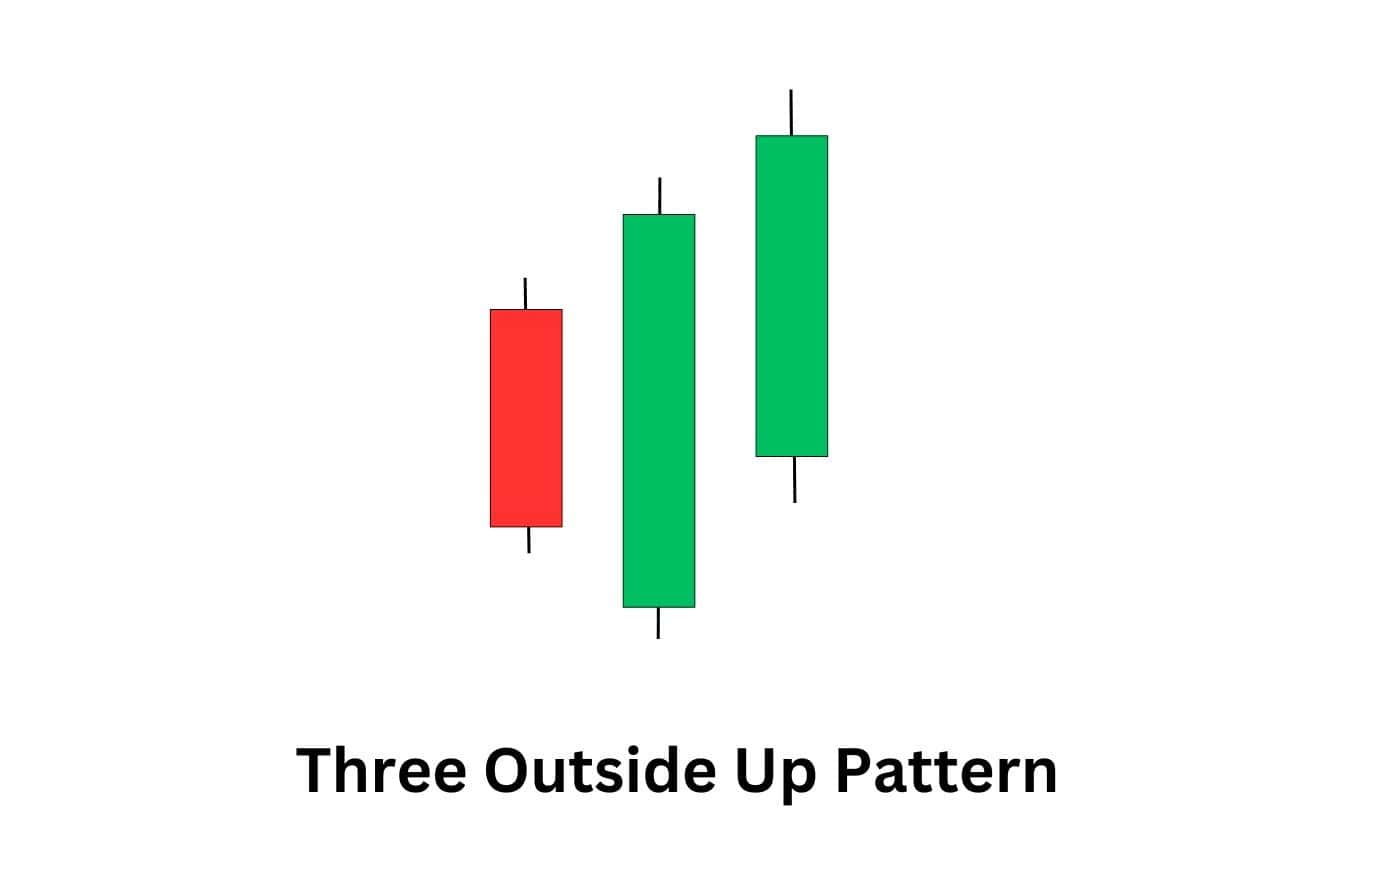
When to use it?
Traders look for this pattern when a downtrend is losing strength. The second candle’s engulfing action signals a momentum shift, while the third candle confirms the bullish move. Higher volume during the second and third candles strengthens the reversal signal.
20. Bullish Stick Sandwich
What is the pattern about?
The bullish stick sandwich is a three candle pattern that is used to confirm a possible trend reversal and is made up of two red candles separated by a green candle. The first and third candles have nearly identical closing prices, while the middle green candle attempts to push higher but doesn’t hold. This pattern suggests that despite selling pressure, buyers are stepping in to defend a key price level.
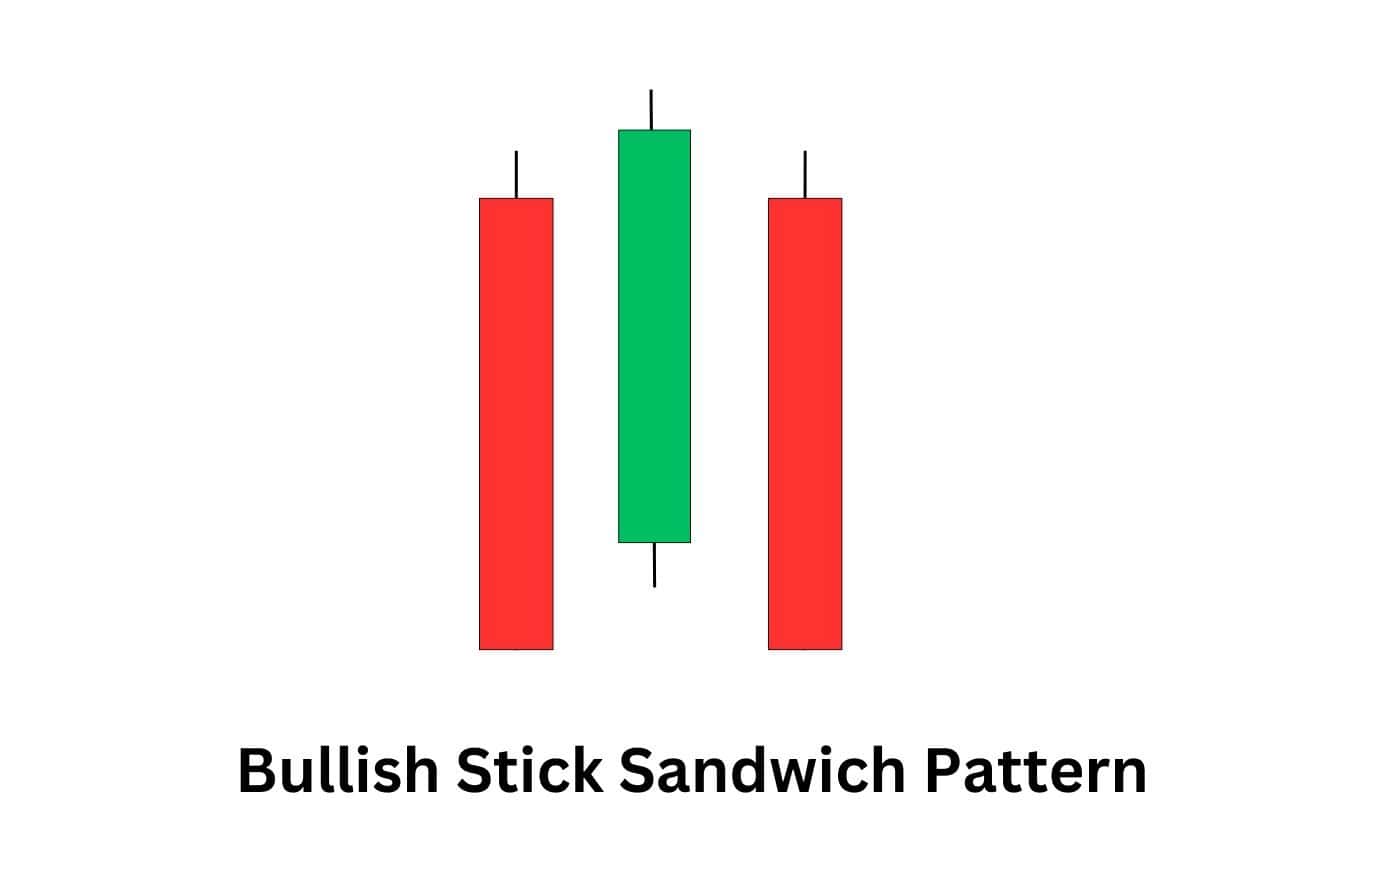
When to use it?
Traders look for this pattern when a downtrend is losing momentum. Since the closing prices of the first and third candles are the same, it suggests a strong support level. A confirmation candle closing above the third candle’s high increases the chances of an upward move.
21. Bullish Tri Star
What is the pattern about?
The bullish tri star is a rare three-candle reversal pattern that can signal a potential shift from bearish to bullish momentum. It forms after a downtrend and consists of three consecutive doji candles, showing growing indecision as selling pressure starts to weaken. The second doji gaps below the first, while the third gaps back up from the second.
This structure suggests that bears are losing control and buyers are beginning to step in. In simple terms, price stops falling cleanly, stalls out, and then starts to lift, which can hint at a bullish reversal.
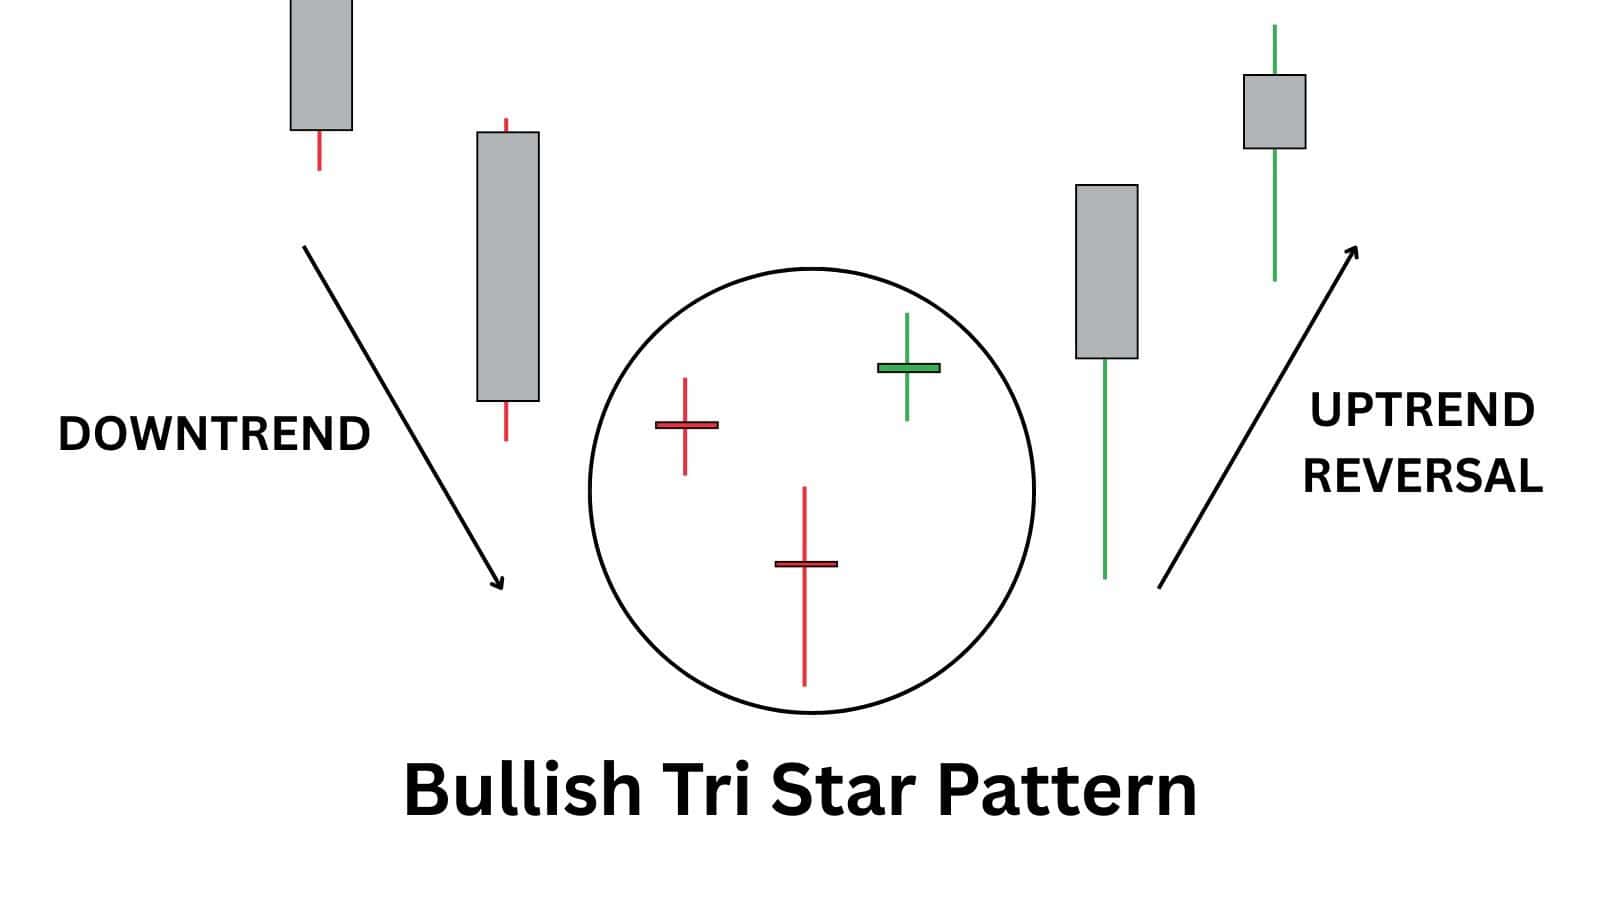
When to use it?
This is an extremely rare pattern, and its textbook form is most commonly seen in stocks and on higher timeframes such as the daily chart, where price gaps are easier to spot. In general, people do not use the bullish tri star as a standalone buy signal.
The usual approach is to treat it as a potential reversal warning near support, then wait for confirmation such as an upside break above the pattern, bullish follow-through, or momentum divergence.
22. Double Bottom
What is the pattern about?
A double bottom is a bear market reversal signal that is generated by a chart pattern. A double bottom occurs when the price drops, touches a support level, and then moves higher, only to fall back to the same level one more time before moving higher. This results in a ‘W’ shaped chart pattern, which shows that buyers are ready to defend a particular price.
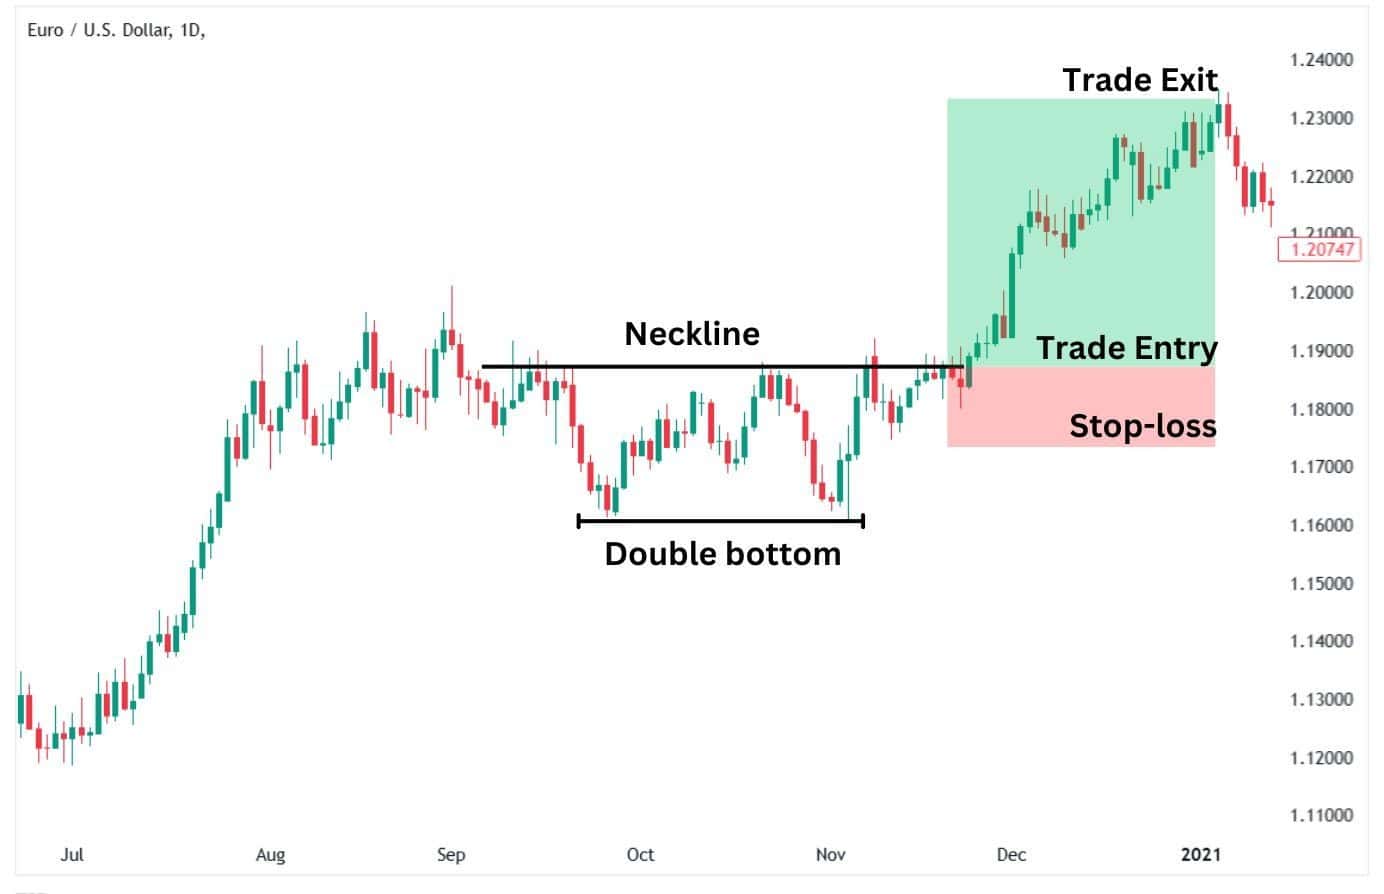
When to use it?
Traders watch for a breakout above the high between the two bottoms to confirm the reversal. A surge in volume at the breakout level strengthens the pattern. It works best when the second bottom is slightly higher than the first, showing increasing buying pressure.
23. Triple Bottom
What is the pattern about?
A triple bottom is a stronger version of the double bottom, forming after three failed attempts to break below the same support level. Each dip gets bought up, showing that sellers are losing control. Once the price breaks above the resistance level formed between the bottoms, it signals a bullish reversal.
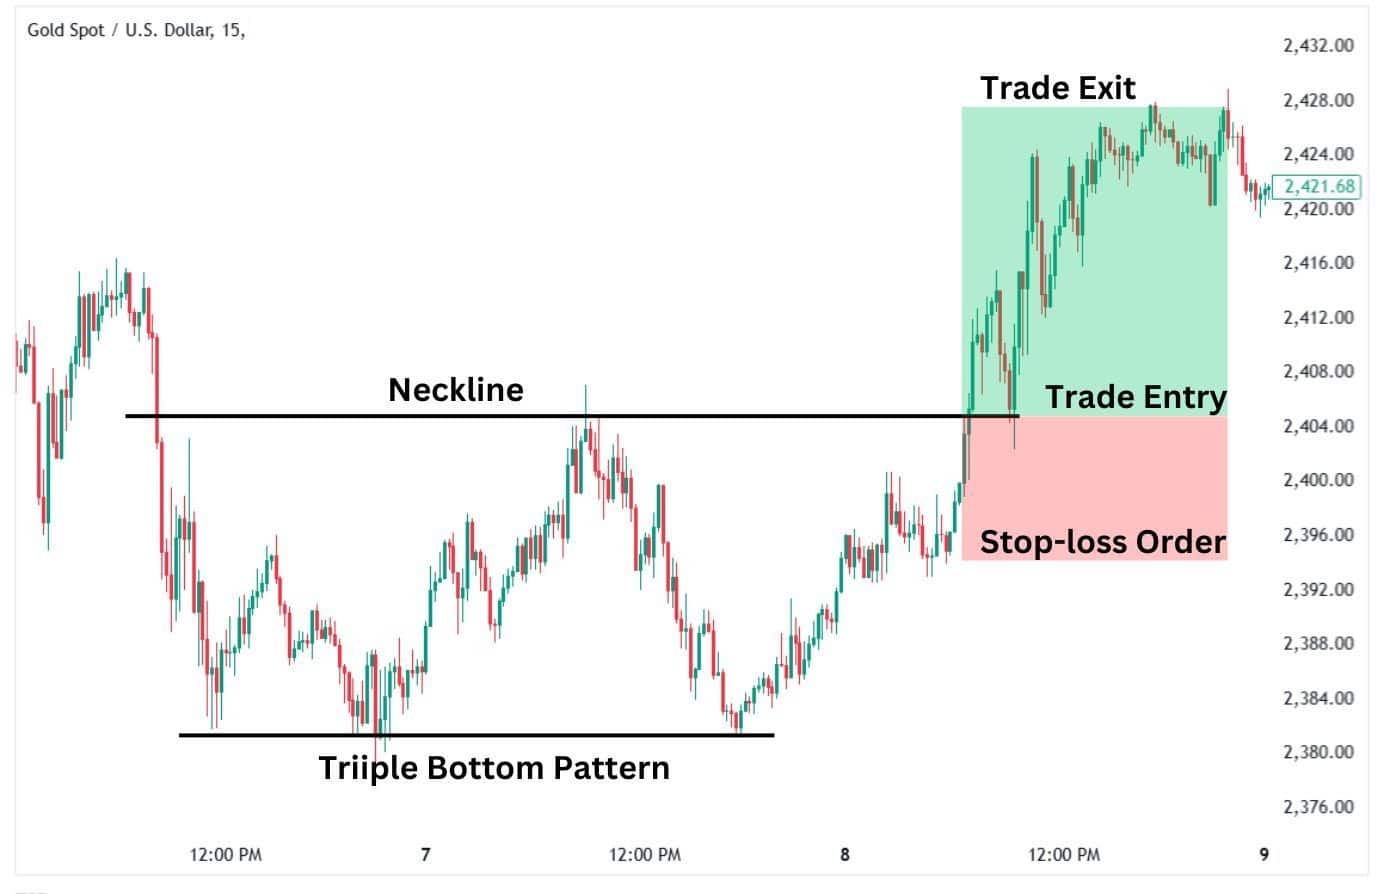
When to use it?
This pattern is useful when the market repeatedly rejects lower prices. Traders wait for a breakout above the high between the three lows for confirmation. Higher volume on the breakout candle increases reliability.
24. Inverse Head and Shoulders
What is the pattern about?
The inverse head and shoulders is a bullish reversal pattern that occurs at the end of a downtrend. The pattern has three lows; the middle low is the deepest, and the two shorter lows are shouldered on either side of the chart. A resistance line, known as the “neckline” is formed by the highs between these lows. A breakout above the neckline confirms the reversal.
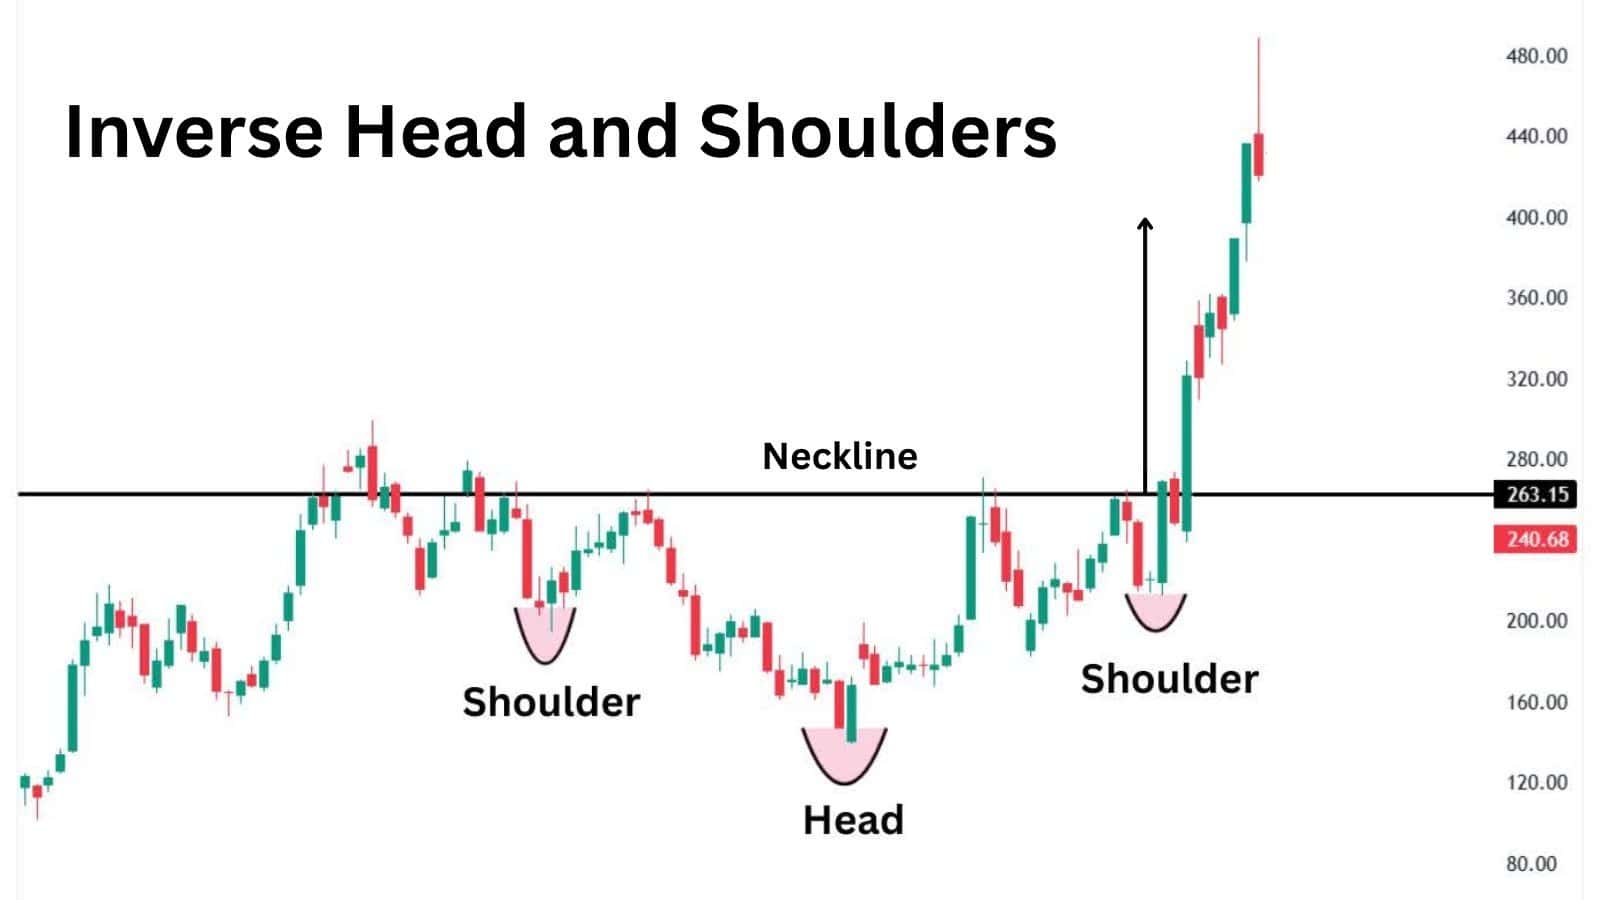
When to use it?
Traders wait for the price to break above the neckline before entering long positions. Higher volume on the breakout strengthens the pattern. It works best when the shoulders are symmetrical and the overall trend has been bearish before the formation. Then, by measuring the height of the pattern, traders can get a projection of how far the breakout will go.
25. Falling Wedge
What is the pattern about?
A falling wedge is a bullish reversal pattern that occurs when the price moves lower and is enclosed between two falling trendlines. The highs and lows gradually converge, showing that selling pressure is fading. Once the price breaks above the upper trendline, it signals that buyers are taking over.
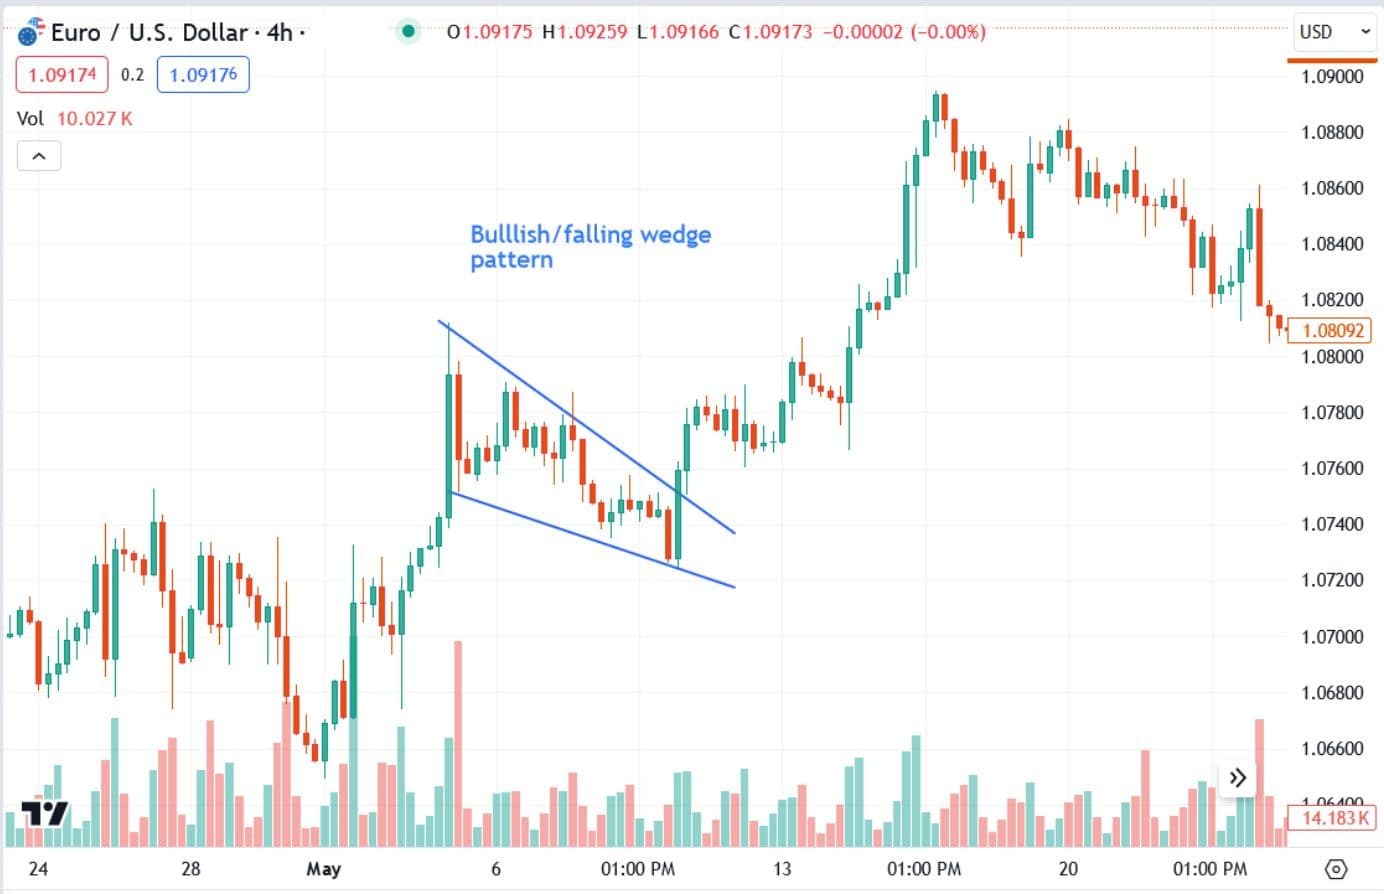
When to use it?
This pattern is useful when the market is in a downtrend but shows signs of slowing momentum. Traders wait for a breakout above the wedge’s resistance line before entering a trade. Rising volume on the breakout confirms the shift in trend.
Bearish Reversal Candlestick patterns
26. Shooting Star
What is the pattern about?
Shooting star is a single-candlestick pattern which occurs at the top of an uptrend. It has a small body at the bottom and a long upper wick which means that buyers tried to push the prices up but sellers pushed them down. This shift in control hints at potential weakness in the trend.
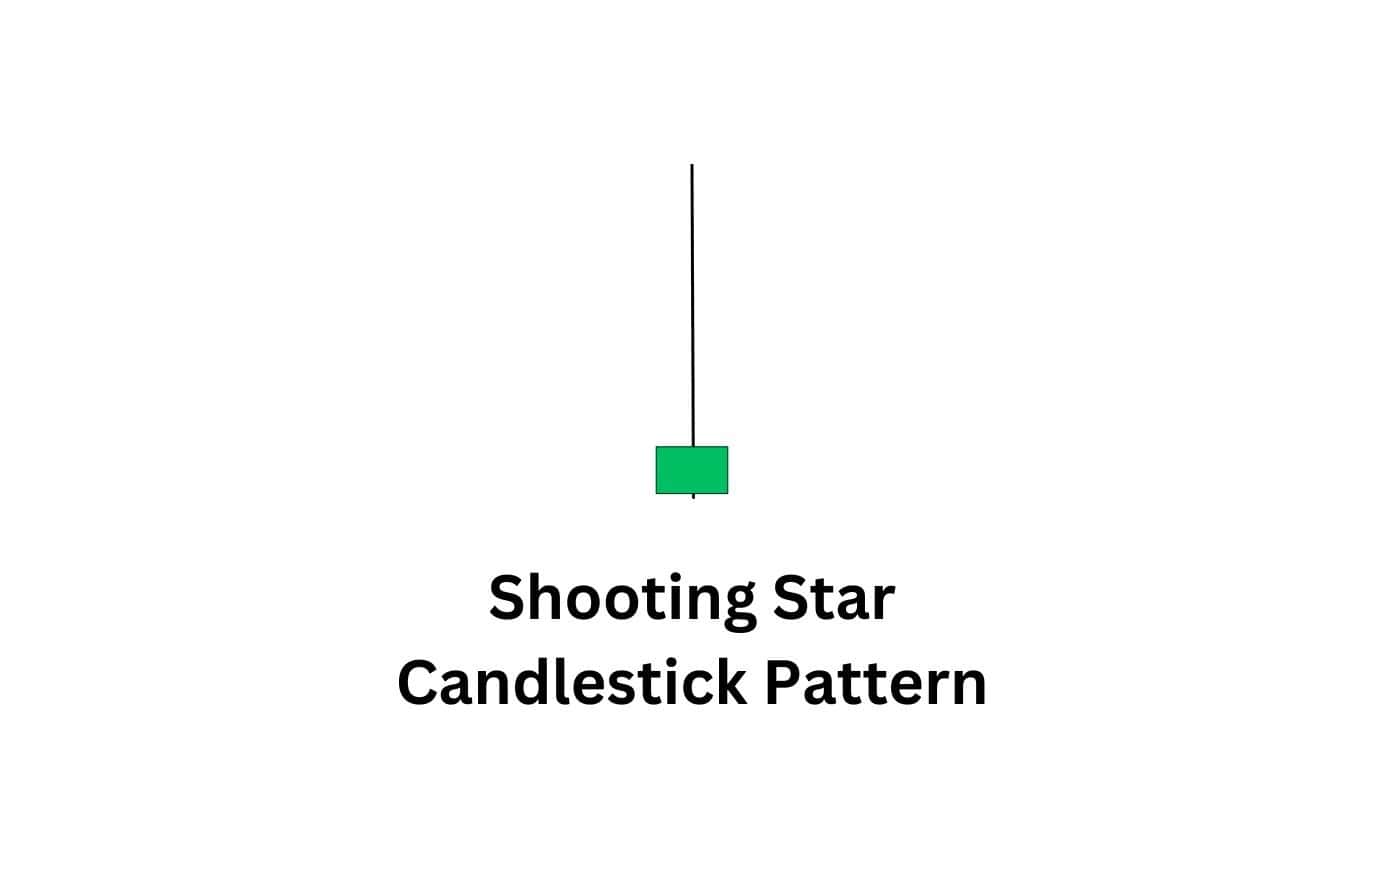
When to use it?
The shooting star is used by traders as a sign that a trend may be weakening. It gains more significance when it forms near resistance levels or after a prolonged rally. Confirmation from a bearish candle in the next session helps validate the signal.
27. Hanging Man
What is the pattern about?
The hanging man pattern appears at the peak of an uptrend. It has a small body near the top and a long lower wick, showing that sellers tried to push prices lower but buyers pulled them back up. Despite the recovery, the long wick suggests that selling pressure is creeping in.
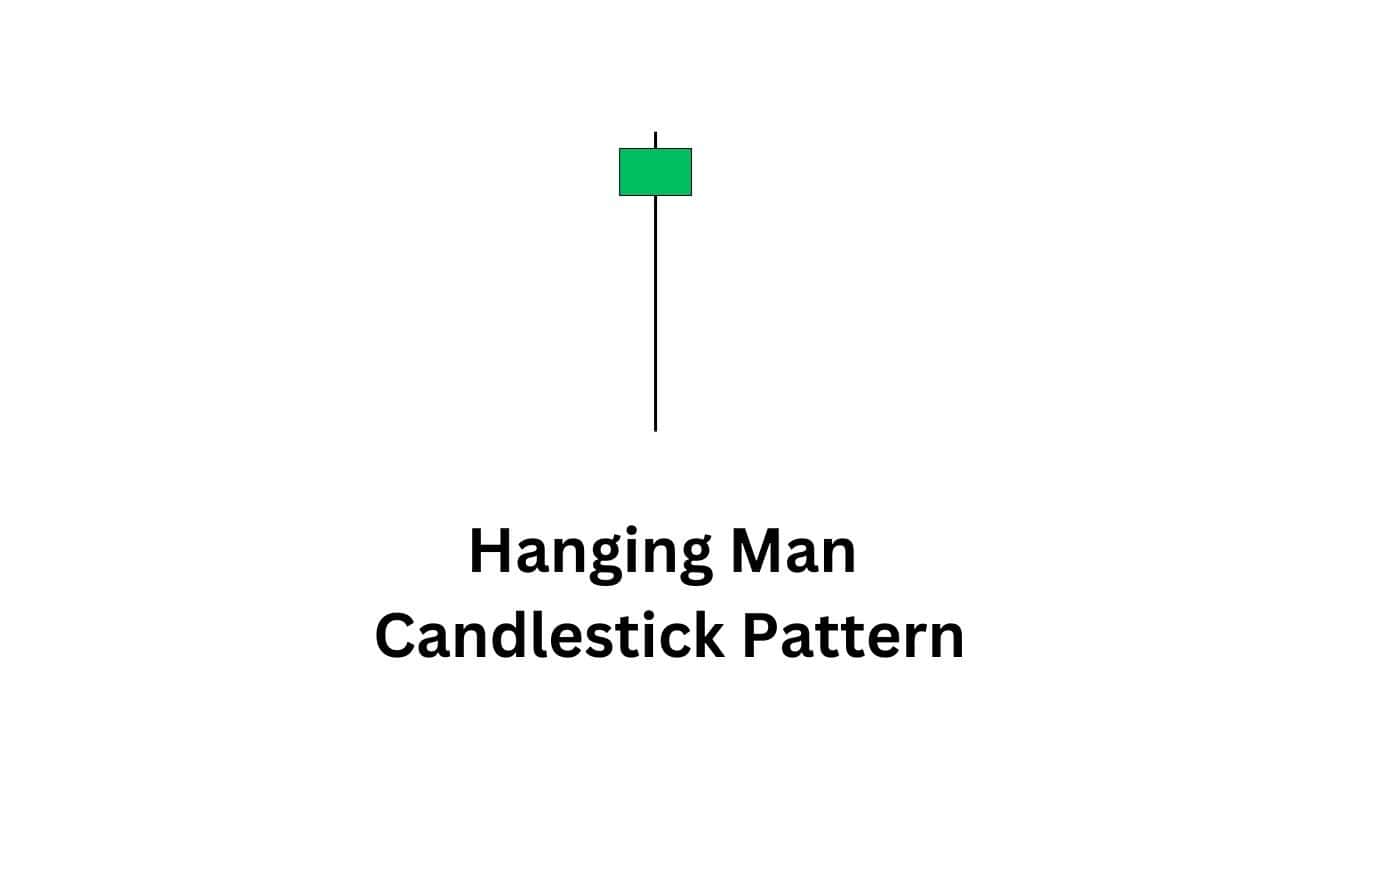
When to use it?
Traders watch for this pattern near resistance levels or after a strong rally. It signals that buyers are struggling to maintain control. A bearish confirmation in the next session, such as a strong red candle, strengthens the case for a potential trend reversal.
28. Gravestone Doji
What is the pattern about?
The Gravestone Doji has a very long upper wick, a very small or almost non-existent body, and no lower wick. It is formed when the prices are advanced by buyers but they fail to sustain the momentum, resulting in prices being settled near the opening levels.
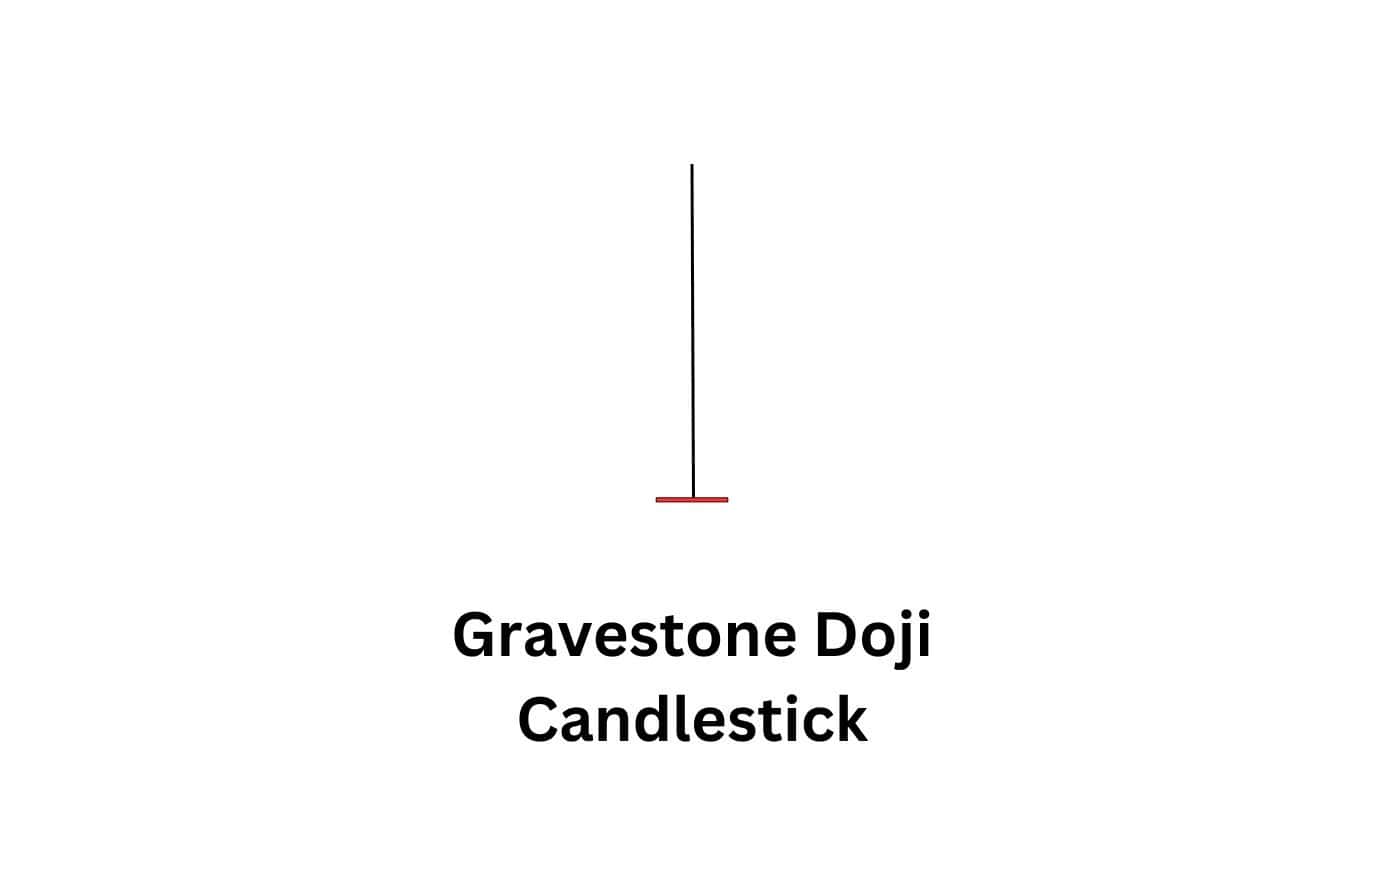
When to use it?
This pattern is identified as such by traders as it forms at the top of an uptrend, and it shows that buying pressure is waning. If it forms at a crucial resistance area and is followed by a bearish candle, then the case for a potential reversal is further bolstered.
29. Bearish Pin Bar
Here’s how to identify this candlestick pattern:
A bearish pin bar has a small real body near the bottom of the candle and a long upper wick. This formation shows that price initially moved higher but faced strong rejection, pushing it back down before the candle closed. The longer the wick, the stronger the rejection, indicating aggressive selling pressure.
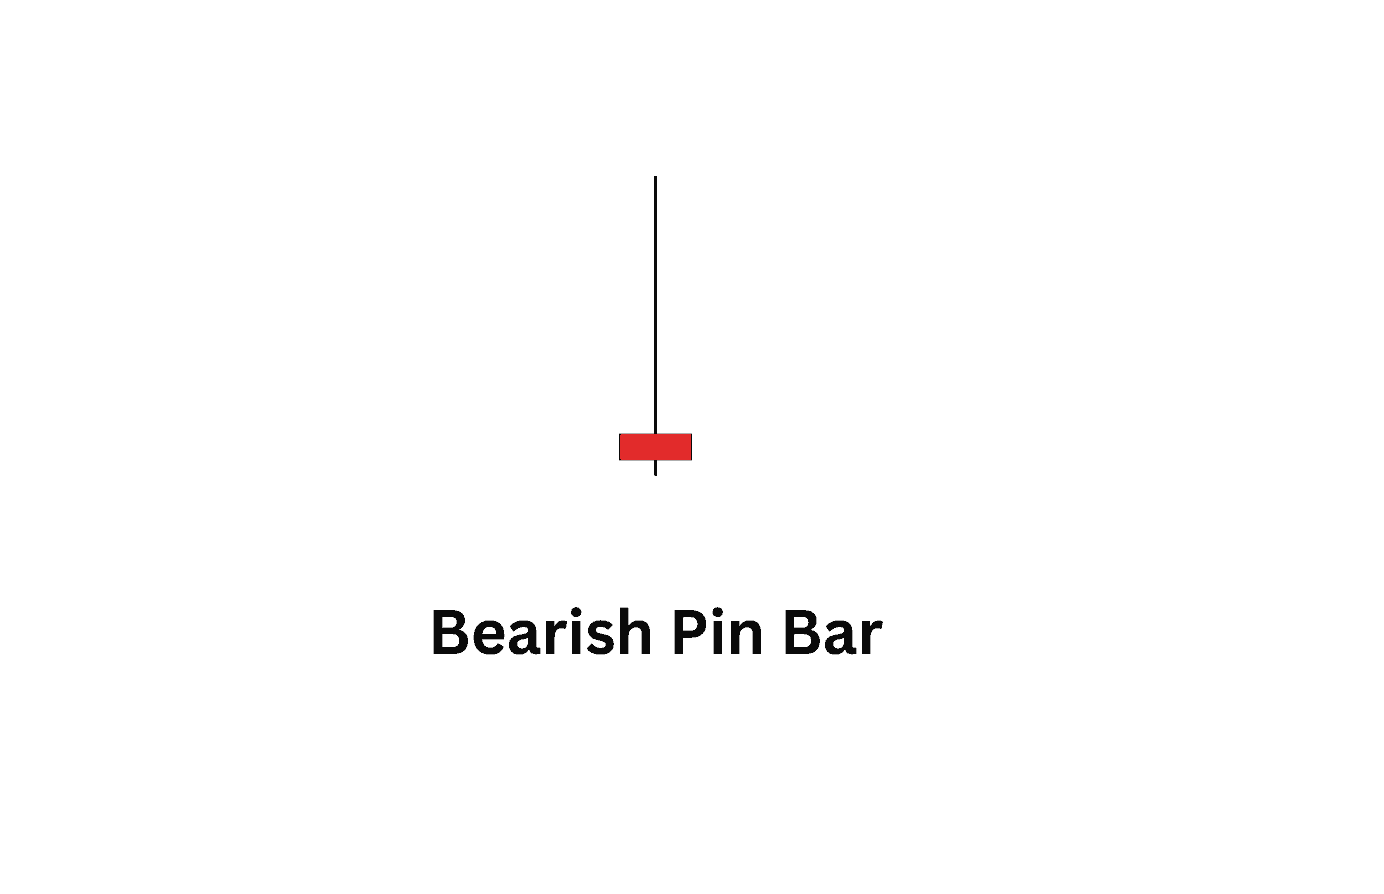
Why this candlestick pattern matters:
This pattern suggests that buyers attempted to push the market higher but failed, leading to a shift in control toward sellers. When a bearish pin bar appears at a key resistance level or after a strong uptrend, it signals that a reversal may be imminent. Many traders use this as a confirmation to enter short positions, especially when followed by further bearish movement.
30. Bearish Spinning Top
Here’s how to identify this candlestick pattern:
The bearish spinning top is a single candle with a small body and long upper and lower wicks, showing that price moved up and down significantly but closed near its opening price. This pattern signals indecision. However, when this pattern appears after an uptrend and especially near a resistance level, it could hint at a bearish reversal.
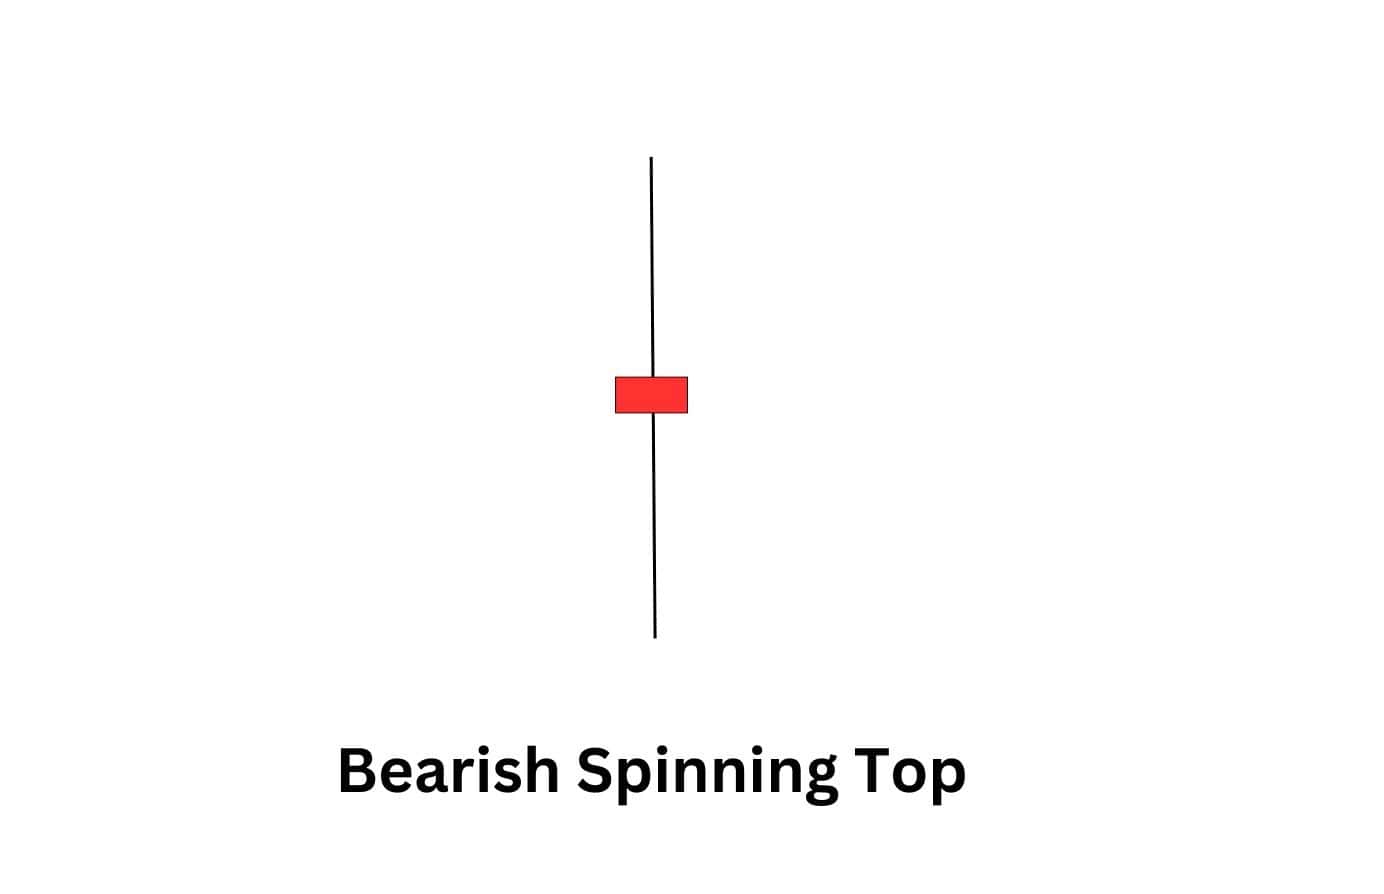
Why this candlestick pattern matters:
A bearish spinning top means neither buyers nor sellers had full control. If it appears at key resistance, it suggests that bullish momentum is stalling. When followed by strong bearish price action, it can confirm a potential downturn.
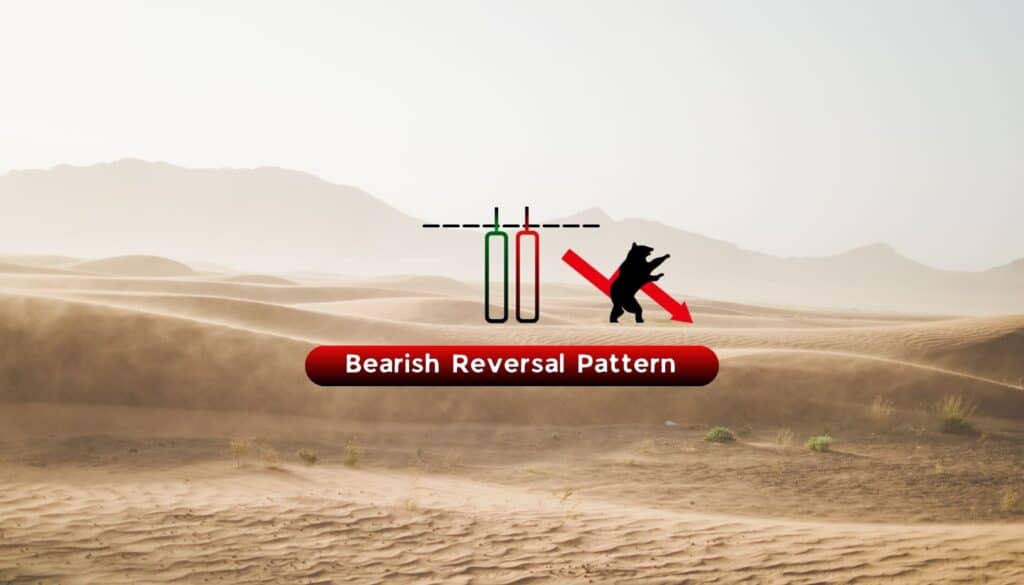
31. Tweezer Tops
What is the pattern about?
This two-candle pattern forms at the peak of an uptrend. Both candles have nearly identical highs, signaling that the market tried to push higher twice but failed. The second candle is often bearish, reinforcing the idea that buyers are losing control.
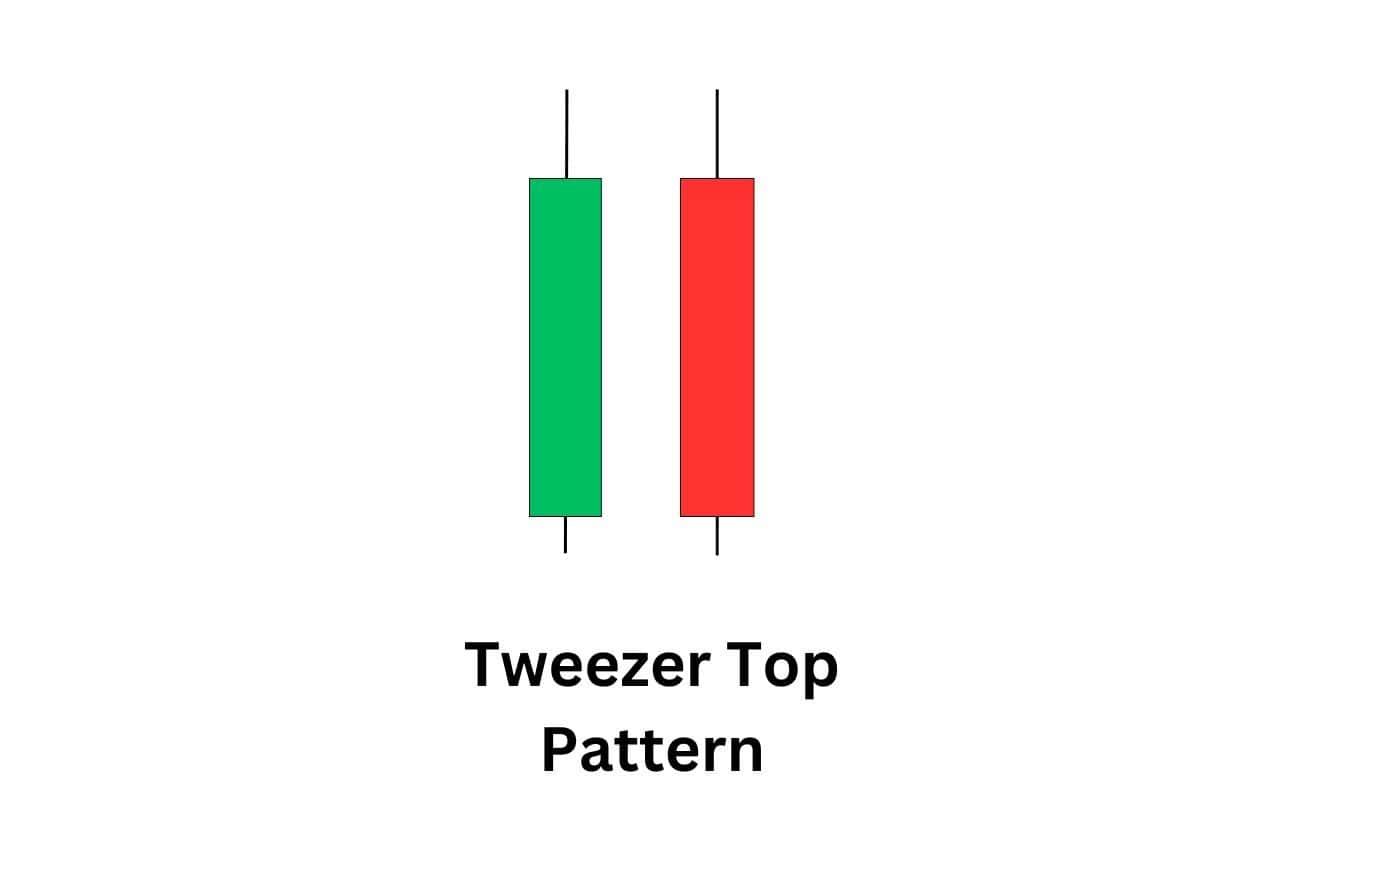
When to use it?
Traders use Tweezer Tops when the market struggles to break a key resistance level. If the second candle is a strong bearish one and is followed by more selling, it adds confidence to the reversal signal.
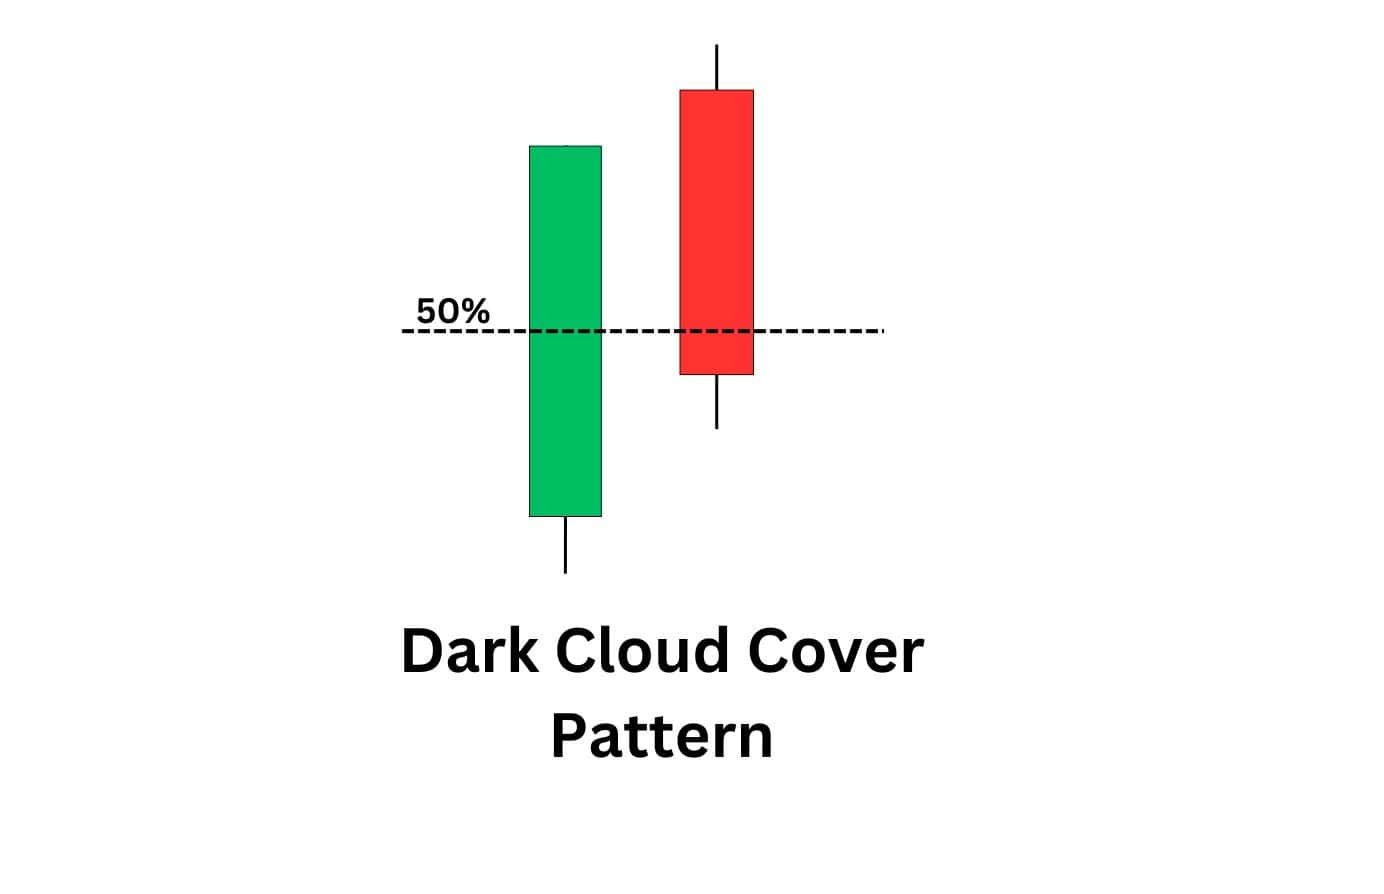
32. Dark Cloud Cover
What is the pattern about?
Dark cloud cover is a two-candle bearish reversal pattern appears after an uptrend. The first candle is a strong green one, but the second one opens higher than the close of the previous candle and then moves down and close below the midpoint of the first candle. This shift signals that sellers are taking control.
When to use it?
This pattern is used by traders when they notice the indications of the weakening buying pressure especially near the resistance levels. If the second candlestick is located inside the first candle’s body and is followed by another candle with a body that is located below the first one, then the trend reversal is likely.
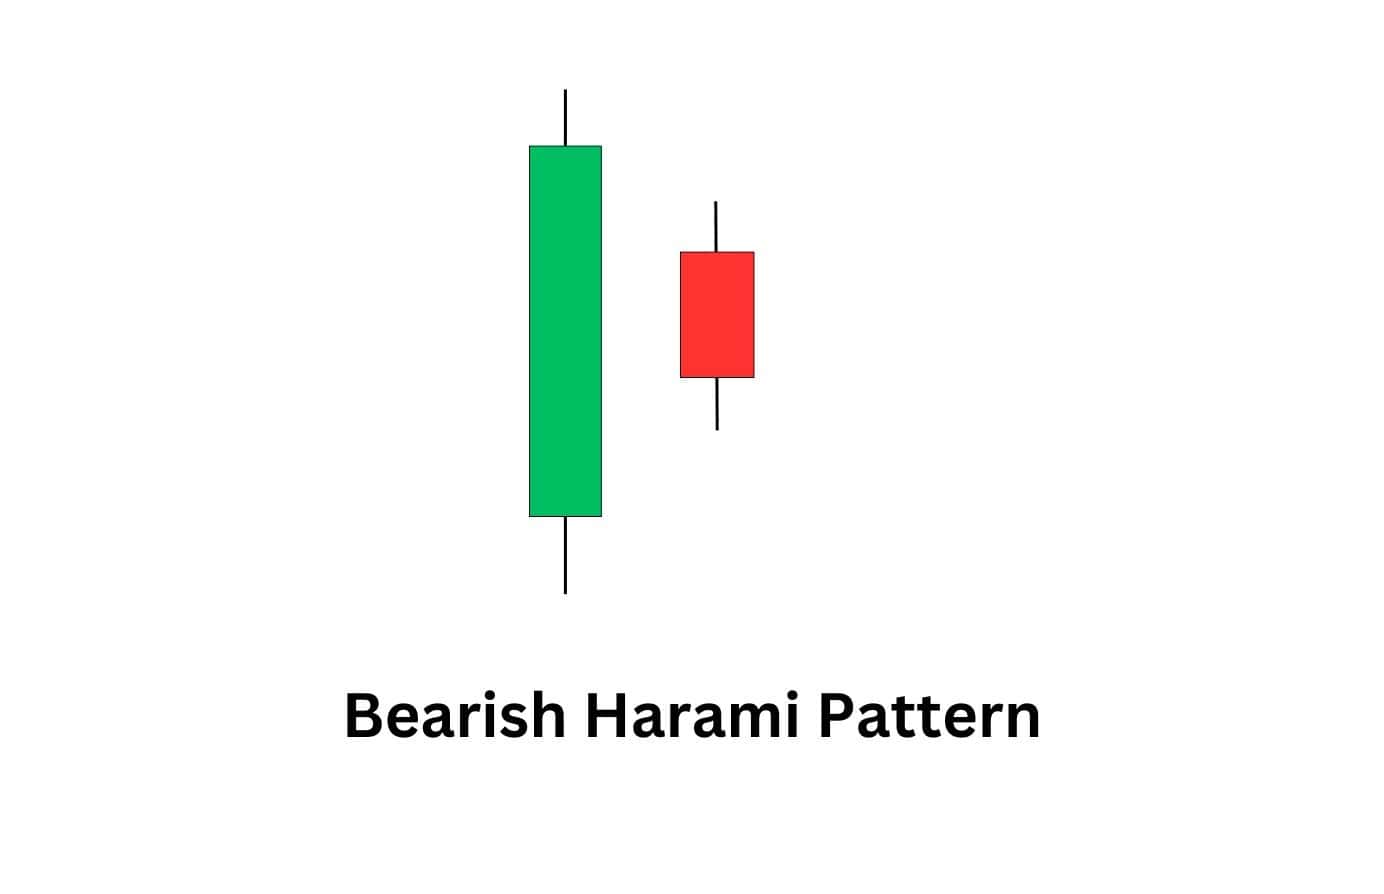
33. Bearish Harami
What is the pattern about?
The bearish harami is a two-candle pattern appears in an uptrend. The first candle is a big green one, and the second is a small red one that is completely inside the first one. It shows that the bullish momentum is waning as the prices keep trying to rise but buyers are not able to build enough momentum.
When to use it?
Traders look for this pattern near resistance levels or after a prolonged rally. It suggests a potential reversal, especially if the second candle is followed by further bearish movement. Waiting for confirmation in the next sessions increases reliability.
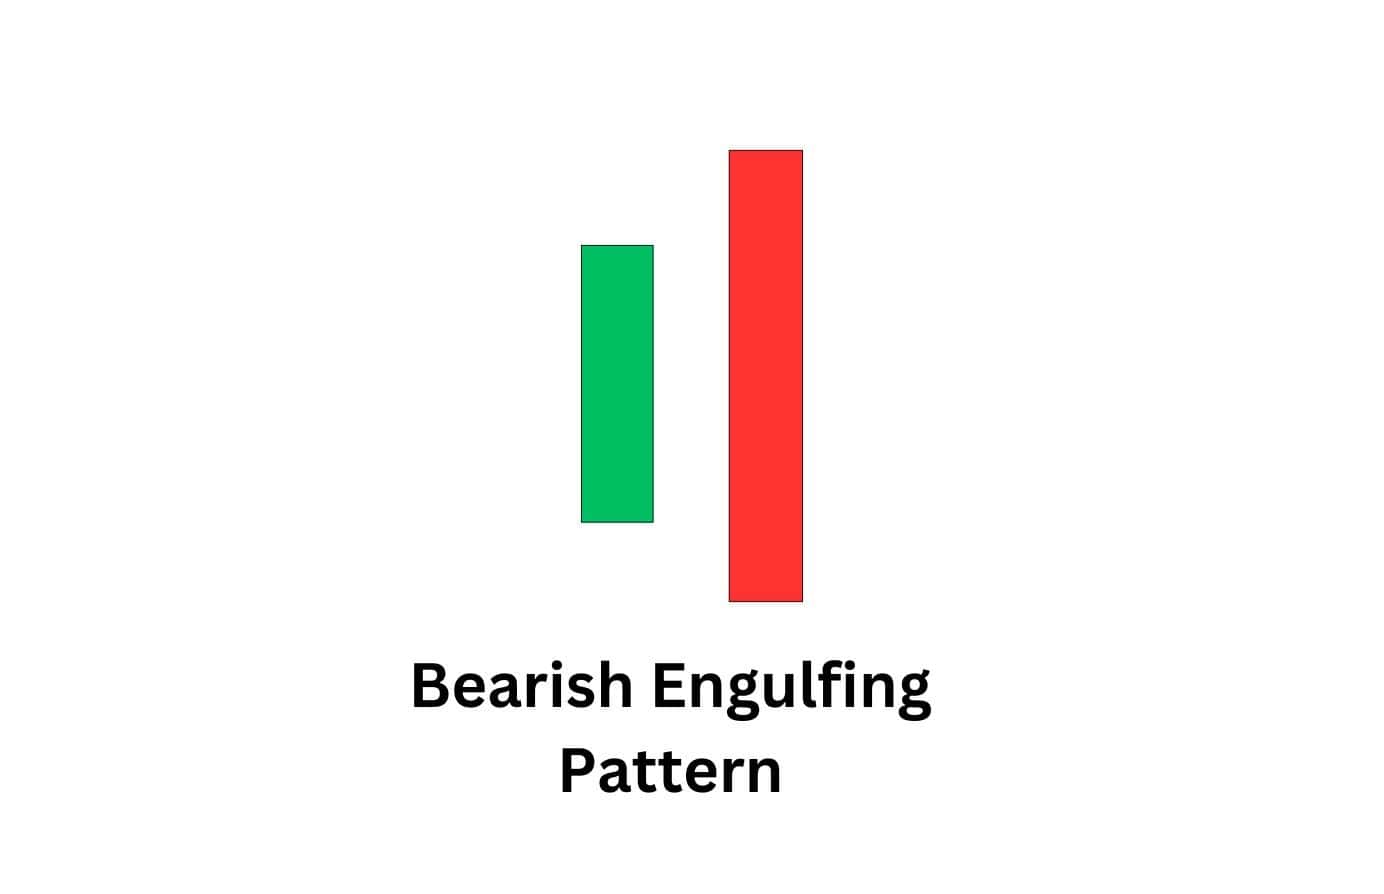
34. Bearish Engulfing Pattern
What is the pattern about?
Bearish engulfing pattern is a two-candle pattern occurs during an uptrend. The first candle is a very small green one, and then there is a big red candle that absorbs the whole range of the first candle including the body. This signals a shift from buying to selling pressure.
When to use it?
Traders watch for this pattern after a strong bullish phase. If it forms near resistance or after a weak rally, it suggests that sellers are overpowering buyers. A follow-up bearish move confirms the reversal potential.
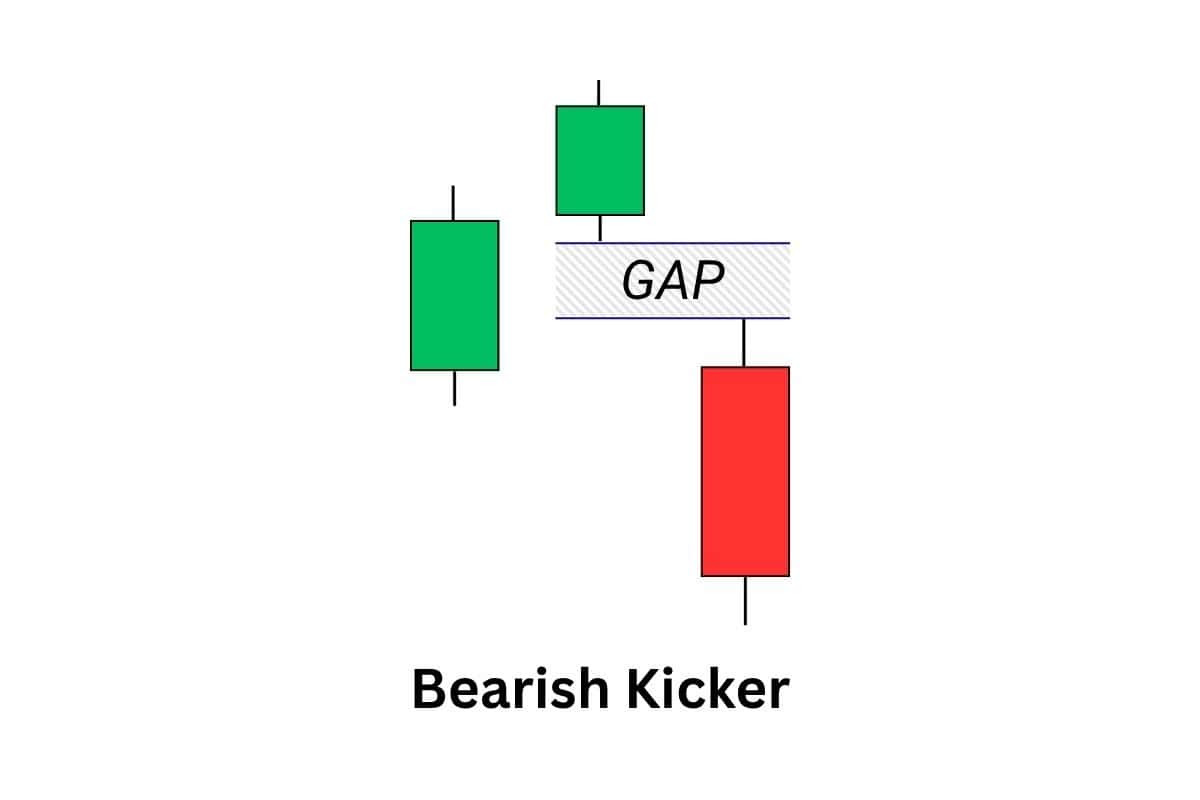
35. Bearish Kicker
What is the pattern about?
This is one of the strongest bearish reversal signals. It has two candles: the first is a big bullish candle, and the second is an equally strong bearish candle that opens at or below the previous candle’s opening price, leaving a visible gap. It shows an abrupt shift in sentiment, usually caused by unexpected news or market events.
When to use it?
Traders utilize this pattern when seeking unexpected trend shifts, particularly during high-volume trading periods. When observed at a resistance point or accompanied by confirming indicators such as an increase in selling volume, it indicates a significant likelihood of a downturn.
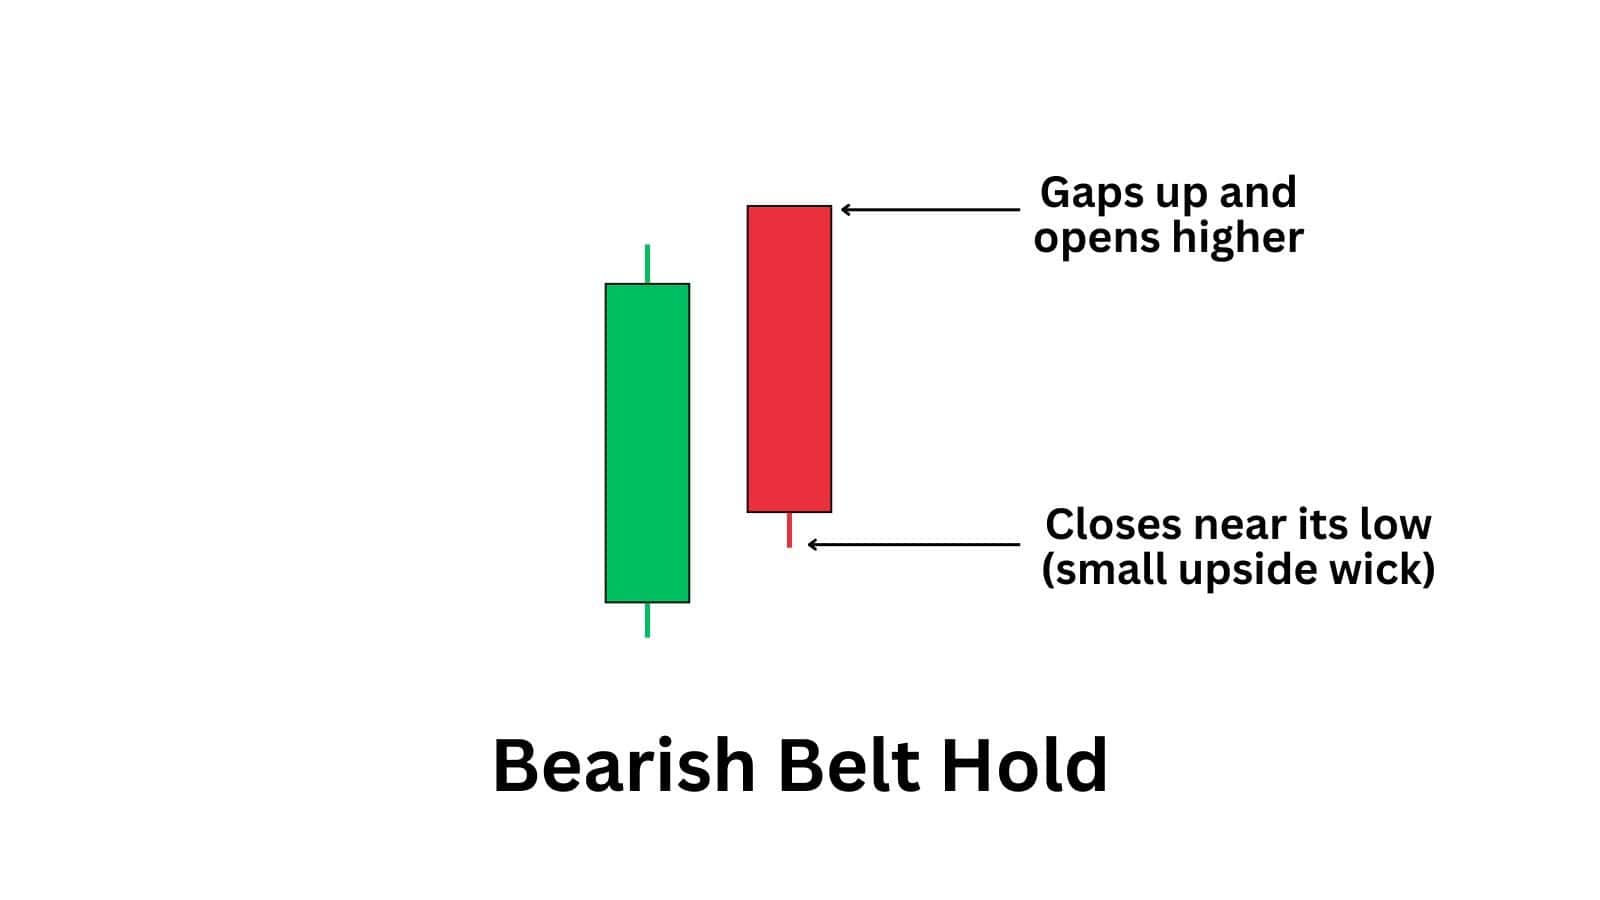
36. Bearish Belt Hold
What is the pattern about?
The bearish belt hold is a single-candle reversal pattern that forms after an uptrend. It opens at or near its high and sells off strongly throughout the session, closing near its low with little to no upper wick.
The name comes from how price behaves — it “holds” the opening level, showing no acceptance above it. This reflects immediate selling pressure, where buyers fail to push prices higher and control shifts quickly to sellers.
When to use it?
It is most effective after an extended rally or at key resistance levels, where price is likely to react. Rather than acting on the candle alone, traders typically wait for continuation, such as a break below the candle low or a weak pullback before entering.
37. Bearish Counterattack Line
Here’s how to identify this candlestick pattern:
The bearish counterattack line consists of two candles. The first is a bullish candle in an uptrend. The second is a bearish candle that opens higher but declines to close at the exact or near the first candle’s closing price, forming a “counterattack” response.
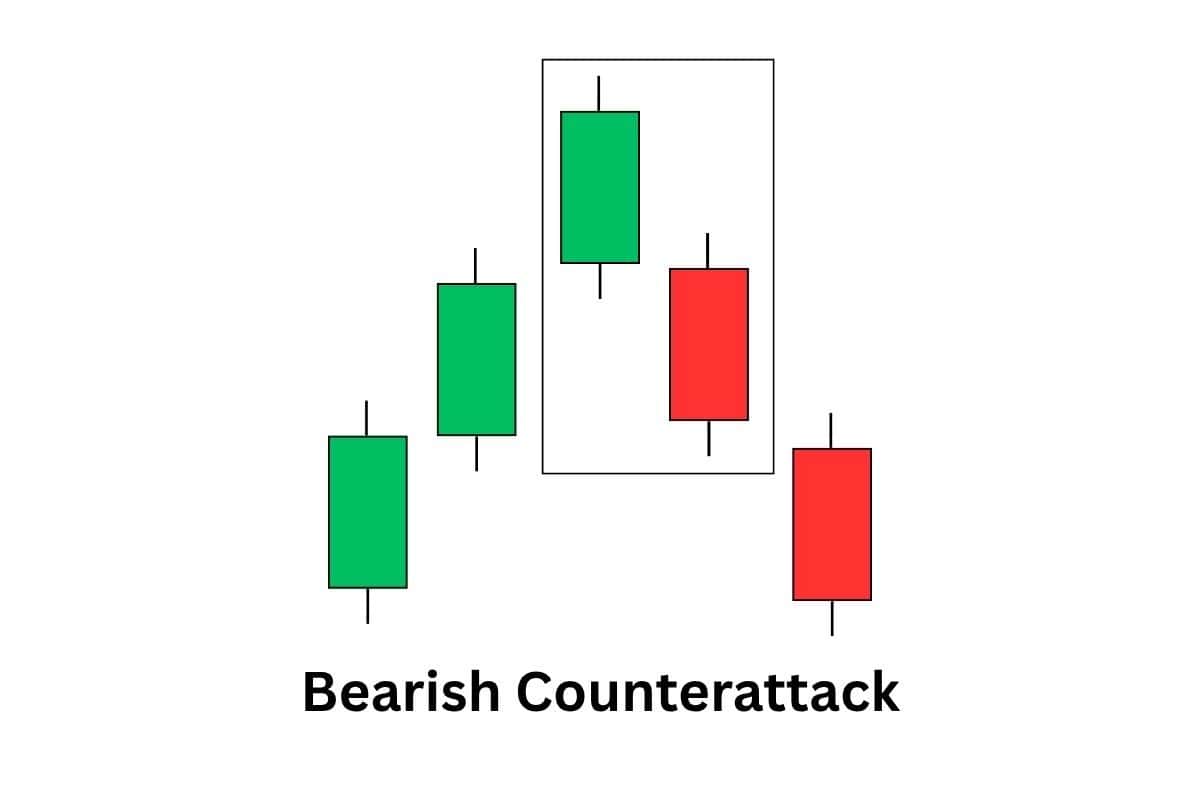
Why this candlestick pattern matters:
The sudden bearish pushback shows sellers aggressively defending a price level. It suggests that despite bullish attempts to continue the trend, bears are stepping in with force. If this pattern forms at a resistance level, it signals a possible reversal.
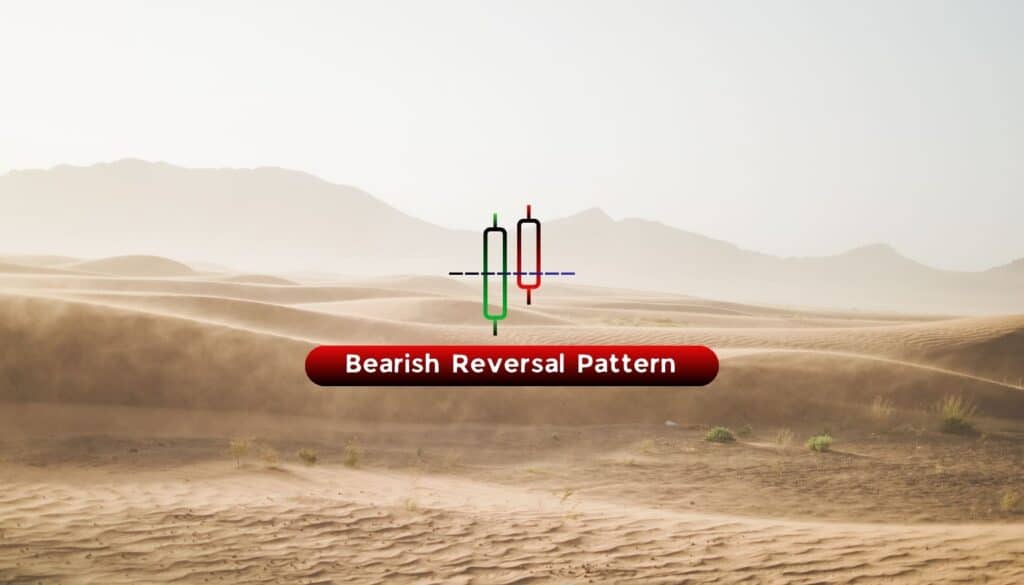
38. Bearish Homing Pigeon
Here’s how to identify this candlestick pattern:
The bearish homing pigeon is a two-candlestick pattern. Both candles appear bullish, but really are bearish signs when paired together at the top of an uptrend. Even though the first candle is nice and strong, the second candle opened much lower, and could not push out of the first candle’s highs (closing within) — traders interpret this as a sign of indecision or buyer exhaustion.
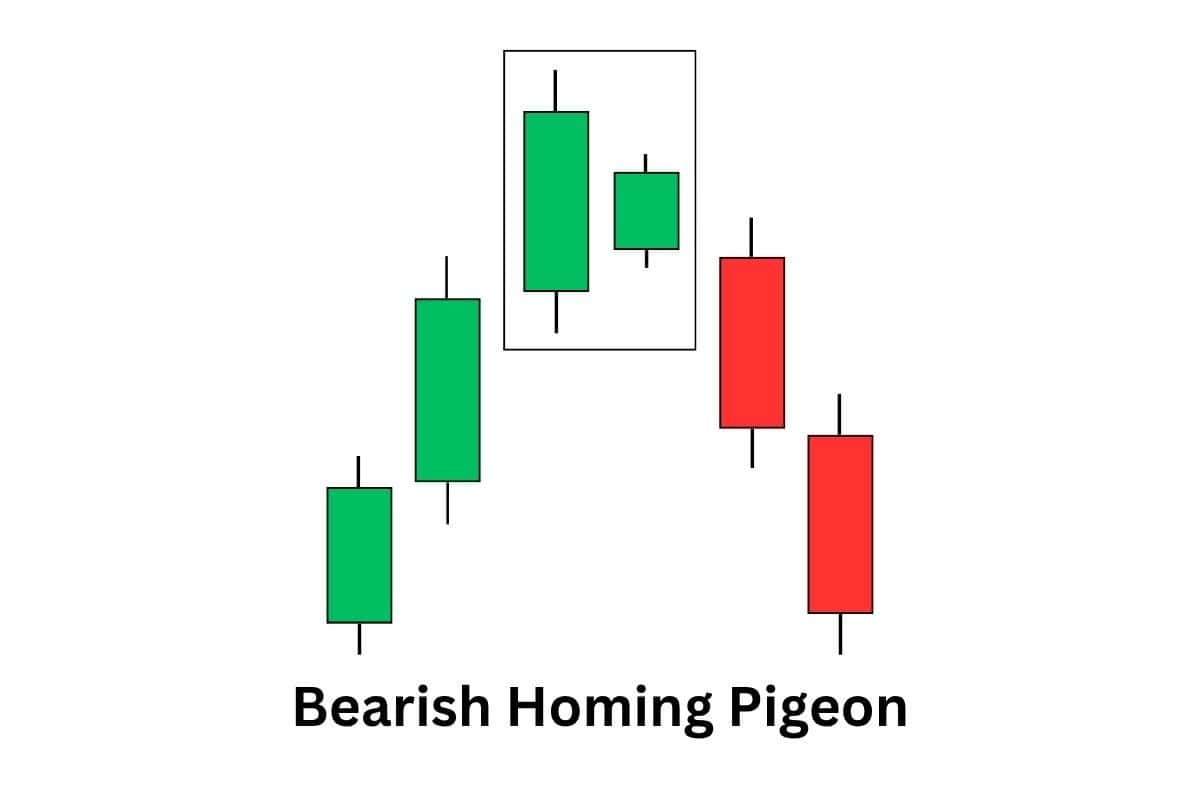
Why this candlestick pattern matters:
The bearish homing pigeon is a sign of weakness; that buyers have run out of buying enthusiasm. When paired with other signals such as a bearish divergence, the bearish homing pigeon is a warning sign to investors that prices may drop.
39. Evening Star
What is the pattern about?
The evening star is a three-candle bearish reversal pattern. The first candle is a strong bullish one, followed by a smaller candle that shows hesitation. The third candle is a decisive bearish move, erasing much of the first candle’s gains. This sequence signals that buyers are losing control and sellers are stepping in.
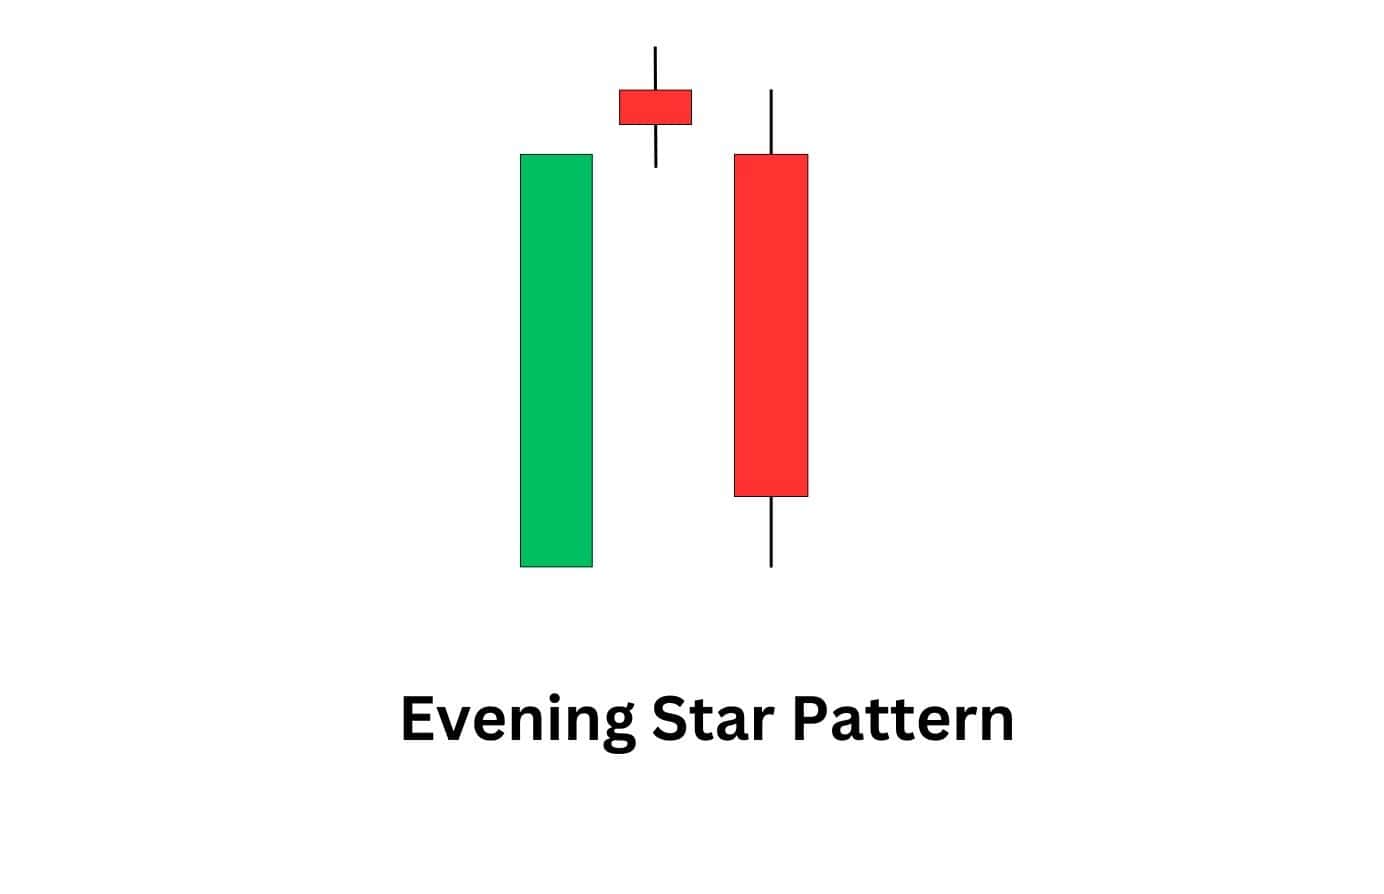
When to use it?
Traders look for the evening star at the top of an uptrend. If it forms near resistance or key technical levels, it suggests a shift in momentum. Confirmation from increased selling pressure in the following sessions strengthens the pattern’s reliability.
40. Three Black Crows
What is the pattern about?
The three black crows is a three-candle pattern signals a strong bearish reversal. It consists of three consecutive long red candles, each opening within the previous candle’s body and closing lower. This steady decline suggests that sellers are firmly in control.
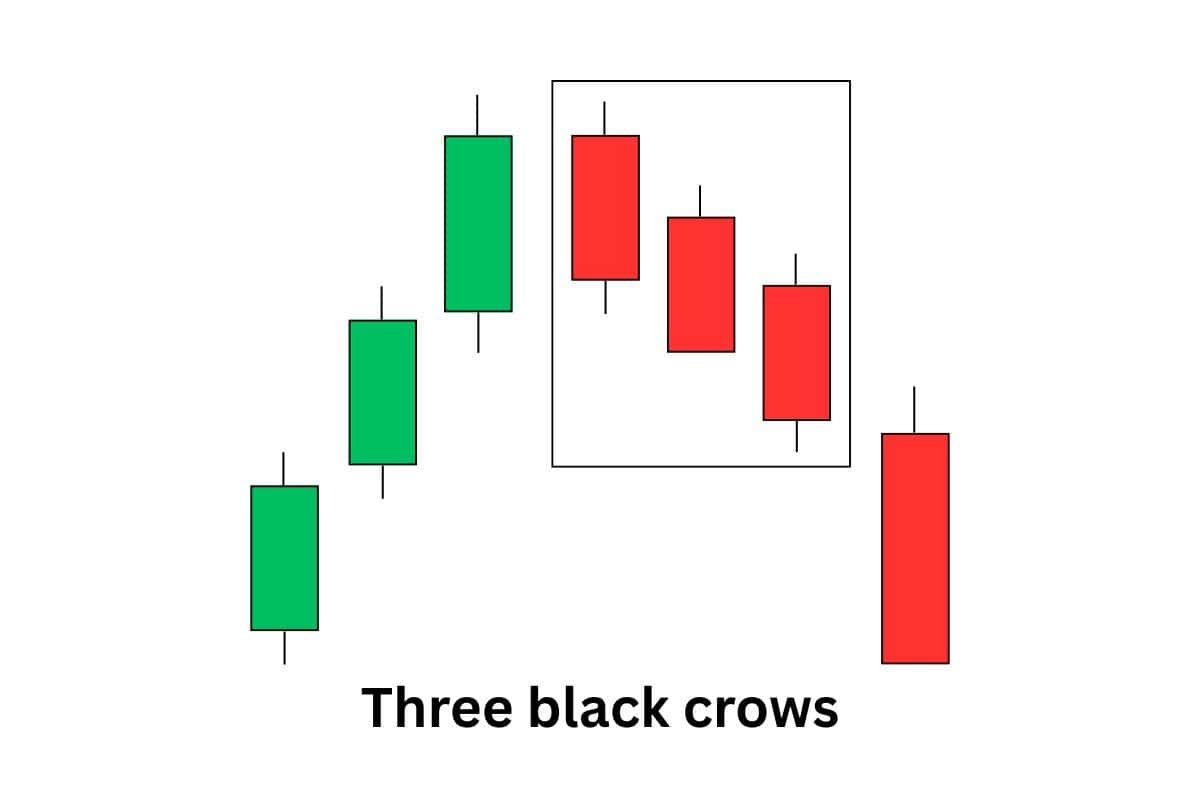
When to use it?
This pattern is identified as a reversal pattern when it forms at the peak of an uptrend or following a failed rebound in a downtrend. If the trading volume increases as sellers enter the market, it increases the chances of the market moving lower. Some traders wait for a small retracement before entering a position.
41. Bearish Abandoned Baby
What is the pattern about?
Bearish abandoned baby is a bearish reversal pattern that appears after a strong uptrend. It has three candles: a big bullish candle, a doji with a gap above the first candle, and a large bearish candle that gaps below the doji. The gaps show that buyers lost momentum, and sellers took over.
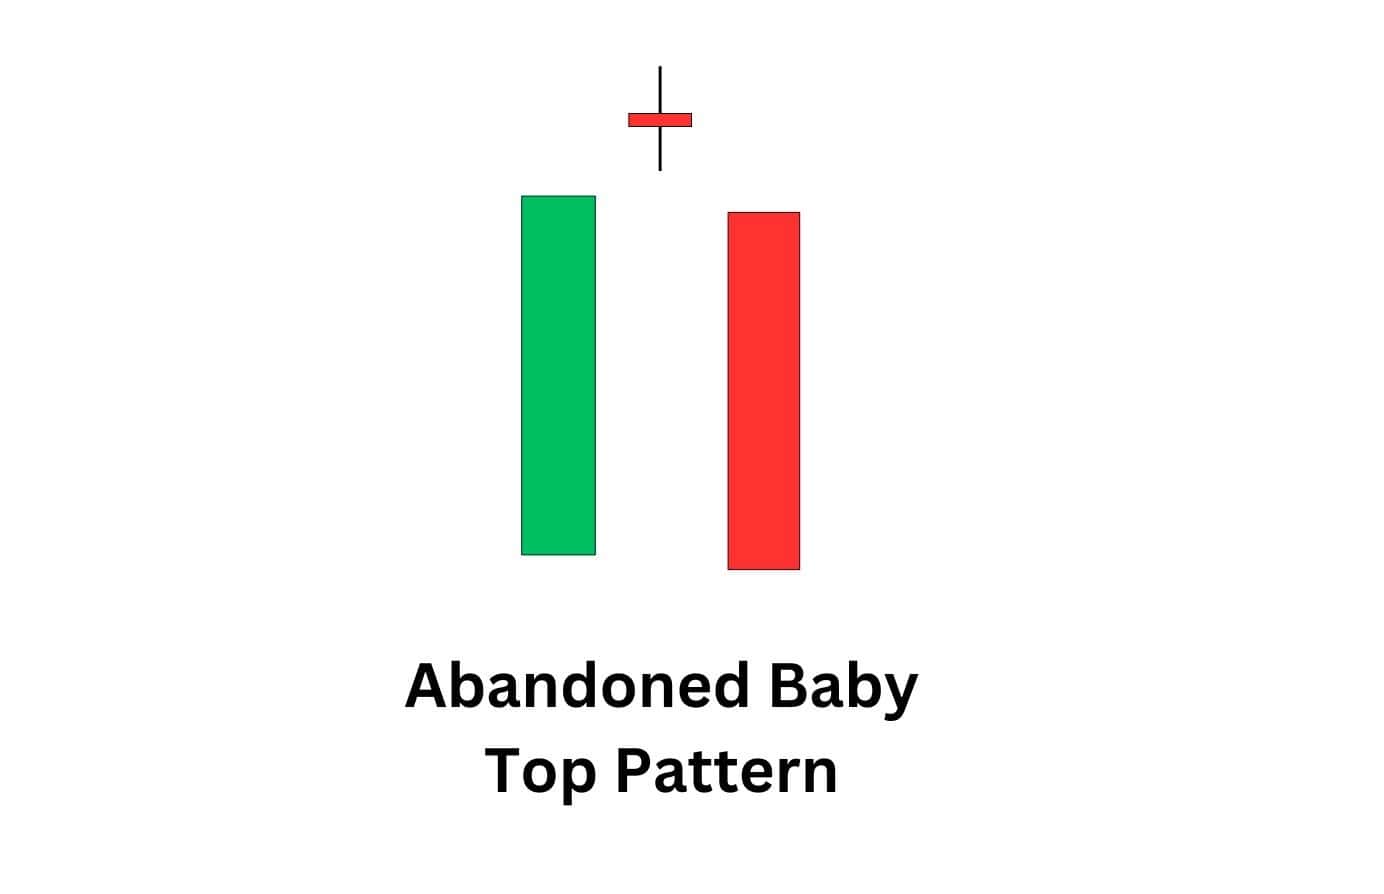
When to use it?
Traders look for this pattern on daily or higher timeframes when an uptrend seems overstretched. It’s most effective when confirmed by high volume on the bearish candle and additional indicators like the RSI showing overbought conditions.
42. Three Inside Down
What is the pattern about?
The Three Inside Down is a bearish reversal pattern that appears after an uptrend. It has three candles: a large bullish candle, a smaller bearish candle that forms inside the first one, and a third bearish candle that closes lower than the second. It signals that buyers are losing control, and sellers are taking over.
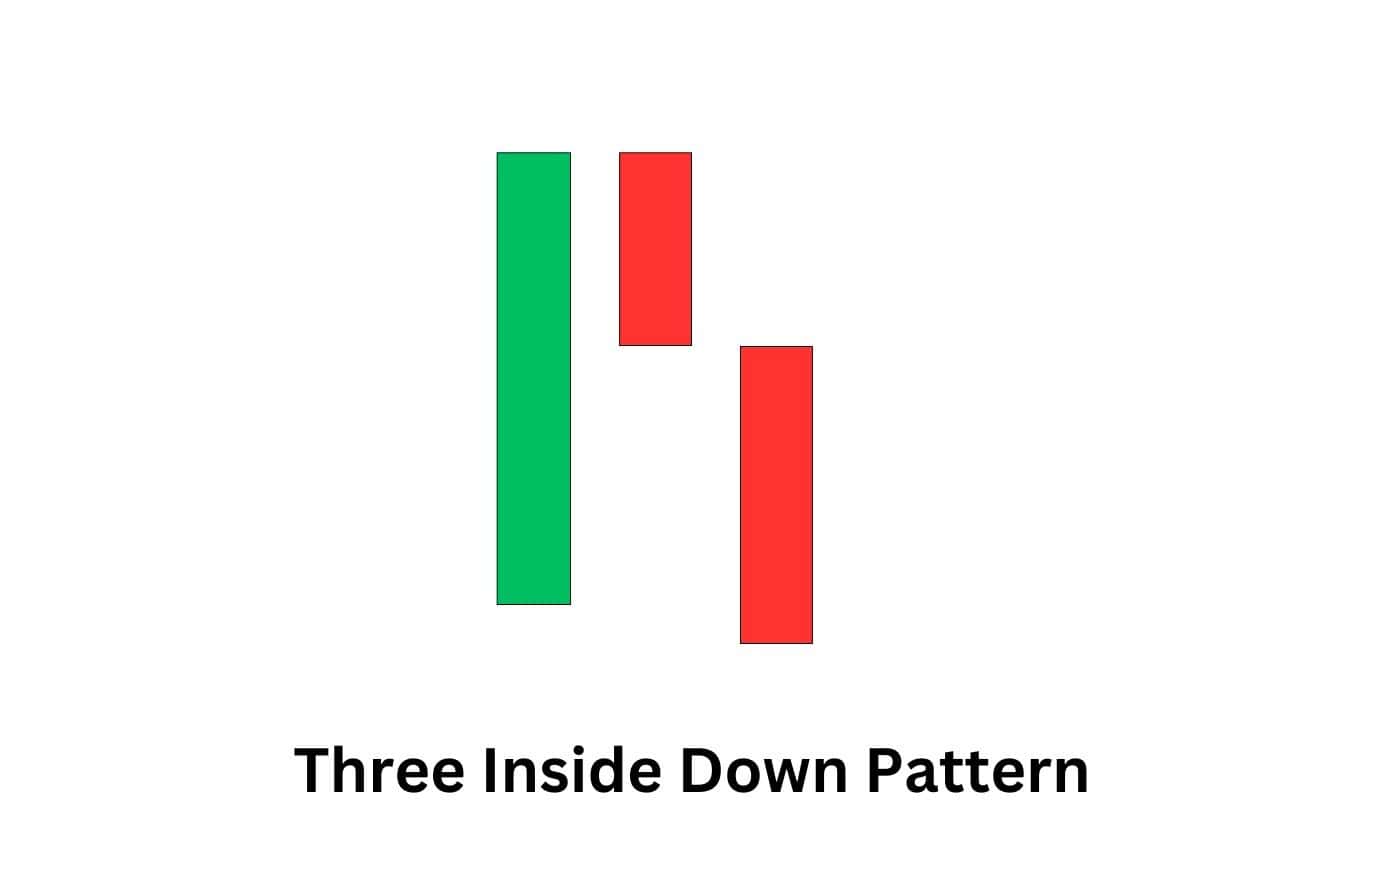
When to use it?
Traders look for this pattern at the top of an uptrend, especially near resistance levels. It’s more reliable when supported by declining volume and indicators like RSI showing overbought conditions, hinting at a shift toward bearish momentum.
43. Three Outside Down
What is the pattern about?
The Three Outside Down bearish reversal pattern also appears at the end of an uptrend but starts with a bearish engulfing setup. It has three candles: a small bullish candle, a large bearish candle that fully engulfs the first, and a third bearish candle that confirms the downtrend by closing lower.
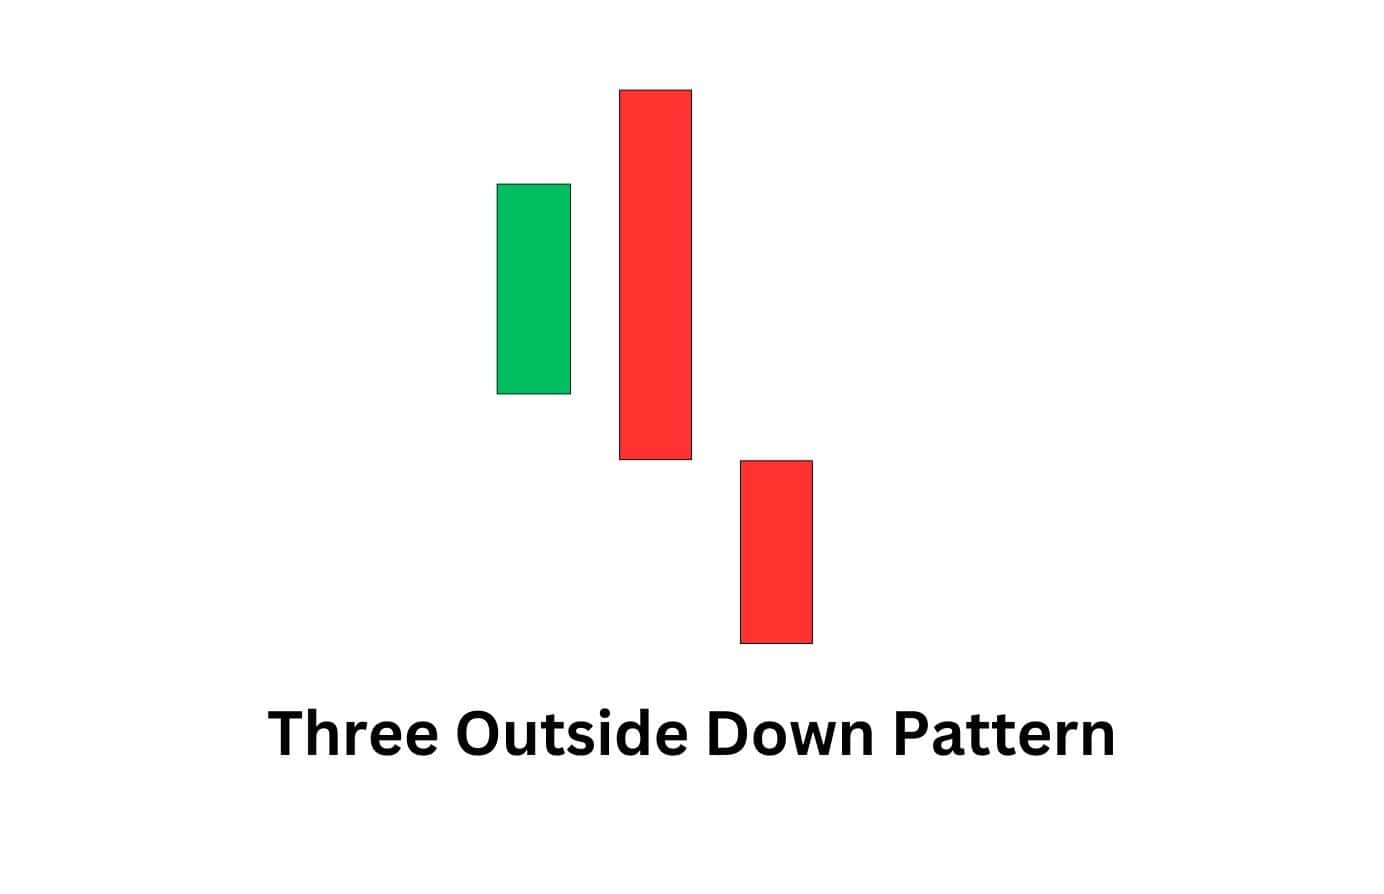
When to use it?
Traders use this pattern when looking for a confirmed shift in momentum from bullish to bearish. It’s most effective near key resistance zones and when combined with increasing selling volume or bearish divergence on technical indicators.
44. Bearish Tri Star
What is the pattern about?
The bearish tri star is a rare three-candle reversal pattern that can signal a possible shift from bullish to bearish momentum. It forms after an uptrend and consists of three consecutive doji candles, showing growing hesitation after a strong move higher.
In the textbook version, the second doji gaps above the first, while the third opens back lower, suggesting that buying pressure has stalled and control may be starting to shift. As dojis reflect indecision, three in a row near the top of a move can act as an early warning that the uptrend is losing strength.
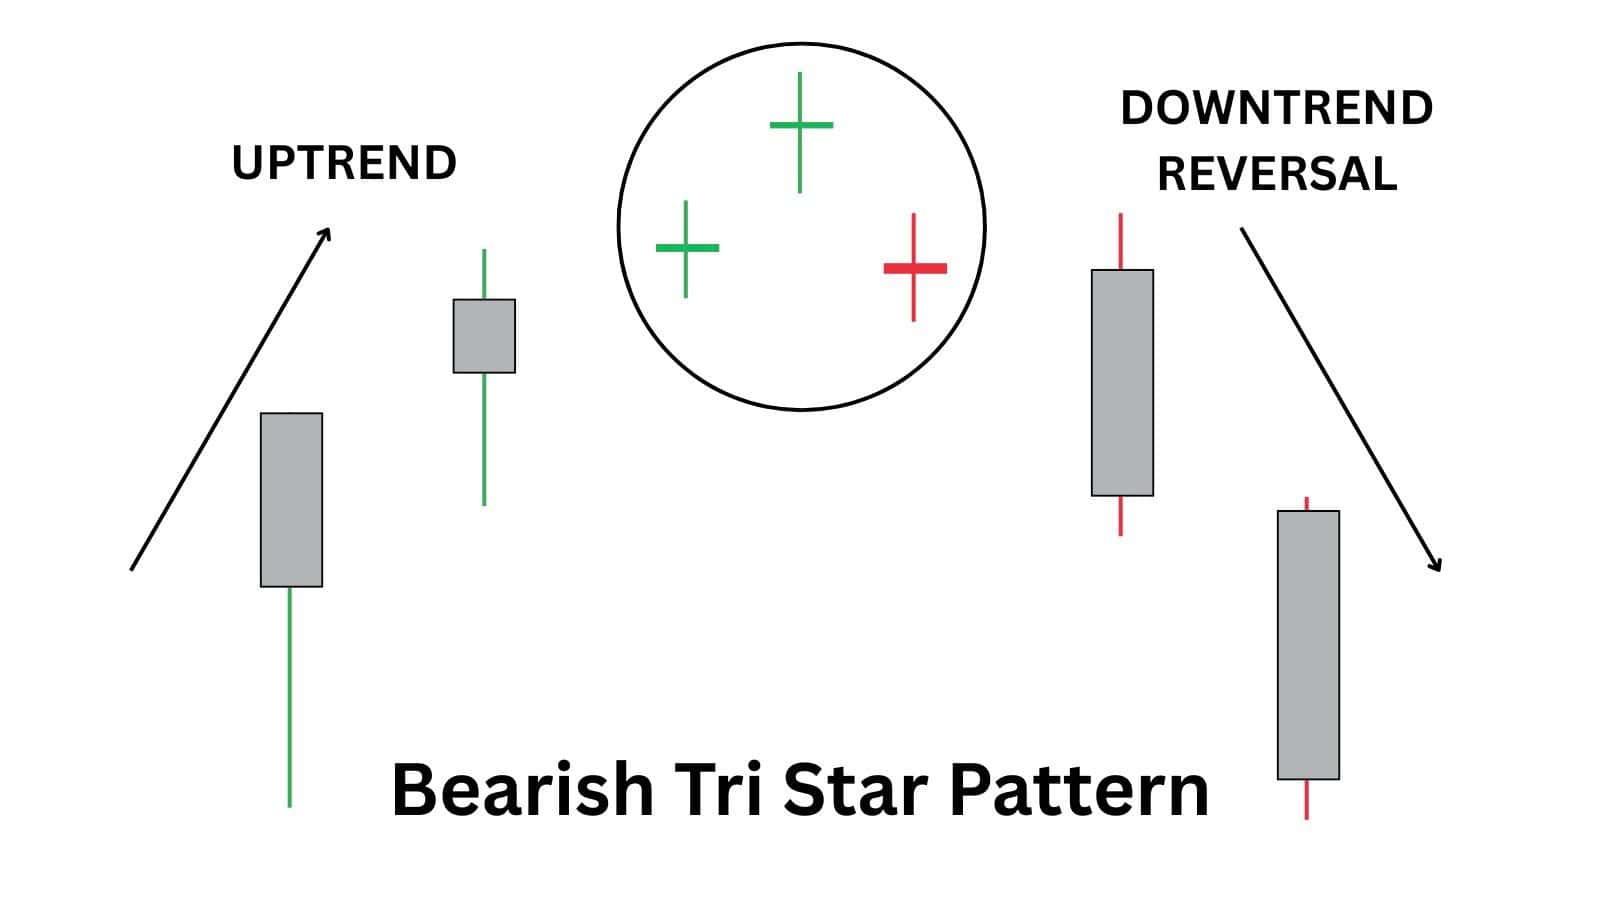
When to use it?
This is not a pattern traders usually treat as a standalone short signal. It is uncommon, and its cleanest form tends to appear more often in stocks and on higher timeframes where gaps are easier to form.
It works best as a bearish warning near resistance or after an extended rally, especially when followed by confirmation such as a break below the pattern low, a strong bearish candle, or momentum divergence on indicators like RSI or MACD.
45. Island Top
What is the pattern about?
An island top is a bearish reversal pattern that forms after an uptrend. It happens when price gaps up, trades in a small cluster for a short period, then gaps back down, leaving that group of candles isolated like an “island” on the chart.
The pattern suggests the uptrend has lost momentum and buyers are getting trapped near the highs, with the gap down showing that sellers have taken control.
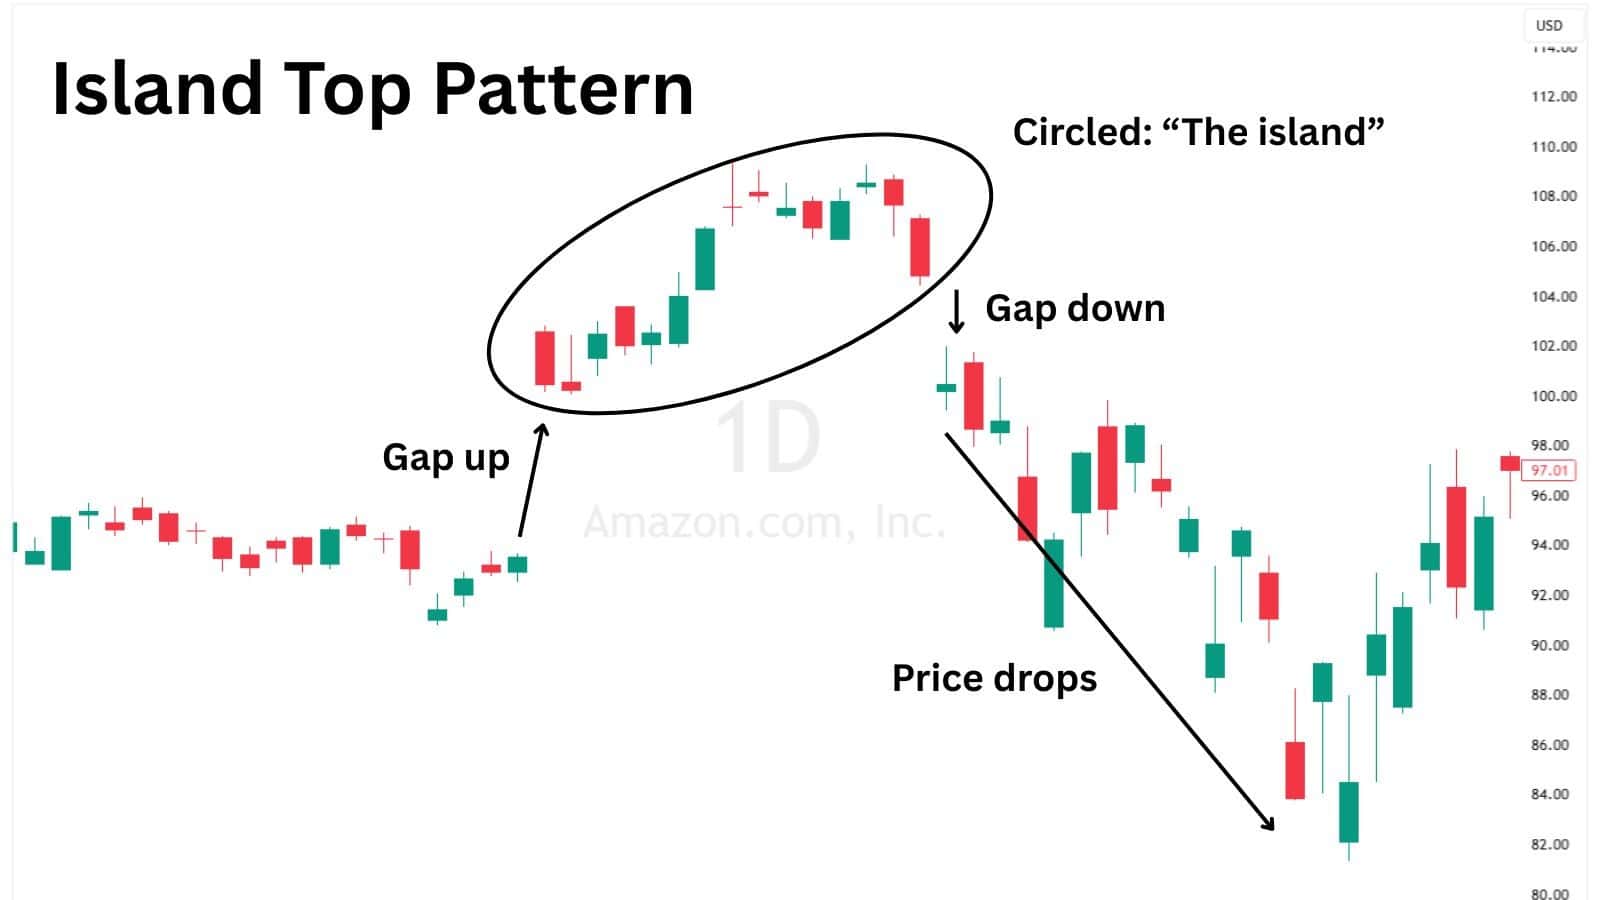
When to use it?
This pattern is most useful on assets that gap properly, such as stocks, ETFs, and indices, and it tends to show up more clearly on the daily timeframe. Traders usually treat it as a higher-timeframe reversal warning and look for bearish follow-through after the second gap before getting involved.
46. Shrinking Candles
What is the pattern about?
Shrinking candles are a reversal pattern that can appear in both bullish and bearish contexts, where the move is still alive but each candle is doing less. Doing less is observed by candle bodies getting smaller in general, which suggests the current side is starting to lose momentum. Eventually, this weakened trending condition can lead to a reversal.
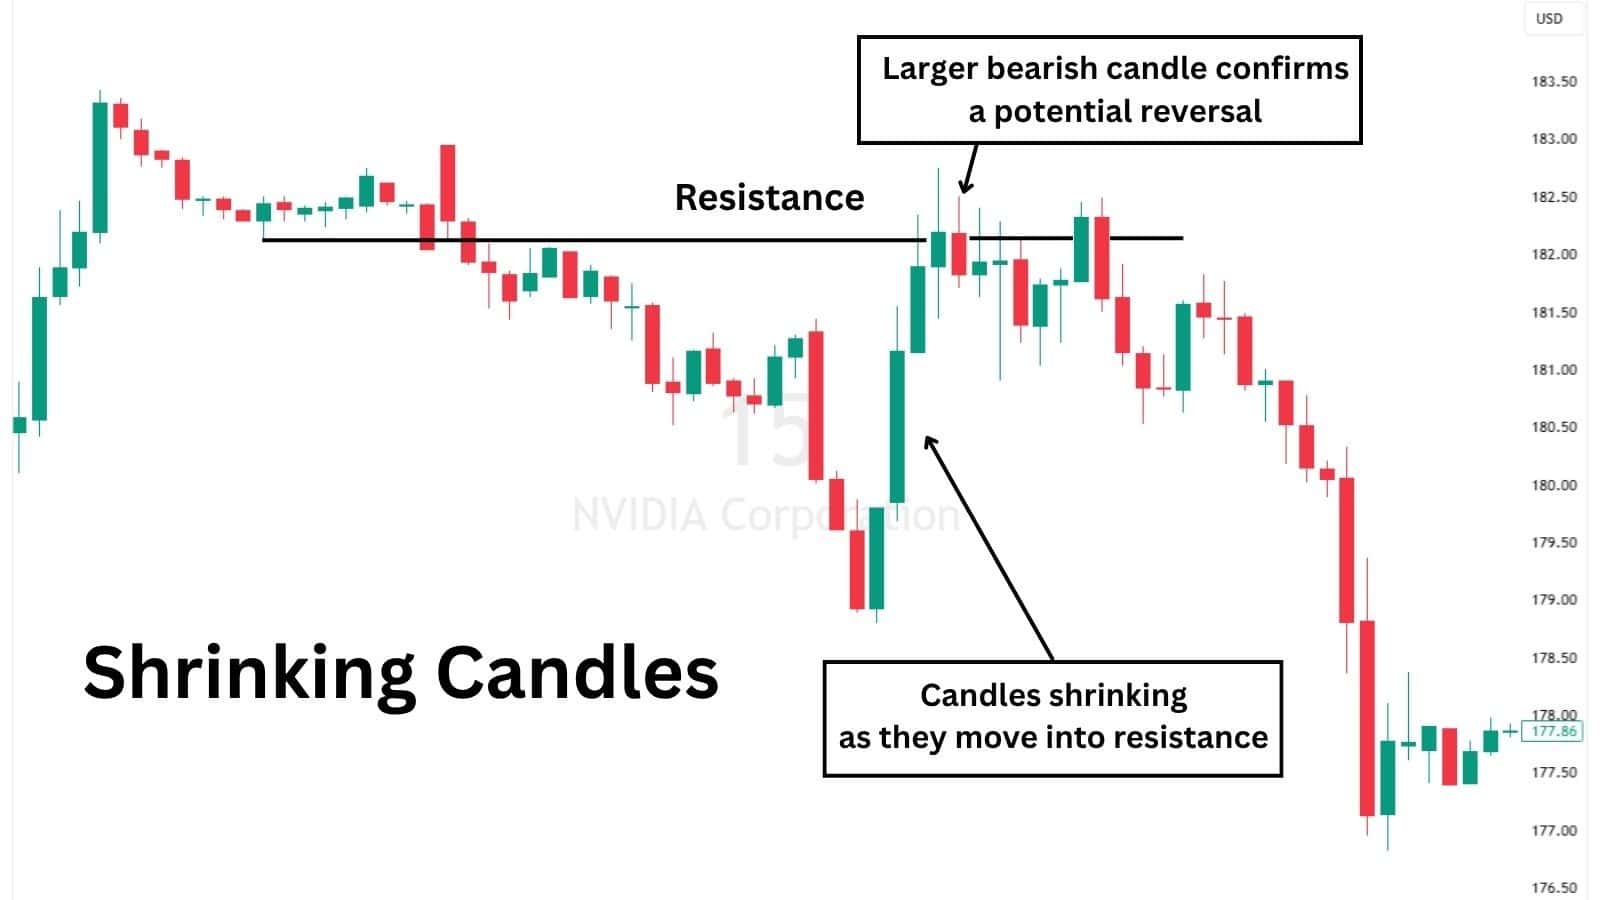
When to use it?
This pattern is best observed at key support or resistance levels, especially when it aligns with the overall trend or higher timeframe bias. Traders treat the shrinking candles as a warning, with confirmation typically coming from a strong reversal candle that shows control has shifted.
47. Double Top
What is the pattern about?
The Double Top is a bearish reversal pattern that forms after an uptrend. It has two peaks at roughly the same price level, with a pullback in between. The second peak shows that buyers tried to push prices to the same price but failed, signaling weakening momentum. A breakdown below the support level (neckline) confirms the pattern.
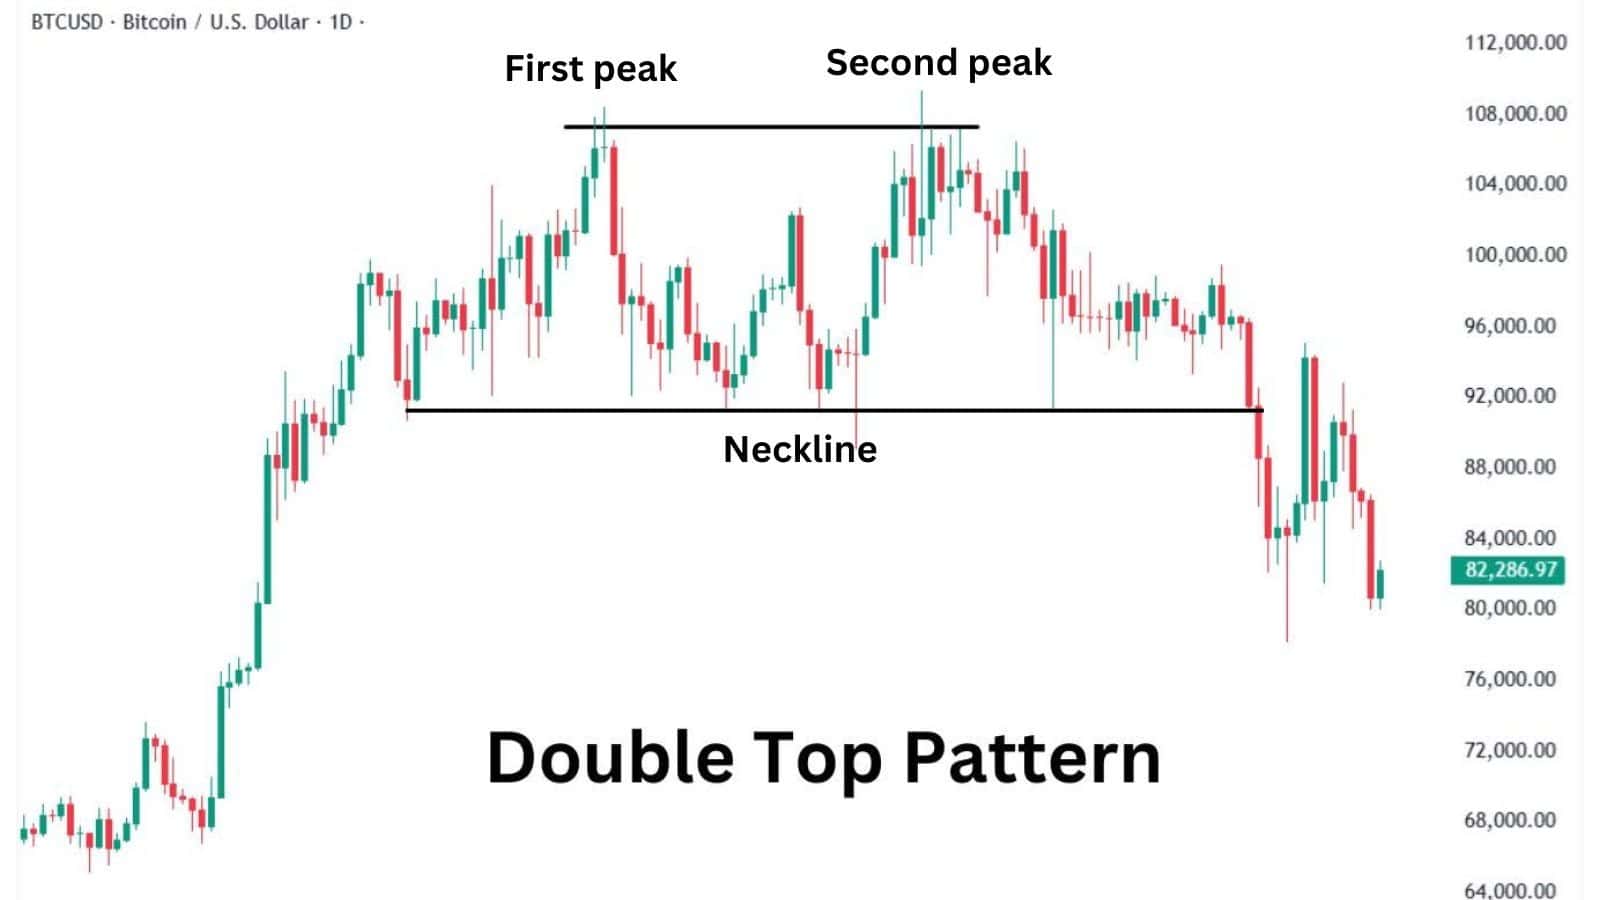
When to use it?
Traders use this pattern when an uptrend starts showing resistance at a key price level. It’s more effective when confirmed by high selling volume on the breakdown and indicators like RSI showing bearish divergence.
48. Triple Top
What is the pattern about?
The Triple Top is a stronger bearish reversal pattern than the double top. It consists of three peaks at nearly the same level, separated by two pullbacks. The repeated failure to break higher signals that buyers are losing control. A drop below the neckline confirms the pattern and suggests further downside.
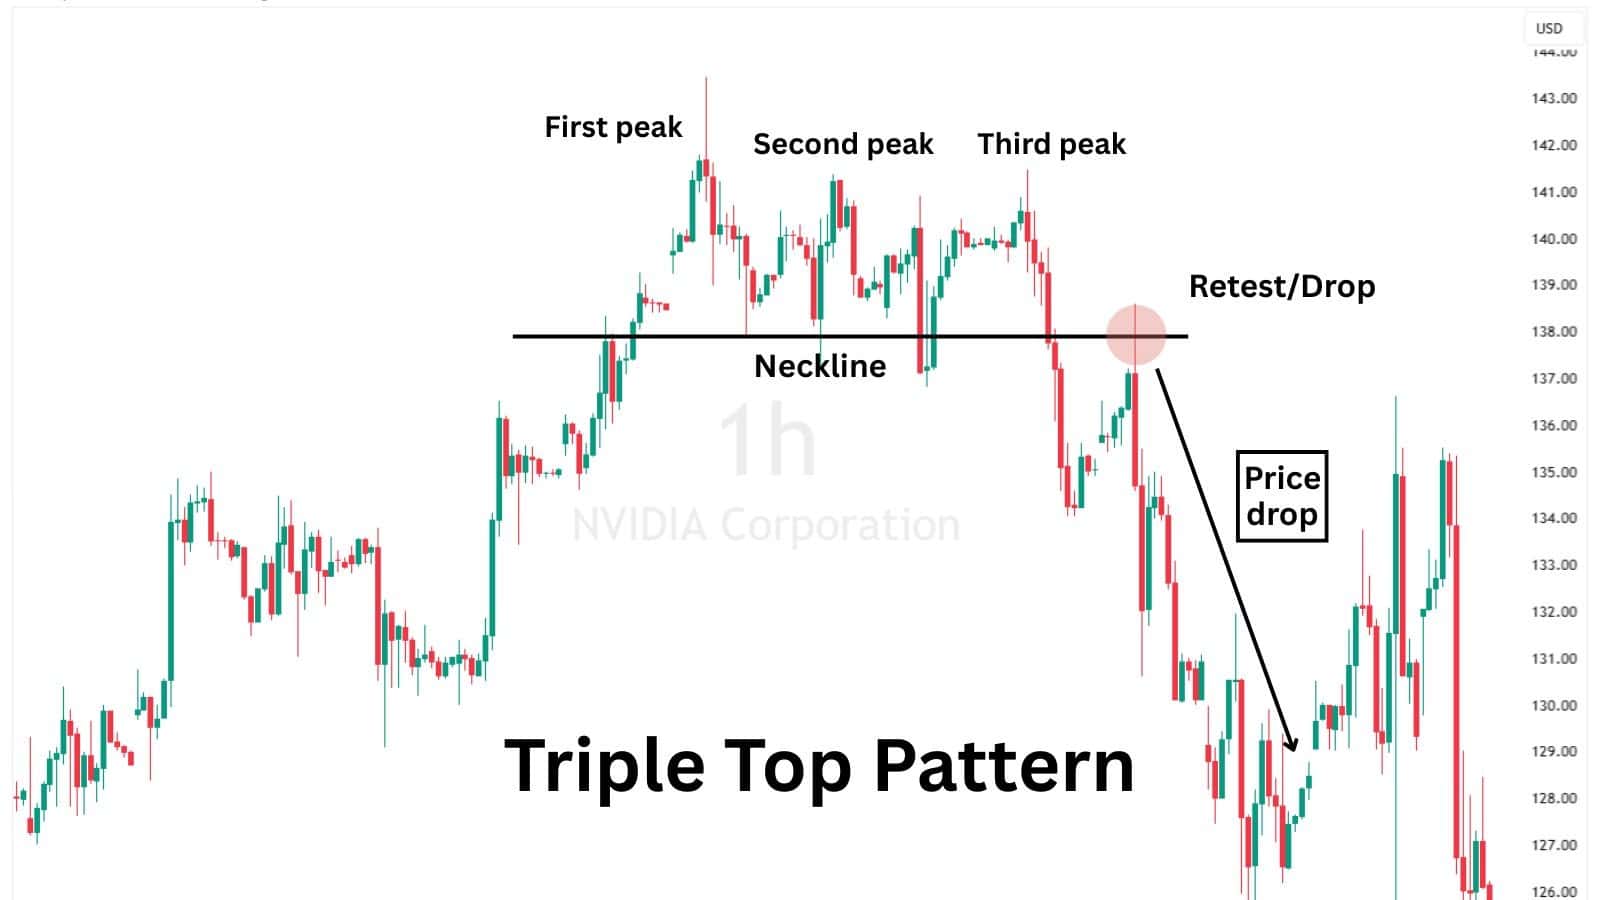
When to use it?
Traders look for this pattern in extended uptrends, especially when price struggles to break a major resistance level. If volume decreases on each peak and selling pressure increases on the breakdown, it strengthens the bearish signal.
49. Head and Shoulders
What is the pattern about?
The head and shoulders pattern is one of the most well-known bearish reversal patterns. It has three peaks: a higher middle peak (head), which is the highest, and two lower peaks (shoulders) on either side. The pattern is confirmed when price breaks below the neckline, signaling the start of a downtrend.
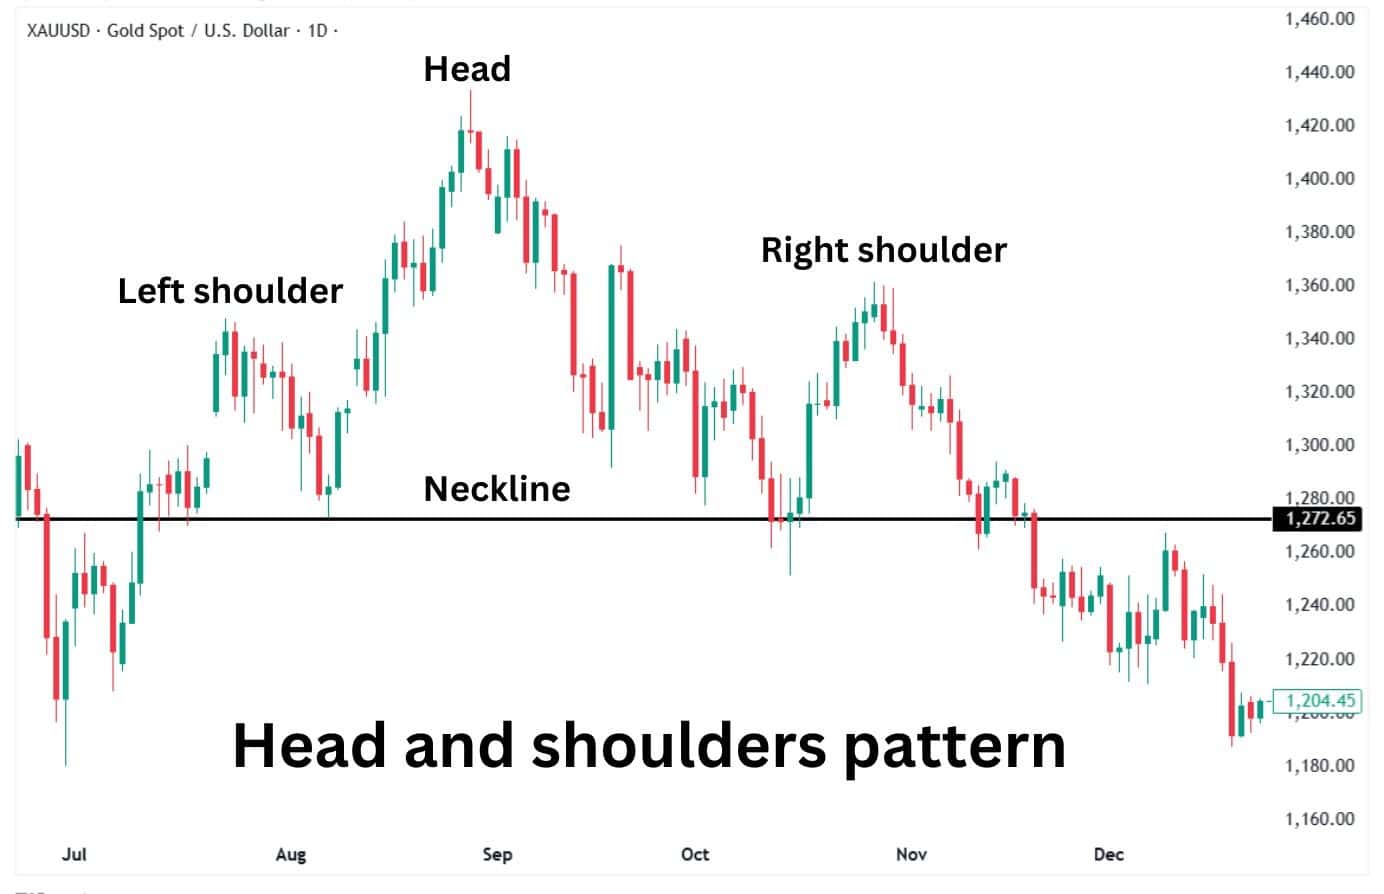
When to use it?
Traders use this pattern after an uptrend when price struggles to make new highs. It’s most effective when confirmed by a neckline break with strong selling volume and additional bearish signals from indicators like the MACD or RSI.
50. Rising Wedge
What is the pattern about?
The rising wedge is a bearish continuation or reversal pattern that forms when price moves higher within a narrowing range. The support and resistance lines slope upward, but the support line is steeper. This signals that buyers are losing strength, and a breakdown is likely. A bearish breakout confirms the pattern.
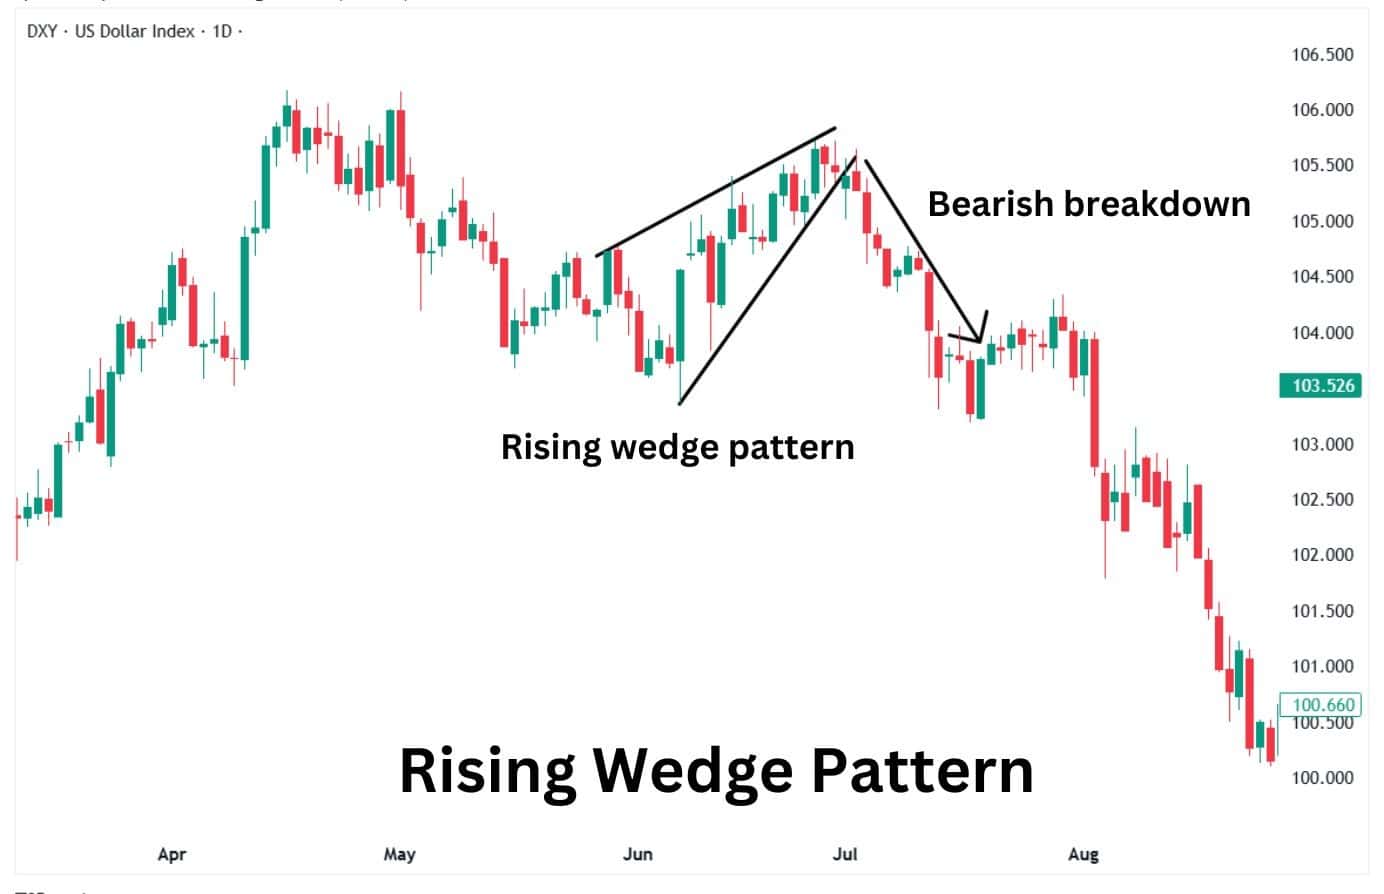
When to use it?
Traders utilize this pattern during uptrends as a caution of diminishing momentum or in downtrends as a signal for continuation. It’s more reliable when the breakdown happens with high volume and bearish confirmation from indicators like the RSI diverging lower.
What is the Strongest Reversal Candlestick Pattern?
Among the various reversal patterns, some are considered particularly potent due to their reliability:
Three Black Crows: This bearish reversal pattern is defined as three successive long-bodied red candles, all of which have their closing prices below the preceding candle’s low. It represents a shift from positive to negative sentiment.
Three White Soldiers: The opposite of Three Black Crows is this bullish variant, which is made of three consecutive long-bodied green candles, all of them having their closing prices higher than the preceding candle. It shows a change from bear to bull.
Morning Star: This positive reversal pattern occurs over three bars: First, a long bear candle, followed by a very small candle that indicates uncertainty, and then a long candle with a body that lies above the center of the first candle’s body. This sequence suggests a potential upward reversal.
Understanding Reversal Patterns as Effects, Not Causes
It’s crucial to recognize that reversal patterns are the result of underlying market dynamics—they reflect changes in supply and demand but don’t cause the reversals themselves. Factors such as economic indicators, geopolitical events, or shifts in investor sentiment drive these patterns. Therefore, while reversal patterns can be insightful, they should be used in conjunction with other analysis tools to understand the broader market context.
Advantages of Reversal Candlestick Patterns
Early Signals: They can provide early warnings of the possible market reversals and thus help traders to adjust their positions proactively.
Simplicity: These patterns are quite easy to recognize, thus making them useful tools for traders of all kinds.
Versatility: They can be used in all kinds of markets and on all time frames, which gives them a flexibility to be incorporated into a number of trading strategies.
Disadvantages of Reversal Candlestick Patterns
False Signals: Not all patterns result in real reversals; some of them may be wrong and lead to losses.
Subjectivity: Analyzing such patterns can be quite subjective and different traders may interpret the same price action in different ways.
Dependence on Confirmation: Using reversal patterns on their own, without confirming them with other indicators or analysis, is dangerous.
In conclusion, reversal candlestick patterns are certainly helpful technical analysis tools that should be employed as a part of a wider trading strategy which incorporates other types of analysis and risk management measures.
Bullish vs. Bearish Reversal Candles
Bullish and bearish reversal candlestick patterns help traders identify potential trend shifts in the market. Bullish reversal patterns appear at the end of a downtrend, signaling a possible upward move as buyers start regaining control. Bearish reversal patterns emerge after an uptrend, suggesting weakening buying momentum and the likelihood of a downward shift. While these patterns can provide early warnings of market reversals, they are most effective when confirmed by additional indicators, key price levels, and trading volume.
Using Reversal Patterns Before Runs on Liquidity at Important Bank Key Levels
Runs of liquidity are situations where the market moves to regions with high concentrations of stop orders, for instance, near important levels of support and resistance identified by institutional traders. They can lead to reversals typically referred to as liquidity sweeps or liquidity grabs.
They can help in identifying potential turning points in the market based on the reversal patterns that form around these critical levels. Here’s how to approach this:
Identify Key Levels: Determine areas where banks and large institutions have placed significant orders, often around historical support and resistance levels.
Monitor Price Action: As price approaches these levels, observe for reversal patterns that might indicate a potential change in direction.
Confirm with Volume: Increased trading volume at these levels can strengthen the validity of the reversal pattern, suggesting institutional participation.
Execute Trades with Caution: Even with confirmation, always employ risk management strategies, as markets can be unpredictable.
Using Reversal Patterns to Predict Market Reversals Even When the Market Isn’t Ready for One
Trying to predict market reversals based solely on candlestick patterns without other confirmation is risky. Reversal patterns are more reliable when they are supported by other technical indicators and fundamental analysis. To improve the effectiveness of using reversal patterns:
Use Multiple Indicators: Always use reversal patterns with other tools like moving averages, RSI, or MACD to determine possible reversals.
Learn About Market Context: Take into consideration economic data, geopolitical events and overall market mood that may affect price changes.
Patience is a Virtue: Do not act on a reversal pattern without confirmation. Entering the market without enough signals can result in losses.
In conclusion, reversal candlestick patterns are certainly useful, but they should not be used in isolation and must be applied to the specific circumstances of the market.
FAQ
Do Traders Use All Reversal Patterns?
No, traders focus on the most reliable patterns based on market conditions and their strategy. Some patterns work better in certain timeframes or assets, while others give too many false signals. Experienced traders combine patterns with indicators for confirmation.
How Is a Reversal Different from a Retracement?
A reversal is a full trend change, where price moves in the opposite direction for a long time. A retracement is a temporary dip or rally within a trend before continuing in the same direction. Reversals signal a shift in control, while retracements are short-term pauses.
How Is a Reversal Different from a Pullback?
A pullback is a minor price dip within an ongoing trend, often a buying opportunity in an uptrend. A reversal is a deeper move that marks a complete trend shift, signaling traders to rethink their strategy. Pullbacks are short-lived, while reversals indicate lasting direction changes.
Are Reversal Candles Reliable?
Reversal candles can be useful, but they aren’t foolproof since they sometimes give false signals. Their reliability improves when combined with key support/resistance levels, volume confirmation, and indicators like RSI or MACD. Smart traders wait for confirmation before acting.
What Is the Best Time Frame for any Continuation Pattern?
Continuation patterns work best on higher timeframes like 4-hour, daily, or weekly charts for stronger confirmation. Shorter timeframes, like 15-minute or 1-hour charts, can show continuation setups, but they are more prone to false signals. The longer the timeframe, the more reliable the pattern.
What is the best indicator for trend reversal?
There’s no single best indicator, but the RSI, MACD, and moving averages are commonly used to confirm reversals. Divergence on RSI or MACD often hints at an upcoming trend change. The 200-period moving average helps determine long-term trend shifts when price breaks above or below it.
What’s bullish reversal strength?
Bullish reversal strength depends on the size of the reversal candle, trading volume, and confirmation from key support levels. A strong bullish reversal has a large candle body, appears at a major price zone, and is backed by increased buying volume. Weak reversals often lack follow-through and can fail.
Are Reversal Patterns Worth the Hype?
Reversal patterns can be useful, but they shouldn’t be relied on alone since they don’t always guarantee a trend change. Their effectiveness improves when combined with key price levels, volume analysis, and indicators. Smart traders use them as part of a broader strategy, not as standalone signals.