


Reviewed by:

Bullish
- May 26, 2024
- 12 min read
Morning Star Candlestick Pattern – How to Trade It
Candlestick charting is a famous method traders have been using to analyse financial markets. Professional traders prefer the morning star Japanese candlestick pattern due to its distinct shape and ability to predict reversals. Over the next few minutes, we will discuss the morning star pattern, its characteristics, and how traders can trade it.
What is the Morning Star Pattern?
A morning star candlestick pattern is a three-candle formation used in technical analysis by traders to identify bullish reversals. The pattern forms in a specific order, starting with a large red candle, a second small-bodied candle, and a last candle that is large green.
The morning star formation is not limited to specific markets and is considered a reliable trend reversal pattern across stock markets, forex, commodities, and other financial markets. This pattern is preferred by traders across the globe for its convenience in projecting entry and exit points before a trade is executed, including clear stop-loss levels.
What Does a Morning Star Candlestick Look Like?
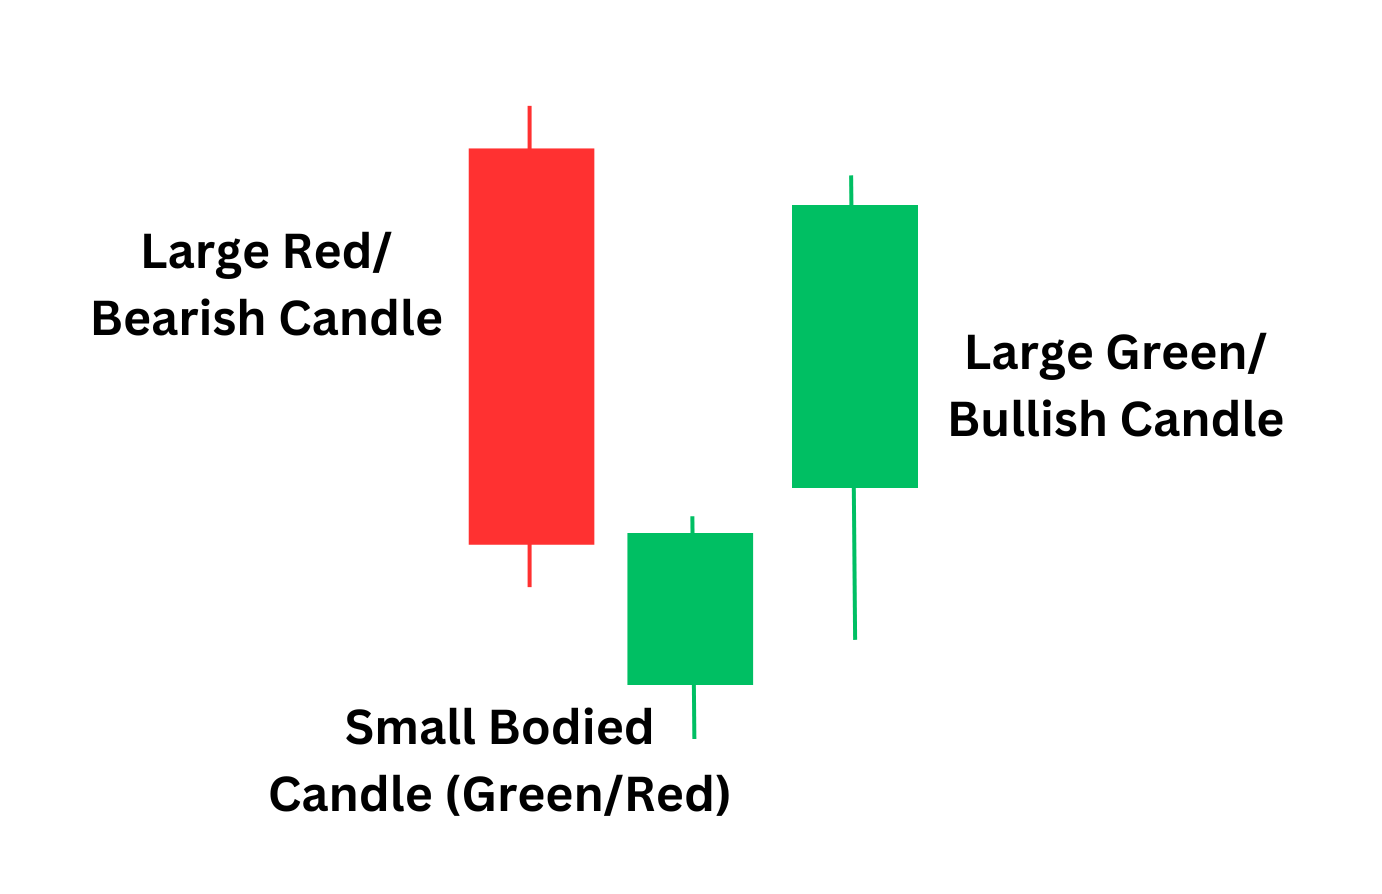
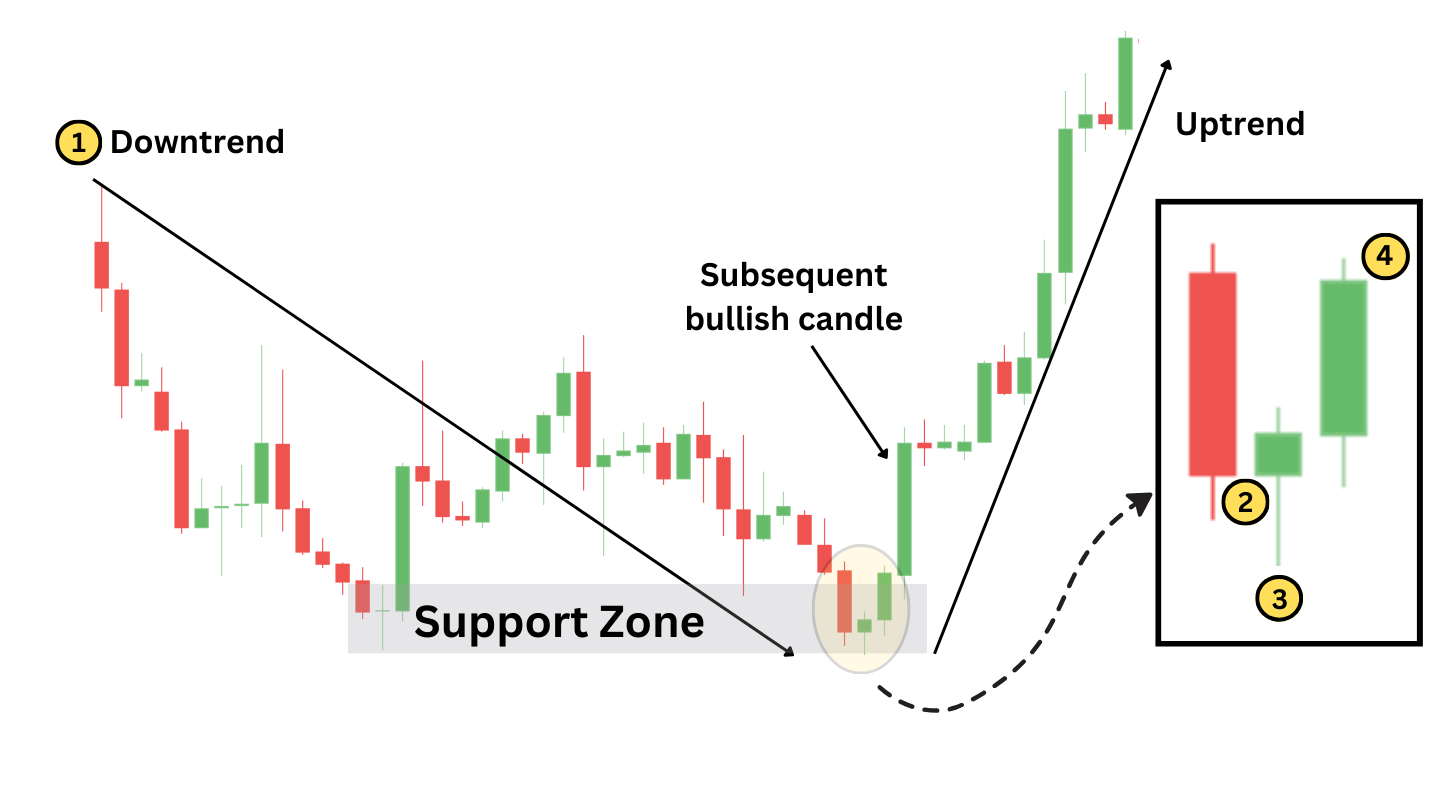
The morning star candlestick has a distinct shape of three consecutive candlesticks, including both bearish and bullish candles. The pattern reflects the change in market structure as the price shifts from a downtrend to an uptrend.
The first part of this pattern is a big, red candle that indicates the continuation of the prevailing downtrend. This candle shows how sellers start their dominance, resulting in the market rapidly moving downward.
In the classic morning star pattern, the middle candlestick is small-bodied and can be either bullish or bearish—this candle ‘gaps’ away from the first candle, revealing a visible space on the chart. The presence of this gap signifies an expectation among traders that the existing strong downtrend will continue. However, the appearance of the small candle signals that this anticipated momentum is not materializing.
The second candle might not show a clear gap away from the first candlestick on the forex and crypto charts and that is okay. What is critical here is that the second candle creates a new low and contains a small body, indicating a potential shift in market sentiment.
The last candle forms a ‘gap up’ from the second candle and is a large green candle that opens higher than the small candle’s close, significantly moving up as the session progresses. This refers to the buyers regaining control, suggesting a strong likelihood of the downtrend reversing into an uptrend.
Main Characteristics of a Morning Star Candlestick Pattern
The Morning Star candlestick pattern is easy to understand and apply by traders due to its various characteristics, including:
- Downtrend Continuation: The pattern starts with a long bear candle that indicates intense selling pressure, followed by a small-bodied candle, and concludes with a large bullish candlestick, representing the buyer gaining market control.
- Price Gap: The gap that occurs before and after the second candle is a crucial indication of market indecision and potential change in trend.
- Lowest Point: The second candle has a petite body and forms the lowest point during the decline. This reflects uncertainty on the downward trend and considers the possibility of a bullish reversal.
- Retracement: The third candlestick in the pattern rallies to cover a significant portion of the first candle’s body. This retracement is a vital sign of buying momentum taking over.
Additionally, the reliability of the morning star is often enhanced when it appears near support levels or is accompanied by an increase in trading volume. Traders often seek additional bull candles or confirming indicators to strengthen the pattern’s predictive power for bullish reversals.
How to Trade Morning Star Patterns
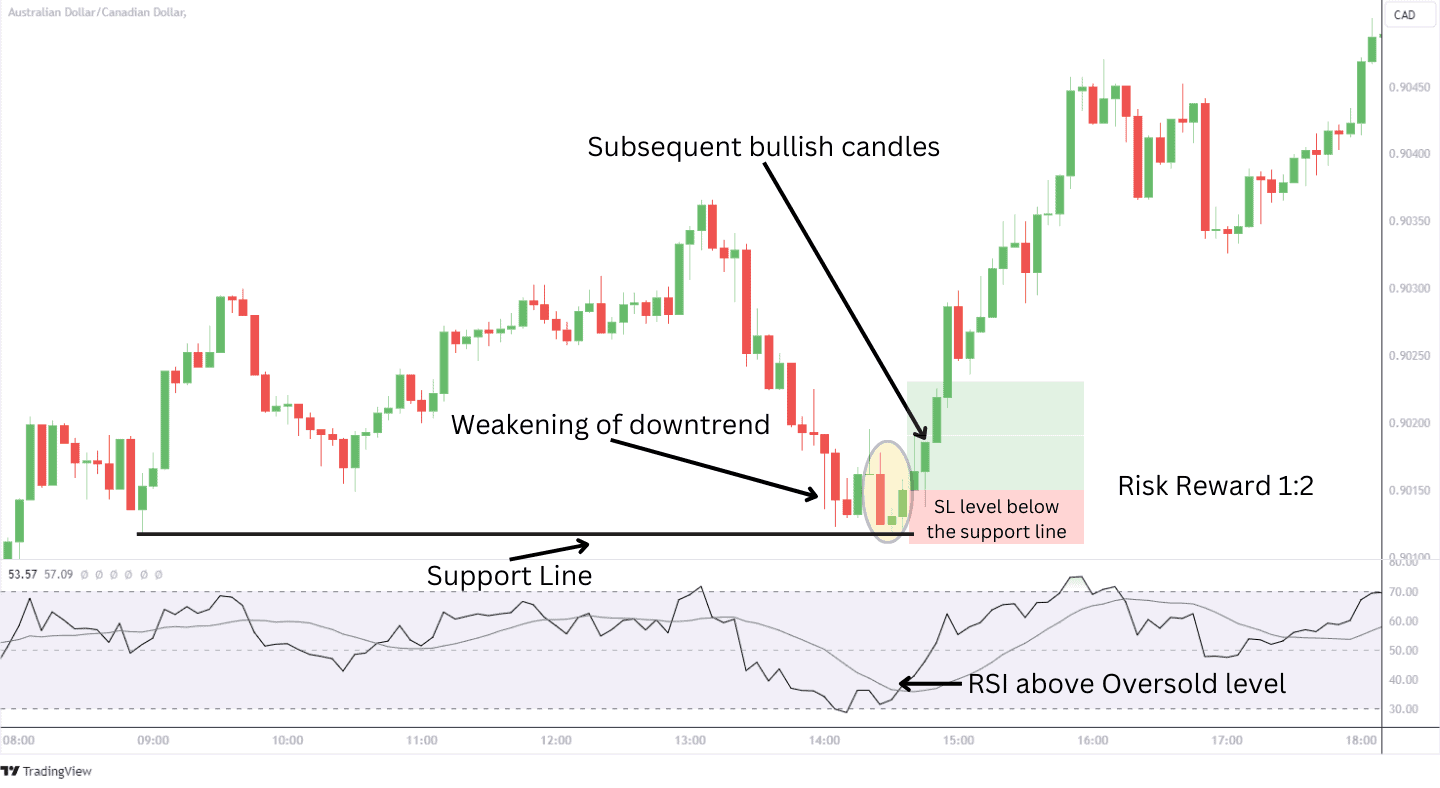
When you spot a morning star pattern, like the one in the chart above, it can strongly indicate a bullish reversal, primarily when supported by additional confirmations and technical indicators.
Identifying Confirmations
Notice in the chart above how a swing low is formed around 9 am, creating a support level where buyers may re-enter the market. As the market dips, difficulty breaking downward becomes evident, and the morning star pattern occurs right at this vital support zone. The formation of the reversal pattern at the end of a downtrend, particularly near support, hints at an upward move for the price.
Enhance the reversal signal’s strength by confirming the pattern with technical indicators. For instance, the chart shows how the Relative Strength Index (RSI) moves up out of oversold levels. This suggests that the price bars are closing near their highs, and buyers are re-entering the market. The bullish RSI crossover indicated that the morning star forming at the price lows was a valid bullish reversal pattern.
Entry Point
The advisable entry point for this would be executing a long position once the third candle closes above the midpoint of the first candle’s body. This approach ensures that the bullish reversal signal is confirmed, reducing the risk of a false signal. By waiting for this close price, the trader effectively verifies that the market sentiment has shifted in favour of buying, providing a more secure and reliable entry into the emerging upward trend.
Stop Loss and Take Profit
Identifying potential stop-loss levels can be straightforward when trading the morning star candlestick. This is because the stop loss can be placed below the lowest point of the morning star candle, below the middle candle. The chart above represents an excellent example of stop-loss placement, where it is placed below the low of the second candle and the support line. This is because the support line accounts for a potential retest of this level, and should the price dip below this; it may invalidate the bullish reversal signal.
Conversely, there is no specific price target for the take-profit level. Therefore, traders can look for previous resistance zones or trade using a risk-reward ratio strategy like 1:2, referring to the chart above. The SL distance is 40 pips. Hence, the TP should be set twice the distance, which would be 80 pips from entry. Using a trailing stop loss to maximize gains as the market is in an uptrend is also a viable trading strategy.
Morning Star Pattern Example
Below are examples of the formation of the morning star on different price charts.
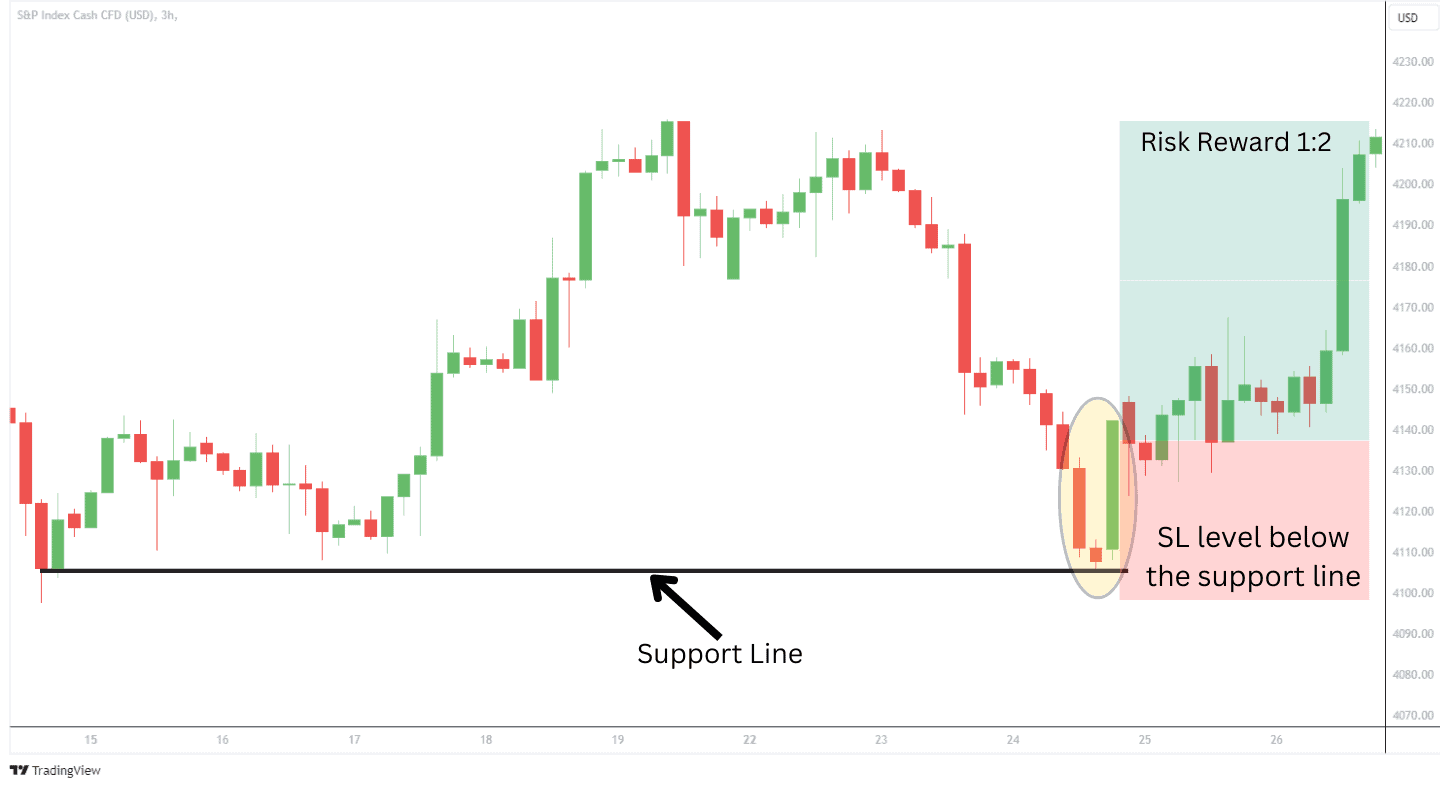
The above is the S&P Index Cash CFD chart that forms near the support line. The risk-to-reward ratio is set at 1:2 with the SL below the support line. The strong bullish pressure on the third candle is a good indication of the potential rally
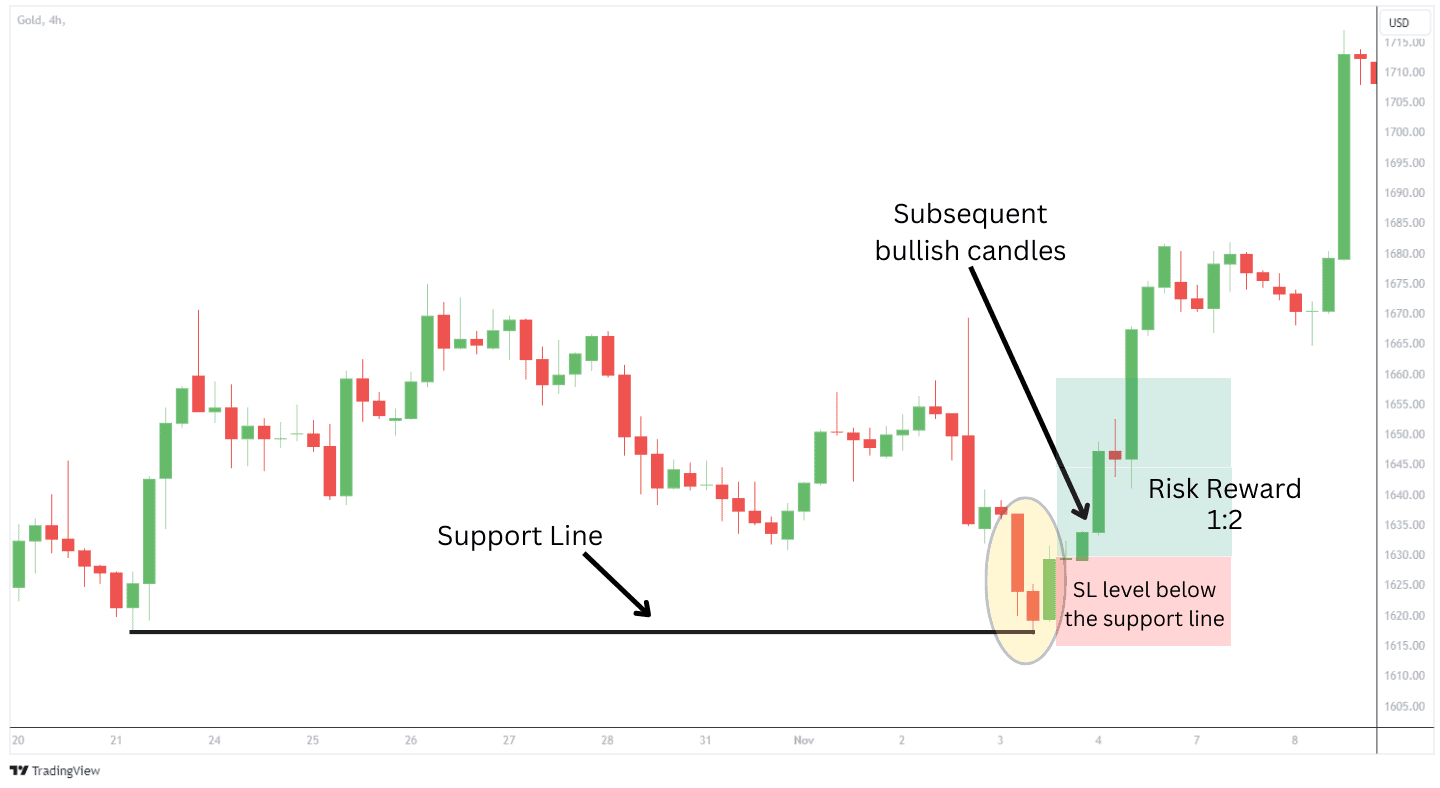
The 4-hour Gold chart above shows the morning star pattern has formed near the support line. The green third candle closes in the top half of the first candle finalizing the pattern and hinting at a potential rally. The 1:2 risk-reward ratio can be applied with SL being placed below the support line and TP set at twice the risk size.
Morning Star vs. Doji Morning Star
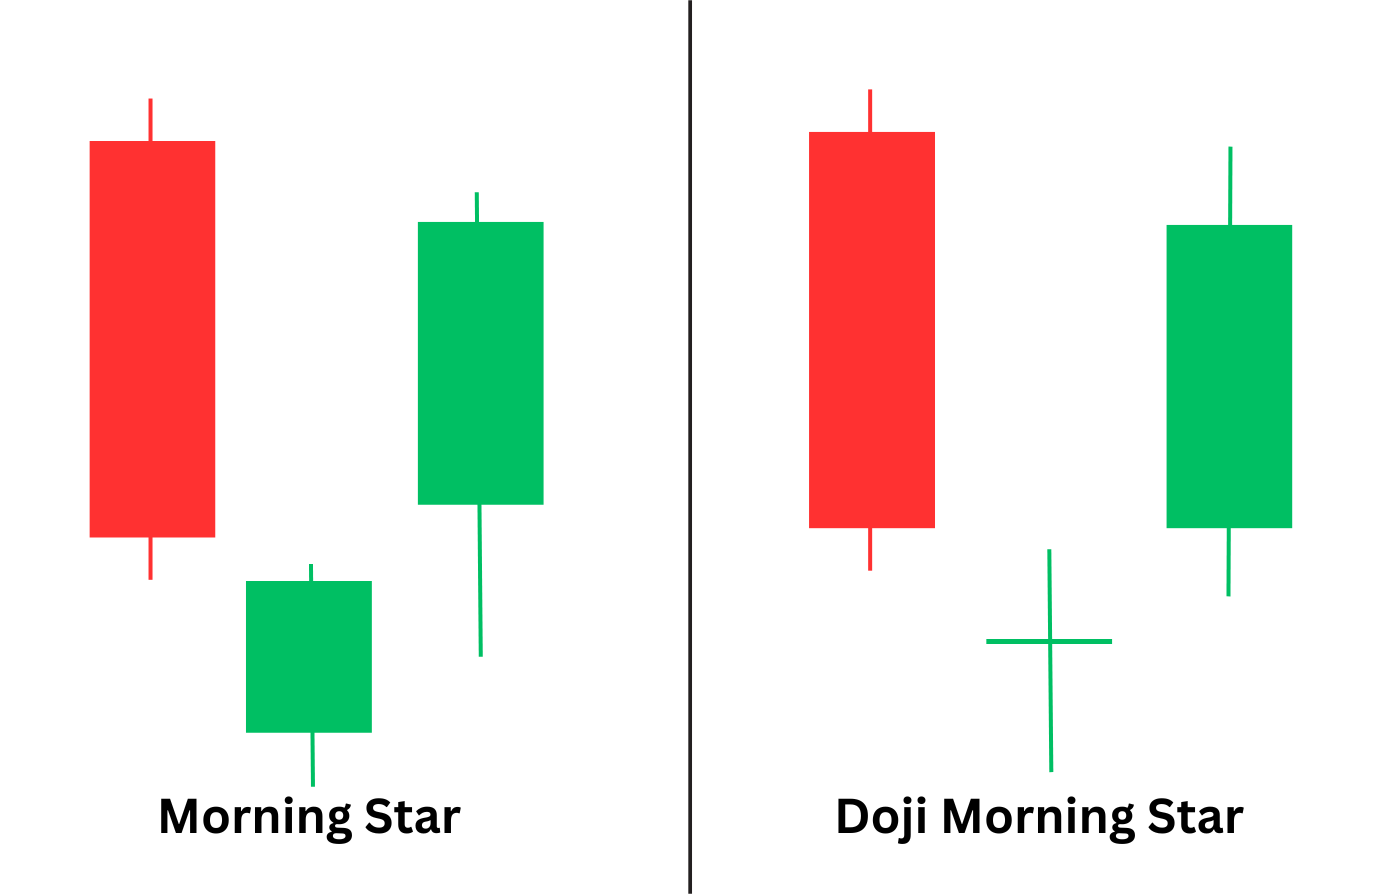
The morning star and doji morning star are strong trend reversal indicators. There are many similarities between these two patterns, whereas both require three candles to form, with the first being bearish and the third being bullish. Both patterns appear during a downtrend and can shift the market to a move higher.
The significant difference between the morning star and the doji morning star is in their second candle. The second, or middle candle, has a small body, which could be either a bull or bear candle. This candle opens lower than the first candle’s close, creating a price gap.
As for the doji morning star, the middle candle is a doji with a non-existent body. This creates a sign of indecision that leads to more vital market uncertainty and results in a more aggressive volume increase and a correspondingly longer bullish candle compared to morning star.
Morning Star vs. Evening Star
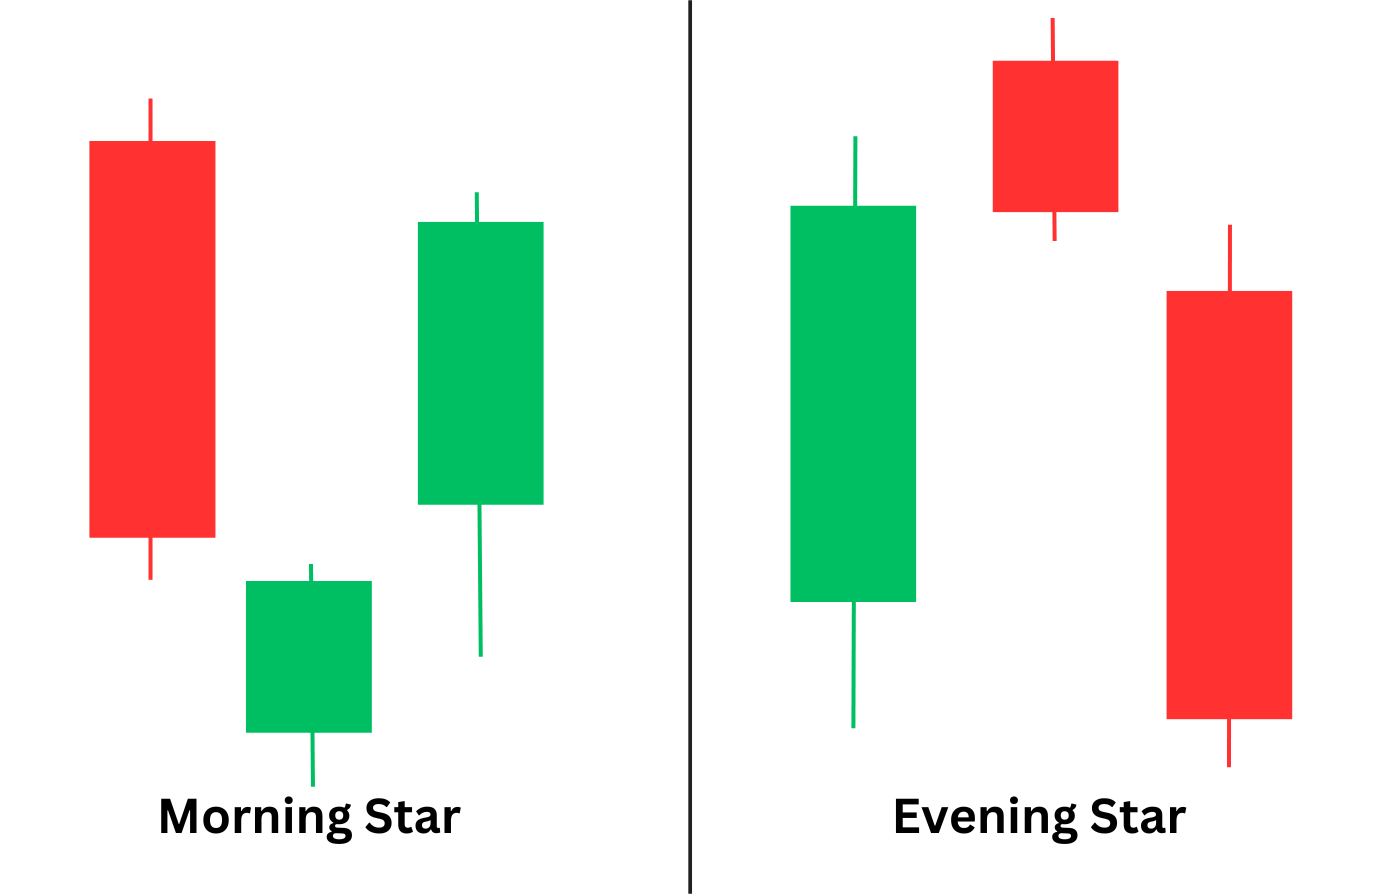
The morning star and evening star patterns can be considered mirror images of each other in terms of outlook, with each pattern signalling a reversal but in opposite directions.
The morning star is a bullish reversal pattern that appears during the end of a downtrend and suggests a sentiment shift from a bearish to a bullish one.
Conversely, the Evening Star pattern is a bearish reversal indicator and usually emerges at the peak of an uptrend, pointing towards a potential shift from bullish to bearish. It starts with a long bullish candle, demonstrating previous buying pressure, followed by a small-bodied candle. It is completed by a long bear candle that delves into the first candle’s body. The appearance of an Evening Star indicates that the bullish trend is losing steam and could be turning bearish.
Morning Star vs Bullish Harami
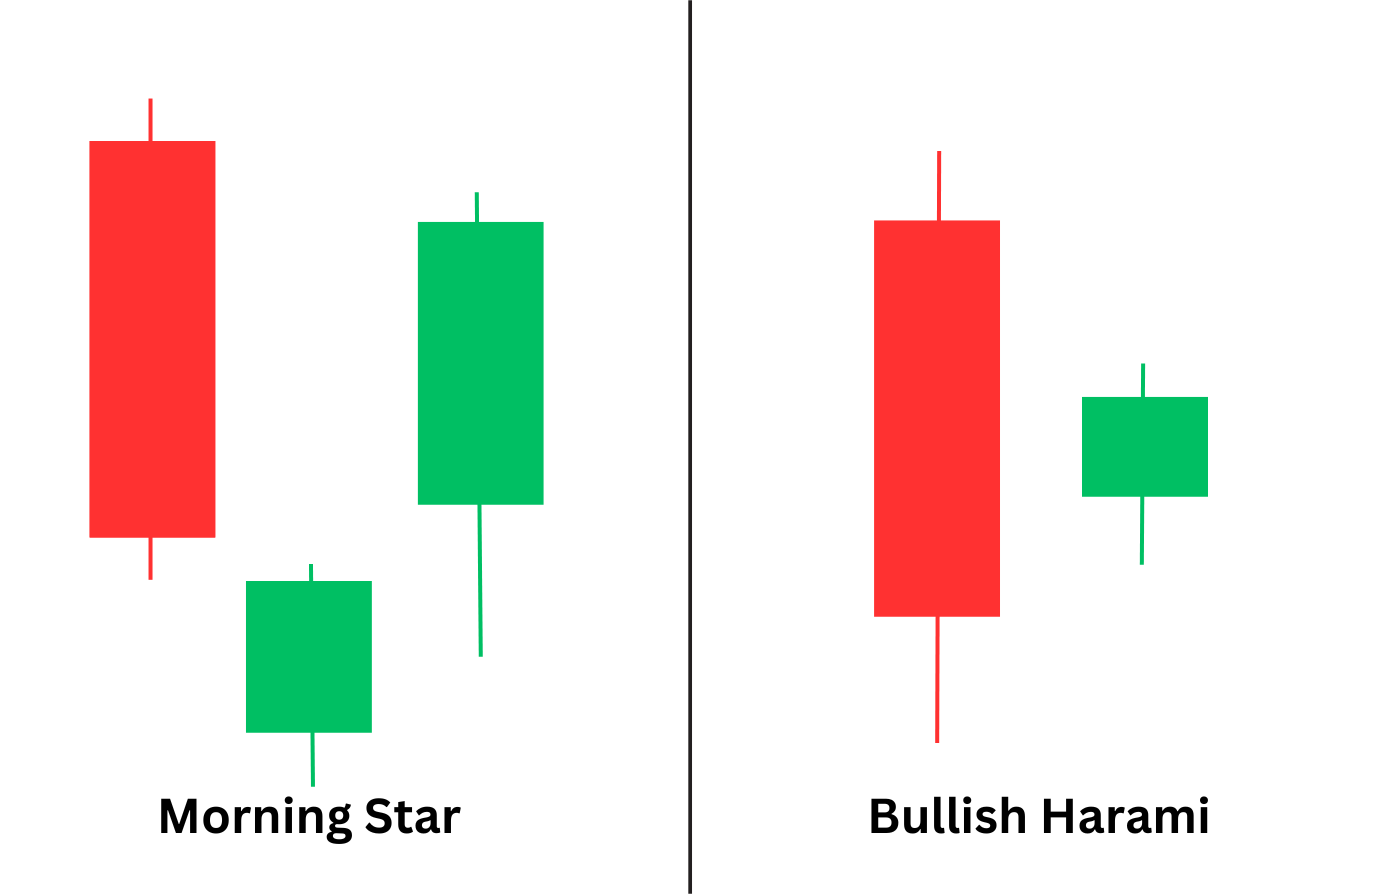
The morning star and bullish harami are both candlestick patterns in technical analysis, signalling potential trend reversals, yet they differ in structure and interpretation. The morning star is a bullish reversal candle that typically forms at the end of a downtrend, consisting of three candlesticks.
In contrast, the bullish harami comprises two candlesticks and signals a possible reversal during the downtrend. It forms a large bear candle that reflects intense selling pressure, followed by a smaller bullish candle.
The formation of the two candlesticks is similar to a pregnant woman, as the large red candle is associated with the woman, and the baby in her belly is the small green candle. The opening of the small candlestick is higher than the low of the bearish candle due to a gap.
Bullish harami can be used for a short-term price reversal but is generally considered a less effective trend reversal pattern than the morning star and requires subsequent bullish candlestick and other confirmations to strengthen the bias.
Morning Star vs Bullish Engulfing
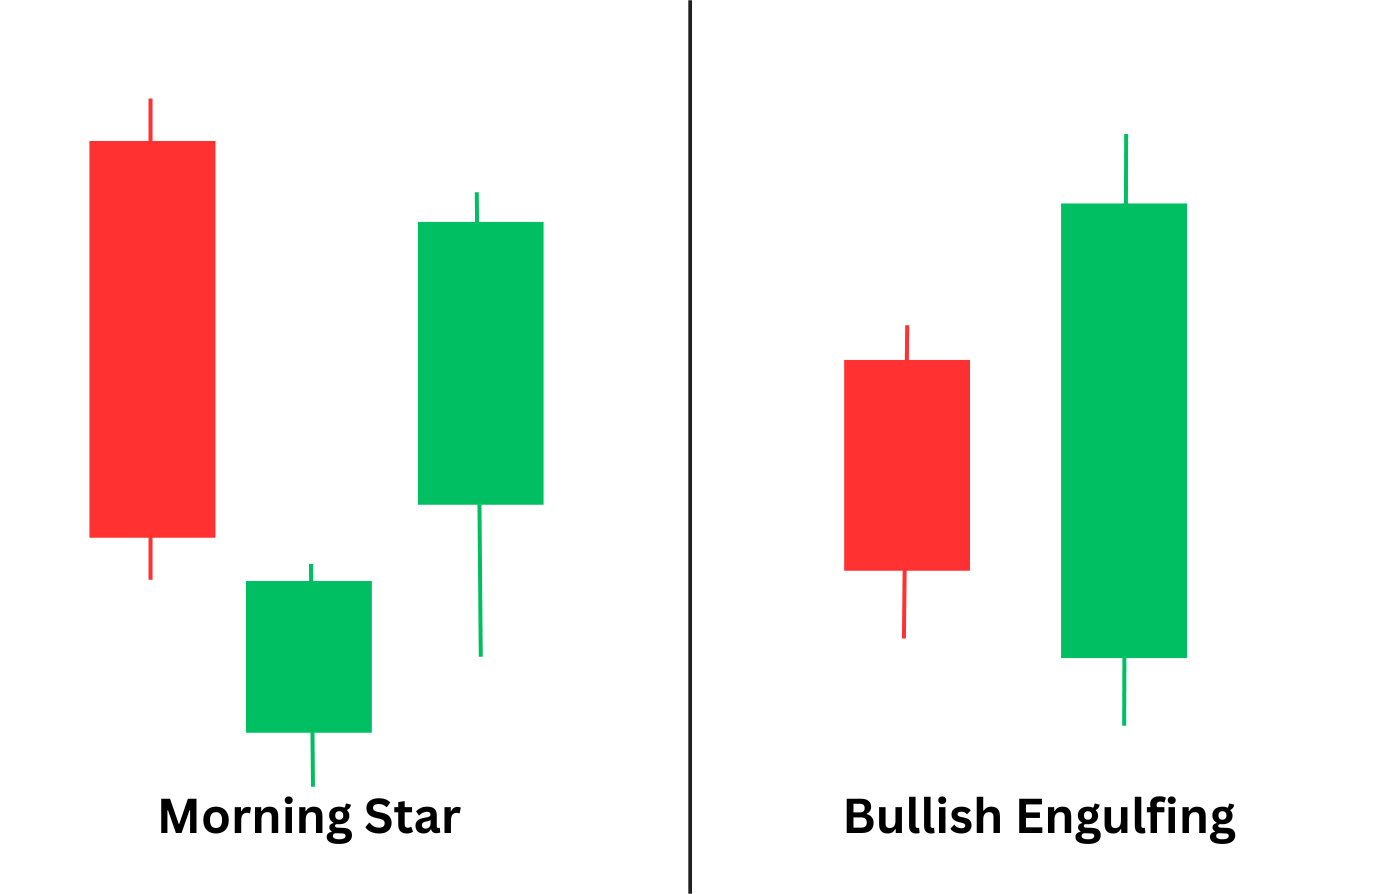
The morning star and bullish engulfing both signal uptrend reversal but with distinct formations and market implications. As we already know the morning star is a three candle pattern indicating a shift from bearish to bullish momentum at the end of a downtrend.
In contrast, the bullish engulfing pattern is a two-candle pattern that commonly occurs during a downtrend or a pullback in an uptrend. The first is a small bear candle that reflects the continuation of the current trend. However, this presumption is swiftly overturned by the large bullish second candle that completely ‘engulfs’ the previous candle, indicating the buyers have taken control and a bullish reversal is underway. This pattern is often considered more assertive than the morning star, as the engulfing nature of the second candle demonstrates a substantial shift in momentum.
Advantages of Using the Morning Star Pattern
The morning star candlestick pattern, recognized for its bullish reversal signal, offers several advantages for traders, such as
- Reversal Indicator: The morning star pattern strongly indicates a potential bullish reversal, precisely when it forms at the end of a prolonged downtrend. Traders can depend on this alongside other confirmations to conveniently anticipate a shift from bearish to bullish market sentiment.
- Easy Recognition: The morning star comprises three distinct candles: a long, bearish candle, a small-bodied candle, and a long, bullish candle. This pattern is relatively easy to spot, assisting traders in quickly recognizing potential reversal opportunities.
- Calculated Risk: The low point of the morning star pattern, typically found in the middle candle, guides traders to set strategic stop-loss orders. By positioning stop losses below this low, traders can manage risk effectively while capitalizing on potential upward movement.
Disadvantages of Using the Morning Star Pattern
Although the morning star pattern is a valuable tool in technical analysis, it also presents certain disadvantages that traders should be aware of, such as
- Patience: The pattern is a combination of three distinct candles. Traders looking to trade this pattern may need to wait patiently, especially when analyzing daily or weekly charts. Due to its infrequent occurrence over these extended periods, traders may face long waits, which can test their patience and may result in missed trading opportunities elsewhere.
- False Signal: It is not a reliable indicator of a bullish rally and may generate false signals, especially when the market is trending sideways.
- Gap and Interpretation: Gaps in continuously traded markets such as forex and cryptocurrency are rare. The absence of apparent gaps can complicate distinguishing the morning star pattern, reducing its reliability and potentially leading to incorrect interpretations.
FAQ
Is a Morning Star Pattern Bullish?
Yes, a morning star pattern is bullish. It signals a potential shift from a downtrend to an uptrend. For example, it is often seen as a reversal sign after a prolonged price decline.
How Reliable Is a Morning Star Pattern?
The morning star pattern’s reliability is notably improved when it appears alongside supportive technical indicators, such as bullish divergence on the RSI or near-established support levels, which can indicate a more substantial likelihood of a bullish reversal.
What is the difference between Morning Star and Evening Star candlestick patterns?
The morning star indicates a change from a price decline to a rally and is characterized by a bearish candle followed by a small candle and then a bullish candle. Conversely, the evening star signals a change from an uptrend to a downtrend, consists of a bullish candle, followed by a small candle, and ends with a bearish candle.


