


Written by:

Reviewed by:

Bearish
- May 10, 2024
- 21 min read
Hanging Man Candlestick Pattern – How to Use It
Among the many Japanese candlestick patterns, the hanging man can be confusing for beginners and veterans alike. Due to looking like a hammer candlestick, the hanging man can lure traders into thinking that price may rise even higher – however, it’s a trap!
To avoid getting trapped by the hanging man, let’s learn all about what this pattern indicates, and how we can trade it.
What Is the Hanging Man?
The hanging man is a Japanese candlestick pattern that technical traders use to identify a potential bearish reversal following a price rise. It is a sign of weakness in the asset’s ability to sustain an uptrend.

Additionally, the hanging man pattern can occur after a price gap, often in stocks and forex when markets close temporarily, like overnight or over weekends. In the event of an upward price gap, the hanging man is seen as a stronger bearish signal.
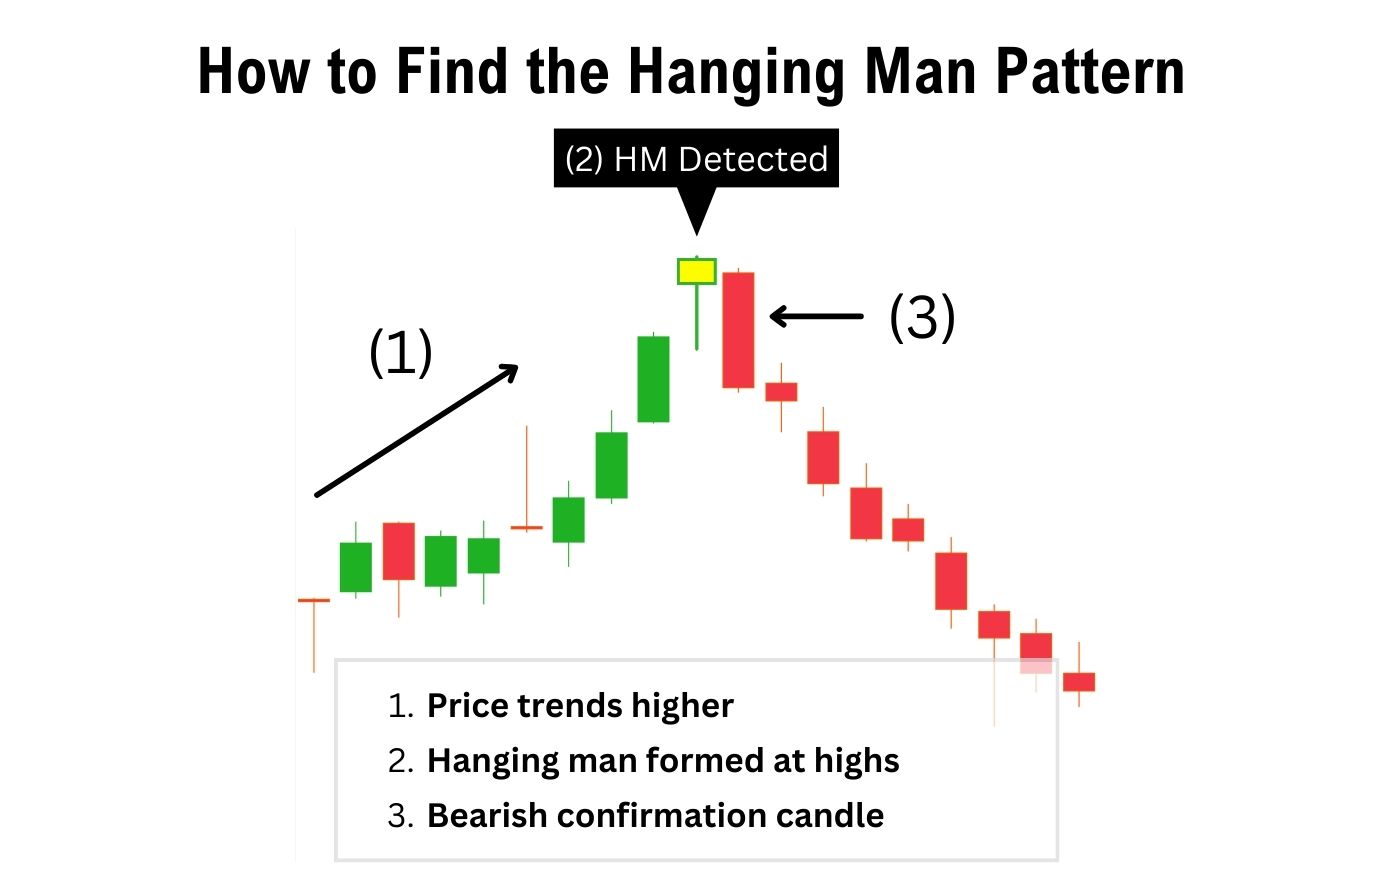
How to Recognise the Hanging Man Candlestick Pattern
Follow these 3 steps to correctly identify the hanging man pattern:
- Look for an asset where the price is trending upward.
- Look for a pattern with a long lower shadow.
- The following candle is bearish and closes lower than the hanging man candlestick.
Sometimes you may notice a gap between the hanging man candle and the previous candle – this would usually happen in markets that close overnight or over the weekends. As market prices tend to return to pre-gap levels, many traders see this as a stronger bearish sign.
Then, there’s also the size of the hanging man. If it is too small, it could be an insignifcant signal.
Ensure the pattern is at least comparable in size, or larger, than the few preceding candles. Once confirmed, the wick should be at least twice the size of the body. A longer wick indicates a greater loss of momentum and a stronger bearish signal.
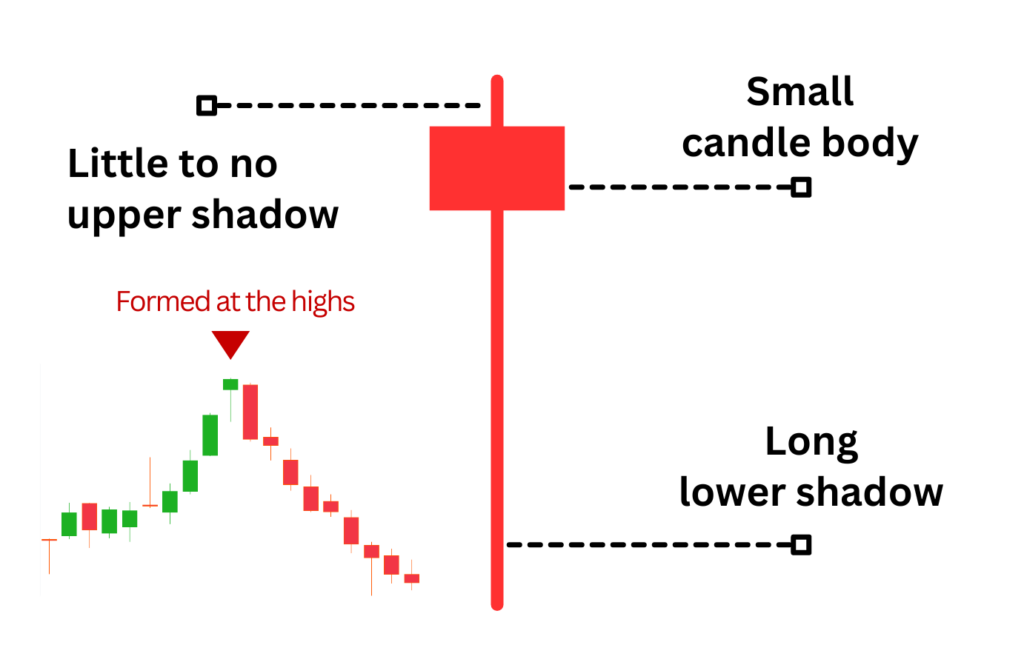
Key Characteristics of the Hanging Man Candlestick
When you’re looking for the hanging man candlestick, make sure the candlestick fits these criteria:
| Long Lower Shadow: The hanging man has a long wick to the downside, represented by the line in the candlestick. |
| Small Candle Body: The hanging man has a small candle body, represented by the solid part in the candlestick. |
| Placement of Candle Body: The small candle body is found at the top of the candlestick. |
| Length of Shadow: The length of the lower shadow is at least twice the length of the candle body. |
| Direction of Price Movement: To double confirm the candlestick is a hanging man pattern, observe the direction of the trend before its formation. The hanging man pattern only forms when the price is moving up, not when the price is moving down. |
Keep in mind the hanging man pattern has a small candle body, and isn’t a doji candlestick pattern. The candle body appears at the top of the candlestick, while the lower 2/3 is characterised by a long shadow.
What does a Hanging Man Candlestick indicate?
The hanging man candlestick implies there is significant selling pressure at the highs of an uptrend. This can be seen by the long lower shadow, implying that sellers have tried to sell at the top.
But wait, you might say – “Doesn’t this mean that buyers have also stepped in to buy up the selling pressure?”
The short answer is Yes. Indeed, many buyers have stepped in.
However, it’s the placement of this pattern that is worrisome. The significant presence of sellers indicates danger for the uptrend, and signals a potential dump.
Overall, this hints at a weakening uptrend and a bearish price reversal. This presents a shorting opportunity for traders and a profit-taking signal for those already long.
Hanging Man Candlestick Example
A fantastic example of a hanging man pattern can be found on the Silver Futures 1D Chart in May 2021.
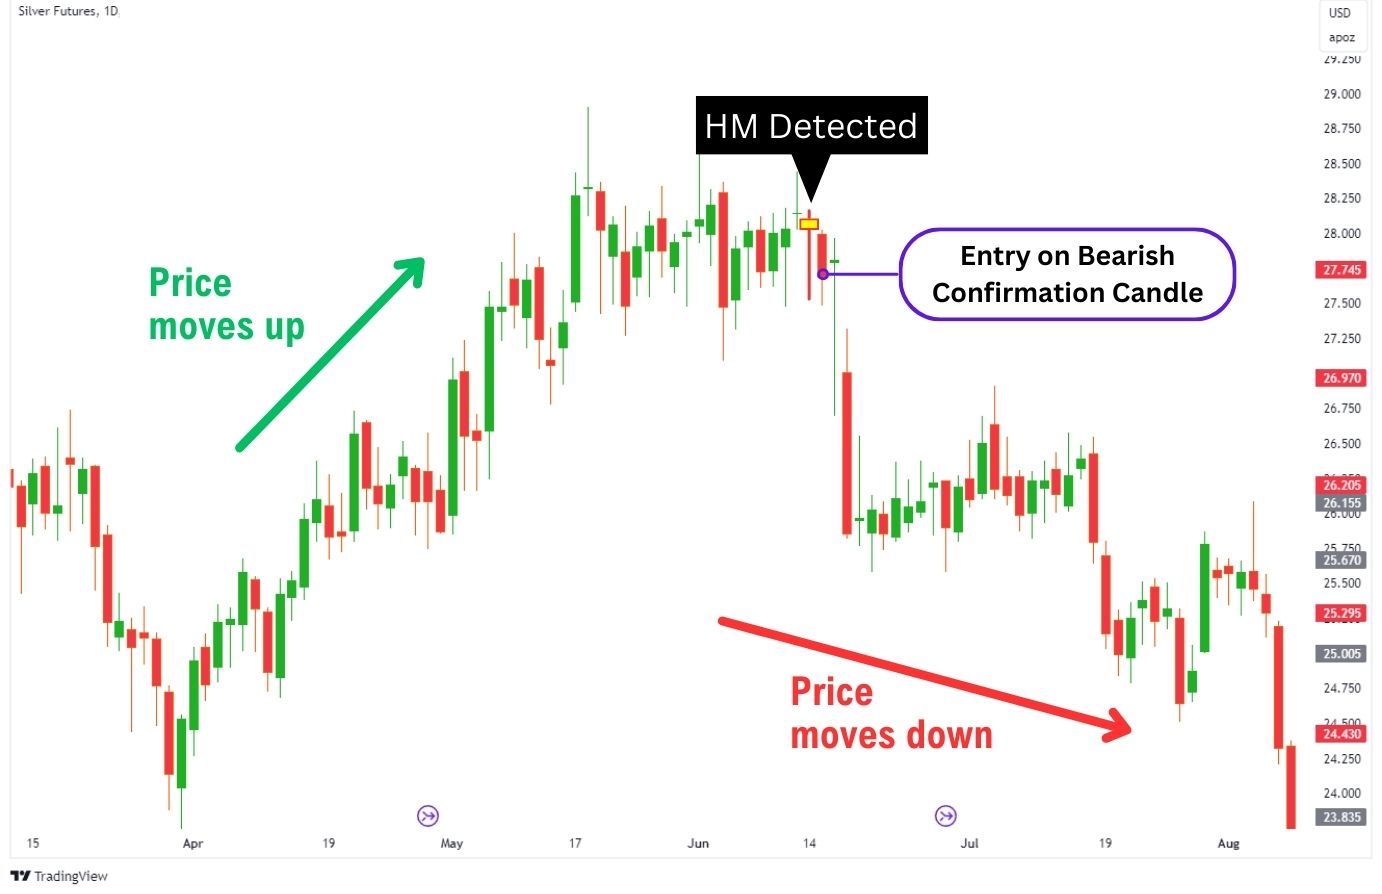
On May 28th, a hanging man candlestick was formed on the Silver Futures daily timeframe, ironically also at $28. To confirm the validity of this bearish reversal pattern, we’ll wait a single day.
The next day, a subsequent bearish candle forms – confirming the presence of powerful selling pressure. Eventually, the price of Silver Future dumps down to $21.140.
Aside from a signal for a short position, the hanging man can be used as am exit signal when you’re sitting in a long. This makes the pattern a versatile indicator which traders can adapt to, adjusting their trade positions on the fly.
What are Confirmation Candles for the Hanging Man?
Whenever a hanging man candlestick pattern forms, it’s good to wait for the next candlestick to close lower as a bearish confirmation. Doing so can improve the quality and consistency of your trades.
For the hanging man candlestick, a confirmation candle would be a consecutive bearish candlestick below the hanging man’s body. Alternatively, the confirmation can be another bearish candlestick pattern such as the shooting star, evening star, or even another hanging man.
In short, the confirmation is a second candle which supports the hanging man candlestick’s bearish bias – providing you, the trader, with more certainty to enter a short or exit a long.

Hanging Man Candlestick Strategies
It is important to remember that when trading hanging man candlestick patterns, stop loss placement and market structures are vital.
Many traders are stopped out of potentially profitable hanging man candlestick trades due to tight stop loss placement, often recommended by conventional guidelines.
To prevent these premature exits when trading the hanging man, we have turned to the Average True Range (ATR) indicator, which has become an integral part of the strategies recommended below.
Below are three strategies you can use to trade the hanging man candlestick pattern:
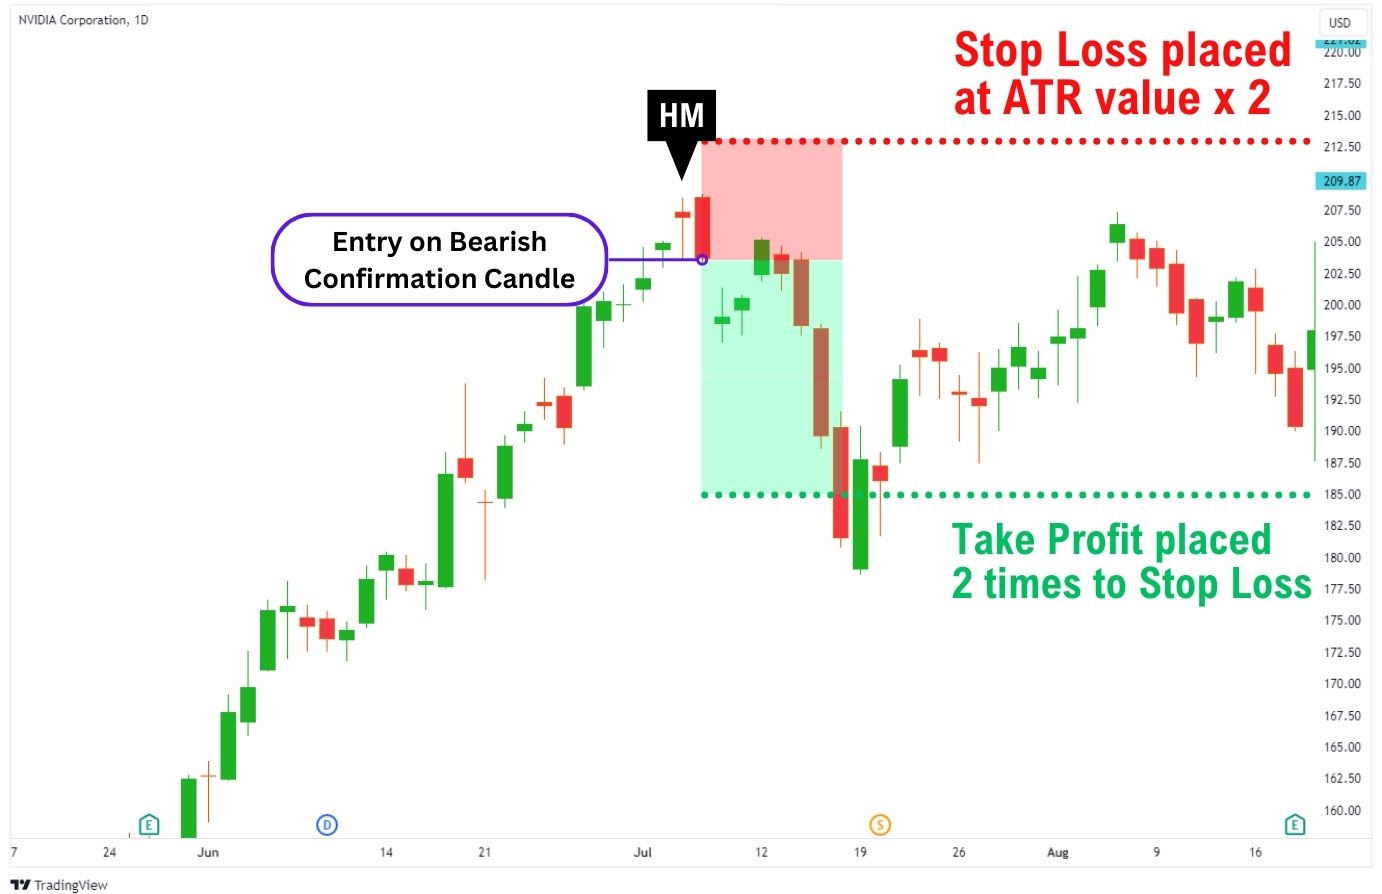
1. Sell the Rally Strategy with ATR SL/TP
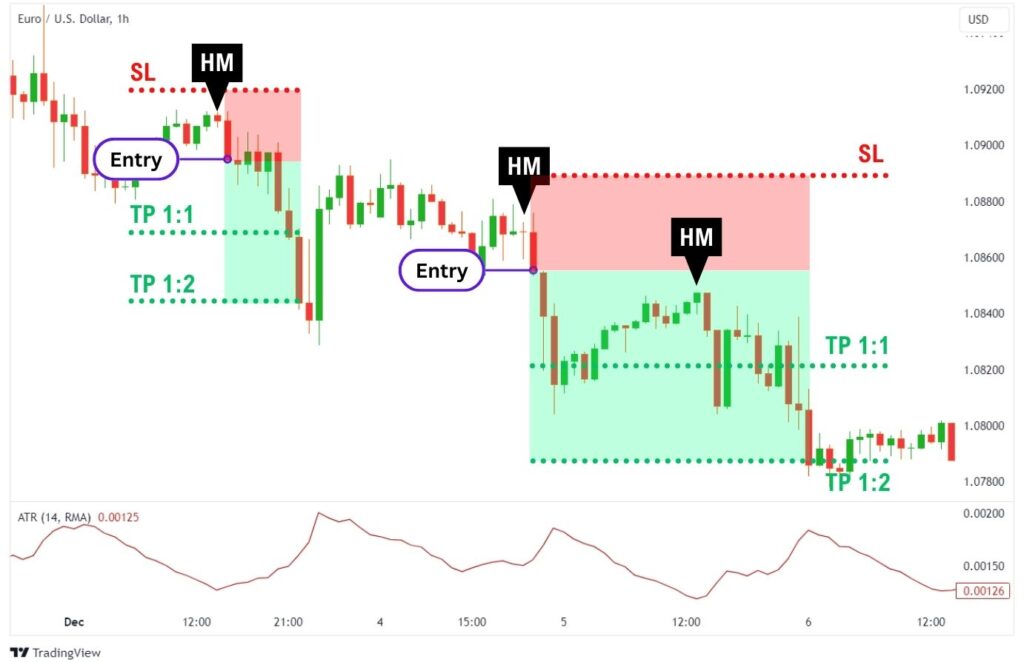
This is a simple trend continuation strategy focusing on assets consistently forming lower highs and lower lows. During rallies, enter a short position when a hanging man pattern and a confirmation candlestick appear.
| Recommended Indicators: Average True Range Indicator, The ‘Adaptive Candlestick’ indicator, which can highlight the hanging man (Available when trading with Alchemy Markets) |
To prevent premature stop-outs, we are using the ATR indicator to determine your stop loss and take profit targets. Here is how it works:
- Take the ATR value of the confirmation candle.
- Multiply it by 2.
- Add the value to your entry price to get the stop loss.
- Subtract the value from your entry price to get the take profit level.
| Entry Signal: – Find a price rally to the upside in a macro-bearish trend environment – Wait for a bearish confirmation candle |
| Additional Notes: – While the risk-to-reward ratio of 1:1 is the most conservative and should provide a higher win rate, it may not be the most profitable. – We recommend backtesting this strategy with different risk-to-reward ratios to get the best results for the assets you trade. |
2. Sell at Resistance Strategy
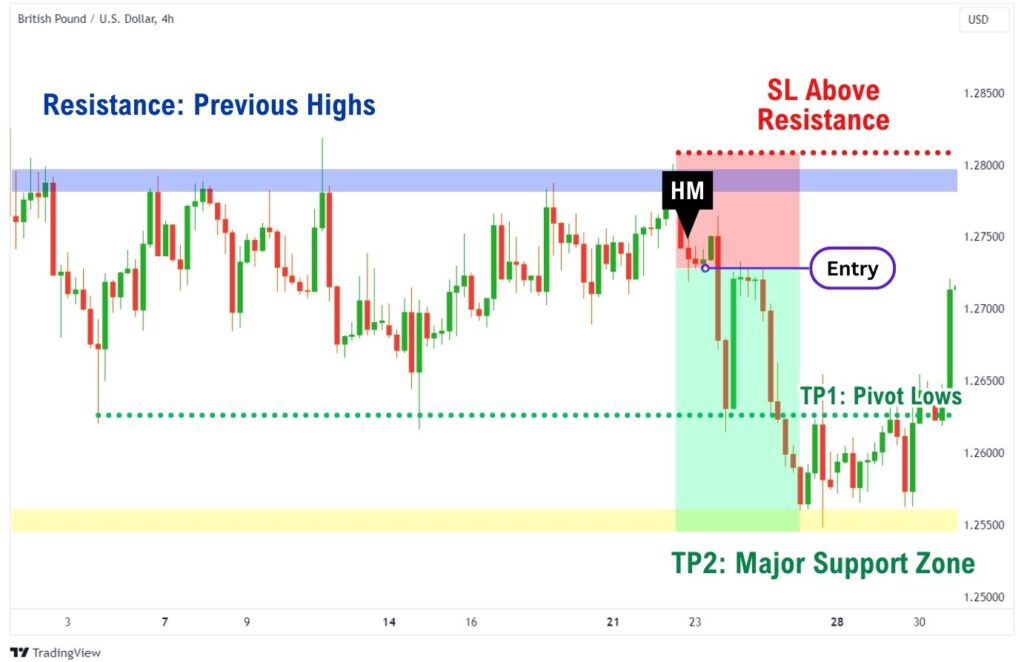
This strategy combines the basic concept of support and resistance trading with the hanging man candlestick for a short confirmation.
First, identify a hanging man as the price nears a resistance area, where rejection is likely. Then, upon the formation of a hanging man, followed by a red/black candle, enter a short targeting the next support zone.
An example of this strategy can be seen here on EURUSD, 1h time frame. For this trade in particular, we used the 50-period exponential moving average and the vWAP as resistances.
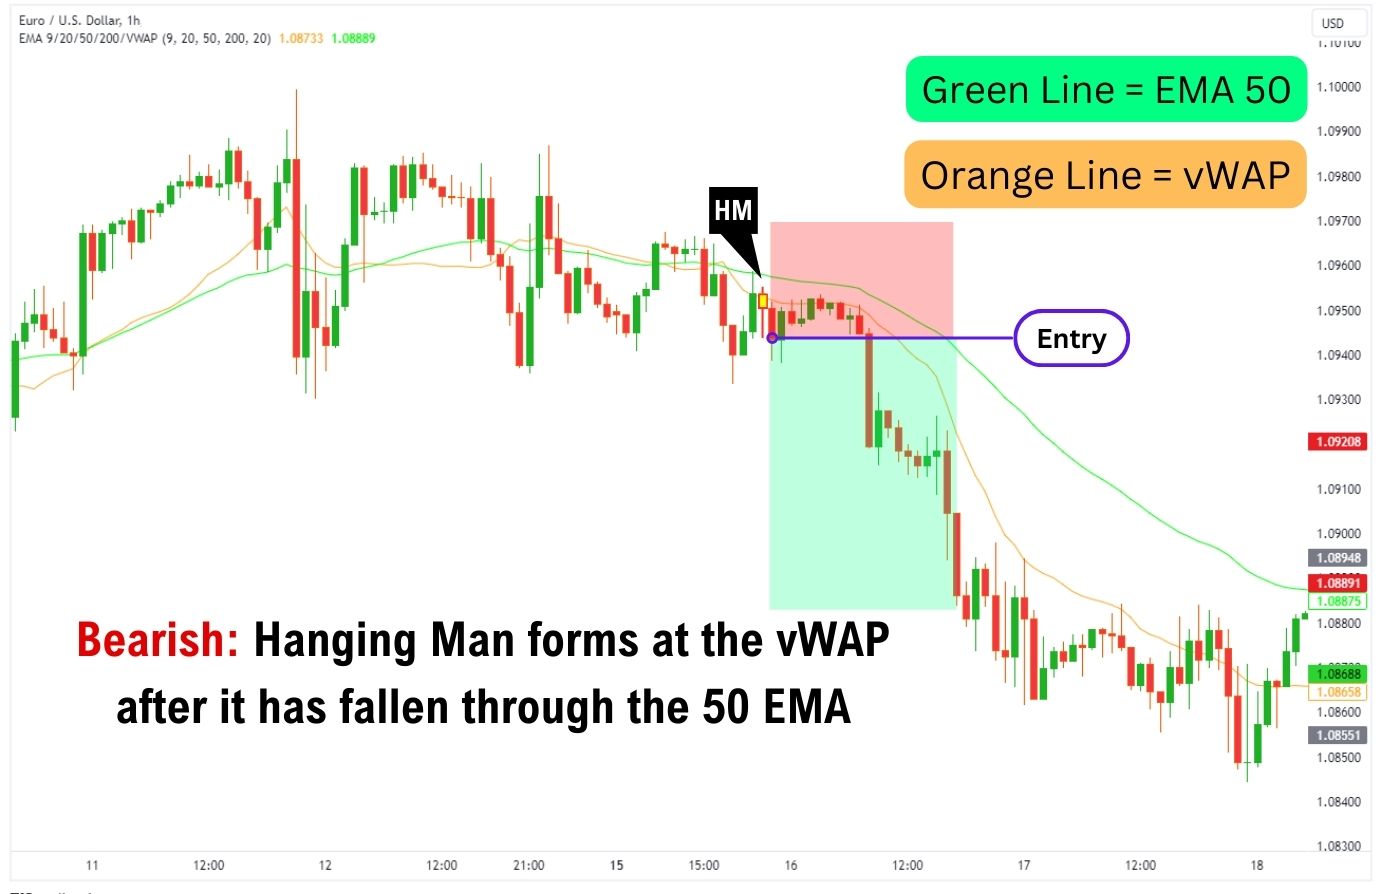
There are many ways to mark out resistances in your chart, such as Horizontal Levels, Trendlines, Moving Averages, Fibonacci Levels, vWAP, and other types of resistances you can find.
These resistances can be categorised as static resistances, which are horizontal, historical levels where the price has previously reacted, or dynamic resistances identified through indicators like Moving Averages and the vWAP.
- Horizontal Levels: Mark out horizontal levels where the price has reversed directions from
- Trend Lines: Look for any obvious chart patterns and mark out their trend lines
- Moving Averages: Popular moving averages are 20, 50, 100, and 200 SMA or EMA
- Fibonacci Levels: Find any Fibonacci levels above the current price, if it’s in a macro downtrend
- Others: This is by no means an exhaustive list of resistances, other confluences can include the volume profile, vWAP, or Ichimoku cloud
| Entry Signal: – On the formation of a hanging man pattern after the price moves up to resistance levels – Wait for a bearish confirmation candle |
| Exit Signals: – Stop Loss placed above the resistance level – Take Profit placed at the next support zone |
3. RSI Divergence Strategy
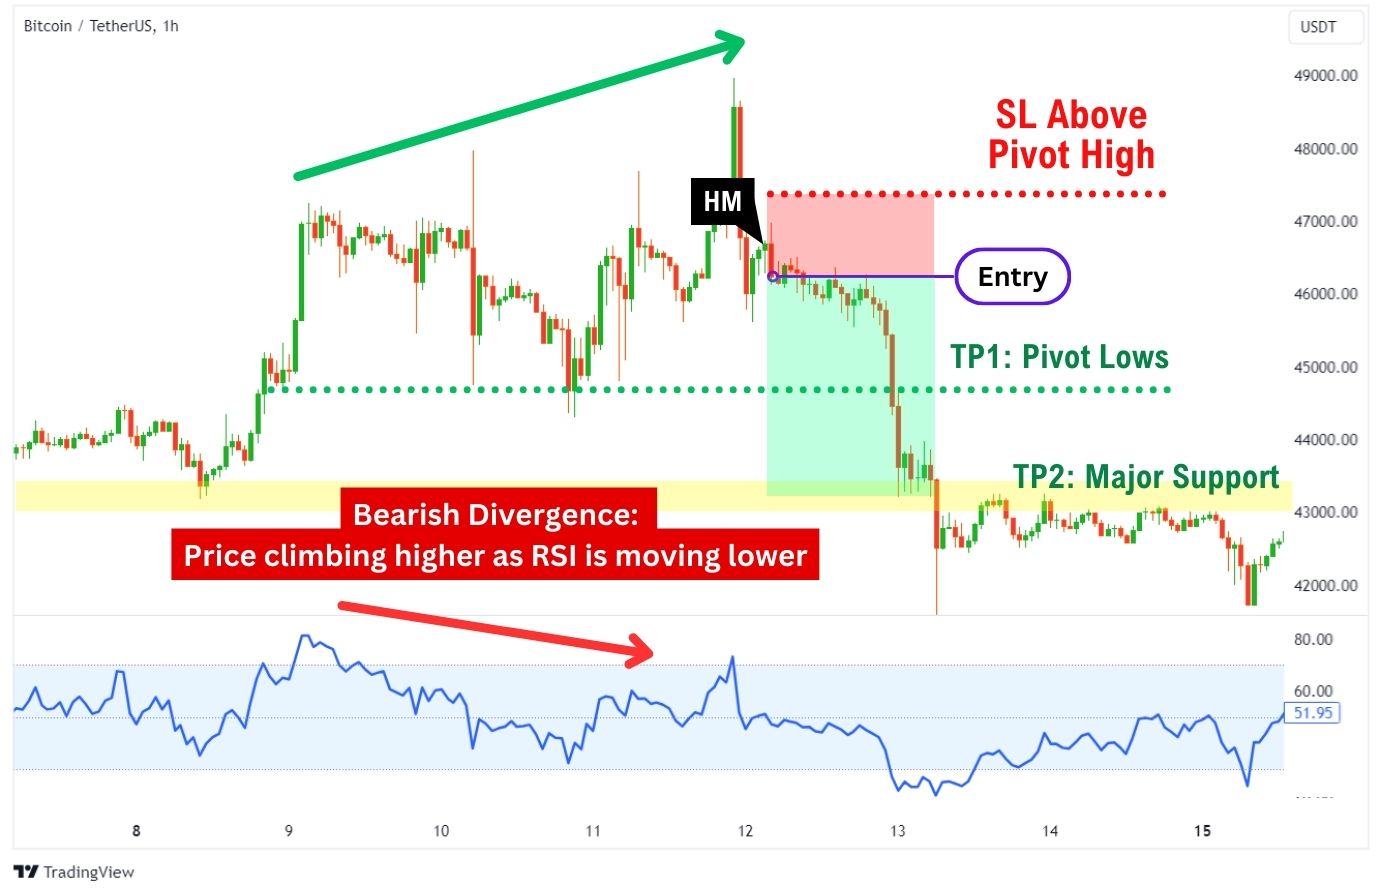
This strategy is versatile and can be used with most oscillator-type indicators, such as the Relative Strength Index (RSI). For the sake of simplicity, we will use the RSI divergence to explain this strategy, as the RSI is one of the most popular indicators among traders.
This strategy combines the use of support and resistance charts and the detection of bearish divergences at resistance to enter a swing short position (or profit from a flash crash).
| Entry Signal: – A bearish divergence has formed on the RSI indicator – On the formation of a Hanging Man candlestick pattern at the highs – Wait for a bearish confirmation candle |
| Exit Signals: – Stop Loss placed above the resistance level, or above a pivot high formed recently – Take Profit placed at the next support zone |
| Additional Notes: – For best results, find bearish divergences formed with at least one peak going over the 70 mark in the RSI oscillator |
When to Take Profit for the Hanging Man Candlestick Pattern
Many traders use a fixed risk-to-reward ratio or support levels to determine their take-profit zones when trading the hanging man candlestick pattern. This is because traditional Japanese candlestick patterns, such as the hanging man, do not have a clear measured move target.
Let’s walk through the fixed risk-to-reward and support-level options one by one.
Take Profit according to Fixed R/R Ratio
Traders looking for a simpler approach can look to apply a fixed risk-to-reward ratio. Our recommendation is to use the ATR (Average True Range) indicator to set your stop loss and take profit to at least two times the distance of the ATR value.
Although this means your trades will be operating on a 1:1 fixed R/R ratio, it’s a conservative approach to trading as your win rate will likely be over 50%. This does not however mean you can’t employ a more aggressive take profit target, like a 1:2 fixed risk-to-reward ratio. It just depends on the market conditions, asset, and the timeframe you are trading!
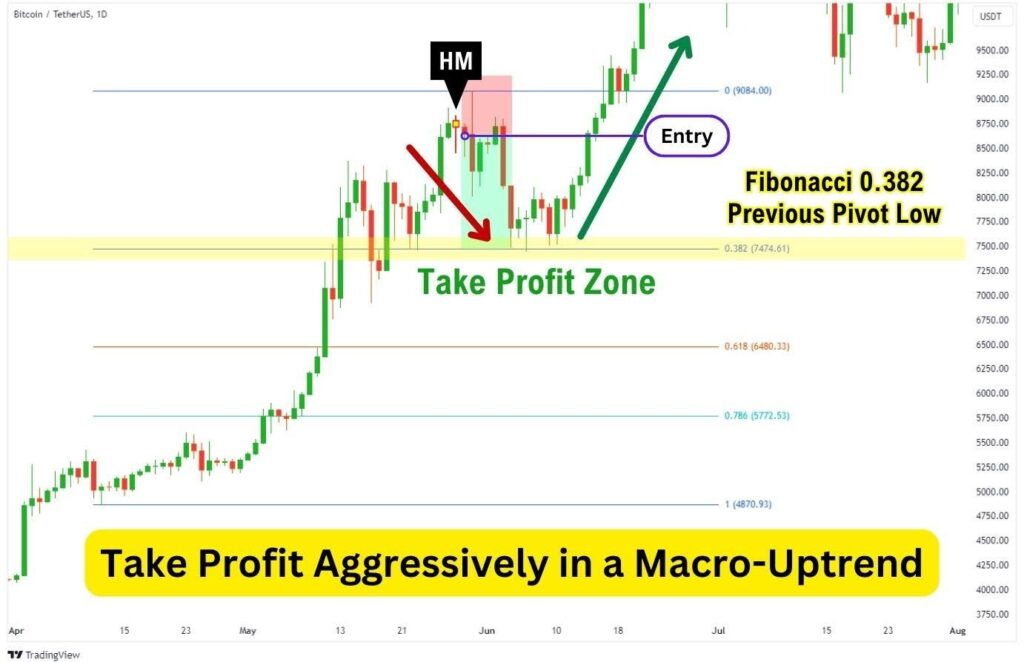
Pivots, Fibonacci Level and Other Support Zones
The second method of profit-taking is to simply draw the support zones below your entry level and set several profit-taking levels depending on their importance.
| Pivot points: These are points where the price has clearly pivoted from or formed a previous high or low. |
| Historical support: These are horizontal levels that have acted as support or resistance on the daily, weekly, monthly or yearly time frame. |
| Fibonacci Levels: These are levels drawn from a relevant low to the highs near the hanging man pattern using the Fibonacci retracement tool. The most notable and frequently traded levels are 0.382, 0.5 and most importantly: 0.618, the level of the Golden Ratio. |
| Moving Averages, vWAP: These are dynamic price lines that mark zones where traders and, more importantly, algos (trading bots) mark average prices. The moving averages most commonly used by traders are either SMA or EMA with a length of 20 / 50 / 100 / 200. |
Note that in areas where two or more support lines meet, it is always a good idea to take some profit off the table. This is especially true during a macro uptrend, as the hanging man could be signalling just a small pullback before a larger upward move in the market continues.
When to Cut Loss for the Hanging Man Candlestick Pattern
One of the biggest weaknesses of trading the hanging man pattern is that it is very susceptible to being wicked out, especially if you use a conventional stop loss placed directly above the hanging man pattern itself.
This can be risky, as the hanging man pattern indicates price weakness but not an immediate downturn. Here are three ways you can remedy this situation:
- Set the stop loss above a nearby resistance level
- Set the stop loss at two times the ATR plus your entry price
- Set the stop loss above the nearby resistance level plus the ATR value
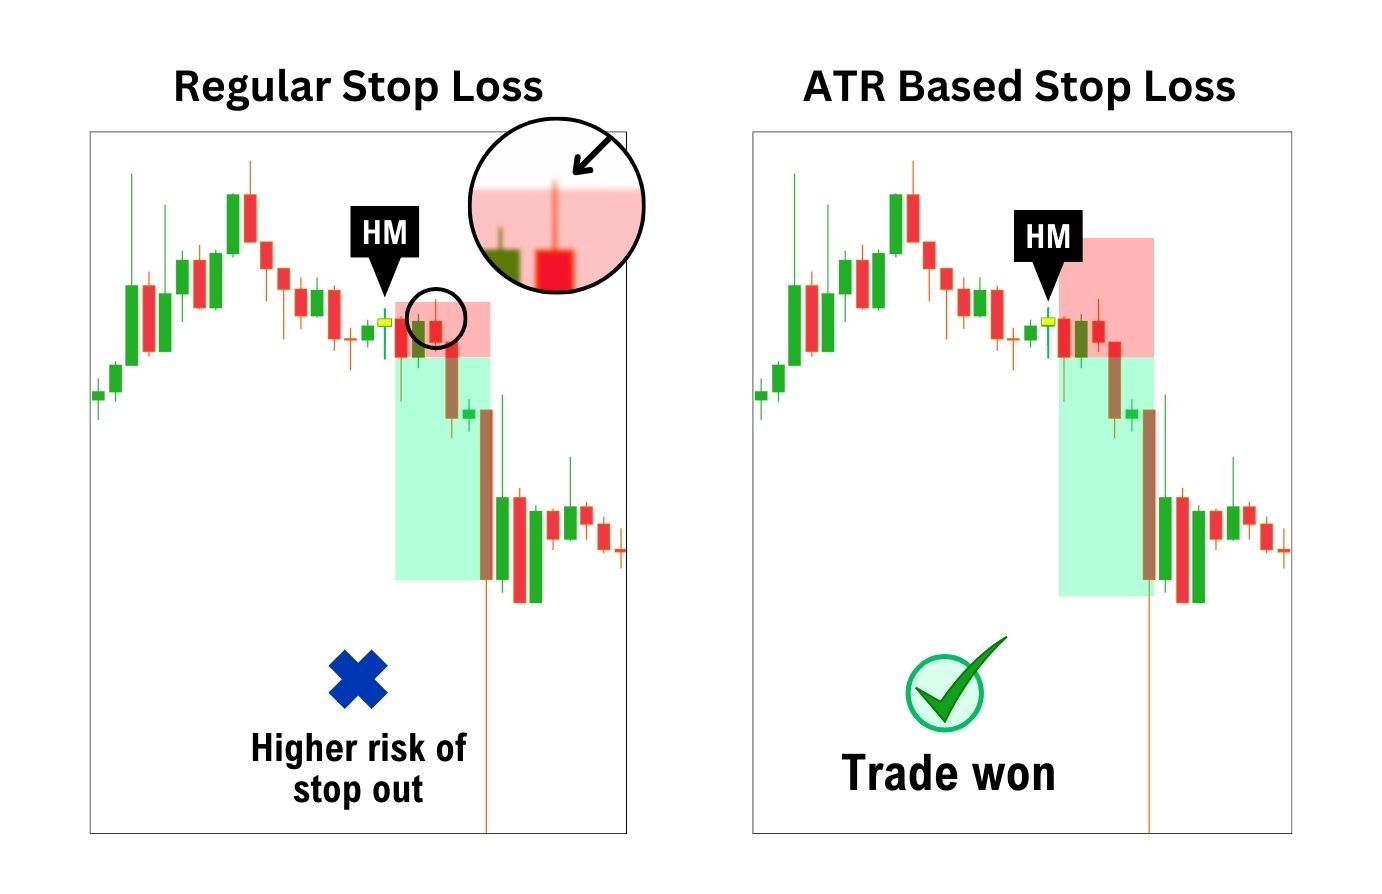
By setting the stop loss above a key resistance area or the ATR value times two, we are saying that we will only be taken out of the trade if the markets make an erratic move higher. This prevents our trade from being stopped out by regular price movements that have no significance in invalidating our bearish bias.
Finally, make sure that you risk less than 2% of your total account balance on each trade. If your stop loss is larger, you will need to adjust your trade size to compensate for the larger distance. This common risk management practice will keep you consistent on your trading journey.
Advantages of Hanging Man Candlestick
The hanging man candlestick has clear visual cues, making it an easy pattern to spot in the charts. It also can appear after a gap up, which is perceived by traders to be a stronger bearish sign.
Let’s look into the key benefits of trading a hanging man pattern.
- Easy to recognise: It is just a singular candlestick pattern, making it easy to identify.
- Provides Entry and Exit signals: The market reversal signal can help traders get into a short position. Alternatively, helps traders in long positions exit trades.
- Frequent Scalp Trade Signals: Candlestick patterns tend to occur more frequently on smaller timeframes, such as the 15-minute timeframe or lower. This makes it great for scalp trading.
Disadvantages of Hanging Man Candlestick
Despite its benefits, the hanging man candlestick pattern also comes with a set of disadvantages. It’s important to acknowledge these weaknesses so we can reduce their effects when trading the pattern.
- Risk of Misinterpretation: Beginners may think this is a bullish indication, as the lower shadow indicates buyers are active in the market.
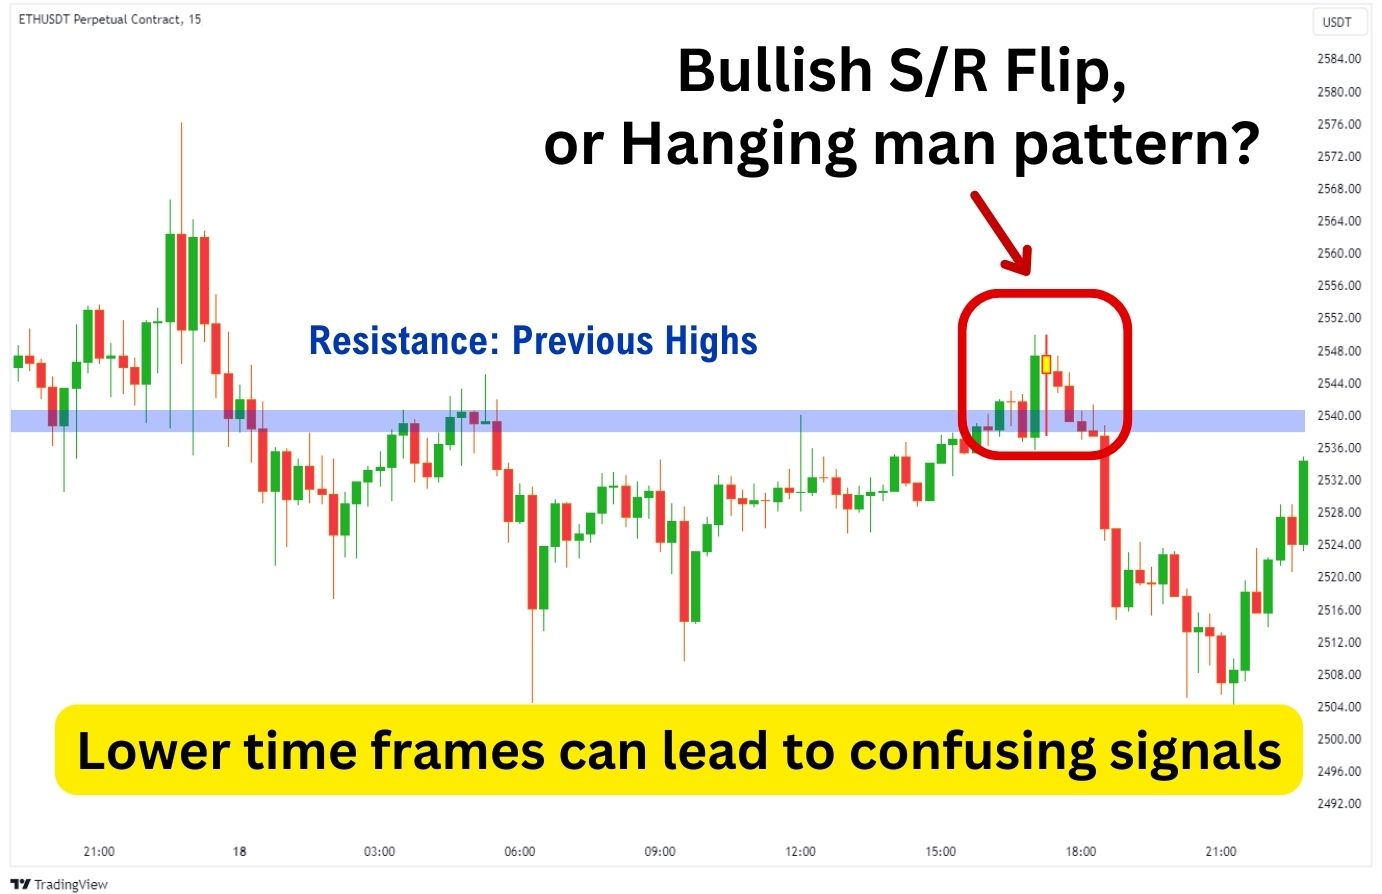
- Confusing Signals: On smaller time frames, the hanging man would wick down to a pivot level or support level, which then becomes a confusing signal between a hammer or hanging man pattern.
- Challenges with Timing: Price may not immediately reverse after a hanging man, and sometimes may even creep up higher before the trend reversal.
| Advantages | Disadvantages |
|---|---|
| Simple to recognise on the chart | Risk of being misinterpreted as a bullish pattern |
| Dual function as short entry and long exit signal | Confusing to recognise on lower time frames |
| Frequent signals on small time frames such as the 15-minute or lower | May not catch the exact top and result in a lot of choppiness before the reversal |
Best Indicators that Work Well with the Hanging Man
Detecting the hanging man pattern can sometimes feel like a chore, especially when you see a chart with a huge foray of candlesticks. Luckily, there are indicators dedicated to help you easily identify Japanese candlestick patterns, including the hanging man pattern, when they form.
One such indicator would be the Adaptive Candlesticks indicator from Trading Central, which is available for free when you sign up with Alchemy Markets.
Additionally, using oscillating indicators such as the RSI, and MFI, can provide you with extra context regarding the strength of the bearish signal projected by the hanging man pattern.
1. Candlestick Finder (Adaptive Candlesticks)
Using a candlestick finder or identifier can save you lots of time in searching for the right hanging man candlestick setups. These kinds of indicators point out the exact location of the hanging man candlestick on your charts, and can save you quite a bit of time.
For Alchemy Markets account holders, the premium candlestick finder is the “Adaptive Candlesticks” indicator for MetaTrader. This indicator is available for download once your account has been created.
2. ATR indicator (Average-True-Range)
In our ‘Sell the Rally Strategy’, we emphasise using the Average True Range (ATR) indicator for smarter stop loss (SL) placements. The ATR offers an objective approach, superior to traditional methods.
Setting your SL equal to or less than the ATR value often leads to early exits. This error is common when using the traditional SL placement above the hanging man candlestick. Therefore, we recommend placing your SL and take profit (TP) to at least twice the ATR value to prevent this common occurrence.
3. RSI indicator (Relative Strength Index)
When combined with the hanging man candlestick pattern, the RSI is a powerful indicator that can increase the strength of a bearish reversal when a bearish divergence is spotted. Typically, you would find this as the price is approaching a key resistance level, which is a prime location for a hanging man to form. We covered the specific strategy using RSI Divergences above in this article.
Common Hanging Man Pattern Mistakes to Note
Trading the hanging man pattern can be tricky, especially for newcomers to Japanese candlestick patterns. Though these patterns can be effective with the right amount of confluences, they can be rather fickle and prone to stop hunts when traded standalone. It’s because of this that many traders have a negative view of trading the hanging man pattern.
Here are some common mistakes made by traders when tackling the hanging man pattern:
- Not trading with a wide enough stop loss:
The hanging man pattern can be prone to wickouts. Therefore, it is recommended to place your stop loss to twice the ATR value, or over a nearby resistance level above the pattern.
- Not taking profit at pivot levels or key support:
One of the greatest allures of counter-trading the market is the potential massive gains if you manage to catch a macro-top. However, it’s important to take profit whenever you can, as the bearish reversal could simply be a small retracement, before continuing the macro bull trend. - Risking too much in the trade (More than 2% of account balance):
As with any trade, it’s not a good idea to risk more than 2% of your total account balance. With the hanging man pattern, it’s even more important to mind your risk management, as you are counter-trading the trend.
What are other Types of Candlestick besides Hanging Man?
The hanging man is just one pattern among the wide catalogue of Japanese candlestick patterns. Other patterns that traders find useful include the inverted hammer, shooting star, bearish engulfing, evening star, and hammer candlestick patterns.
You can see how this can quickly become confusing to a newcomer. That’s why the Adaptive Candlestick indicator referenced above is a great tool to alert you when one of the major patterns develops.
Hanging Man vs. Inverted Hanging Man
The inverted hanging man may refer to two separate patterns. When flipped vertically, an inverted hanging man would have a long upper shadow and a small candle body at the bottom of the candlestick. This pattern is recognised as either the “inverted hammer” or the “shooting star” pattern depending on where it forms within the trend.
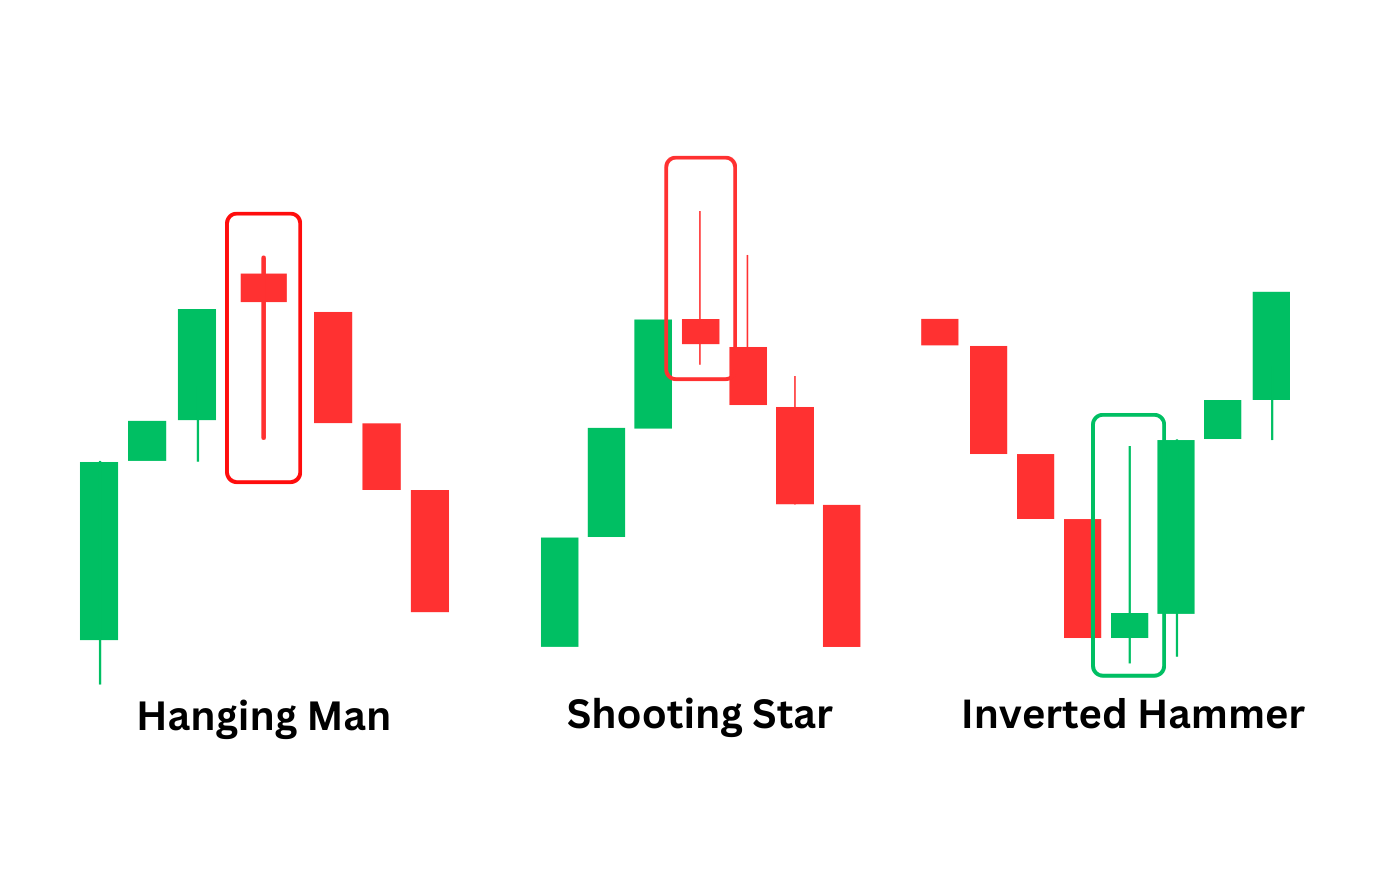
The inverted hammer candlestick pattern is a bullish reversal pattern that appears after an asset makes a price move lower. In contrast, the shooting star is a bearish reversal pattern, appearing after an asset makes a price move higher.
Hanging Man vs. Shooting Star
Both the hanging man and shooting star patterns are bearish reversal patterns, appearing near the top as the price climbs up. While the hanging man has a longer lower shadow, the shooting star has a longer upper shadow. Effectively, they are directly opposite in appearance, but share the same bearish sentiment as both patterns have formed as the price is making a move upwards.
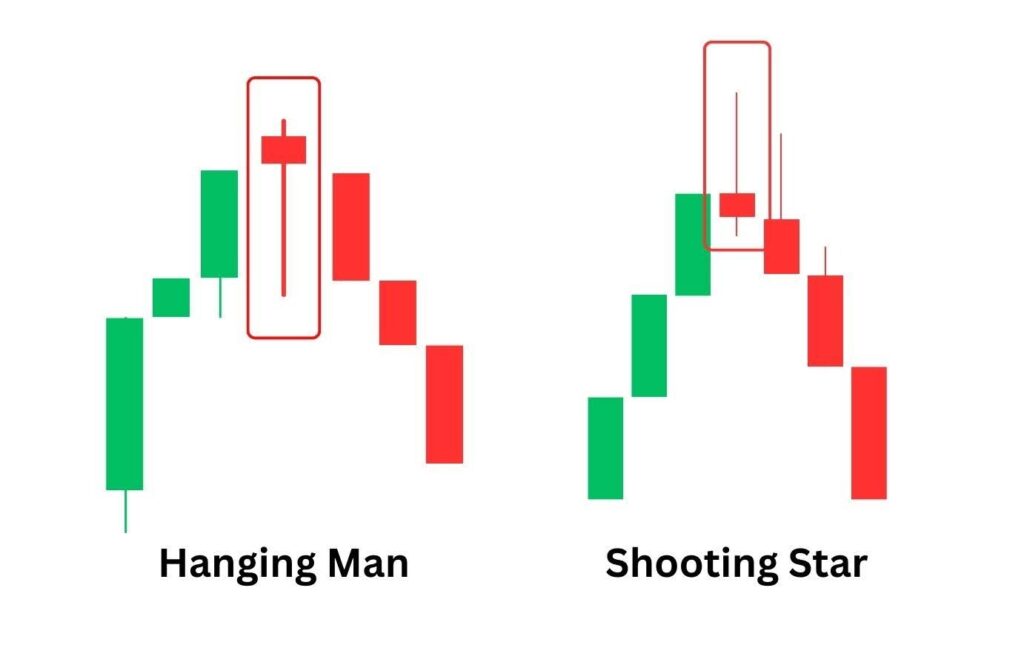
The validity of these patterns increases when they appear close to a resistance level, or when there is a bearish divergence between the price and an oscillator indicator such as the RSI, or MFI.
Hanging Man vs. Hammer
The hanging man pattern shares the identical shape of a hammer candlestick. Although they’re visually the shape exact pattern, they signal vastly different forecasts for the market.
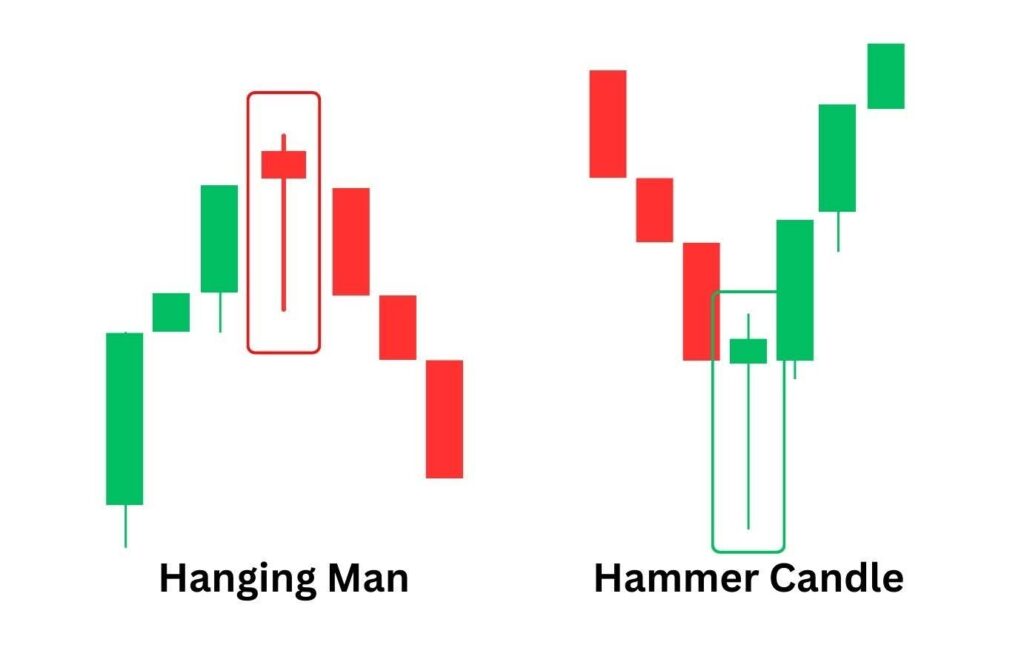
The hanging man is a bearish pattern, while the hammer acts as a bullish reversal pattern. This is because, unlike the hanging man candlestick, the hammer candlestick forms at the bottom of a price move lower.
Once again, context is everything in Japanese candlesticks charting. For the most part, a Japanese candlestick pattern is a reversal signal. If the pattern forms at the highs, we must be cautiously bearish. If the pattern forms at the lows (like the hammer candlestick), we must be cautiously bullish.
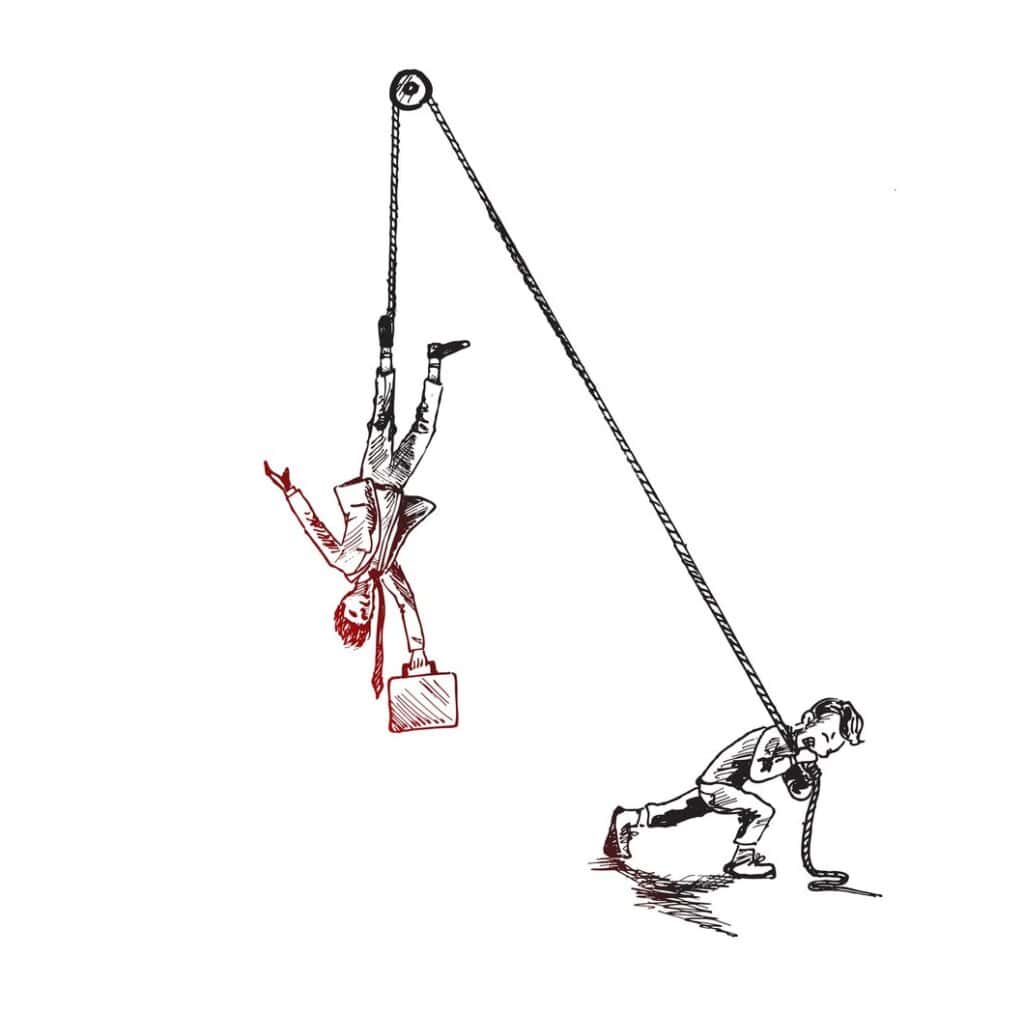
What is the Psychology behind the Hanging Man Candlestick Pattern?
A long lower shadow is formed when the hanging man reaches a critical resistance, or high in the chart. This signifies there is a lot more intent to sell, rather than to buy. The small upper shadow represents the buying intent from the market being quite low, compared to the long lower shadow.
Psychologically, it’s a sign that there are more sellers than buyers who are interested in stepping in and marking the price lower. However, a price drop does not always immediately play out after a hanging man’s formation. Sometimes, prices will wick and wack around this area, before moving drastically in a direction.
This is why we need to wait for a bearish confirmation candle that closes below the hanging man pattern, before entering a trade. This ensures us that there is bearish pressure present, and increases the odds of our hanging man trade playing out.
FAQ
Is a Hanging Man Pattern Bullish or Bearish?
The hanging man is a bearish pattern. This Japanese candlestick pattern appears after the price has made a move up, and signals an incoming bearish move to the downside.
How Reliable Is the Hanging Man Pattern?
The hanging man pattern’s reliability as a bearish reversal pattern is a point of contention. While there are traders who view the hanging man as a relatively weak bearish reversal pattern, our own backtests have shown the pattern to work 50% of the time. When applied with additional confluences such as resistance levels, and divergences, the hanging man pattern becomes a more consistent pattern to trade.
How often does the Hanging Man Candlestick Pattern occur?
The occurrence of the hanging man candlestick depends on which asset, and timeframe you are trading. In general, Japanese candlestick patterns tend to occur more frequently at lower timeframes, such as the 1H, 30-minute, 15-minute, and 1-minute time frames.
How Does the Hanging Man Correlate to Trend Reversal?
The candlestick structure of the hanging man can reveal a lot about the market psychology at a certain price. The long wick to the downside shows an increased interest to sell from the market, and the small upper candle body shows there is a decreased interest to buy. Combined together, these factors suggest an incoming trend change in the price movement.
Is there a difference between Red and Green Hanging Man?
A red hanging man and green hanging man candle imply different levels of bearishness at the top of a price move. When the candle is red, it means the price has opened at a higher price, but as the candlestick finished forming, it ended up at a lower price. This suggests greater bearish pressure compared to the green hanging man candle – where the price has opened at a lower price, but buyers successfully pushed it up to a higher closing price.
Overall, both candlestick patterns are still bearish indications in the chart. However, traders can use this understanding as an additional confluence to analyse whether they will enter a short trade, or stay on the sidelines for another better opportunity.
Is the hanging man the same as a doji?
No, the doji is a different pattern from the hanging man. The ideal doji should have no body while the hanging man will have a body that is more visible. The most comparable doji to the hanging man would be the long-legged doji or dragonfly doji where the open and close prices are near the top of the candle’s range.
Can the hanging man pattern be bullish?
The hanging man signals the previous uptrend is losing momentum by virtue of the long downward wick. If the same single-candle pattern appears after a downtrend, then it technically is not a hanging man, it would be a hammer pattern. Context within the larger trend is important for the hanging man.
What about a reversal hanging man?
An inverted hanging man pattern can refer to the shooting star, and the inverted hammer Japanese candlestick patterns. These patterns would have a long upper shadow and a small candle body placed near the bottom of the candlestick.
Although the shooting star and inverted hammer are identical in appearance, they are vastly different in what they forecast about the markets. The shooting star appears after the price moves up, and hints at price making a bearish reversal. Meanwhile, the inverted hammer appears after the price moves down, and hints at price making a bullish reversal.


