


Written by:

Reviewed by:

Bullish
- May 8, 2024
- 21 min read
Bullish Engulfing Pattern: A Strategy Guide
Struggling to spot trend reversals? The bullish engulfing pattern presents a solution.
In trading, such patterns can indicate a significant power shift from sellers to buyers, suggesting a potential reversal into an uptrend. This article breaks down how you can spot the bullish engulfing candlestick pattern, and how you can trade it.
Key Takeaways
- The bullish engulfing candlestick pattern indicates a potential bullish reversal after a downtrend.
- This pattern is most effective when it appears during a small downtrend, within a bigger uptrend.
- While this pattern has an approximate success rate of 55% in predicting trend reversals, it should be traded with a strategy for maximum effectiveness.
What Is a Bullish Engulfing Candlestick Pattern?
The bullish engulfing pattern is a two-candlestick pattern used by technical traders to predict a bullish reversal when the price is falling. It indicates that buying momentum has momentarily surpassed the selling pressure, and we could look for potential long-trade opportunities.
The pattern is quite reliable, usually resulting in a 55% chance of a further move up. It’s also easy to find and confirm, making it one of the more popular candlestick patterns to trade.
What Does a Bullish Engulfing Pattern Tell You

The bullish engulfing candlestick appears when the price of an asset falls, and then is bought back up again. This tells us two things about how the market is responding:
- Buyers were interested in buying the asset at low, discounted prices.
- Buyers were interested in buying at higher prices compared to yesterday’s average price range.
The occurrence hints at a possible trend reversal, where the price fall will be paused, and a price rise is anticipated in the next coming candles.
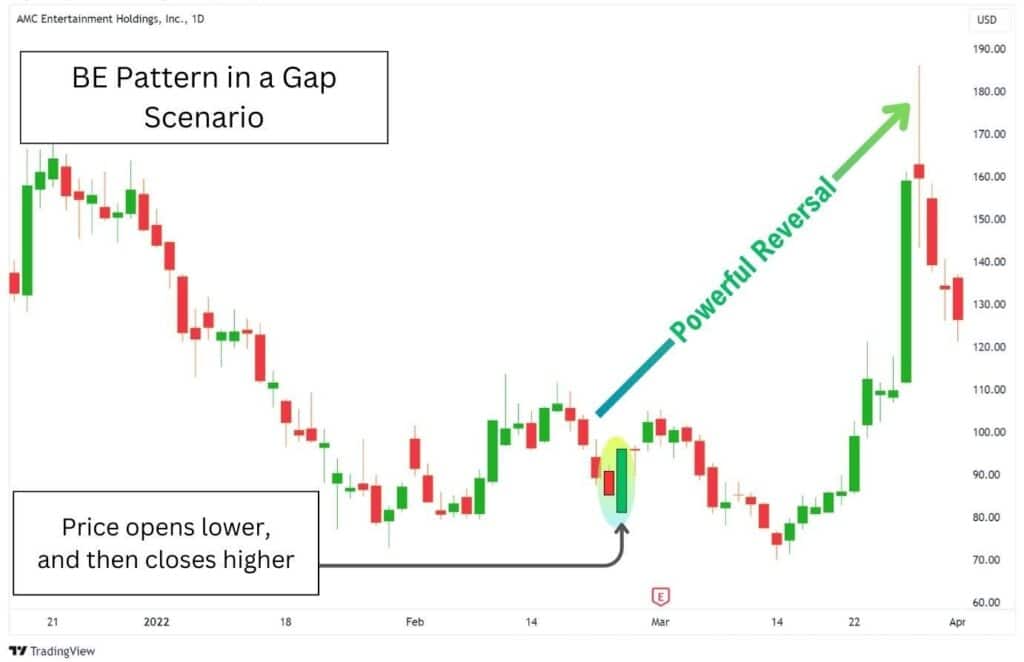
Sometimes, this pattern will be created with a price gap. This is also valid and indicates that a powerful reversal could occur.
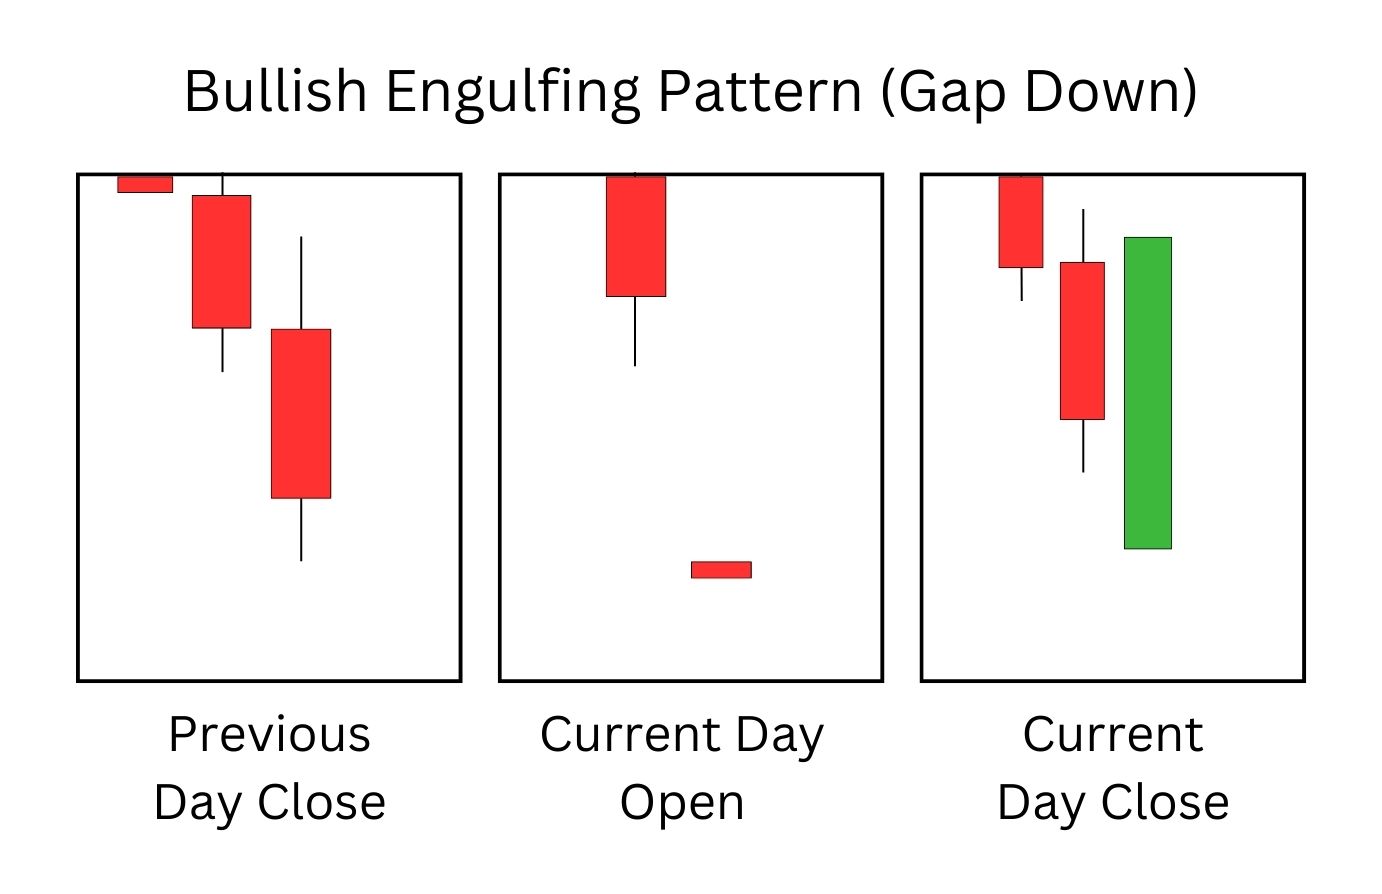
Consider the scenario above. An asset closes the previous day with a red candle. Then, as we enter a new trading day, the price opens much lower – creating a gap.
From here, the asset is bought back up until it completely engulfs its previous day’s candle. This represents that buyers are extremely interested in the asset, and therefore signals a bullish reversal.
Common Bullish Engulfing Pattern Scenarios
To get you acquainted with the idea of spotting a bullish engulfing candlestick pattern, here are four common scenarios where this pattern may form:
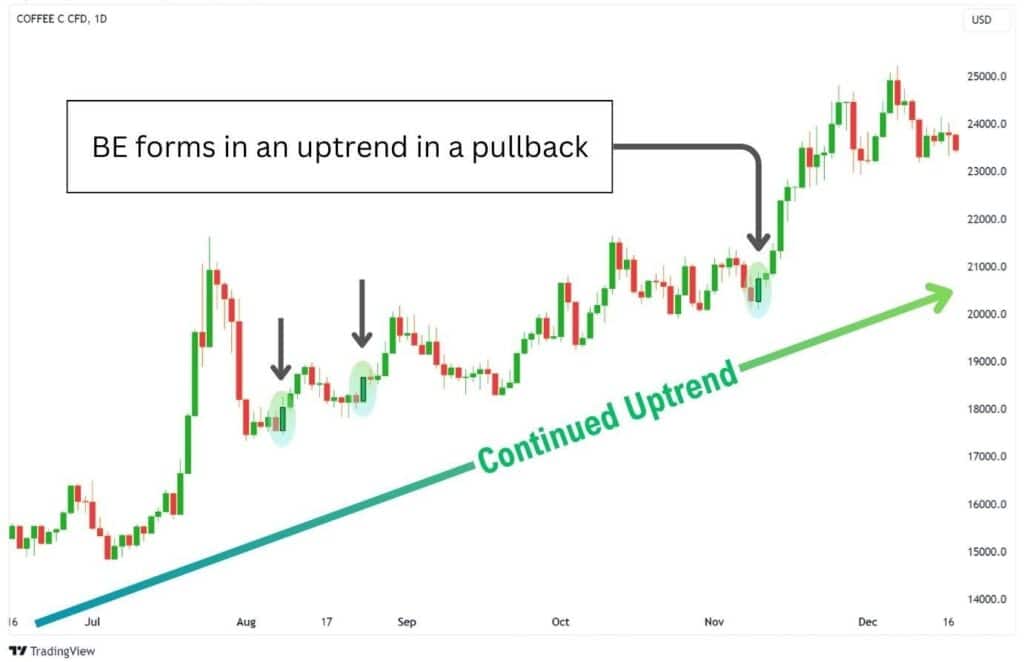
1. Continuation scenario: When the overall trend is up, and a minor pullback occurs. These signals are more reliable and usually lead to an uptrend continuation.
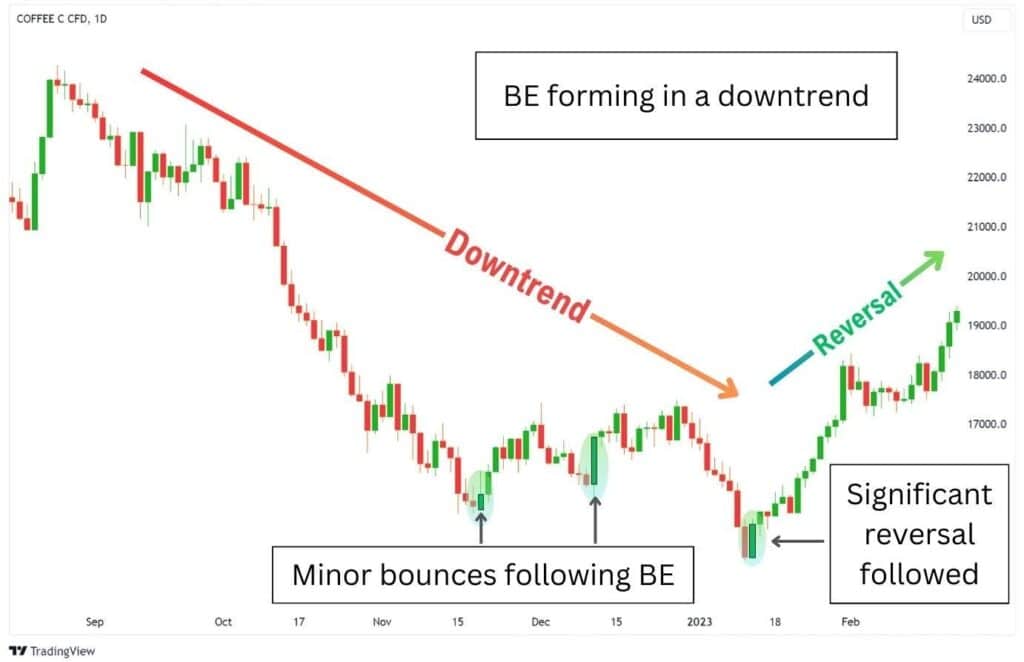
2. Reversal / weak bounce scenarios: When the overall trend is down, and the pattern forms. These signals tend to indicate a weak bounce, but can also lead to significant trend reversals.
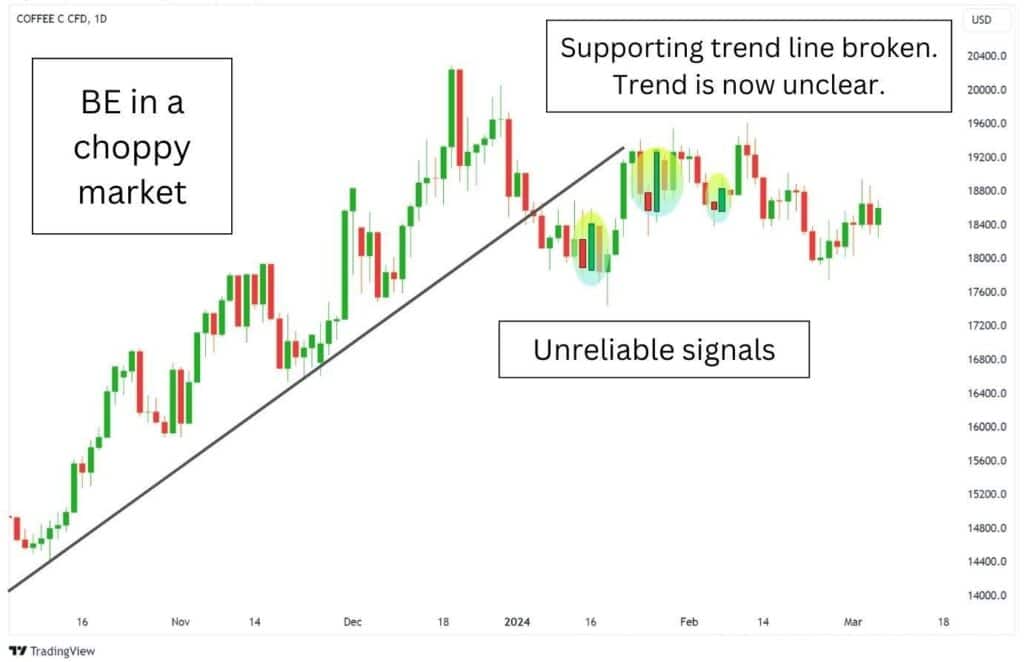
3. Weak signal: When appearing during a choppy market with no clear trend. These signals tend to be unreliable with mixed results.
4. Gap scenario: When appearing as a gap down, only to be bought back up during the day. This is typically very bullish and eventually leads to powerful reversals.
Key Characteristics of Bullish Engulfing Pattern
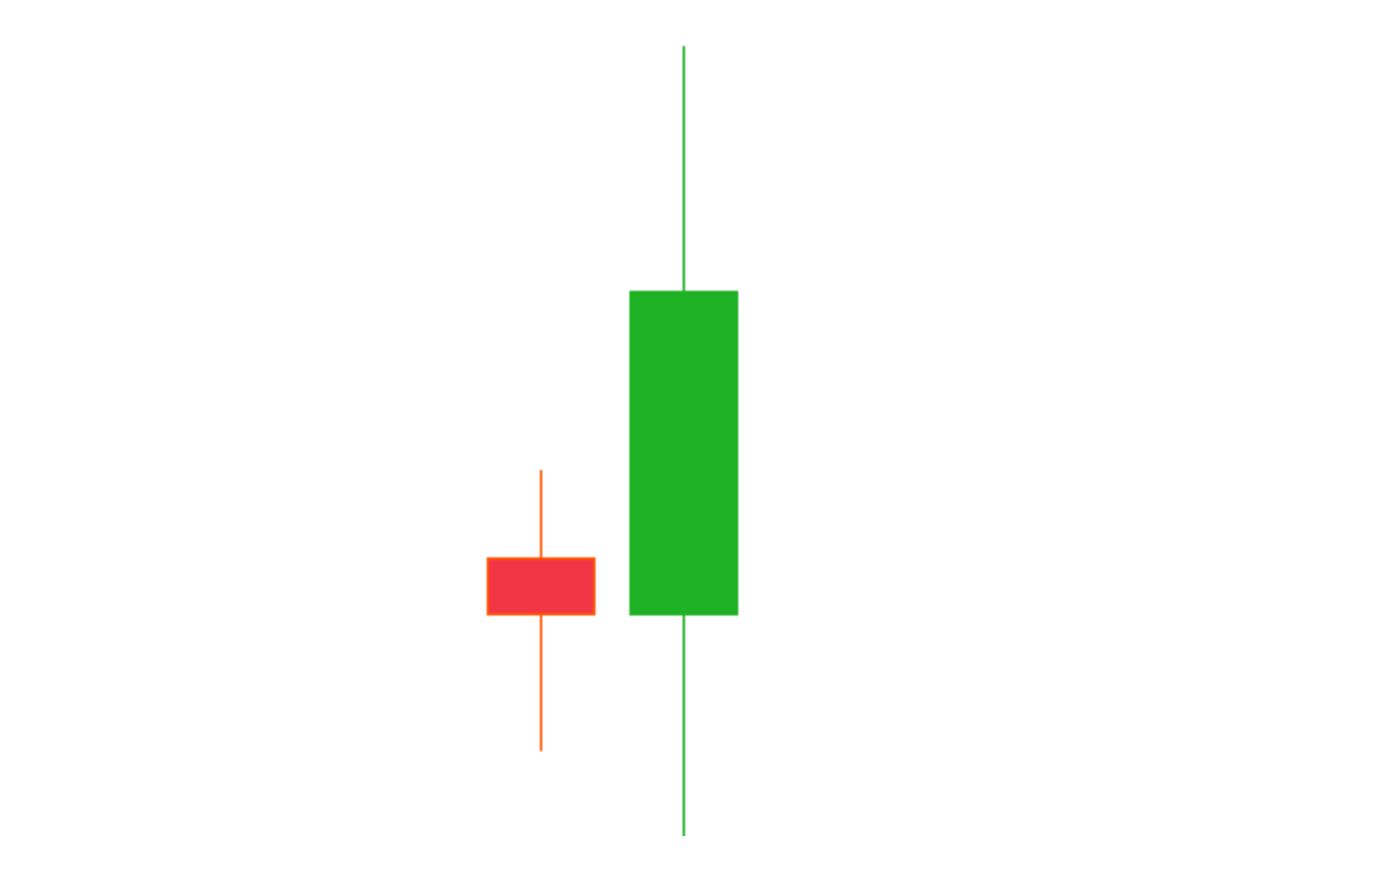
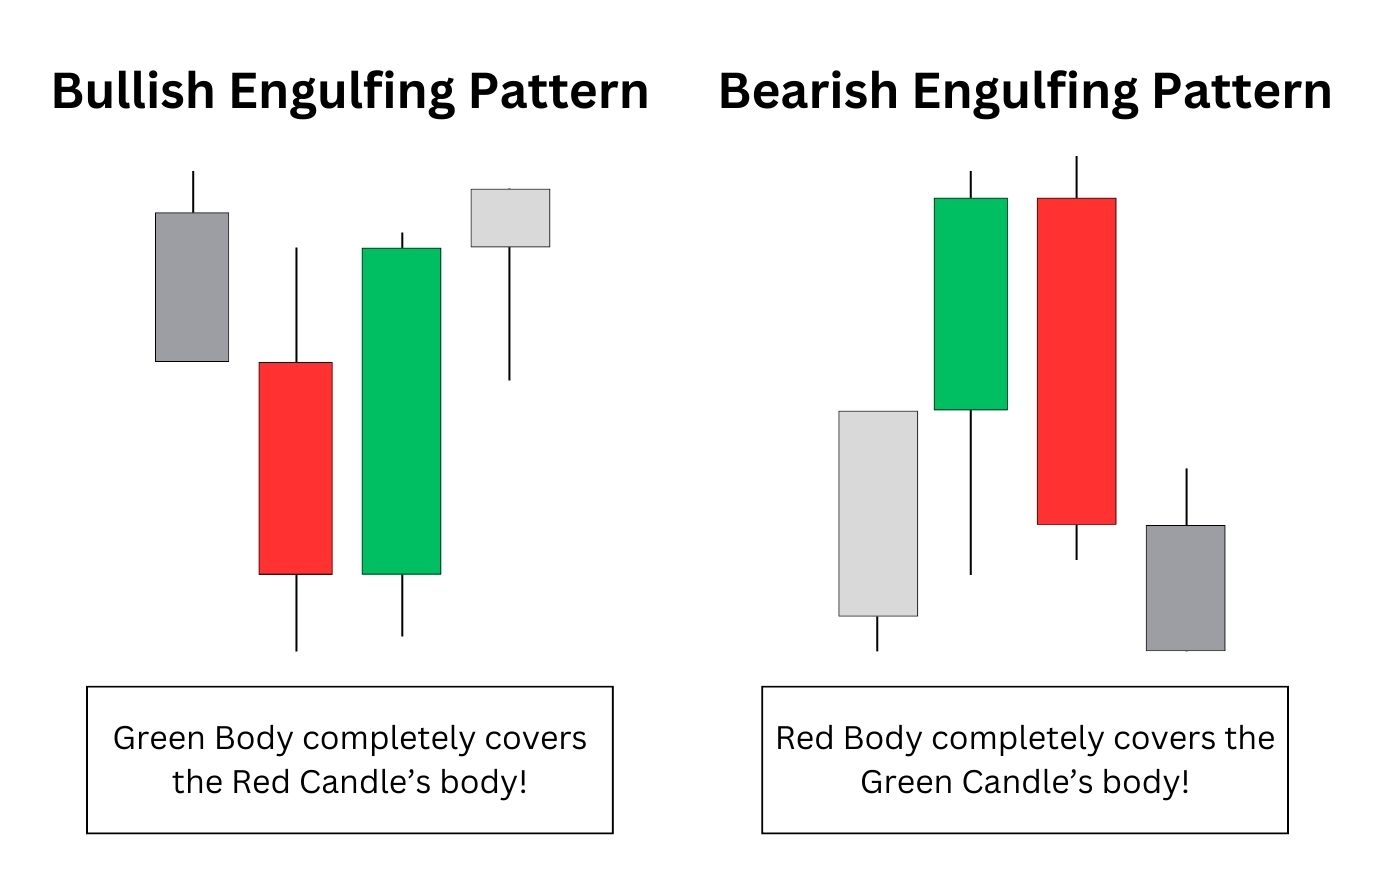
The bullish engulfing candlestick is simple to identify. Look for a smaller, initial bearish red candlestick, which is then followed by a larger, bullish green candle.
The green candle should have a larger body than the red candlestick. If you stacked both candles on top of each other, the green candlestick should completely cover the red. This does not include covering over the wicks.
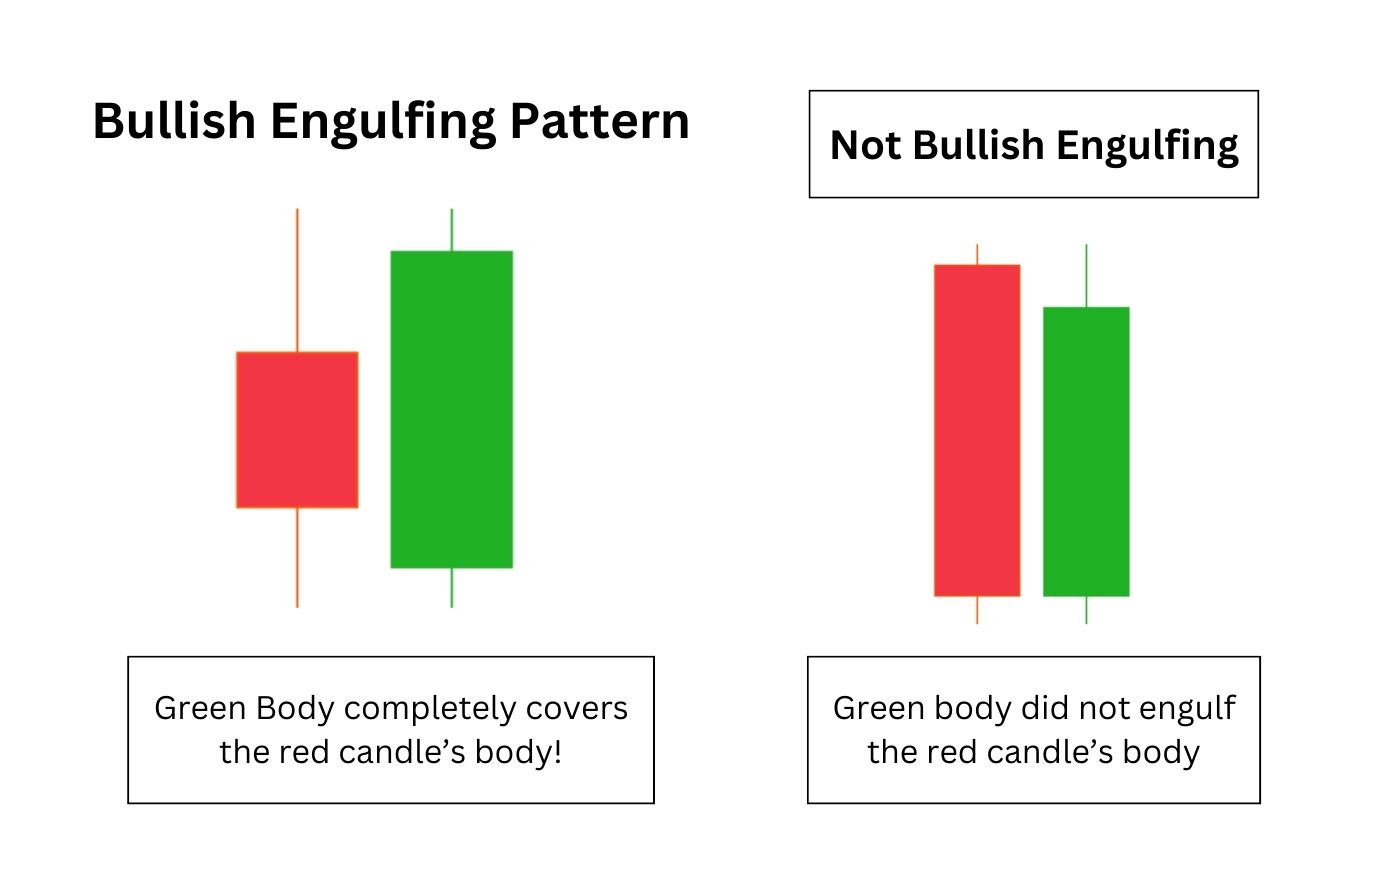
This pattern shows that buyers are now stepping in, and undoing the bearish pressure of the previous candlestick.
Importance of Bullish Engulfing Candlestick Pattern
Many traders are on a constant watch for reversals. They try to pick tops and bottoms, aiming to capture a major chunk of the new trend. The bullish engulfing candlestick pattern serves as a reliable marker for these trend reversals. It’s a way for market participants to leave a trail indicating a shift in sentiment from bearish to bullish. Primarily, this is the use case of a bullish engulfing candlestick pattern.
Secondarily, it’s also a great confirmation pattern that can pair with many trading systems.
For example, in a Fibonacci retracement trading system, traders often look for a bullish retest of the 618 level after a pump. It’s at this level we might notice a bullish engulfing candlestick pattern, which gives us the confidence to enter a trade.
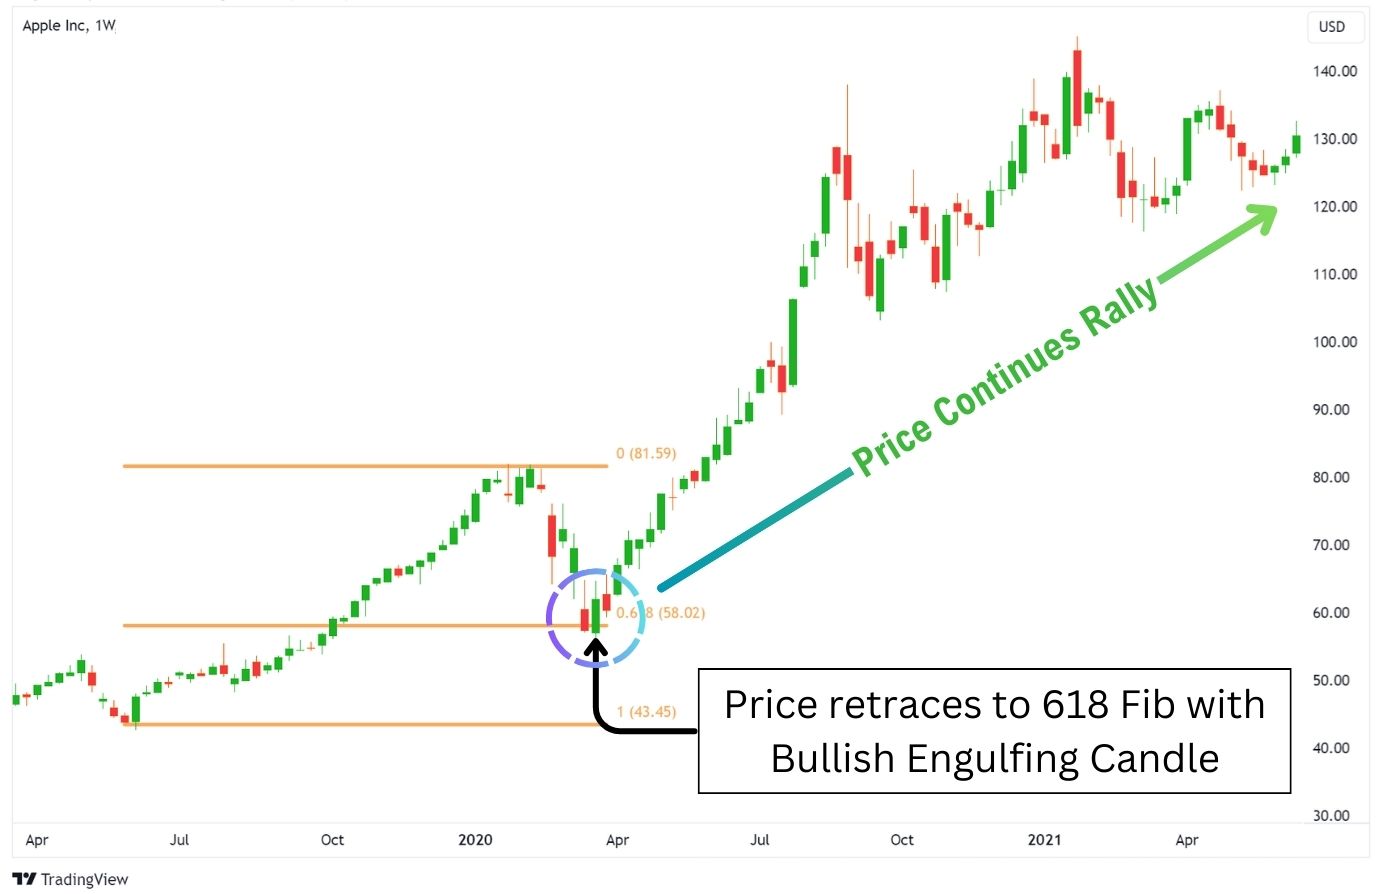
Notice how the bullish engulfing candlestick pattern, in this case, is a coincidental confirmation signal – as we would just be seeking some sort of rejection at the 618 level to enter a trade. Nevertheless, it was quite helpful to know about this pattern, so we can get more information about what’s happening in the charts.
Many more systems will coincidentally apply the bullish engulfing candlestick, such as the RSI divergence strategy. You get the picture.
Bullish Engulfing Pattern Example
We can often extract valuable insights just by looking at how a pattern plays out in the price charts. Let’s look at how the SPX behaved back in 2008 to 2009, following the housing crisis crash.
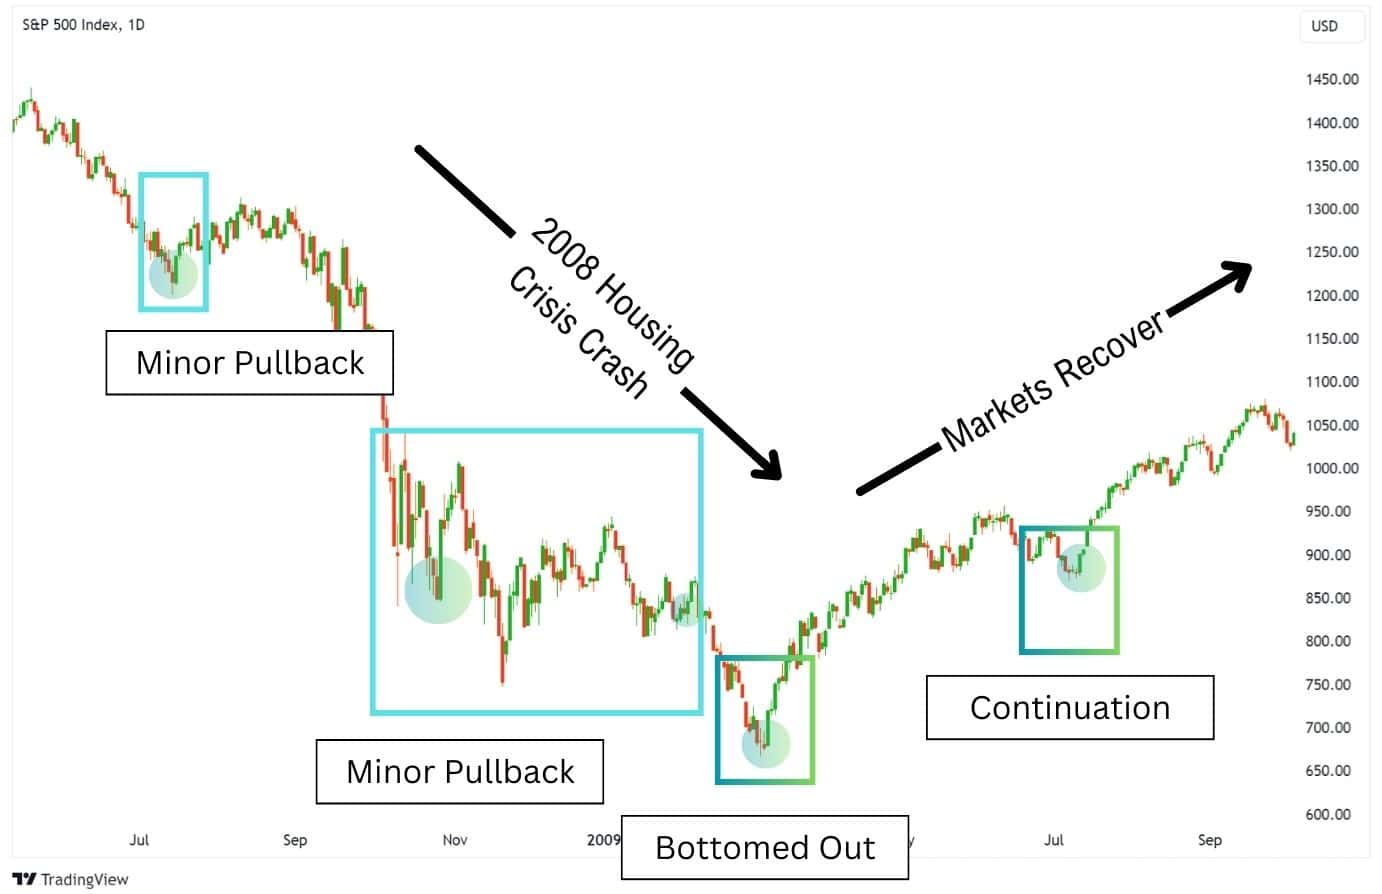
From looking at this example, we can see a few different instances of the bullish engulfing candlestick. Since each of them provides varying results, let’s break down what you can extrapolate from this data:
- When in a significant downtrend, the pattern only signals a temporary pause in the price fall, and a minor pullback.
- When it has truly bottomed out, the pattern did in fact cause a significant price rise, being able to challenge the previous highs. However, with the pattern alone, there was no way for us to know this would be the moment the markets turned.
- When the market found its footing in an uptrend, the bullish engulfing pattern signalled a strong continuation of a rally.
This is the thing about the bullish engulfing pattern. It doesn’t tell us how far the bullish move will go.
The key lessons you should take away from these examples are that:
- The bullish engulfing usually signals a bullish reversal, just not how extreme it will be.
- The pattern does not have a 100% chance of playing out.
- And that you should use additional factors to estimate how extreme the reversal will be.
Strategies to Trade the Bullish Engulfing Pattern
Trading the bullish engulfing candlestick involves more than just spotting the pattern on a price chart. It requires a combination of technical analysis tools and strategic placement of stop loss, and take profit areas to be profitable. Let’s delve into some of the strategies that can be used to trade the bullish engulfing pattern effectively.
We’ll explore how to trade the bullish engulfing pattern with these strategies:
- Horizontal support levels
- Trend line support
- Moving averages
- RSI divergence

Horizontal Support for the Engulfing Candlestick
One key strategy involves identifying bullish engulfing patterns that form around key support levels on the price chart. These levels, such as historical price points where the asset has previously halted its decline, can improve the effectiveness of the pattern in predicting trend reversals.
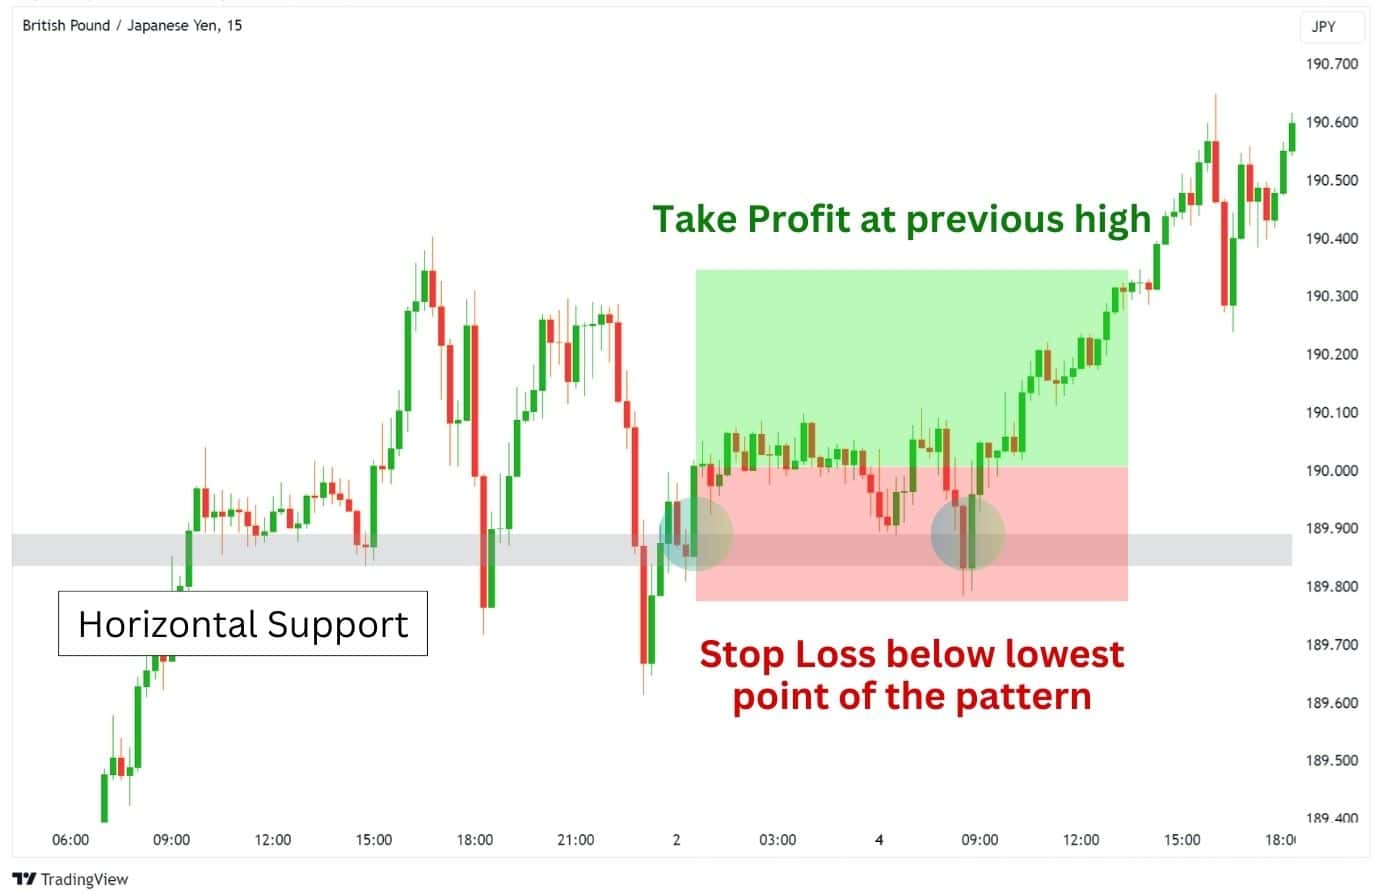
In our example of GBPJPY on the 15-minute timeframe, notice how the price has previously consolidated at the 189.900 level, then pushed up to around 190.350. This provides us with two horizontal levels to act as the Entry and the Take Profit Levels.
When a bullish engulfing candle forms at the horizontal support, we are given a viable entry into a long position, targeting the previous highs.
Here, we can set a risky, yet valid stop loss below the lowest of the bullish engulfing pattern (give it some room), and wait for our price targets to be hit.
The target is hit and we walk away with 310 pips in profits.
Using ATR to Improve the Strategy
Now, you may notice in our previous example how dangerously close the stop loss was to being taken out. This is a clear weakness in using the “eyeballing” approach to setting a stop loss.
To combat this weakness, you can opt to use the ATR (Average True Range) indicator. The ATR is fantastic for setting a stop loss because it informs you of an objective price point to safeguard against stop hunts.
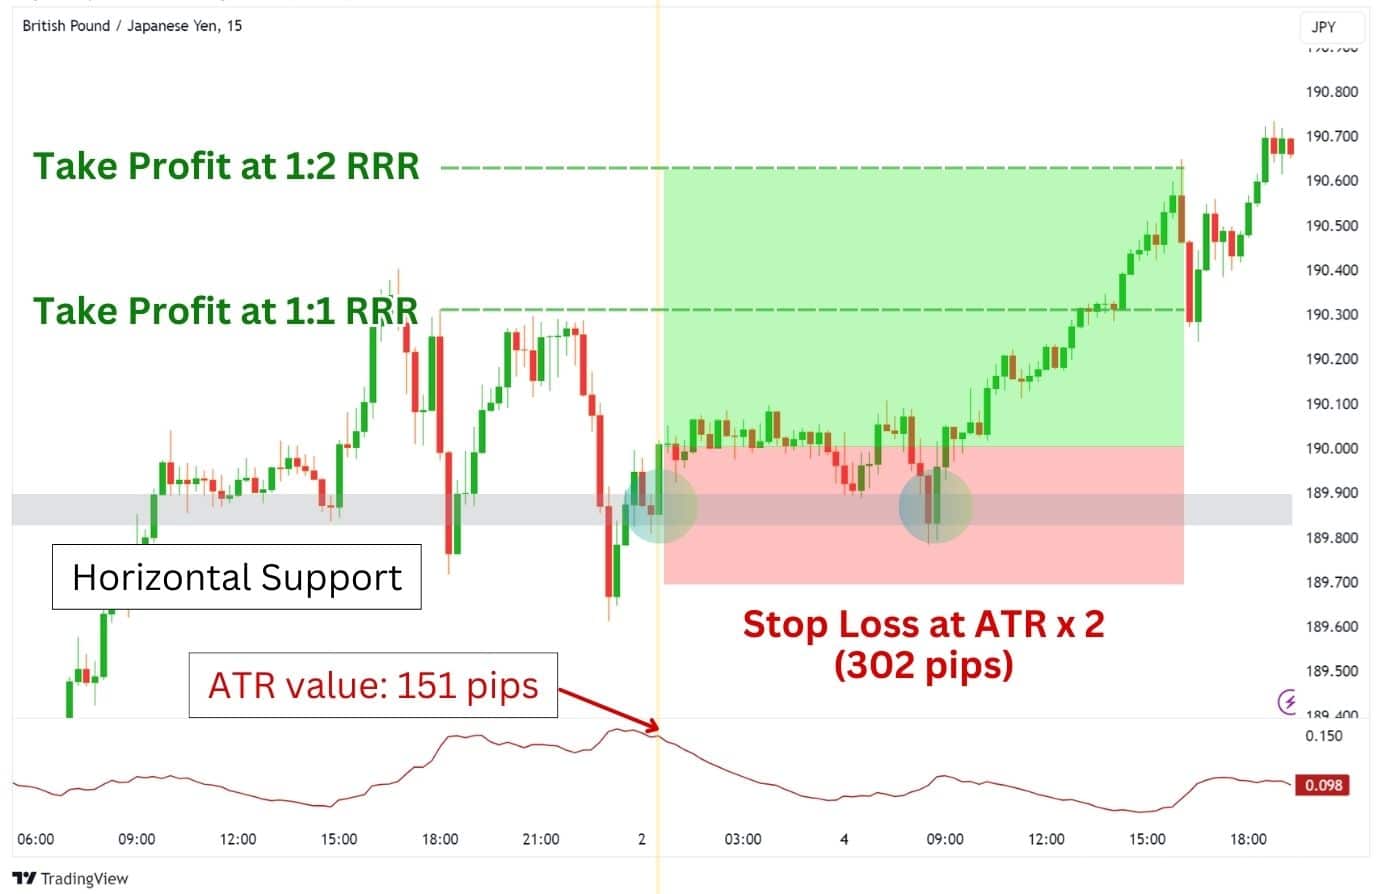
In this refined strategy, we can search for the same entry levels – a bullish engulfing pattern forming at a horizontal support. Our take profits can be at the previous highs, or set to 1:1 risk-to-reward, with 1:2 risk-to-reward being an extended target.
For the main part of this refined strategy, we can use the ATR indicator to tell us where the price is likely to move on average. Then, we’ll set our stop loss to the ATR value times 2, based on the entry candlestick, to avoid being stopped out.
The ATR value at the time of our entry was 151 pips, so our stop loss will be set 302 pips away.
Keep in mind that you can enhance each of the strategies we elaborate below by implementing the ATR indicator.
Trend Line Support Near the Engulfing Pattern
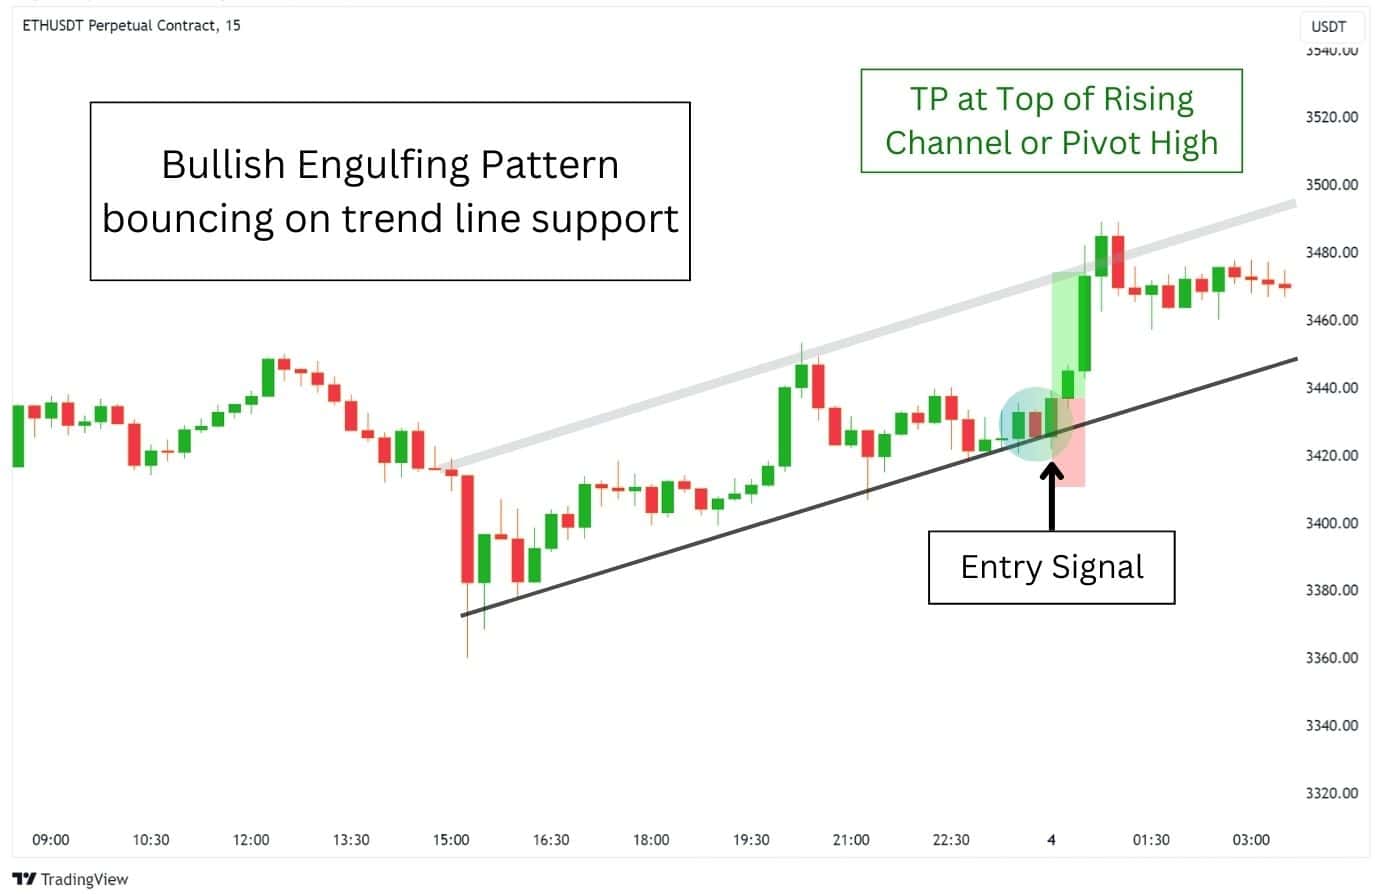
Another strategy you can combine with the bullish engulfing pattern is the trendline bounce strategy.
A trend line is a line drawn over pivot highs or under pivot lows to show the prevailing direction of price. Trend lines are a visual representation of support and resistance in any time frame. They show the direction and speed of price and also describe patterns during periods of price contraction. When the price retests or bounces off a trendline, we can expect a reversal.
Set the price targets at clear resistances in the chart, such as a pivot high or rising channel top. Alternatively, you can use your exits at distances equal to ATR x 2, or ATR x 3 (Stop loss and take profit).
Moving Average as a Bullish Engulfing Pattern Support
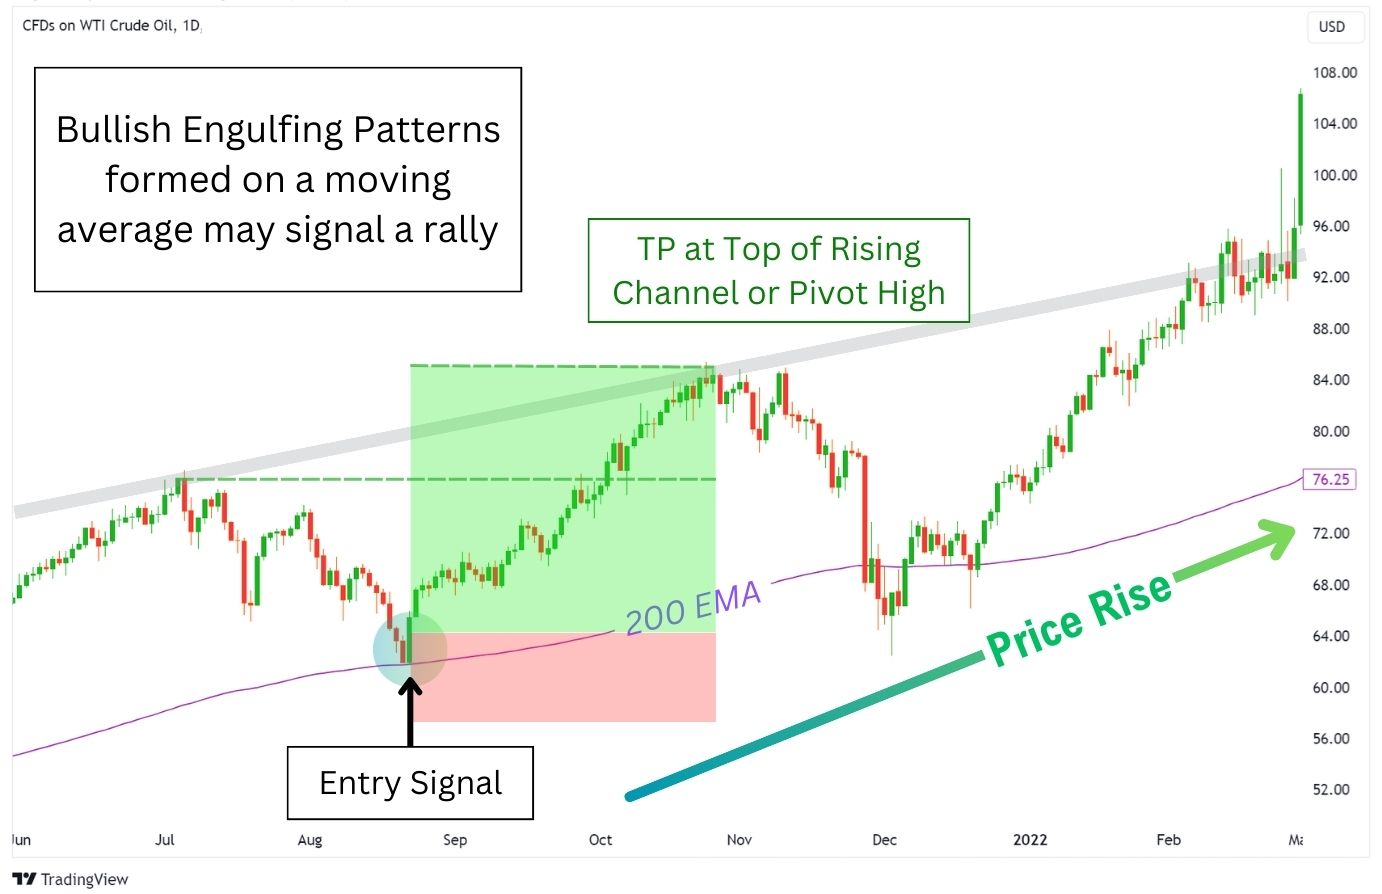
The use of moving averages is another strategy that can enhance the effectiveness of the bullish engulfing pattern. A bullish engulfing pattern that forms and closes above a moving average often signifies a stronger bullish move is coming.
In our example on WTI (Crude Oil), we see the price make a pullback to the 50 EMA and 200 EMA on the daily timeframe. From here, there were multiple instances where a bullish engulfing pattern formed after touching the EMA. This would act as an entry signal and usually takes the price higher.
Set the price targets at clear resistances in the chart, such as a pivot high or rising channel top. Alternatively, you can use your exits at distances equal to ATR x 2, or ATR x 3 (Stop loss and take profit).
RSI with the Bullish Engulfing Pattern
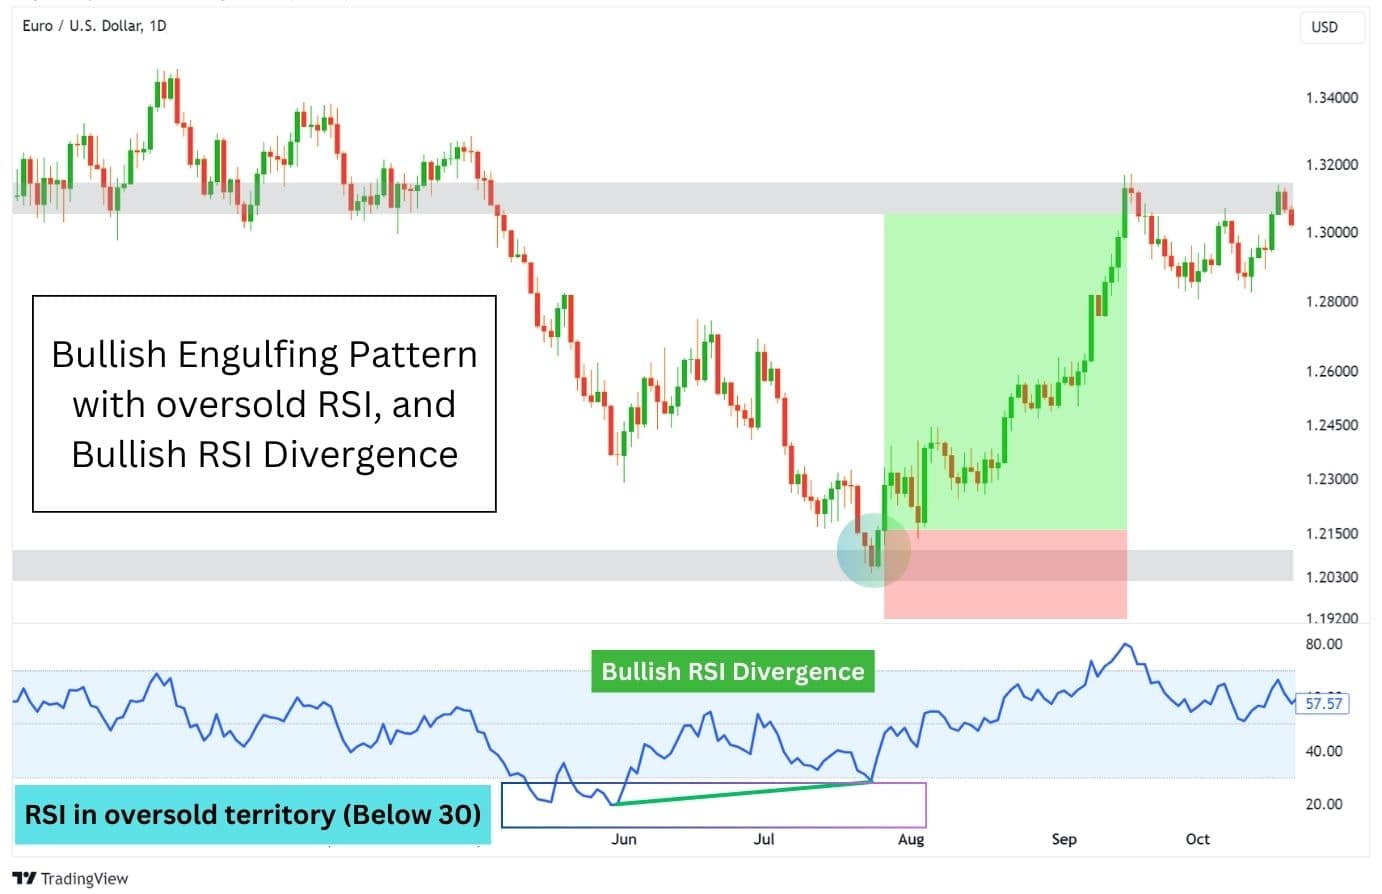
The use of the Relative Strength Index (RSI) can also enhance the effectiveness of the bullish engulfing pattern. The RSI is a momentum oscillator that measures the speed and change of price movements. It is used to identify overbought or oversold conditions in a market.
When the RSI is below 30, it indicates oversold conditions, and when it’s above 70, it indicates overbought conditions. When an asset is oversold, it usually is a great time to buy. A bullish engulfing pattern combined with an oversold RSI can signal a potential bullish trend reversal.
Additionally, we can pair this pattern with a bullish RSI divergence, which can lead to an even stronger reversal signal. This is reflected in our example on EURUSD 1D chart, where the price has fallen to a key support level with the aforementioned RSI conditions.
This led the price to reverse back up to a previous pivot level, now acting as resistance.
Using Volume with Bullish Engulfing Pattern

In the world of trading, volume speaks volumes. It represents the total amount of trading activity within a candlestick, which represents a period of time. A 1-hour candlestick represents 1 hour of trade data.
Typically, the higher the volume a candlestick produces, the more significant it is. When combining the two concepts, a bullish engulfing candlestick with high volume represents a higher likelihood of a reversal.
However, after our own examination, we found that volume may be less important for this candlestick pattern than traditionally thought. Volume can in fact cause us to miss long signals with the bullish engulfing candlestick during neutral or uptrends, and can also provide false signals in downtrends. Let’s explore this further with some examples.
Let’s look at case study 1 on Silver Spot.
We have several 1H bullish engulfing patterns with high volume, and one with low volume.
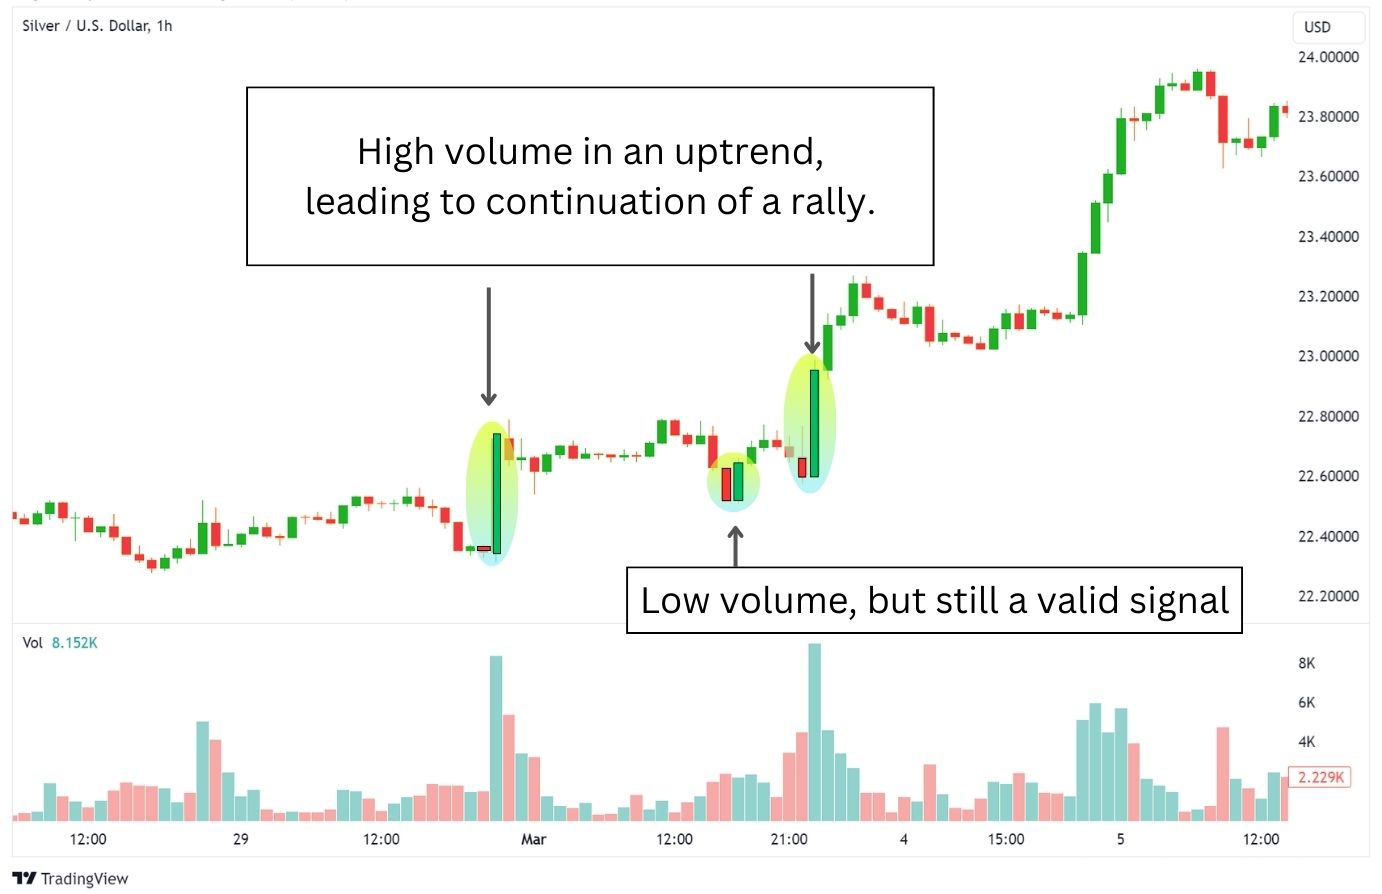
All these bullish engulfing patterns lead to the continuation of the uptrend, regardless of their volume. In fact, the first high-volume bullish engulfing candlestick provided a poorer entry, and arguably was a false signal because the price immediately retraced after its formation. Meanwhile, the lower volume pattern produced a better entry with no severe retracement.
So what can we take away from this observation?
Volume can still be a great confirmation to add to your trading of bullish engulfing patterns. However, we must keep in mind that if the bullish engulfing candlestick has pumped significantly, an immediate retrace may happen.
In such an instance, a lower volume bullish engulfing pattern does not invalidate the potential for a reversal in a greater uptrend. So, if we only took trades with a high-volume candle, we would have missed out on many valid reversal signals.
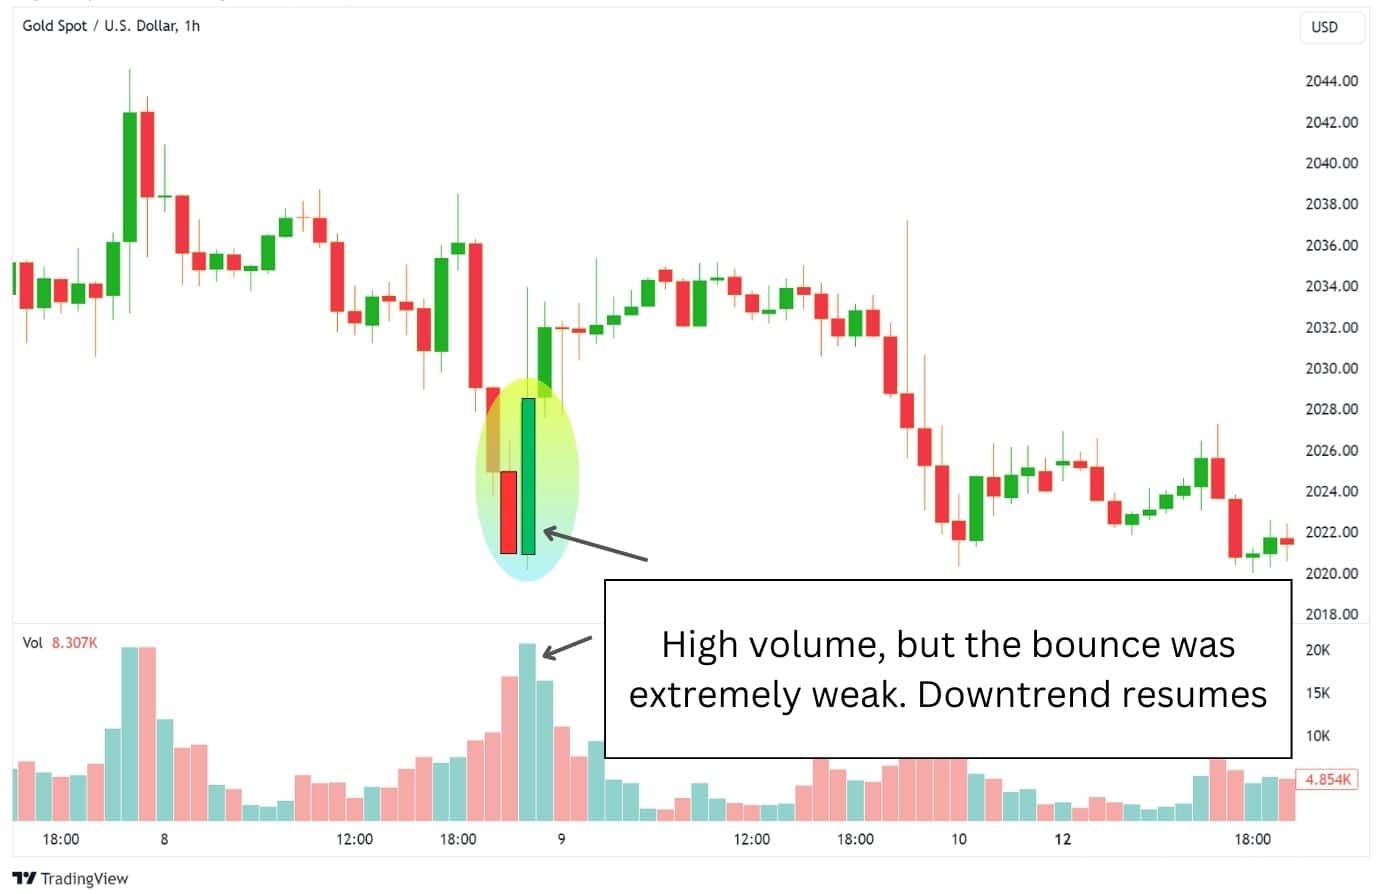
Let’s look at case study 2 on Gold Spot.
We have a single 1H bullish engulfing pattern with high volume.
However, the push-up from said reversal was insignificant. This shows that even though high volume can indicate a reversal, it is not always a strong reversal. In this case, Gold was in a downtrend, which typically results in weak reversals from the bullish engulfing candlestick.
All and all, volume can be used as an additional confirmation factor for a reversal. However, market structure appears to be the most important factor when trading this pattern.
Advantages of Trading on the Bullish Engulfing Pattern
Here are some key advantages of trading this pattern:
- It is easy to notice, thanks to its simplicity.
- It is a very effective reversal signal in an uptrend environment.
- It can be paired with most trading systems and act as a confirmation candle.
- According to external research, it has an above-average win rate of 55%.
Disadvantages of Trading on the Bullish Engulfing Pattern
Here are some key disadvantages of trading this pattern:
- It can provide many weak signals, especially during downtrends.
- It can provide poorly optimised entries, which often immediately results in a retracement.
- It does not signal how strong a reversal will be.
- It should not be traded by itself, requiring the use of indicators, market structures, and trading systems to support its effectiveness.
Bullish Engulfing Pattern vs. Bearish Engulfing Patterns
Just as a coin has two sides; the engulfing candlestick pattern has a bullish and bearish version. As the name suggests, the bearish engulfing pattern is a bearish reversal pattern.
Unlike the bullish version, the bearish engulfing pattern forms after an uptrend, and has a slightly different appearance.
Characteristics of Bearish Engulfing Patterns
The bearish engulfing pattern is identified by a second candlestick, which is bearish (black or red), that completely engulfs both the top and bottom of the first bullish (white or green) candlestick.
This pattern suggests a shift in control from buyers to sellers, often interpreted as a signal to enter a short position as it can indicate a market reversal following an uptrend.
Bullish Engulfing Pattern vs Bullish Harami Pattern
Like the bullish engulfing pattern, the bullish harami pattern is a bullish reversal pattern.
This pattern appears after a downtrend, and has a large initial red candle, with a smaller green pattern following it. Instead of a green engulfing candle, we have a red engulfing candle that appears before the green candlestick.
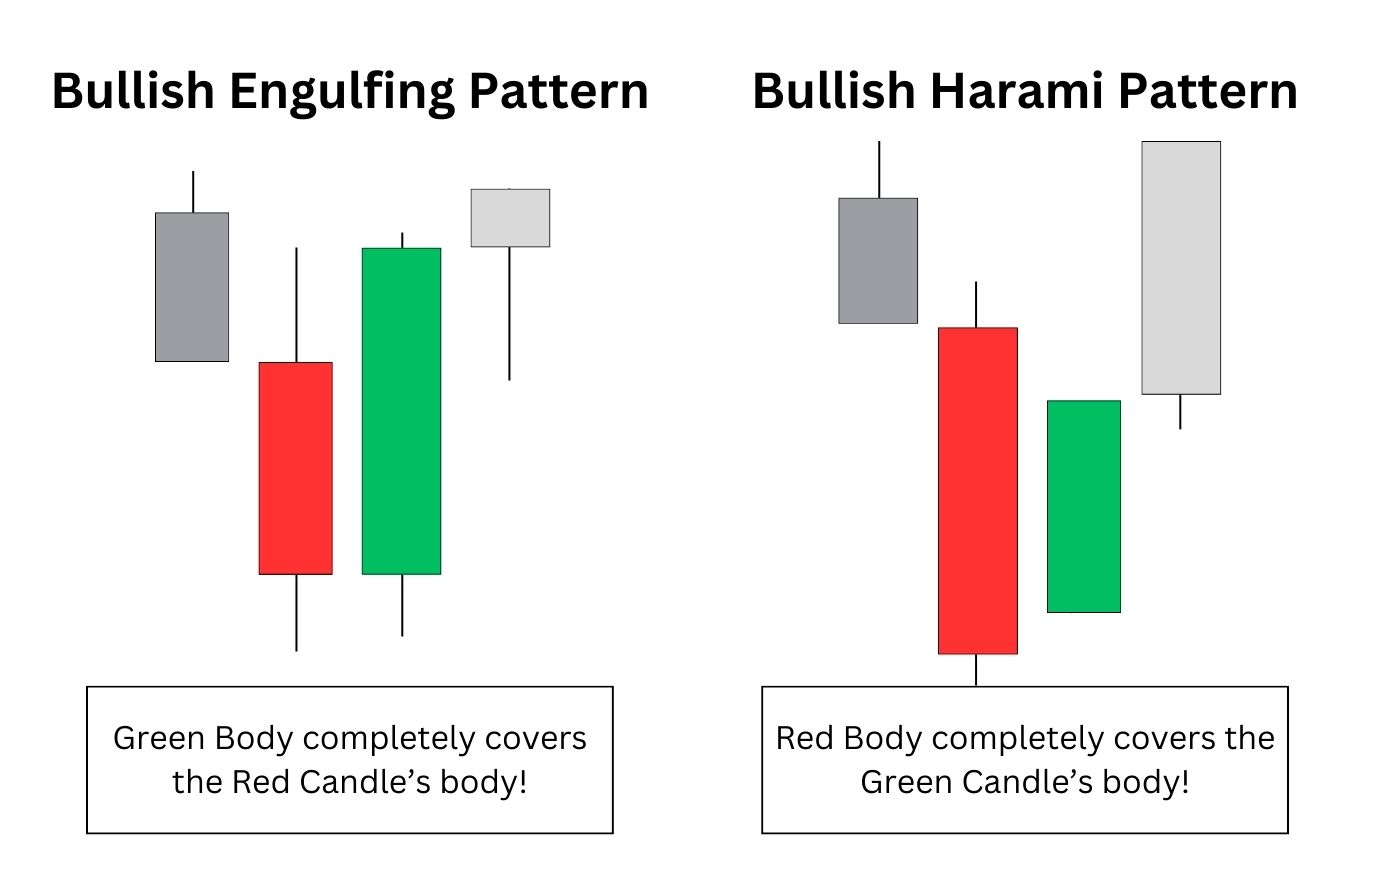
This pattern indicates that buyers have stepped in to push the price higher, and refused to let it close below the initial, powerful red candle. When formed at a key support level, the bullish harami pattern often means that the level is being respected, and we can potentially see a bounce.
Common Bullish Engulfing Pattern Mistakes to Watch Out For

When trading based on the bullish engulfing candlestick, it is important to avoid the following mistakes:
- Trading based on the pattern alone – this is risky as the win rate is only 55%.
- Ignoring the overall market trend – a downtrend usually creates weak bounces.
- Ignoring the volatility conditions – a choppy market can create unreliable signals.
- Not trading the pattern with a key support level, which gives the pattern more significance.
- Not using other confluences, such as moving averages, RSI, trendlines, or Fibonacci levels etc.
It’s important to remember that the bullish engulfing candlestick isn’t a 100% indication of a reversal. An asset’s price can also dip even lower, despite the bullish pattern, before truly pivoting back up.
A bullish engulfing pattern should preferably be traded when it forms at key levels, or with additional confluences like a RSI divergence.
Is Bullish Engulfing Pattern Reliable?
Although the win rate of a bullish engulfing pattern is recorded at 55% by researchers such as Liberated Stock Trader, the win rate can be improved when traded with additional indicators.

However, like all candlestick patterns, it can provide false signals or less optimal trade entries. Therefore, it’s advisable to trade this pattern with additional supporting factors – this can be a full-fledged trading system, an indicator, or arguably the most important: an understanding of market structure.
When combined with other technical analysis tools, the bullish engulfing candlestick shines as a reliable signal to enter a long position.
How to Improve Bullish Engulfing Candlestick Accuracy?
The accuracy of the bullish engulfing candlestick can be improved drastically when traded on key support levels, and also when other technical analysis confluences are applied.
These confluences can include but are not limited to:
- Key support levels
- Fibonacci levels
- Trend line support
- Classic chart patterns
- Trend indicators like Moving Averages
- Momentum indicators like the RSI or MACD
Additionally, adopting proper risk management techniques can also improve the bullish engulfing pattern’s accuracy – especially when it comes to setting a stop loss to avoid premature exits. One method that comes to mind is to use the ATR indicator, or the Chandelier Exit indicator.
How Do Bullish Engulfing Patterns Indicate Reversals in the Market?
Bullish engulfing patterns are a key indicator of potential reversals in the market. They signal a change in market sentiment with bulls taking control from the bears.
This power shift is reflected in the structure of the bullish engulfing pattern, where:
- A small bearish candle is followed by a larger bullish candle that completely engulfs the body of the previous candle.
- The pattern is particularly significant when it occurs after a prolonged downtrend.
- It is accompanied by a higher trading volume on the day of the engulfing candle.
However, while a bullish engulfing pattern can be a strong indicator of a potential trend reversal, it’s important to remember that it doesn’t guarantee the reversal. The pattern is a signal, not a certainty.
Can a bullish engulfing pattern occur in both uptrends and downtrends?
Yes, a bullish engulfing candlestick can occur as the price is moving up, or as it is moving down. However, it is generally considered a more valid reversal pattern when it forms as the price is falling.
If the bullish engulfing candlestick forms while the previous few candles are already trending up, it may not hold much significance. However, in the context of a pullback during a larger uptrend, the bullish engulfing pattern holds significant weight, and often leads to strong continuations.
Can the Bullish Engulfing Pattern be used in Scalping or Short Term Trading Strategies?
The versatility of the bullish engulfing candlestick makes it a viable tool for various trading strategies, including scalping and short-term trading.
Does the colour of Bullish Engulfing Candlestick Patterns matter?
In technical analysis, the colour of candlesticks is more than just visual appeal; it carries significant information about the market’s sentiment.
In the case of the bullish engulfing candlestick, the colour of the candlesticks plays a crucial role in its formation and interpretation. The pattern consists of a smaller bearish (red or black) candle followed by a larger bullish (green or white) candle. The colour of the second candle signifies a reversal in trend direction from down to up, indicating a shift in control from bears to bulls.
Is Bullish Engulfing Candlestick Profitable?
The bullish engulfing candlestick pattern by itself has a win rate of 55%. However, its success rate can be improved when combine with other technical analysis tools. Its profitability will largely depend on how you trade the pattern using your strategies.
Is Bullish Engulfing Candlestick a Double Candlestick Pattern?
The bullish engulfing candlestick pattern is a type of double candlestick pattern as it’s made up of only two candlesticks.
When is the best time to Trade using Bullish Engulfing Pattern?
The bullish engulfing pattern is best traded on larger time frames as it indicates more significant buyer interest. It’s also more effective when traded at a support level, which could be a historical level, trend line, or Fibonacci level etc.
During broader uptrends, pullbacks that form a bullish engulfing pattern are also more likely to play out. Whereas in broader downtrends or choppy market environments, the bullish engulfing pattern may not be as reliable to trade.
Who first identified the Bullish Engulfing pattern?
The origins of the bullish engulfing pattern, like many other candlestick patterns, can be traced back to 18th-century Japan. A Japanese rice trader named Homma is often credited with developing candlestick charting, which forms the basis for modern technical analysis.
Homma reportedly used this method to analyse the emotions and psychology of traders, helping him predict future price movements in the rice market.
Over centuries, this charting method has been refined, leading to the discovery of new patterns, including the bullish engulfing pattern. Today, these patterns are globally used by traders and investors, serving as a testament to Homma’s pioneering work in the field of technical analysis.
How often does the Bullish Engulfing Pattern happen?
The frequency of bullish engulfing patterns can vary depending on the market conditions and the timeframe being analysed.
In volatile markets, where price movements are large and frequent, bullish engulfing patterns may occur more often. Conversely, in more stable markets, these patterns may be less common.
In a nutshell…
The bullish engulfing candlestick pattern is a powerful tool you should add to your trading bag of tricks. While it may not always guarantee a reversal, the candle serves well as a confirmation candle in many trading systems.
Its simplicity makes it a popular choice among traders of all levels, and its versatility allows it to be applied to any asset, and time frame.
Frequently Asked Questions
What is a bullish engulfing pattern?
A bullish engulfing pattern is a two-candlestick reversal pattern, where a small red (or black) candlestick is followed by a large green (or white) candlestick that completely engulfs the body of the previous day’s candlestick. It appears in a downtrend and indicates a potential reversal.
Is the bullish engulfing pattern reliable?
Yes, the bullish engulfing pattern is considered relatively reliable, especially when used in conjunction with other indicators. It tells us that bulls are taking over after a period of bearishness.
How do you confirm bullish engulfing?
To confirm a bullish engulfing pattern, look for an obvious downtrend, a small red candle at the bottom of the trend, and a subsequent green candle that completely covers the body of the red candle. Wait for the green candle stick to close to confirm the pattern.
What is the psychology behind the bullish engulfing pattern?
The bullish engulfing pattern reflects a surge in buying pressure at key levels, leading to an increase in trade volume and a strong bullish candle that engulfs the previous one. This tells us that buyers are willing to buy during bearish conditions, and also buy at a higher price compared to the previous candlestick.
How can I improve the accuracy of bullish engulfing patterns in my trading?
To improve the accuracy of bullish engulfing patterns in your trading, consider using them alongside other technical analysis tools, implementing effective risk management, and taking the overall market context into account. These steps can enhance the reliability of your trading decisions.


