


Written by:

Reviewed by:

Bearish
- February 11, 2026
- 30 min read
33 Bearish Candlestick Patterns Traders Use
What is a Bearish Candlestick Pattern?
A bearish candlestick pattern shows how price reacts at key points in the market. The shape of each candle gives traders insight into selling pressure, sentiment, and the potential for trend reversal.
These formations may appear as a single candlestick or as a sequence of candles that form a broader structure.
Candlestick patterns form in both rising and falling markets. They fall into two broad categories:
- Bullish and bearish
- Reversal and continuation
Bearish reversal patterns signal that upward momentum may be weakening, while continuation patterns suggest an existing downtrend is likely to continue. Bullish formations tend to predict the opposite.
Many patterns may look similar at first glance, but their bodies, shadows, and colour reveal key differences.
This guide focuses specifically on bearish candlestick patterns, so you can identify when a bullish move is running out of steam, or when bearish momentum is developing.
Factors to Consider When Trading Bearish Candlestick Patterns
Volume Adds Conviction
A bearish pattern is more reliable when it’s backed by strong volume. If a reversal pattern forms but trading volume is low, it may be a weak signal. Higher volume confirms that more traders are participating, making the move more trustworthy.
Patterns Should Be Combined With Other Indicators
No single pattern is enough to make a trade decision. Adding technical indicators helps filter out false signals and improves accuracy.
- MACD (Moving Average Convergence Divergence): If the MACD histogram turns negative or the MACD line crosses below the signal line, it strengthens the bearish case.
- Bollinger Bands®: A bearish pattern forming near the upper band suggests an overbought market, increasing the chances of a price drop.
- VWAP (Volume Weighted Average Price): If the price is above VWAP but a bearish pattern forms, a drop below VWAP can confirm weakness.
- Stochastic Oscillator: A high stochastic reading (above 80) with a bearish pattern hints at a potential reversal from overbought conditions.
- RSI (Relative Strength Index): If RSI is above 70 and a bearish candlestick pattern appears, price exhaustion is likely.
Support and Resistance Levels
A bearish pattern is more meaningful when it appears near a strong resistance level. If the price repeatedly fails to break a given level and a bearish formation appears, sellers could take control.
Trends Matter
A bearish pattern forming within a downtrend is a confirmation of the trend. On the other hand, a bearish pattern appearing in an uptrend could signal a larger bearish reversal. Always check the bigger picture before acting on a signal.
Context Matters
Market conditions influence how well a pattern works. In volatile markets, reversals may be short-lived, while in steady trends, patterns hold more weight. News events, which mostly contain short-term volatility, can temporarily override bearish technical signals.
Patterns Are NOT Guaranteed to Work Every Time
No pattern is foolproof. False signals happen, which is why risk management is crucial. Stop-loss orders and proper position sizing help protect against unexpected moves.
Bearish Candlestick Patterns Cheat Sheet
Mastering bearish setups is easier with a quick reference guide you can keep at your fingertips. Our bearish candlestick patterns PDF combines the most reliable reversal signals into a clear, actionable guide for your reference.
Whether you’re new to trading or refining your strategy, you can grab this bearish candlestick patterns free resource to sharpen your edge.
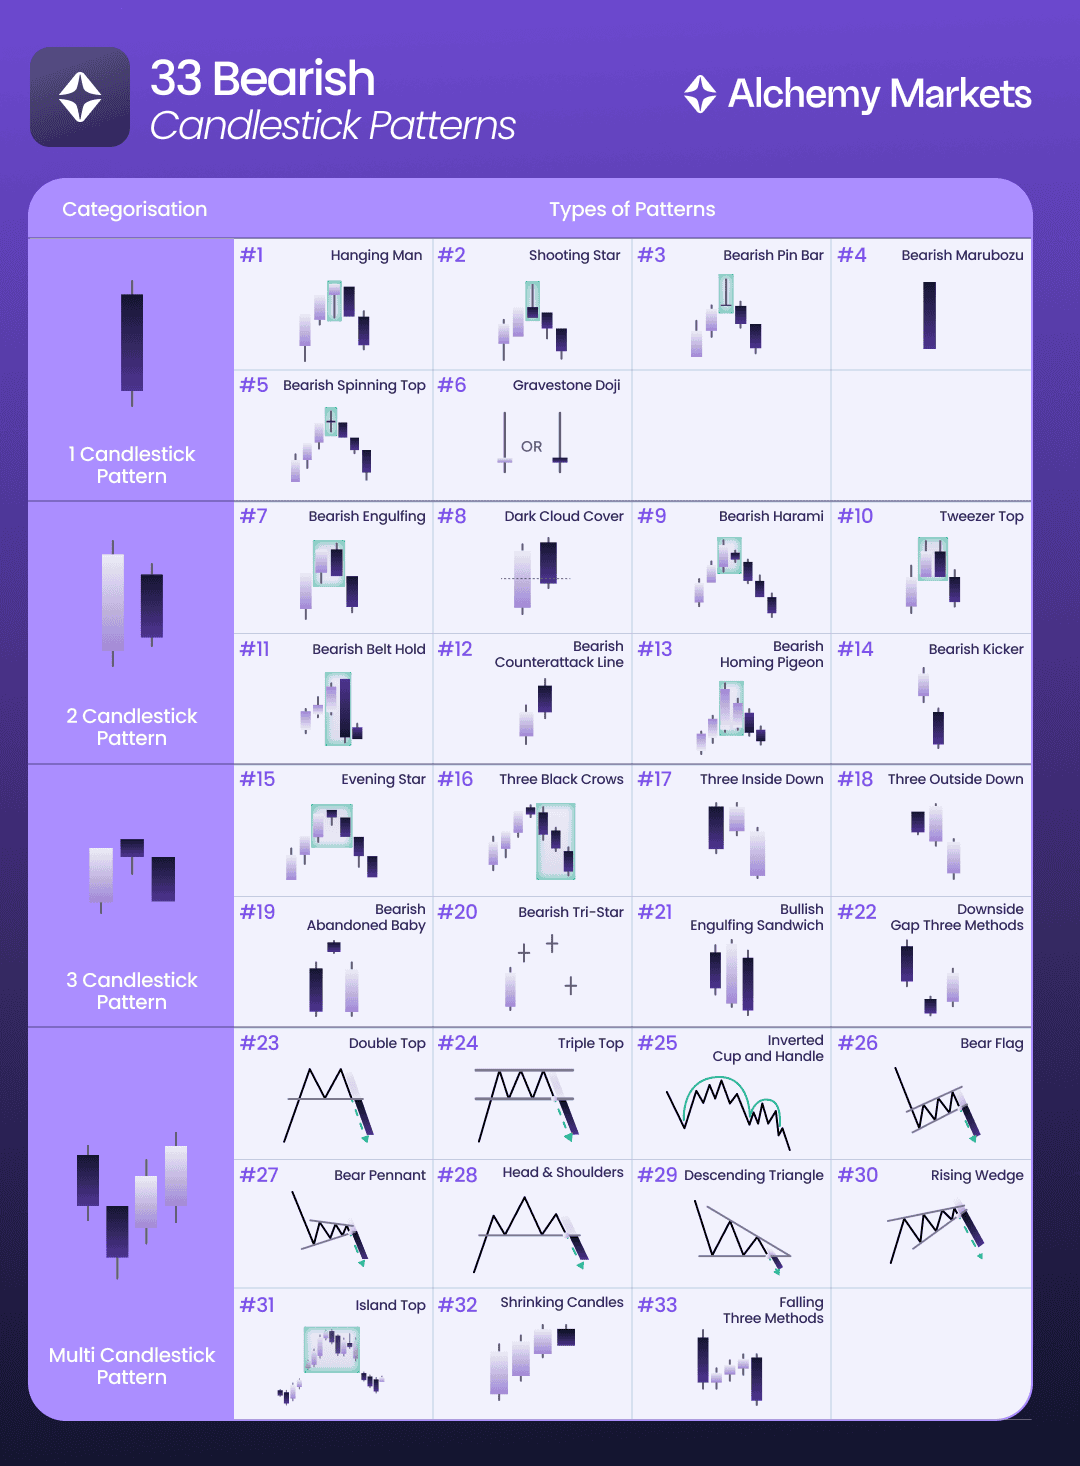
Single Bearish Candlestick Patterns
A single bearish candlestick is like a snapshot of a battle, where sellers clearly overpowered buyers or are beginning to push back. It marks a shift in control that can hint at more downside.
When this kind of move appears near a key resistance level or alongside strong volume, it often serves as an early warning for a potential reversal or continuation lower.
Here are the top bearish single candlestick patterns traders use.
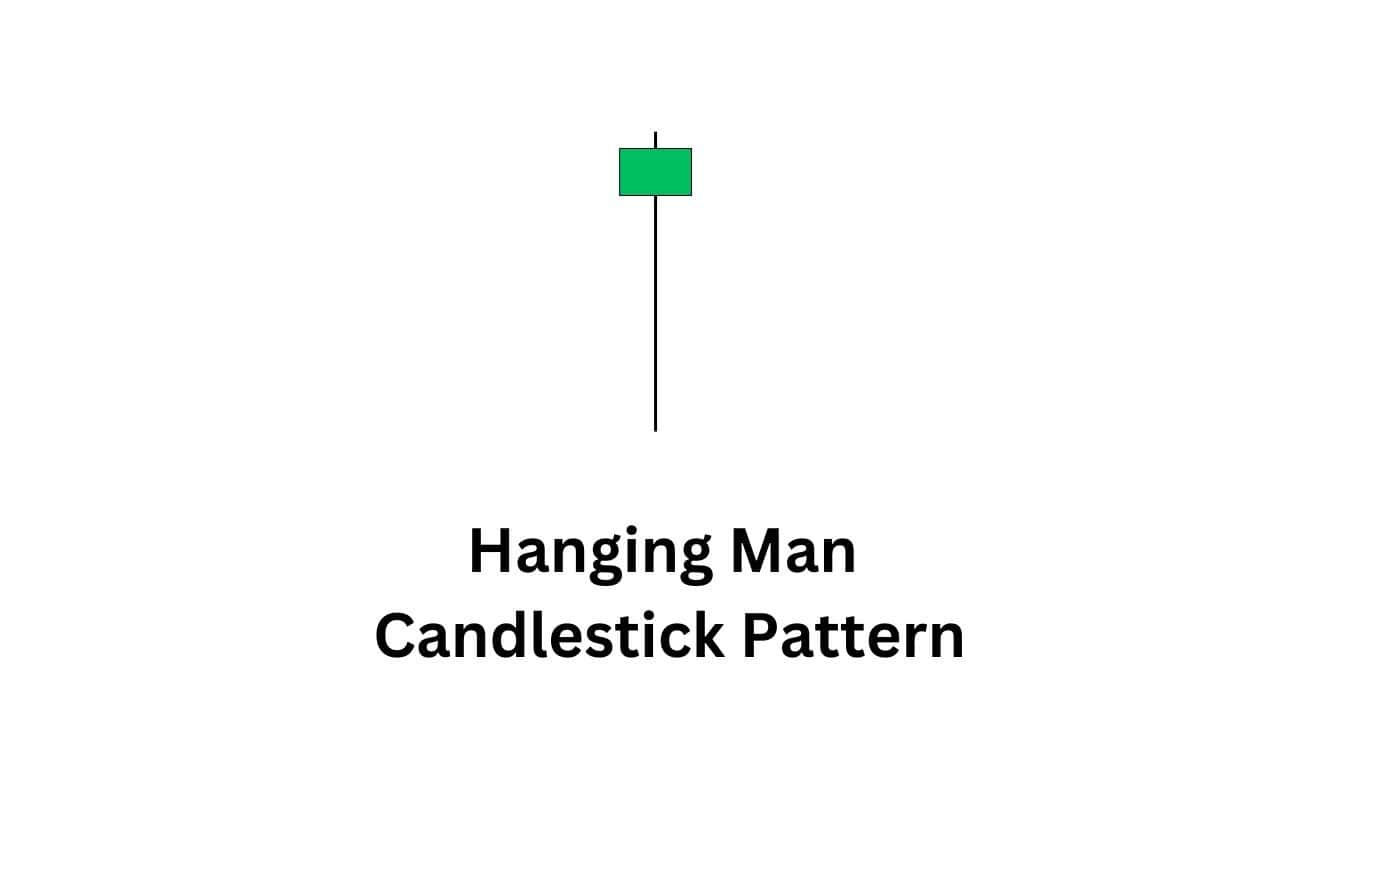
1. Hanging Man
Here’s how to identify this candlestick pattern:
The Hanging Man appears after an uptrend and has a small real body near the top of the candle with a long lower wick. The lower wick should be at least twice the size of the body, and there is little to no upper wick.
Why this candlestick pattern matters:
This pattern shows that sellers tried to drive the price down during the session, but buyers managed to pull it back up before the close. While this might seem like strength, it actually reveals vulnerability. If the next candle confirms bearish movement with a breakdown below the low plus a lower close, it suggests that buyers are losing control and a reversal may be on the way.
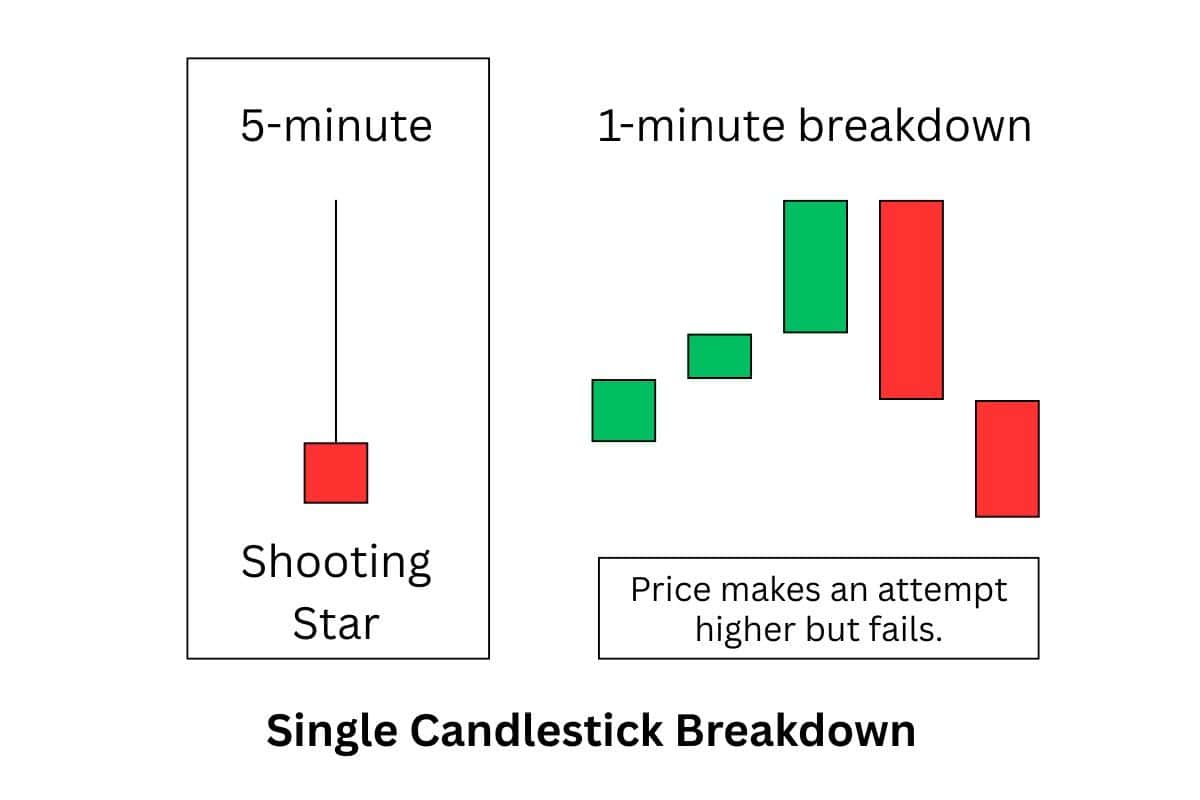
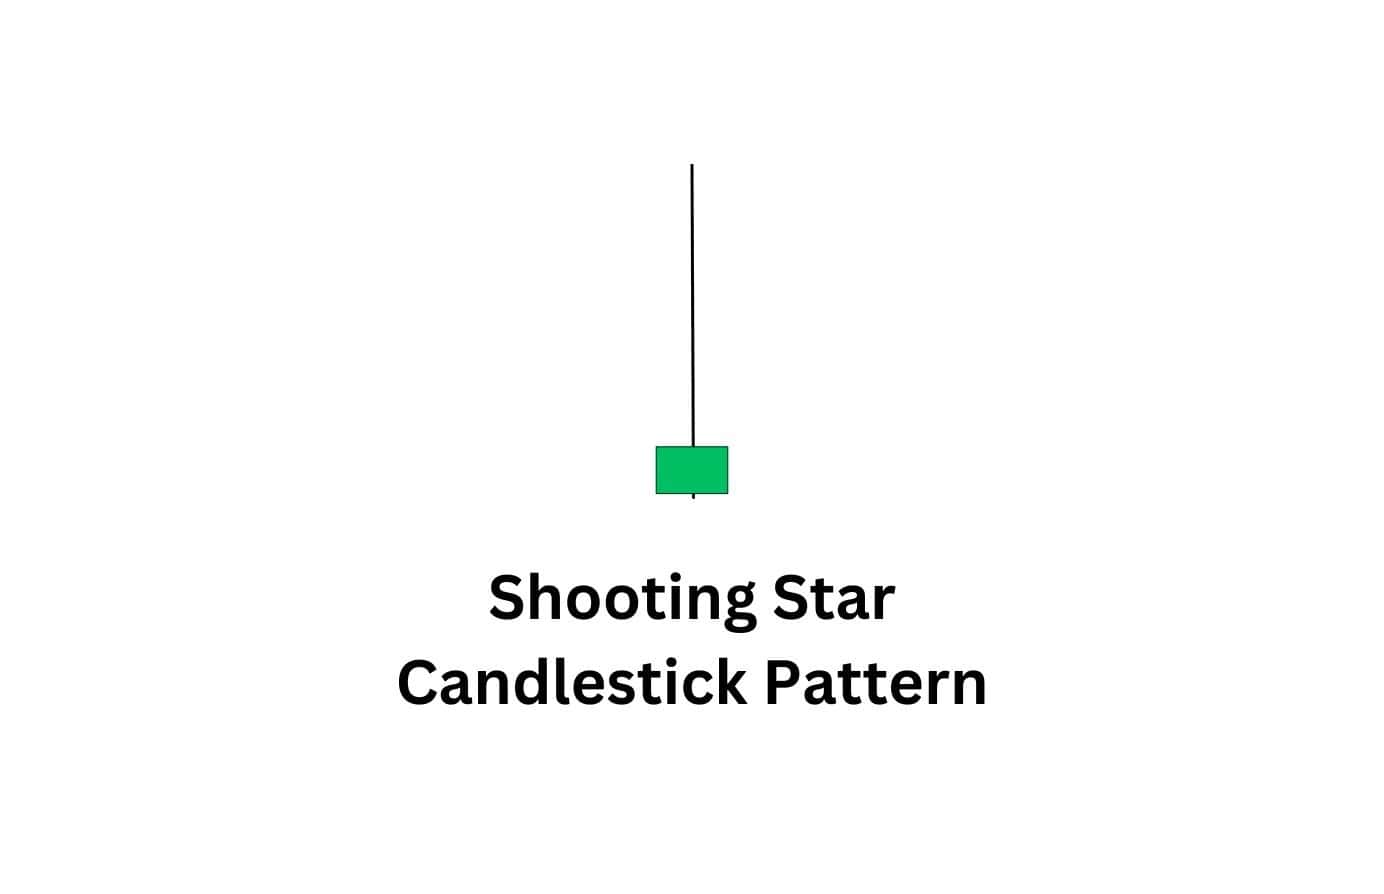
2. Shooting Star Pattern
Here’s how to identify this candlestick pattern:
The Shooting Star forms at the top of an uptrend and has a small real body near the bottom of the candle with a long upper wick. The upper wick should be at least twice the size of the body, with little to no lower wick.
Why this candlestick pattern matters:
This pattern indicates that buyers tried to push prices higher but failed as sellers stepped in and forced the price back down before the close. The long upper wick signals rejection of higher prices and potential exhaustion from buyers. If the next candle confirms the bearish move with a lower close, it strengthens the case for a downtrend.
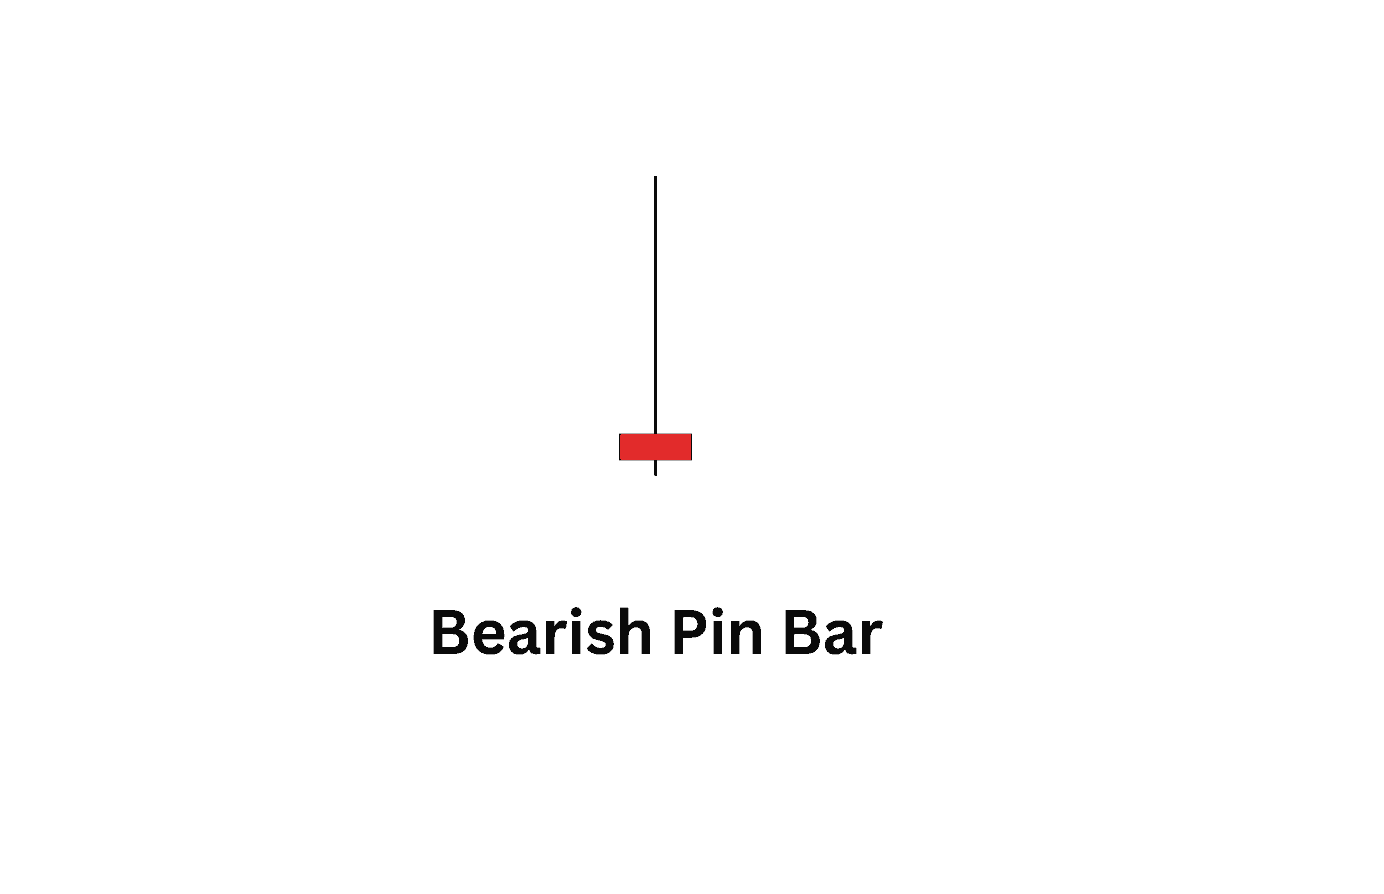
3. Bearish Pin Bar
Here’s how to identify this candlestick pattern:
A bearish pin bar has a small real body near the bottom of the candle and a long upper wick. This formation shows that price initially moved higher but faced strong rejection, pushing it back down before the candle closed. The longer the wick, the stronger the rejection, indicating aggressive selling pressure.
Why this candlestick pattern matters:
This pattern suggests that buyers attempted to push the market higher but failed, leading to a shift in control toward sellers. When a bearish pin bar appears at a key resistance level or after a strong uptrend, it signals that a reversal may be imminent. Many traders use this as a confirmation to enter short positions, especially when followed by further bearish movement.
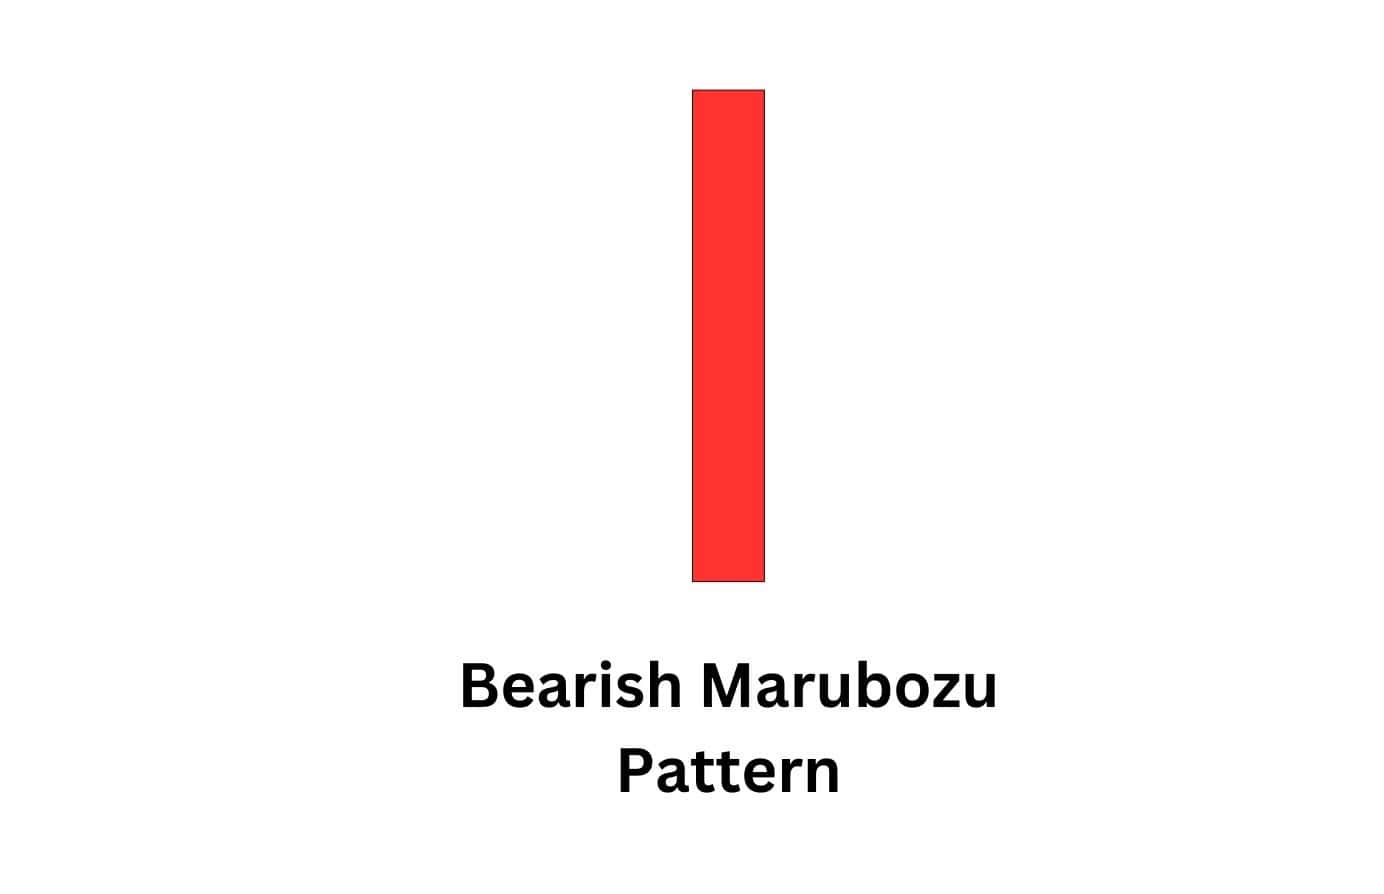
4. Bearish Marubozu Pattern
Here’s how to identify this candlestick pattern:
The bearish marubozu pattern comprises a solitary, robust bearish candle with minimal to no wicks. It starts at the peak price of the session and ends at the minimum, usually following an uptrend or close to a resistance level.
Why this candlestick pattern matters:
It indicates intense selling force without any reluctance or retracements. When a Bearish Marubozu forms following a strong rally, it indicates an abrupt change in sentiment, frequently resulting in continued downward movement.
5. Bearish Spinning Top
Here’s how to identify this candlestick pattern:
The bearish spinning top is a single candle with a small body and long upper and lower wicks, showing that price moved up and down significantly but closed near its opening price. This pattern signals indecision. However, when this pattern appears after an uptrend and especially near a resistance level, it could hint at a bearish reversal.
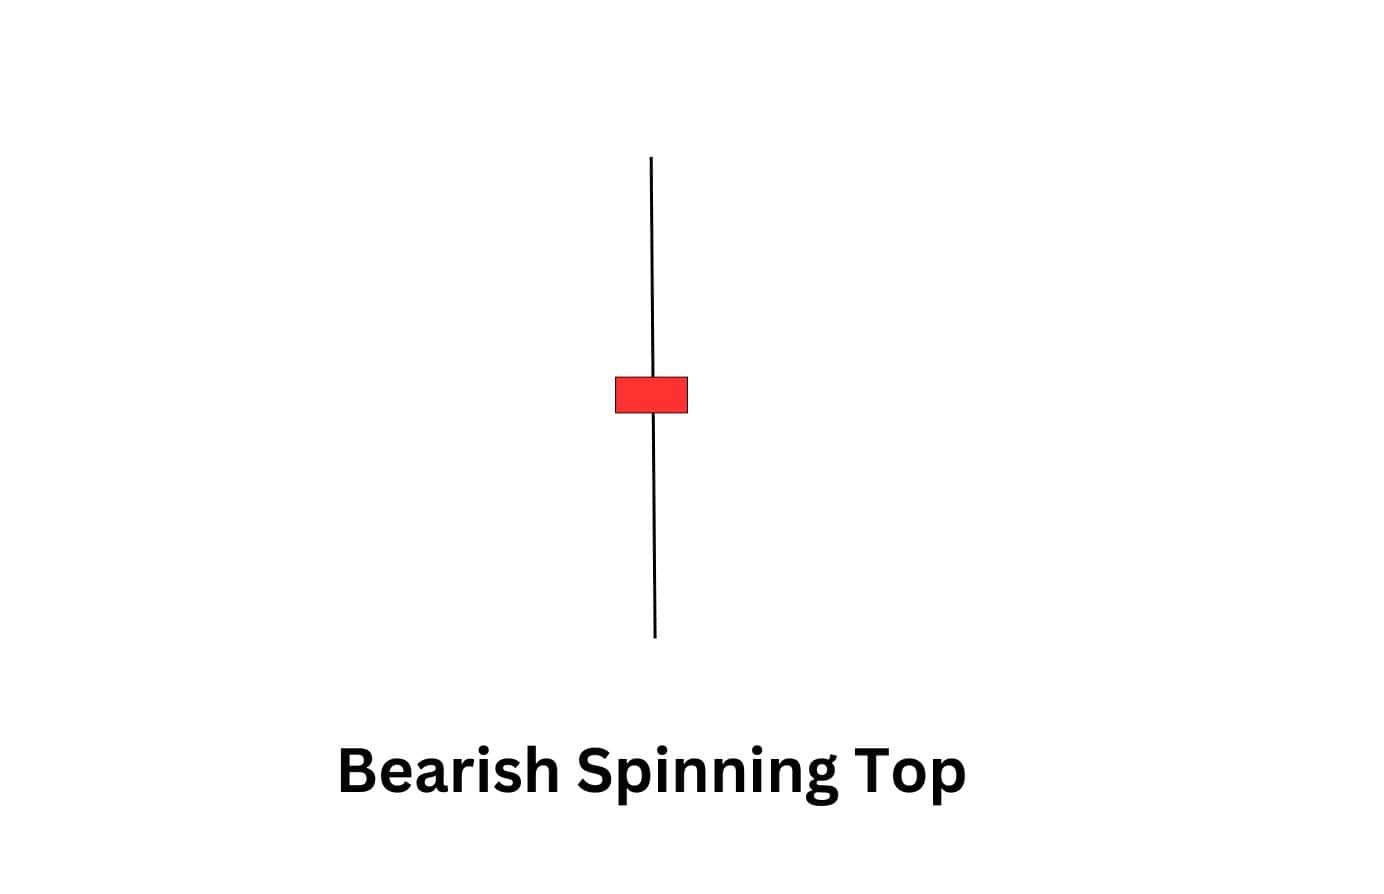
Why this candlestick pattern matters:
A bearish spinning top means neither buyers nor sellers had full control. If it appears at key resistance, it suggests that bullish momentum is stalling. When followed by strong bearish price action, it can confirm a potential downturn.
6. Gravestone Doji
Here’s how to identify this candlestick pattern:
This lone candle features a lengthy upper wick, a very small or absent body, and little to no lower wick. The Gravestone Doji develops following an uptrend, indicating that buyers first drive prices up, but ultimately, by the end, sellers bring the price down close to its opening level.
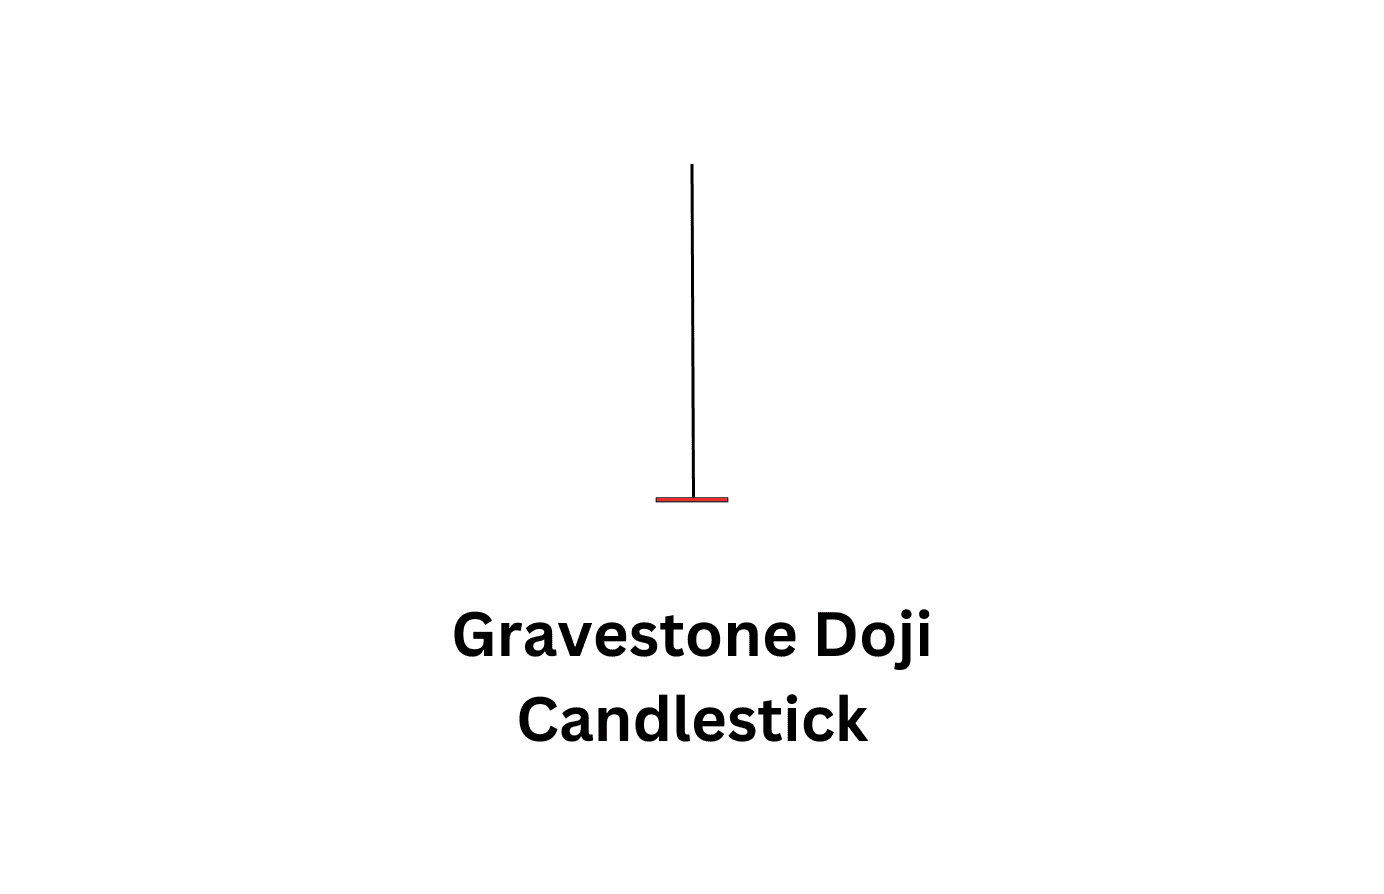
Why this candlestick pattern matters:
The gravestone doji indicates that buyers tried to push the market up but were unsuccessful, as sellers intervened forcefully. It frequently emerges in volatile market conditions while located near critical resistance points. This combination of market conditions and structural resistance indicate a possible turnaround. When accompanied by bearish confirmation, it bolsters the argument for a downtrend.
Dual Bearish Candlestick Patterns
A bearish dual candlestick pattern is like watching two rounds of a battle where the momentum flips toward the sellers. The first candle sets the stage, and the second confirms that selling pressure is taking over.
When this pattern appears near resistance or alongside high volume, it can strengthen the case for a reversal or continuation lower.
Here are the top bearish double candlestick patterns traders use.
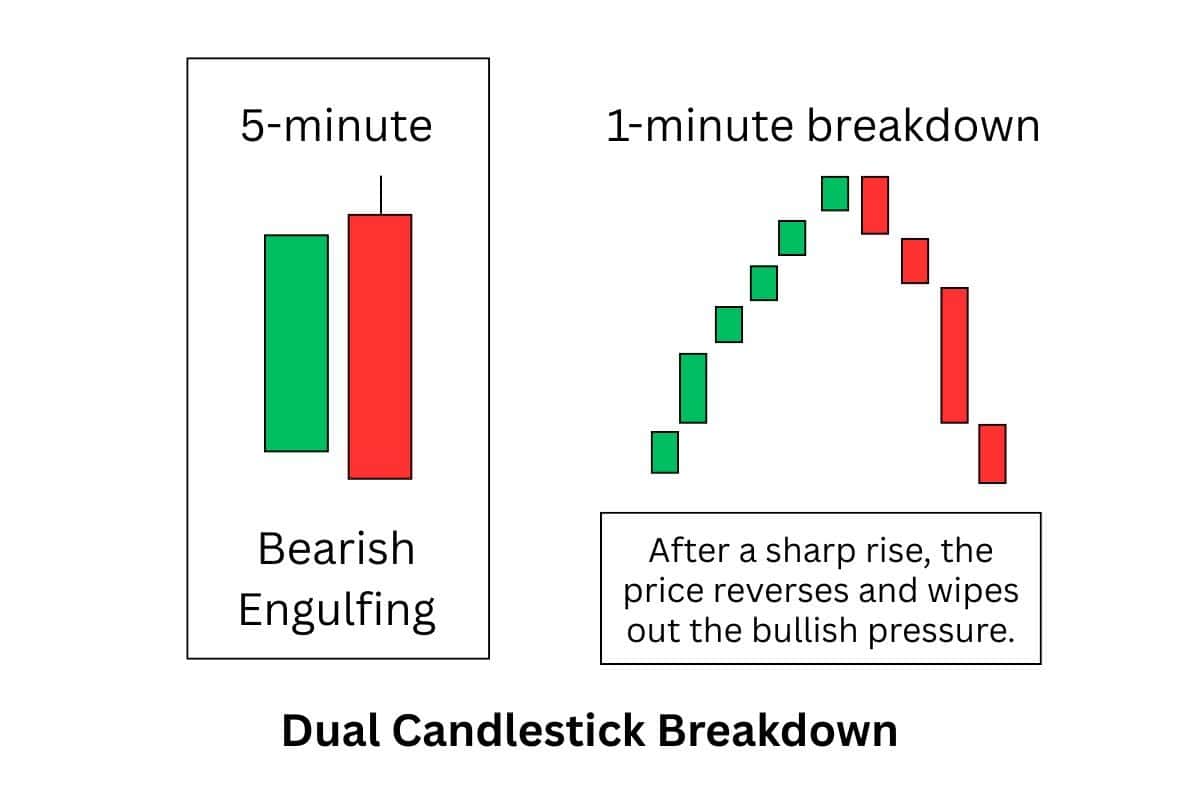
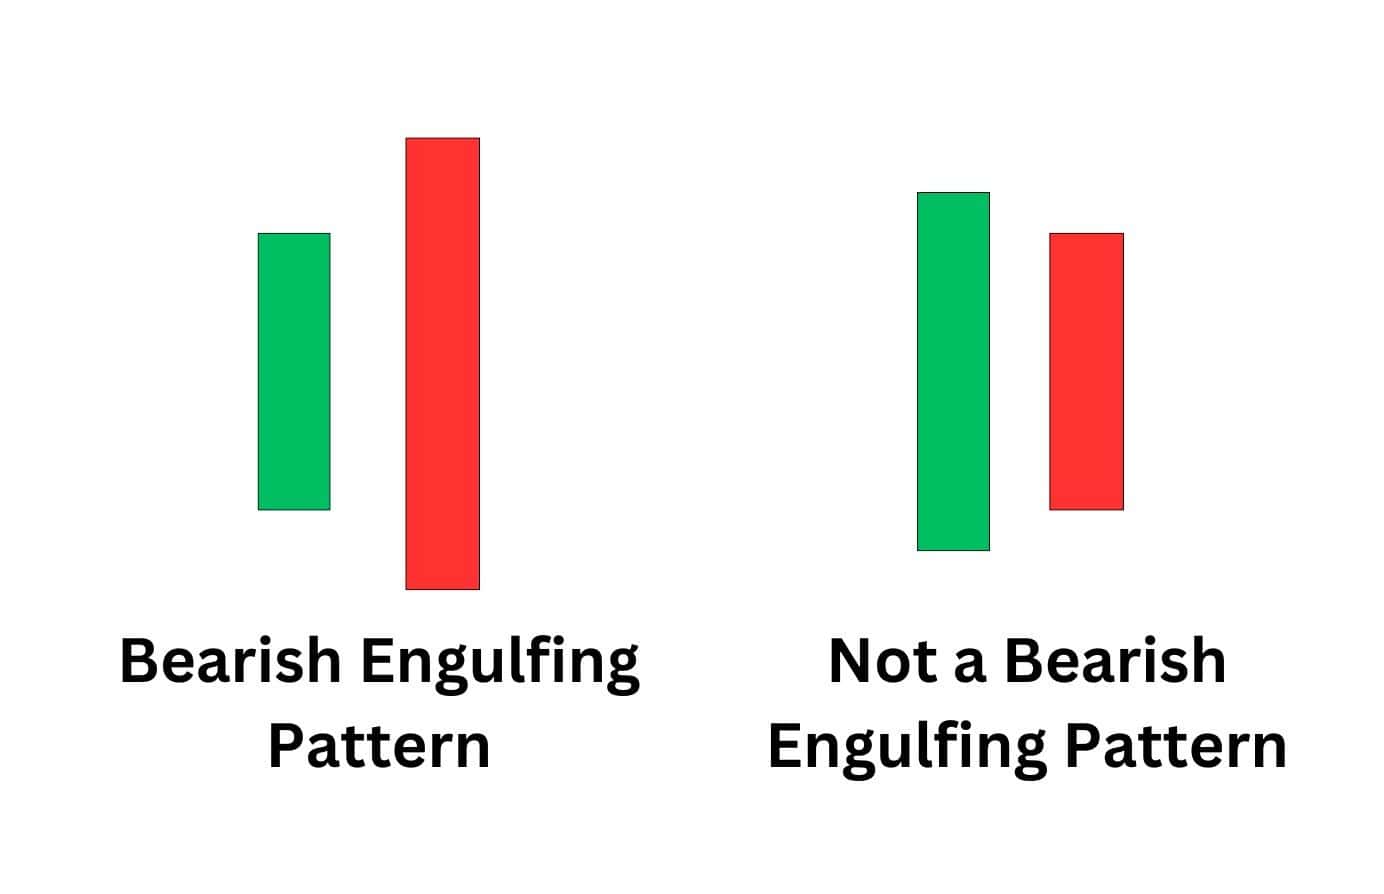
7. Bearish Engulfing Pattern
Here’s how to identify this candlestick pattern:
A bearish engulfing pattern consists of two candles. The first is a small green candle, showing that buyers were in control. The second is a large red candle that completely engulfs the first one as it opens above the previous close and closes below the previous open. The second candle shows that buyers were initially in control of the price before sellers took over and pushed prices lower.
Why this candlestick pattern matters:
This pattern signals a strong shift in momentum. The first candle represents buyers still trying to push prices higher, but the second candle shows that sellers took full control, erasing the previous day’s gains. When this pattern forms near resistance or at the peak of an uptrend, it increases the likelihood of a reversal.
8. Dark Cloud Cover
Here’s how to identify this candlestick pattern:
The dark cloud cover pattern appears after an uptrend, where the first candle is bullish and strong. The second candle opens higher but closes deep into the previous candle’s body, covering at least half of it. The shift from a green to a red candle signals that buying momentum is fading.
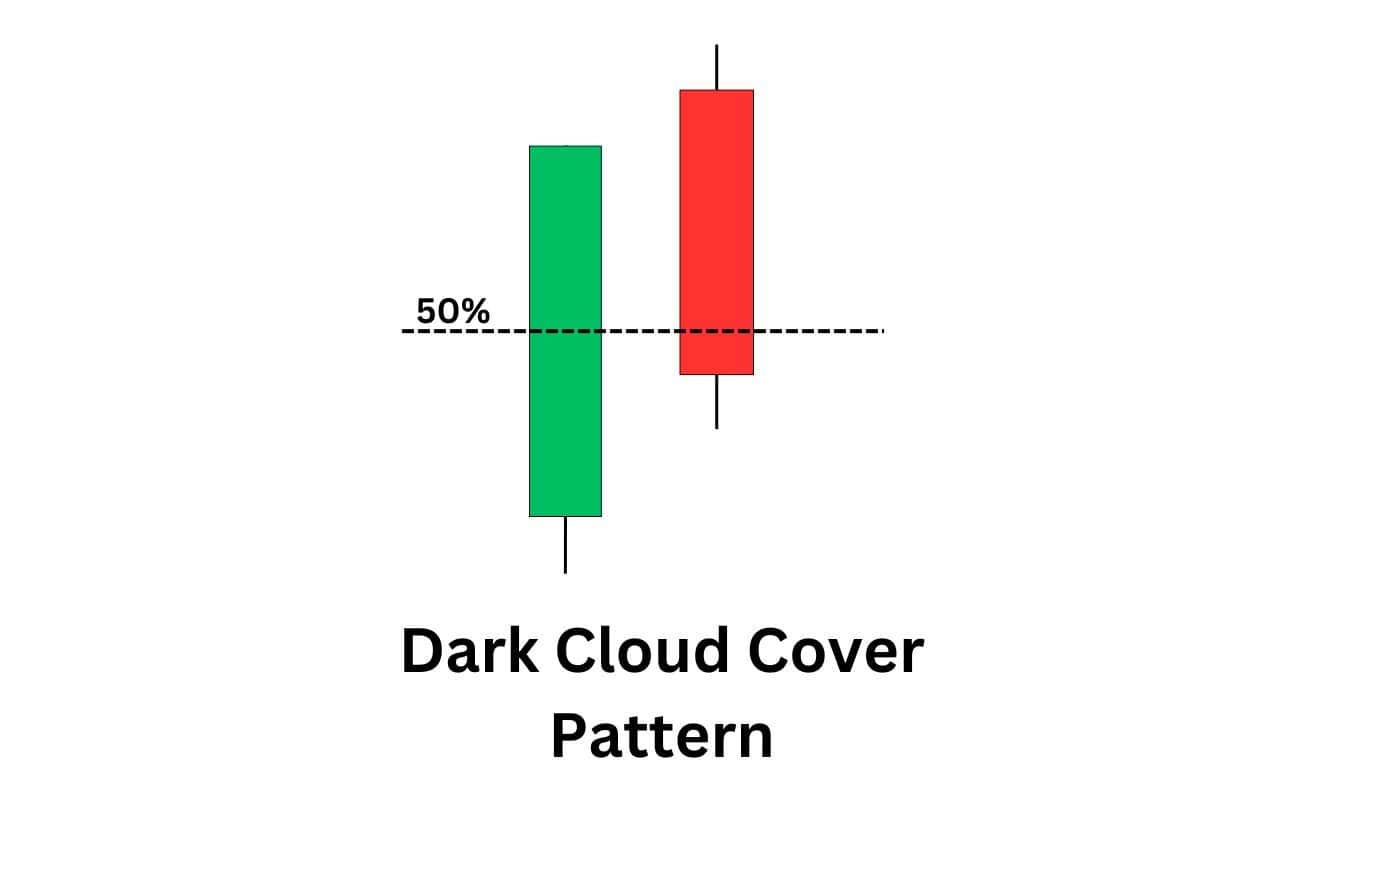
Why this candlestick pattern matters:
The pattern warns that buyers are losing control. The strong open of the second candle suggests bulls attempted to push higher, but sellers took over and drove the price lower. When this pattern forms near a resistance level, it hints at a potential market top and a possible reversal.
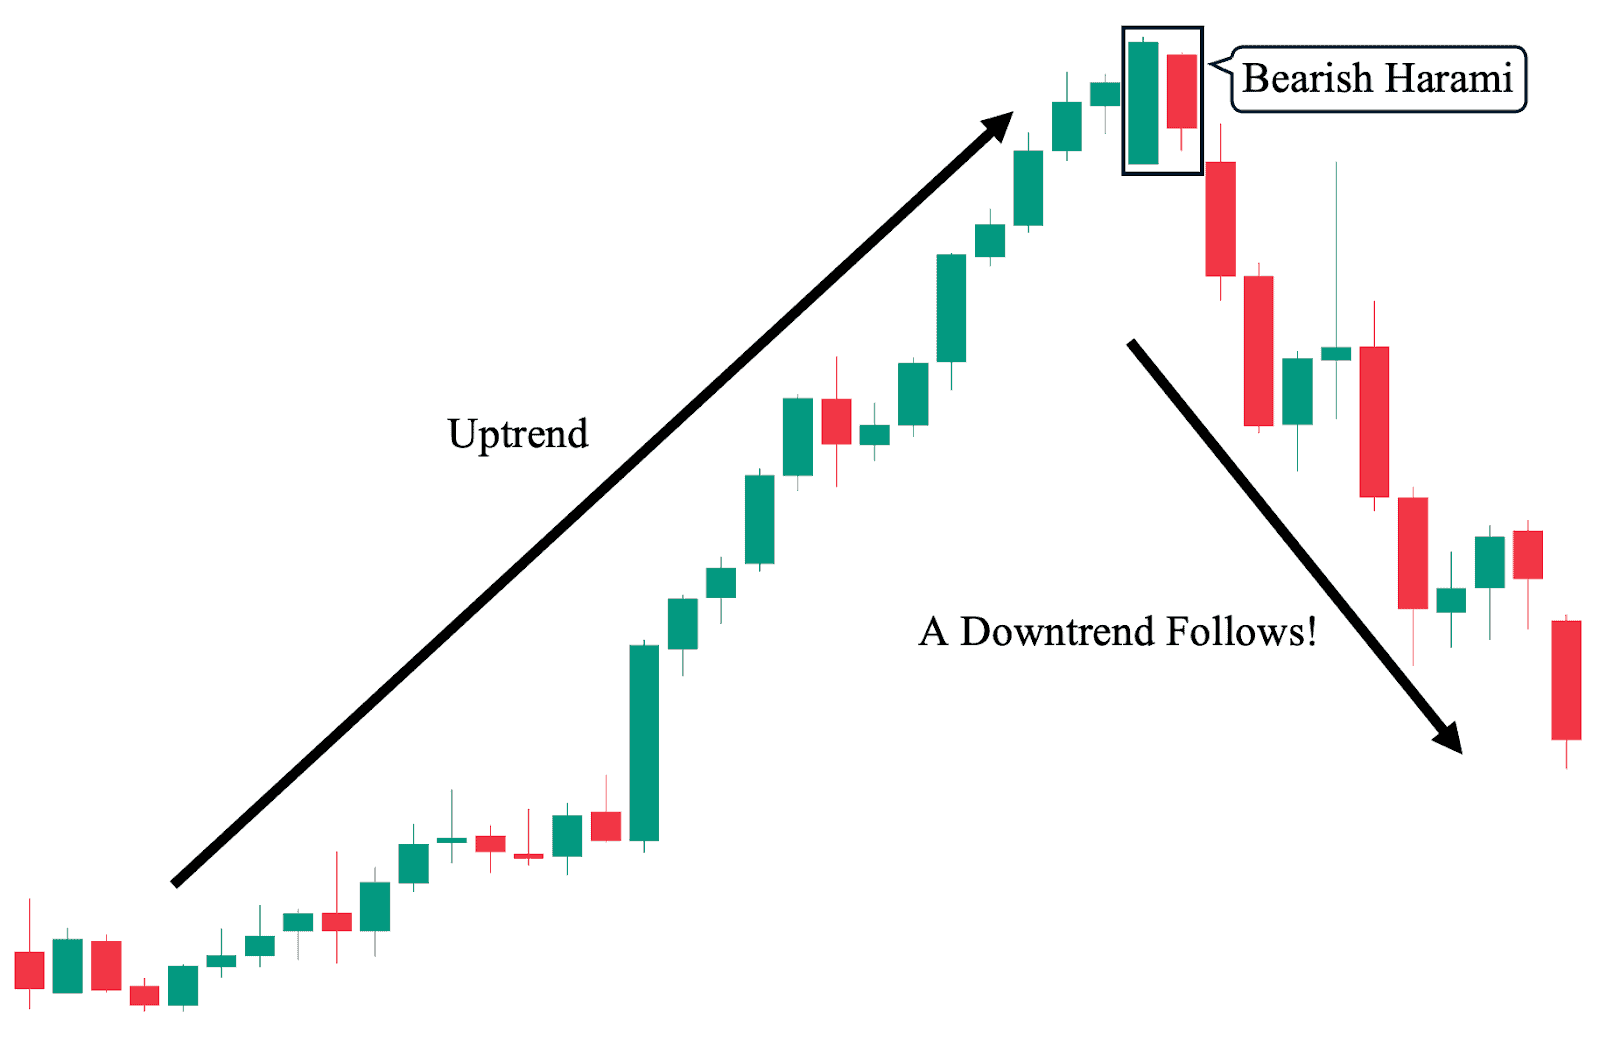
9. Bearish Harami Pattern
Here’s how to identify this candlestick pattern:
The bearish harami pattern forms after an uptrend, starting with a large bullish candle. The second candle is much smaller and fits entirely within the previous candle’s body. While the second candle can be either color, a red one strengthens the bearish signal.
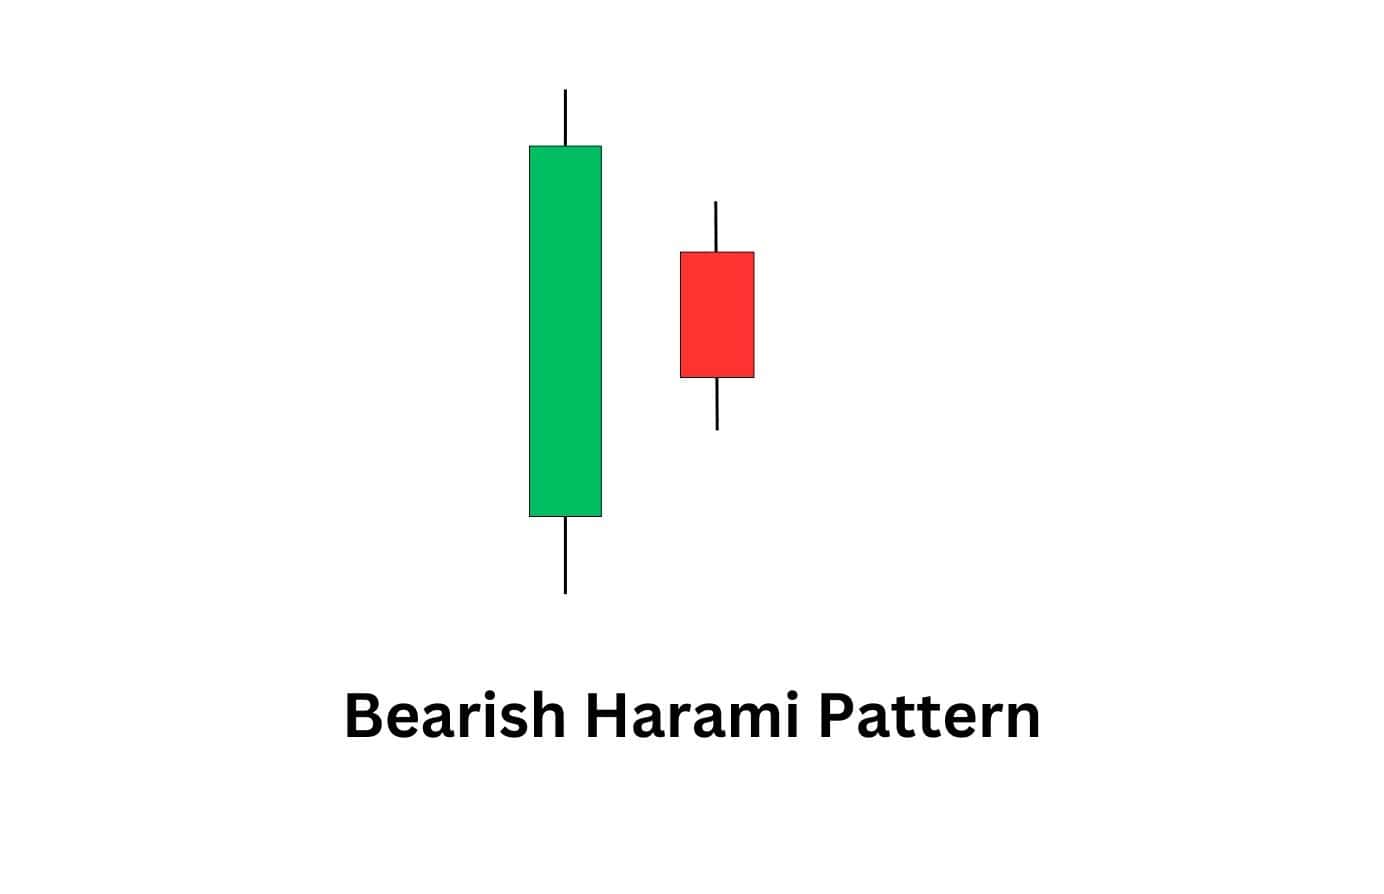
Why this candlestick pattern matters:
This candlestick pattern suggests hesitation in the market. After a strong bullish run, the sudden small candle signals uncertainty. If sellers push prices lower afterward, it confirms that momentum is shifting. This pattern alone isn’t always enough to act on, but when combined with weak volume or a resistance zone, it serves as an early warning.
10. Tweezer Top Pattern
Here’s how to identify this candlestick pattern:
The tweezer top pattern appears at the peak of an uptrend, with two consecutive candles that have nearly identical high points. The first candle is bullish, followed by a bearish candle of similar size. Both candles show rejection at the same level, leaving upper wicks that indicate selling pressure.
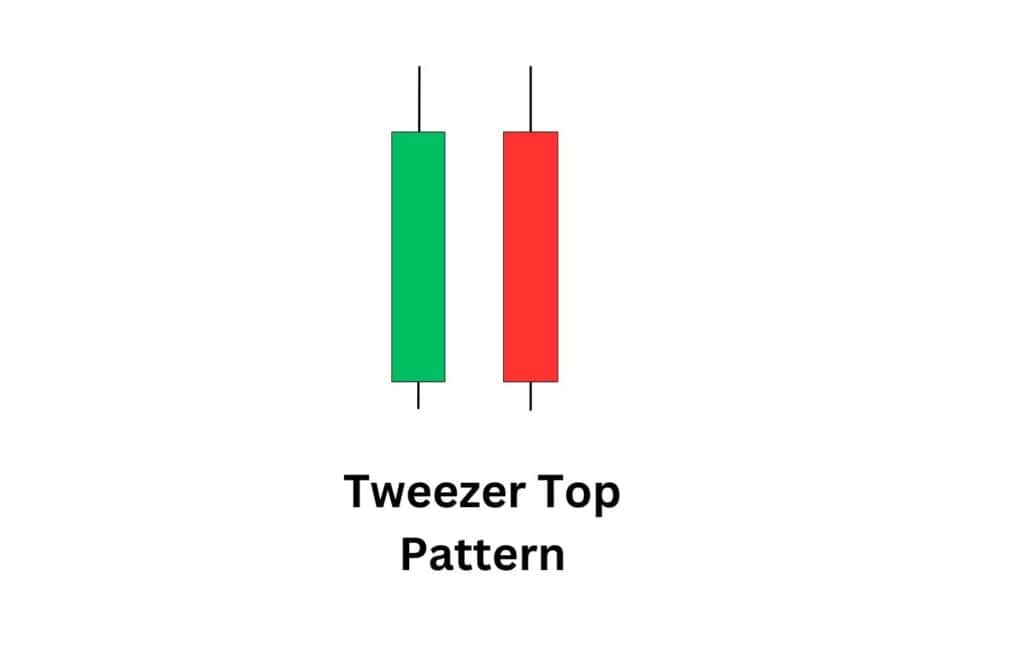
Why this candlestick pattern matters:
It indicates that buyers tried to elevate prices on two occasions but were halted at the same point. This dual rejection indicates that sellers are entering the market, signaling a possible reversal. If this formation appears close to a significant resistance level, it reinforces the bearish argument.
11. Bearish Belt Hold Pattern
Here’s how to identify this candlestick pattern:
The pattern is a single, strong bearish candle that opens at the high of the session and closes near the low, with little to no upper wick. It appears after an uptrend and signals an immediate shift in sentiment.
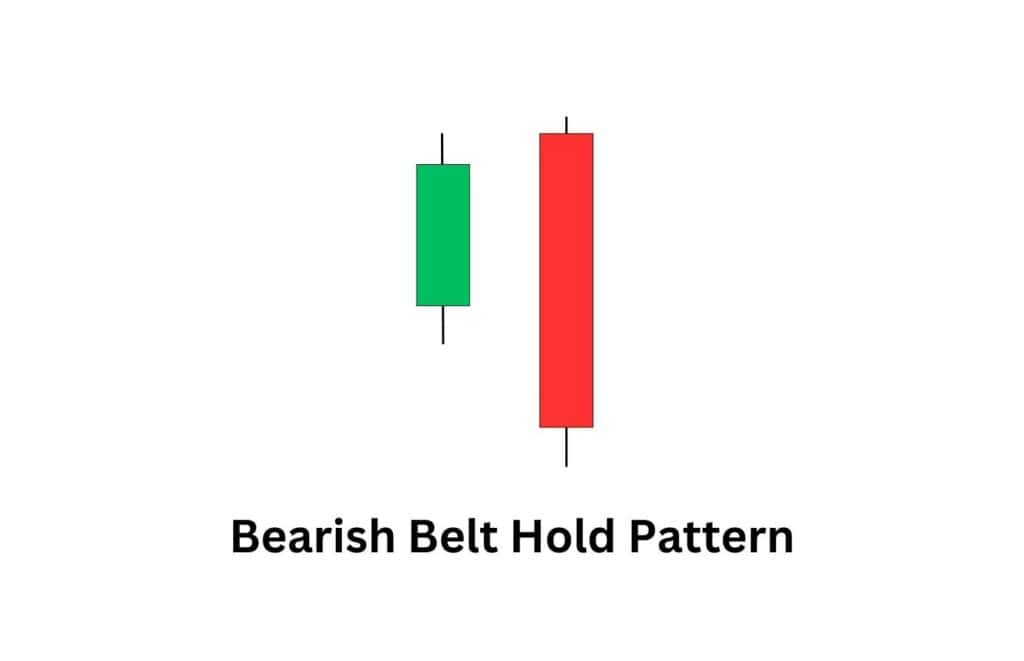
Why this candlestick pattern matters:
A bearish belt hold shows that sellers took control from the start and didn’t allow buyers to push prices back up. When this pattern forms near resistance or after a long bullish run, it suggests that selling pressure is increasing, potentially leading to a downtrend.
12. Bearish Counterattack Line
Here’s how to identify this candlestick pattern:
The bearish counterattack line consists of two candles. The first is a bullish candle in an uptrend. The second is a bearish candle that opens higher but declines to close at the exact or near the first candle’s closing price, forming a “counterattack” response.
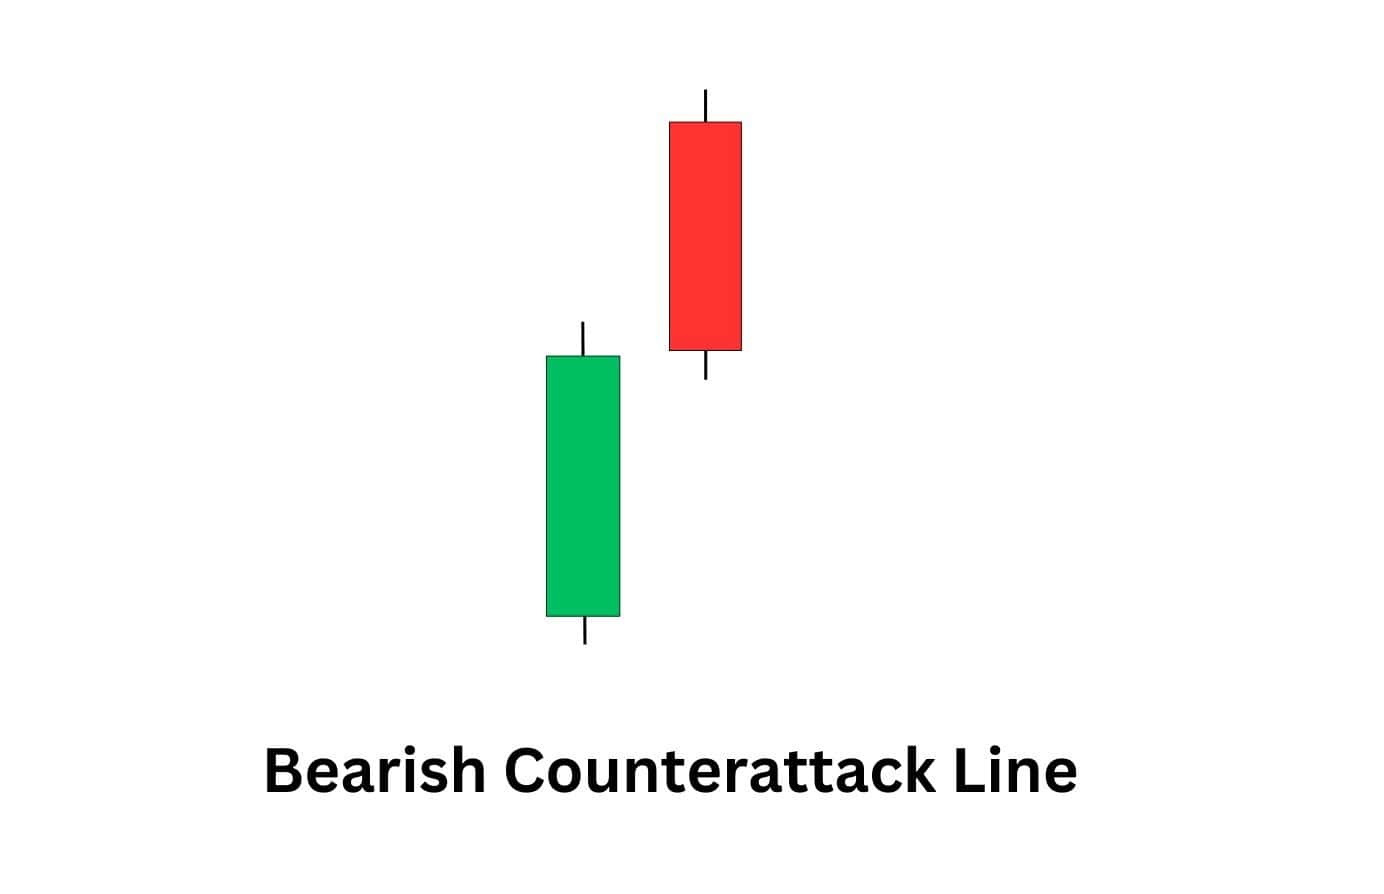
Why this candlestick pattern matters:
The sudden bearish pushback shows sellers aggressively defending a price level. It suggests that despite bullish attempts to continue the trend, bears are stepping in with force. If this pattern forms at a resistance level, it signals a possible reversal.
13. Bearish Homing Pigeon
Here’s how to identify this candlestick pattern:
The bearish homing pigeon is a two-candlestick pattern. Both candles appear bullish, but really are bearish signs when paired together at the top of an uptrend. Even though the first candle is nice and strong, the second candle opened much lower, and could not push out of the first candle’s highs (closing within) — traders interpret this as a sign of indecision or buyer exhaustion.
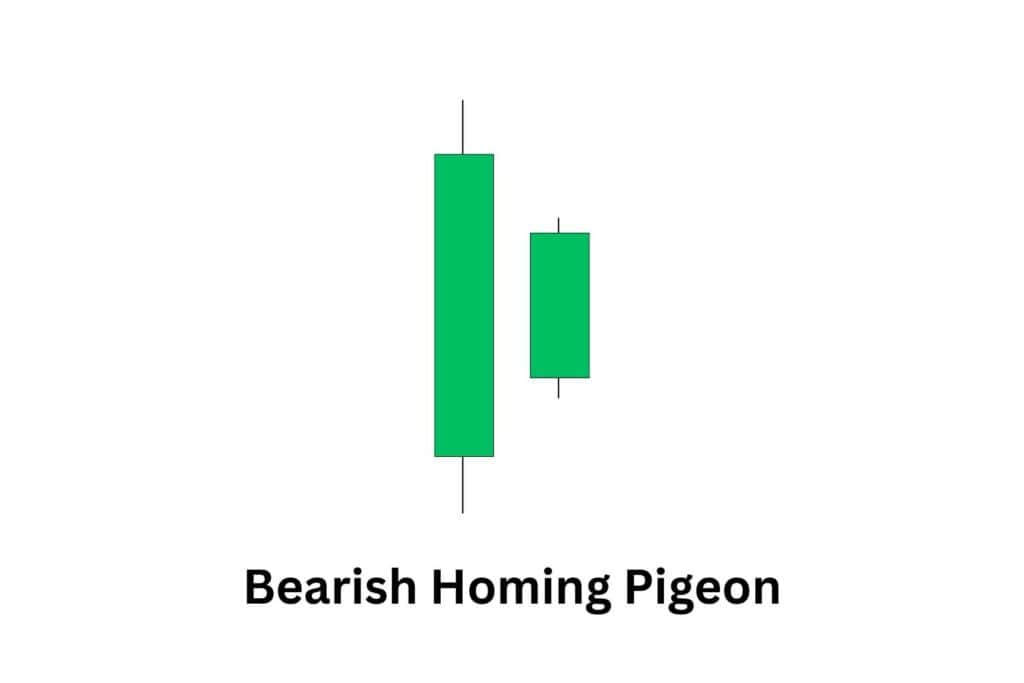
Why this candlestick pattern matters:
The bearish homing pigeon is a sign of weakness; that buyers have run out of buying enthusiasm. When paired with other signals such as a bearish divergence, the bearish homing pigeon is a warning sign to investors that prices may drop.
14. Bearish Kicker
Here’s how to identify this candlestick pattern:
This pattern consists of two strong candles with a sudden shift in direction. The first candle is bullish, showing an uptrend continuation. The second candle, however, opens at or below the previous candle’s open, forming a price gap, and then moves sharply downward, closing lower. There is no overlap between the two candles.
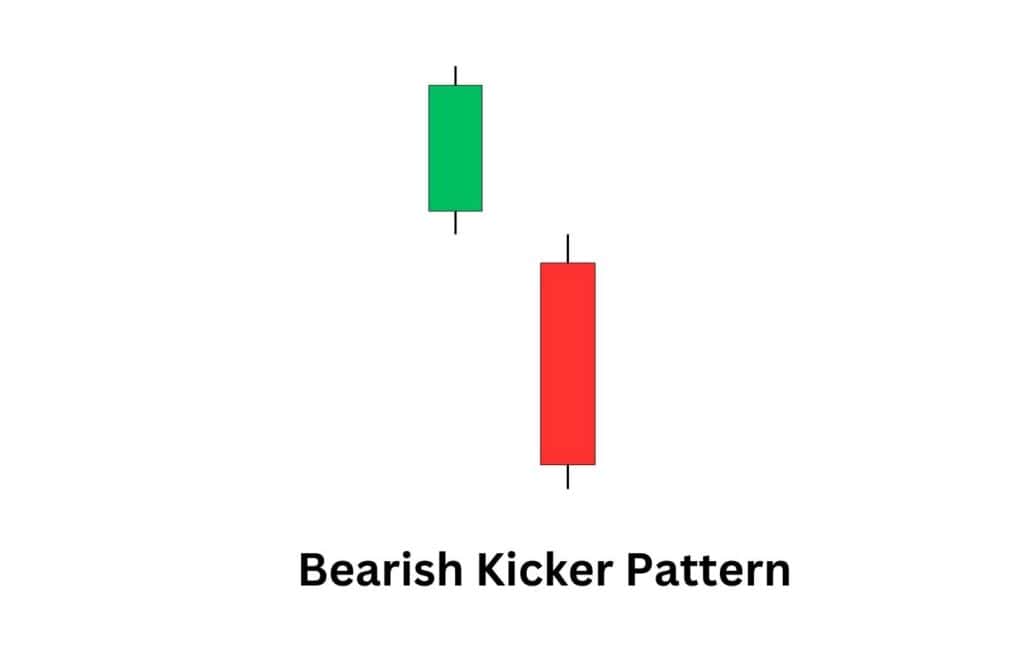
Why this candlestick pattern matters:
A bearish kicker signals an abrupt change in market sentiment. It starts with the first candle appearing to be a continuation of the uptrend. The strong bearish gap shows that sellers took over with force, catching buyers off guard. This pattern is one of the strongest reversal signals, especially when accompanied by high volume, as it suggests a complete shift in control.
Triple Bearish Candlestick Patterns
A triple bearish candlestick pattern is like a three-round battle where sellers gradually take full control. Each candle builds on the previous one, offering stronger confirmation than single or dual patterns.
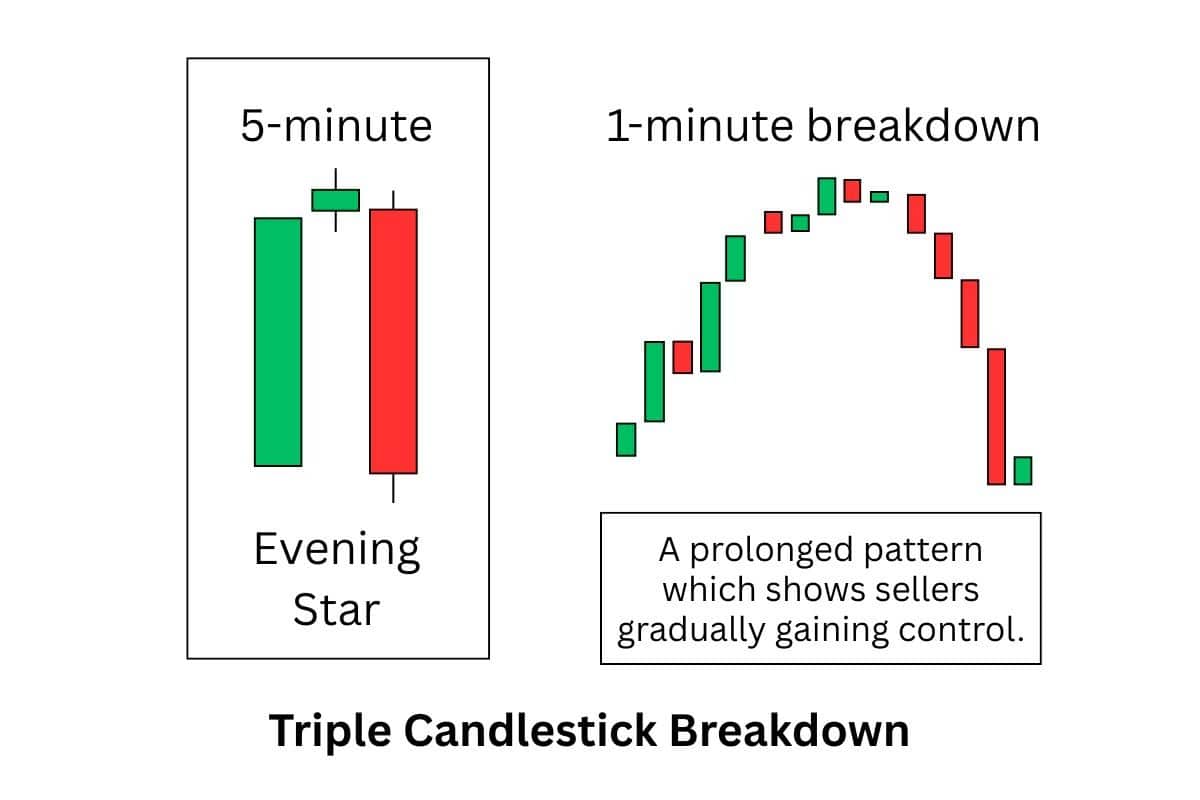
These setups can signal powerful reversals or the continuation of a downtrend, especially when they form near resistance or align with other bearish indicators.
Here are the top bearish triple candlestick patterns traders use.
15. Evening Star Pattern
Here’s how to identify this candlestick pattern:
The Evening Star consists of three candles. The first is a strong green candle, showing that buyers were in control. The second is a small-bodied candle (either red or green) that gaps up, signaling indecision in the market. The third candle is a large red one that closes well below the midpoint of the first candle, confirming a shift in momentum.
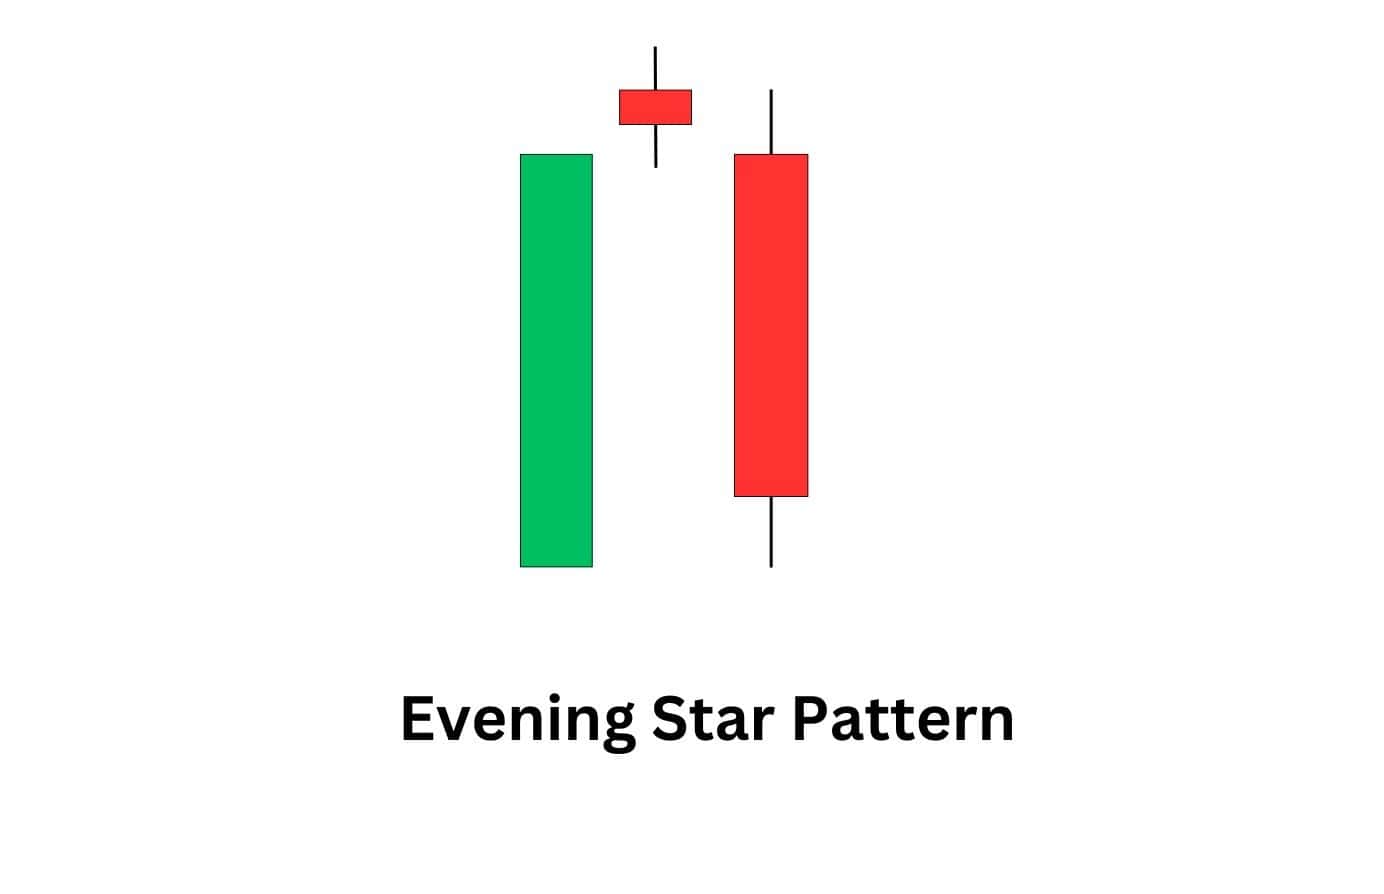
Why this candlestick pattern matters:
This pattern signals that an uptrend is weakening. The first candle represents bullish confidence, but the second candle’s small body suggests hesitation. The third candle, which closes significantly lower, confirms that sellers have taken control. When this pattern appears near a resistance level or after an extended uptrend, it often foreshadows a price decline.
16. Three Black Crows
Here’s how to identify this candlestick pattern:
Three black crows pattern is made up of three consecutive red candles, each opening within the previous candle’s body and closing lower than the last. These candles typically have small or no lower wicks, indicating persistent selling pressure.
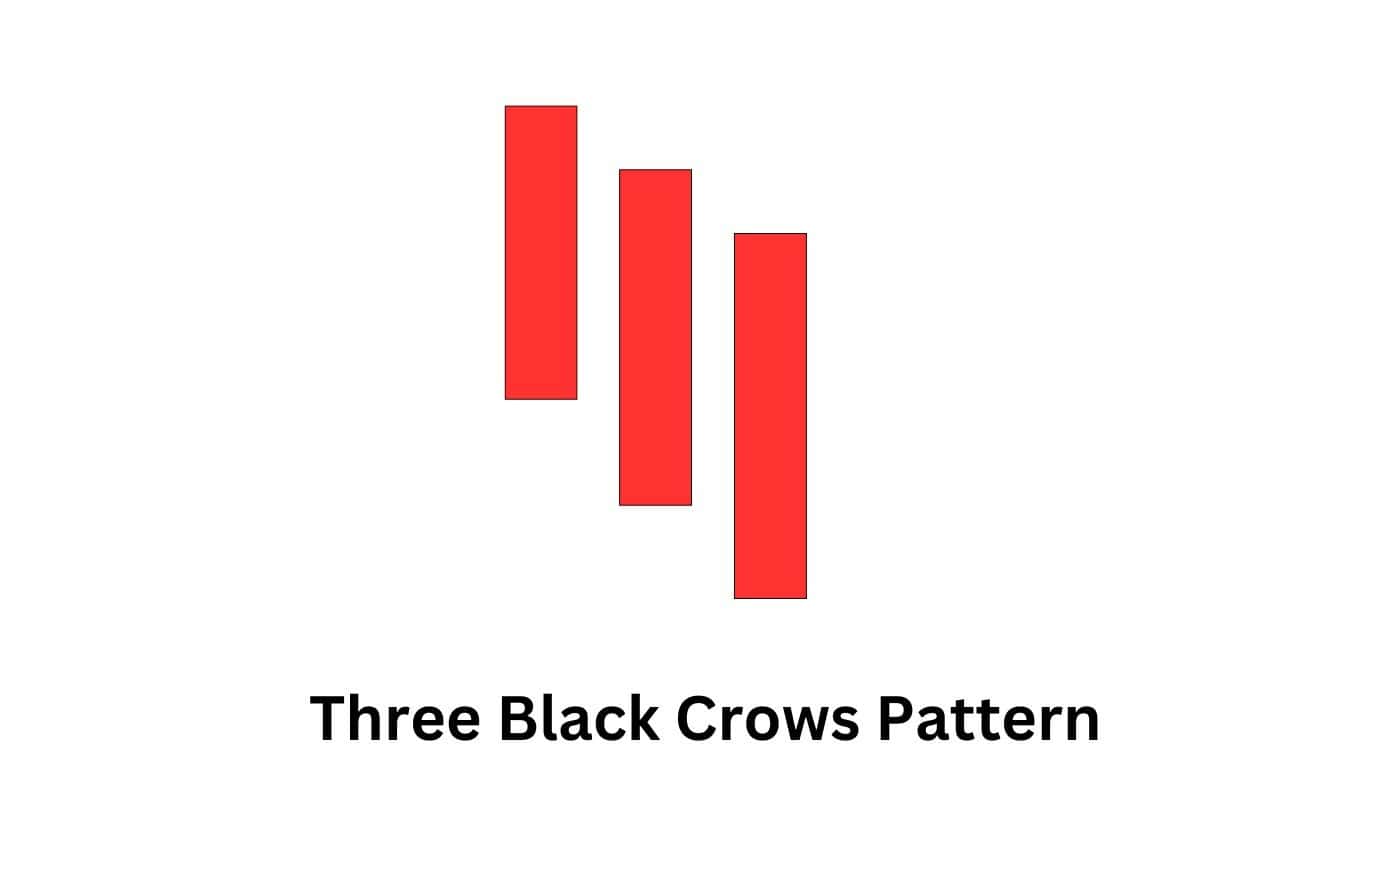
Why this candlestick pattern matters:
The Three Black Crows pattern suggests a strong and steady shift to bearish momentum. Each candle closing lower shows that sellers are overwhelming buyers with little pushback. When this pattern forms after an uptrend, it often signals the beginning of a prolonged downtrend. Traders usually confirm this signal with indicators like RSI or volume analysis to ensure it’s not a false breakdown.
17. Three Inside Down
Here’s how to identify this candlestick pattern:
This three-candle pattern starts with a strong green candle, indicating prior bullish momentum. The second candle is a smaller red candle that forms within the range of the first, signaling a potential shift in momentum. The third candle is a larger red candle that closes below the first candle’s low, confirming bearish control.
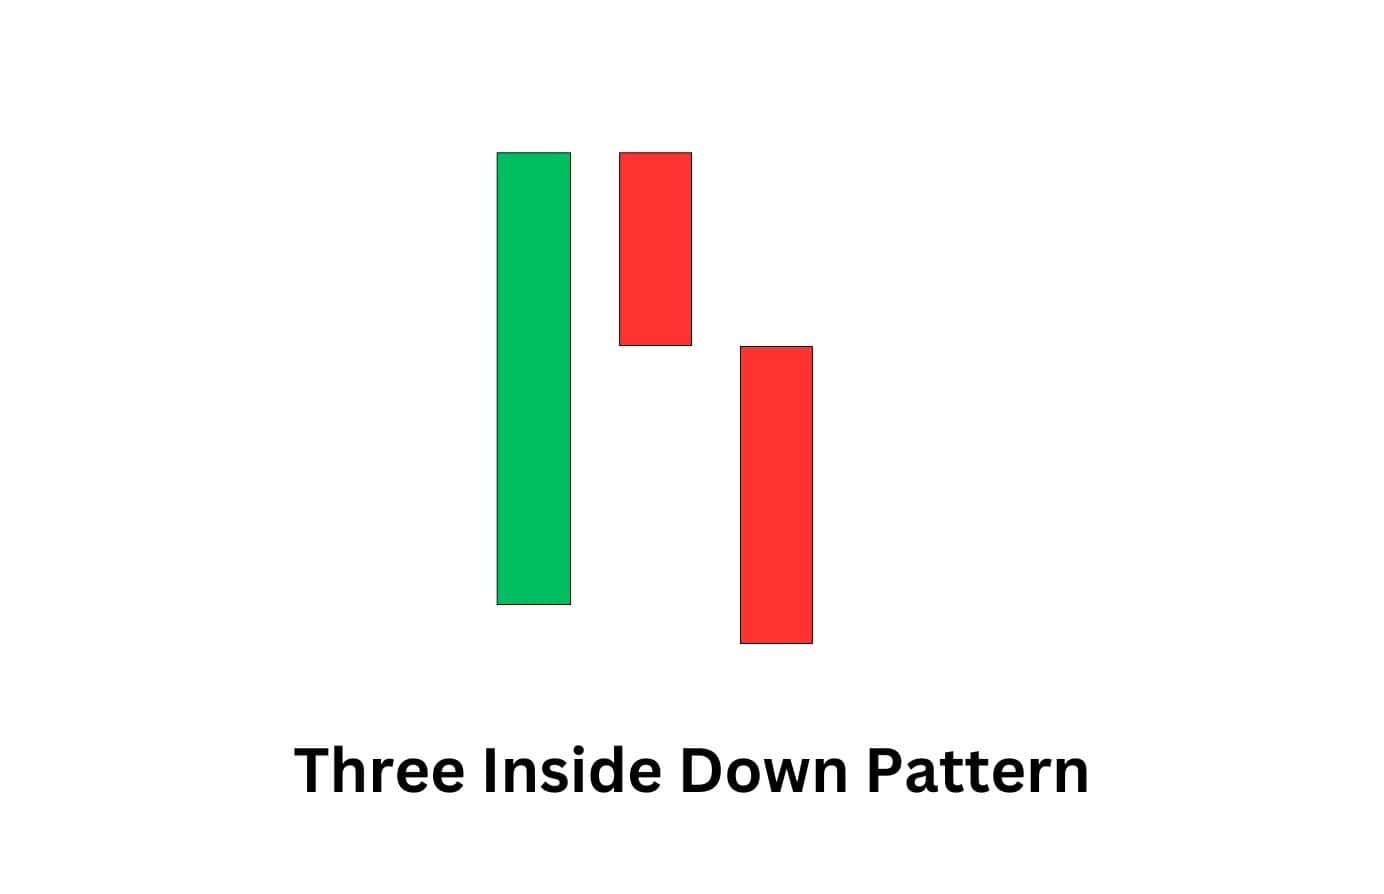
Why this candlestick pattern matters:
The three inside down pattern signals that an uptrend is losing strength and a bearish reversal is taking place. The second candle’s inability to push higher shows hesitation, while the third candle’s decisive break lower confirms that sellers are taking over. Traders look for this pattern near resistance levels or after extended uptrends to time short entries.
18. Three Outside Down
Here’s how to identify this candlestick pattern:
This pattern begins with a green candle, followed by a strong red candle that completely engulfs the first. The third candle is another red candle that closes lower than the second, confirming continued selling pressure. This structure shows a clear shift from bullish to bearish sentiment.
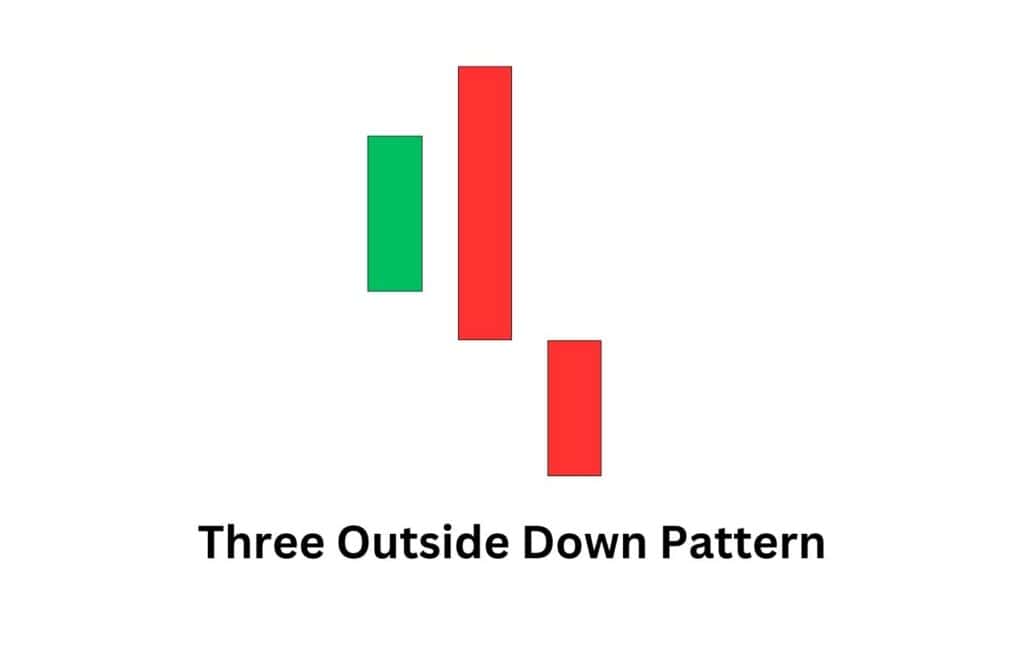
Why this candlestick pattern matters:
The three outside down pattern signals a strong bearish reversal, as buyers fail to maintain control after the first candle. The second candle’s full-body engulfing action shows a decisive shift, while the third candle’s lower close confirms further downside potential. Traders often use this pattern to enter short positions, especially when it appears near key resistance levels.
19. Bearish Abandoned Baby
Here’s how to identify this candlestick pattern:
The bearish abandoned baby pattern forms after an uptrend and consists of three candles. The first is a strong bullish candle, followed by a small Doji that gaps above the first candle, showing hesitation. The third candle is a strong bearish one that gaps down, leaving the Doji isolated, like a “floating” reversal signal.
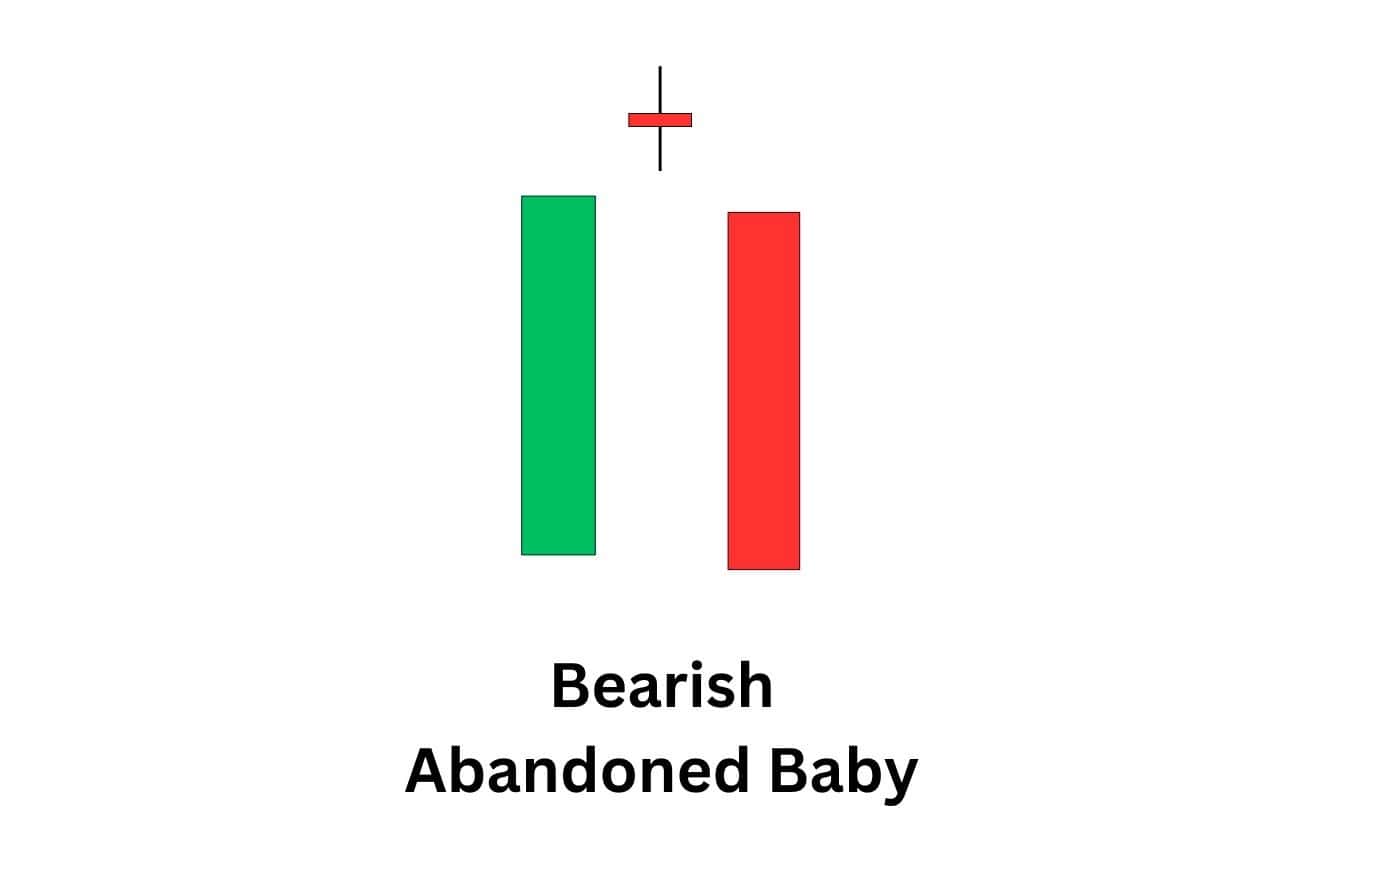
Why this candlestick pattern matters:
This pattern signals a complete shift in market sentiment. Buyers lose momentum, and the gap between the candles suggests an abrupt change in control. If this pattern forms near resistance, it strengthens the case for a bearish reversal, especially when confirmed by high volume.
20. Bearish Tri-Star Pattern
Here’s how to identify this candlestick pattern:
This pattern consists of three consecutive Doji candles forming at the top of an uptrend. Each candle shows hesitation, with opening and closing prices nearly identical. The middle Doji typically gaps higher, reinforcing the struggle between buyers and sellers.
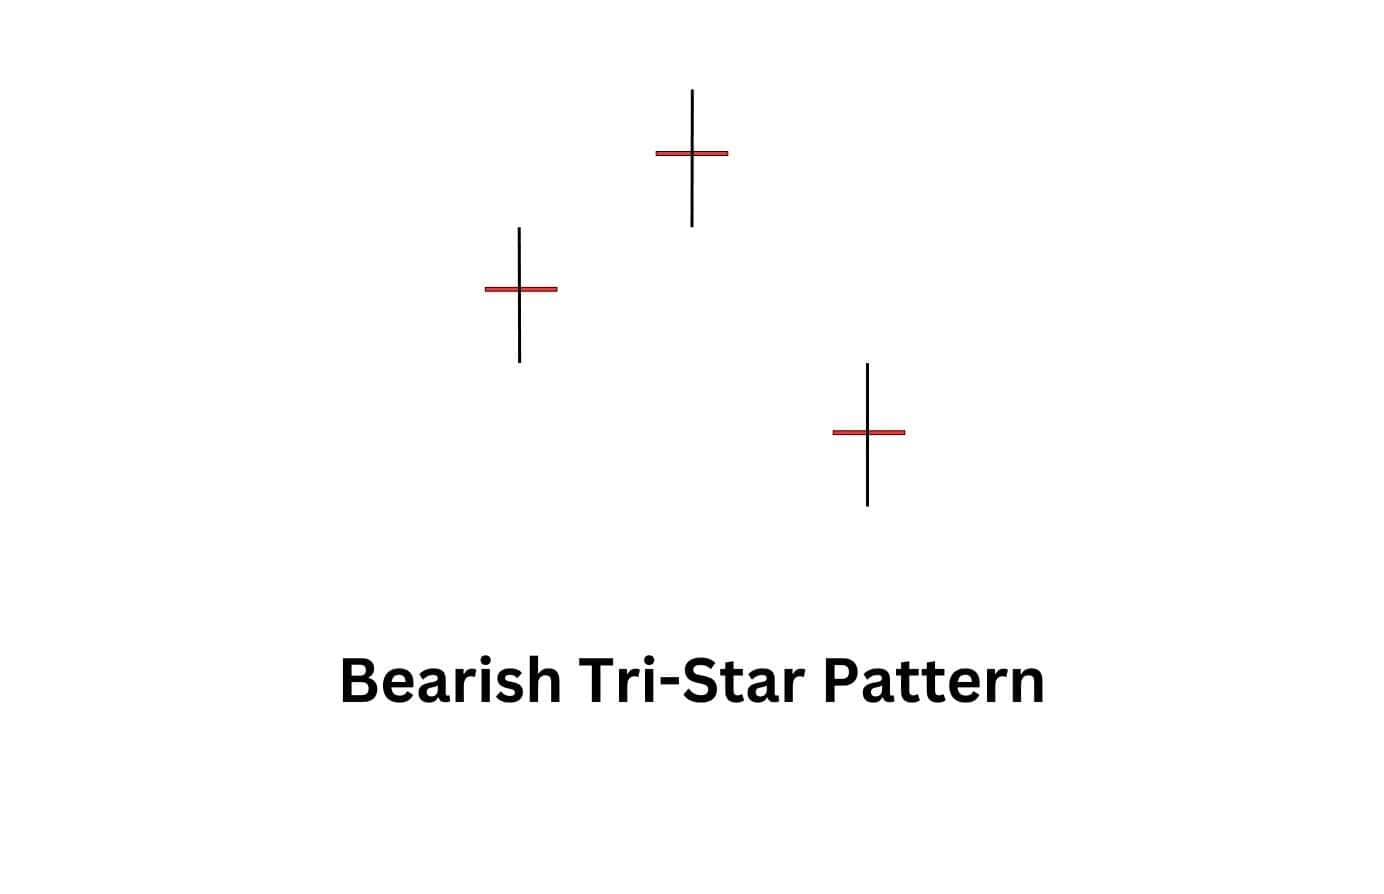
Why this candlestick pattern matters:
The bearish tri-star is a rare but powerful sign of exhaustion in an uptrend. It indicates that buyers are running out of strength and sellers are preparing to take over. If a strong bearish candle follows this formation, it confirms a likely reversal.
21. Bullish Engulfing Sandwich
Here’s how to identify this candlestick pattern:
This pattern consists of three candles: a red candle, followed by a strong green candle that completely engulfs the first, and another red candle closing lower than the second. The key characteristic is that the bullish candle appears to “sandwich” itself between two bearish ones, forming a temporary but notable bullish response within a downtrend.
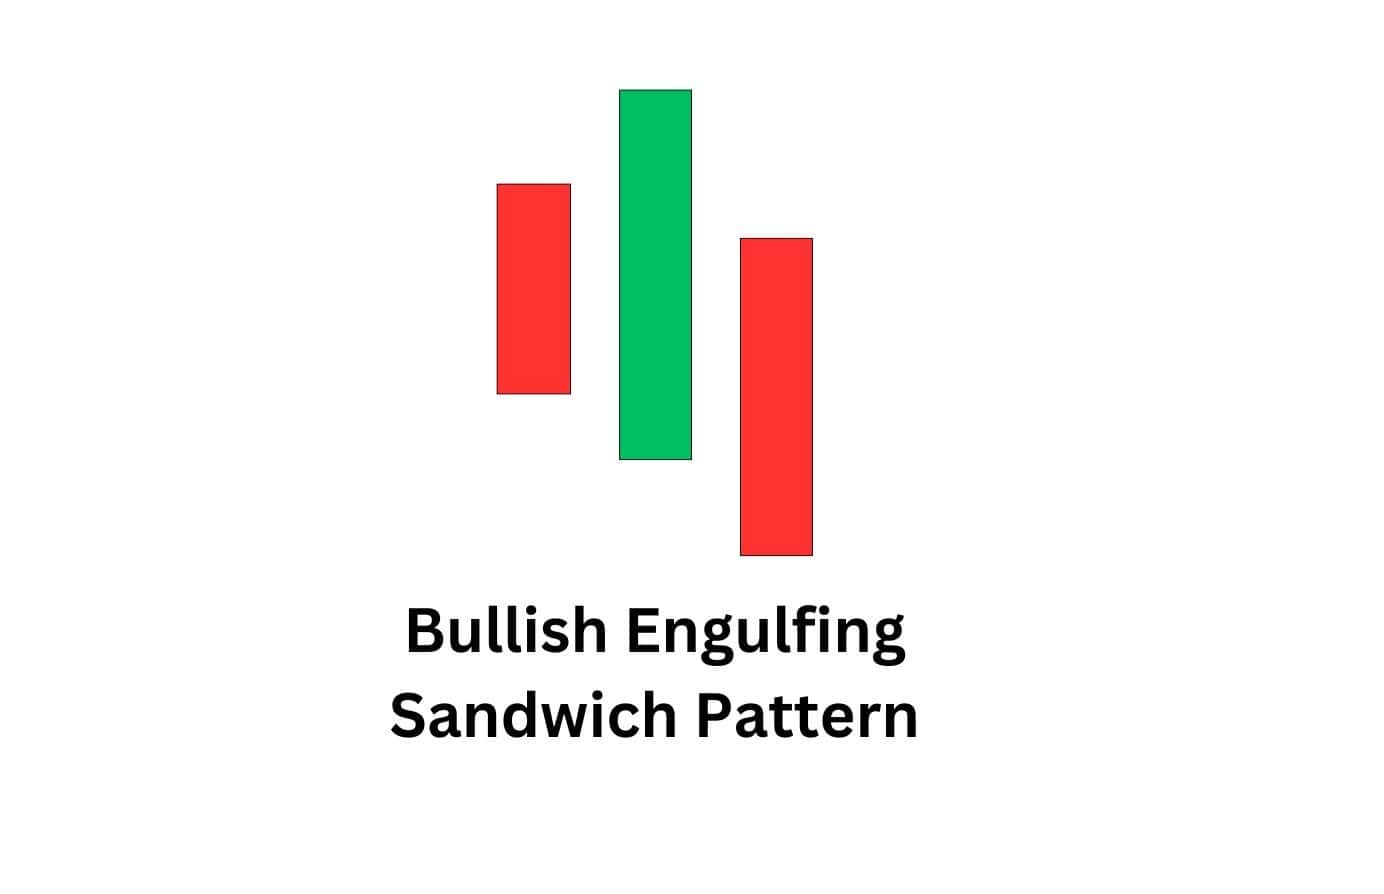
Why this candlestick pattern matters:
This setup suggests a brief attempt by buyers to regain control, but the failure to maintain the upward momentum signals that selling pressure remains strong. Traders see this pattern as a confirmation that the initial bullish move was short-lived, often using it as an opportunity to enter short trades once the second red candle closes lower.
22. Downside Gap Three Methods
Here’s how to identify this candlestick pattern:
This pattern appears in a downtrend and consists of three candles. The first is a strong bearish candle, followed by a second bearish candle that gaps down, confirming selling pressure. The third candle is a bullish one that closes within the second half of the first candle. Despite this upward movement, it does not signal a reversal—it’s a temporary pause before the downtrend resumes.
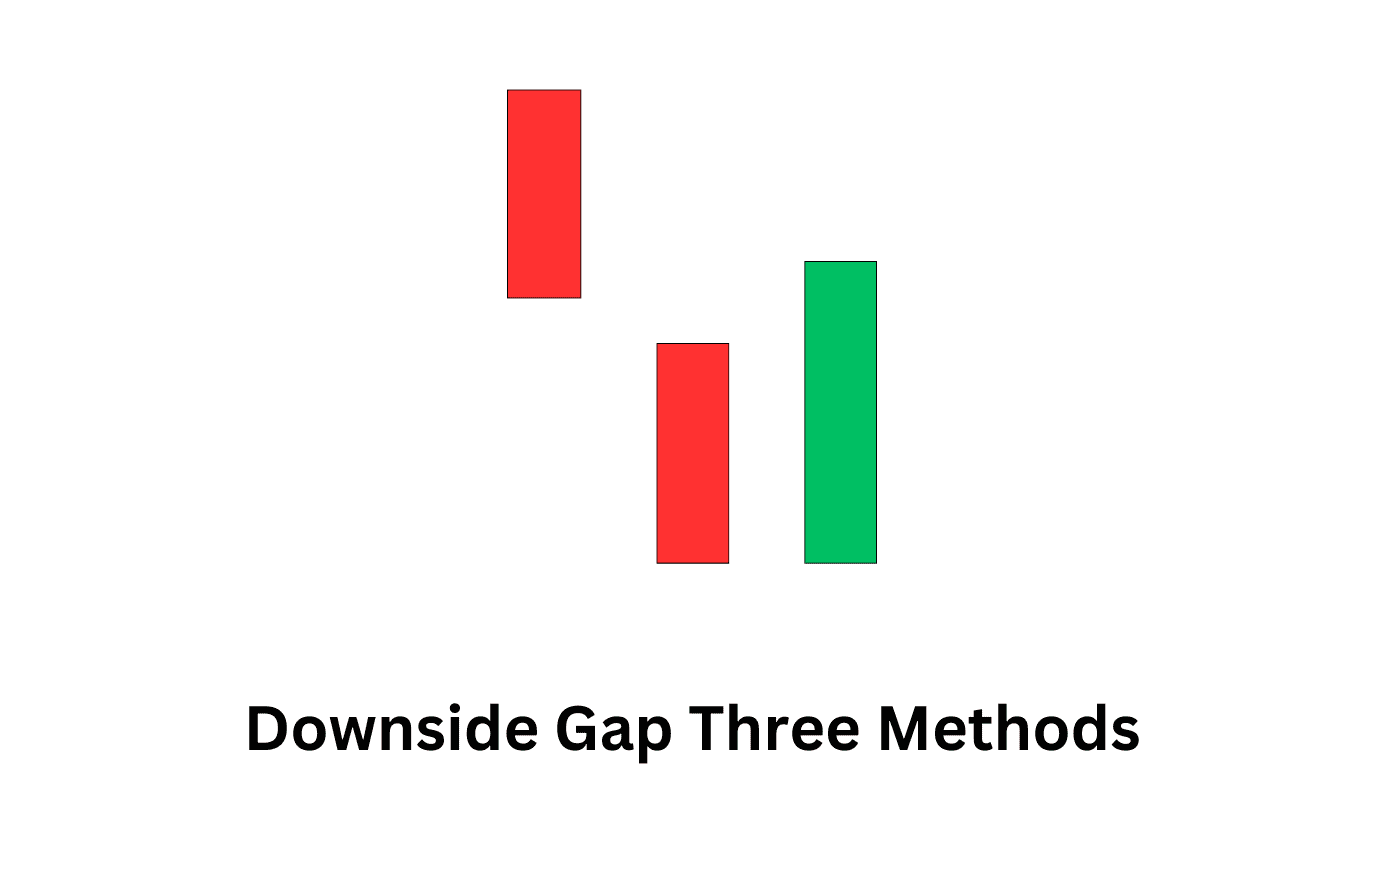
Why this candlestick pattern matters:
This setup suggests that sellers are still in control, even when buyers attempt to push prices higher. The gap between the first two candles shows strong bearish sentiment, and the inability of the third candle to break out signals that the downtrend is likely to continue. Traders use this pattern as a confirmation to hold short positions or look for re-entry points in a bearish market.
Bearish Multi-Candlestick Patterns
Multi-candlestick patterns capture a longer battle between buyers and sellers, revealing the bigger picture of where the market wants to move. These contrast with smaller candlestick patterns, which reveal a potential, immediate move — but does not signal the broader direction of the market.
In bearish setups, long spanning patterns can confirm when sellers have gained lasting control, often leading to stronger and more reliable downside moves. These are also known as Chart Patterns.
Here are the top bearish multi-candlestick patterns traders use.
23. Double Top
Here’s how to identify this candlestick pattern:
A double top appears after an uptrend and consists of two peaks at roughly the same level. Price rises to form the first peak, then pulls back before making a second attempt to break higher. If the second peak fails to push above the first and price declines again, the pattern is considered valid. The confirmation comes when price breaks below the low point between the two peaks, known as the neckline.
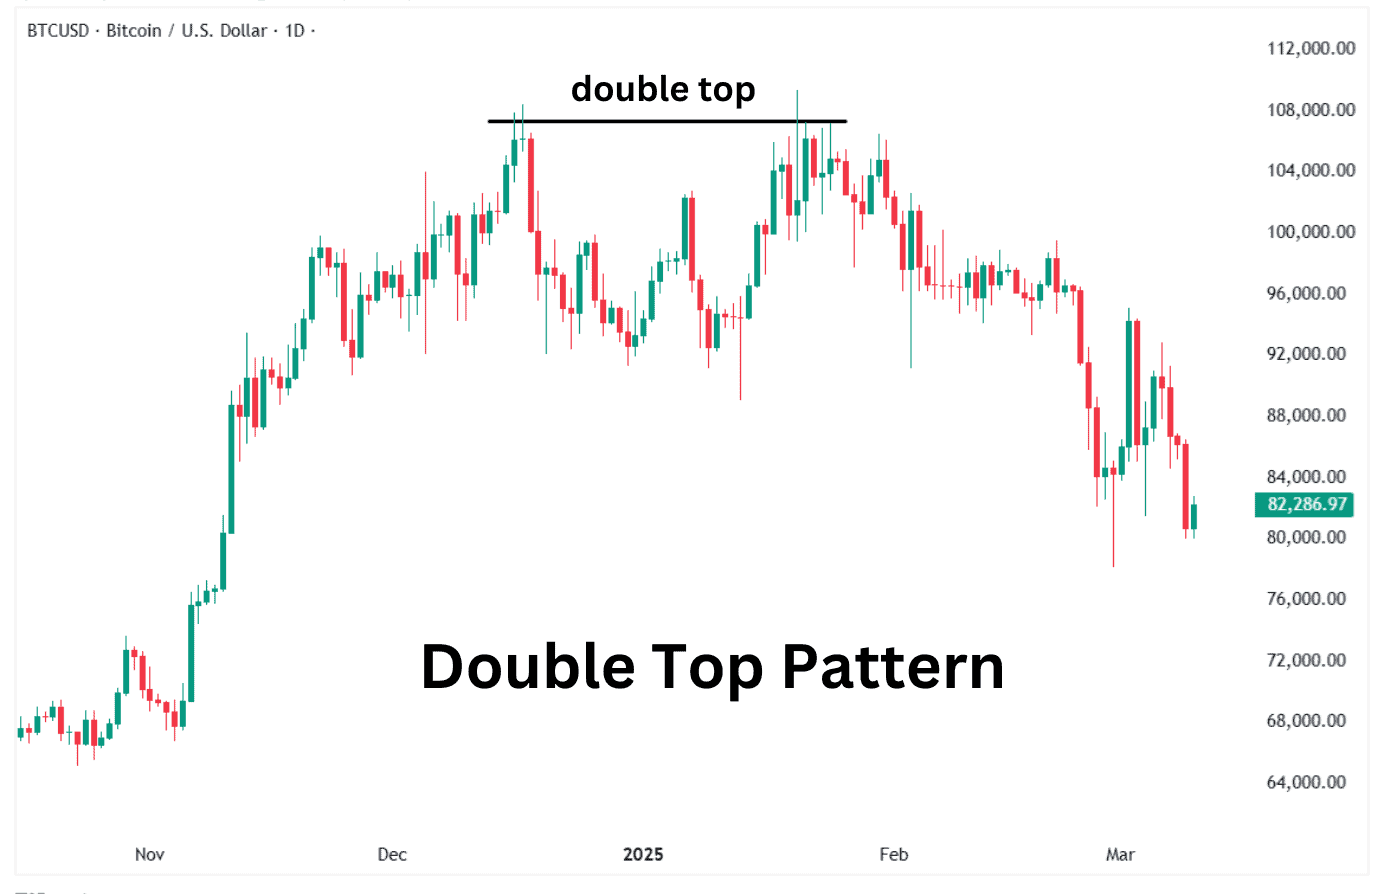
Why this candlestick pattern matters:
A double top signals that buyers have lost strength and are struggling to push the price higher. The inability to break past resistance shows exhaustion, and once price moves below the neckline, it confirms a shift toward bearish control. Many traders use this pattern to anticipate trend reversals, often entering short trades once the neckline is breached.
24. Triple Top
Here’s how to identify this candlestick pattern:
A triple top resembles a double top but consists of three peaks at a similar price level. Price attempts to break through resistance three times, failing each time before pulling back. The pattern is confirmed when price breaks below the lowest point between the peaks, signaling that sellers have taken control.
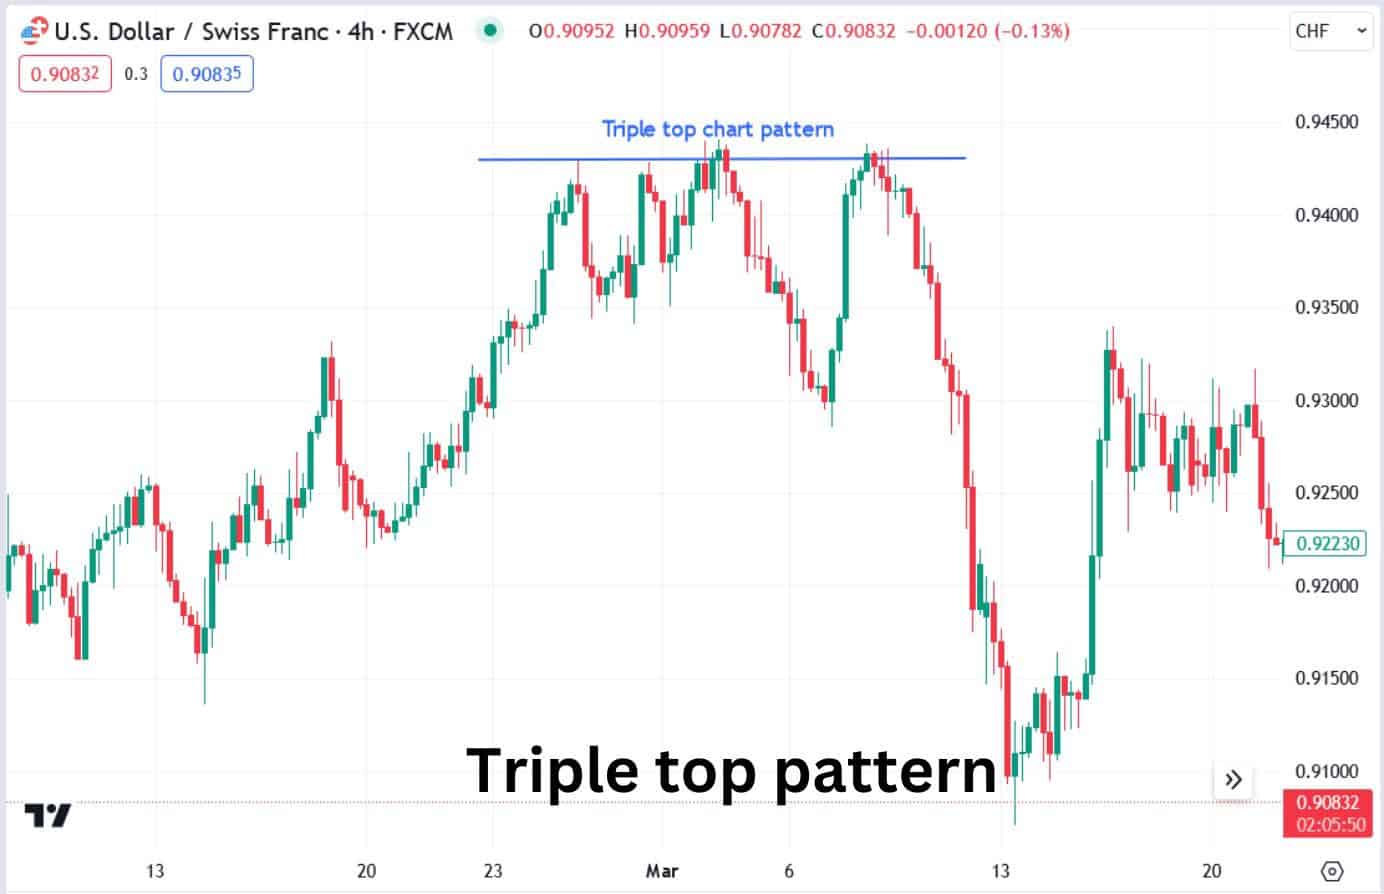
Why this candlestick pattern matters:
This formation indicates strong resistance at a particular level, showing that buyers are unable to sustain an upward move. Each failed breakout attempt weakens bullish momentum, and when price falls below the support level, it suggests a potential trend reversal. Traders use this breakdown as confirmation that the uptrend is over and bearish momentum is taking over.
25. Inverted Cup and Handle Pattern
Here’s how to identify this candlestick pattern:
The inverted cup and handle is a bearish reversal pattern that resembles an upside-down teacup. It starts with a rounded top, where price gradually curves downward, forming the inverted cup.
A brief consolidation follows, creating the handle, which takes the shape of a small upward or sideways pullback. The pattern is complete when price breaks below the handle’s support, confirming the continuation of the downtrend.
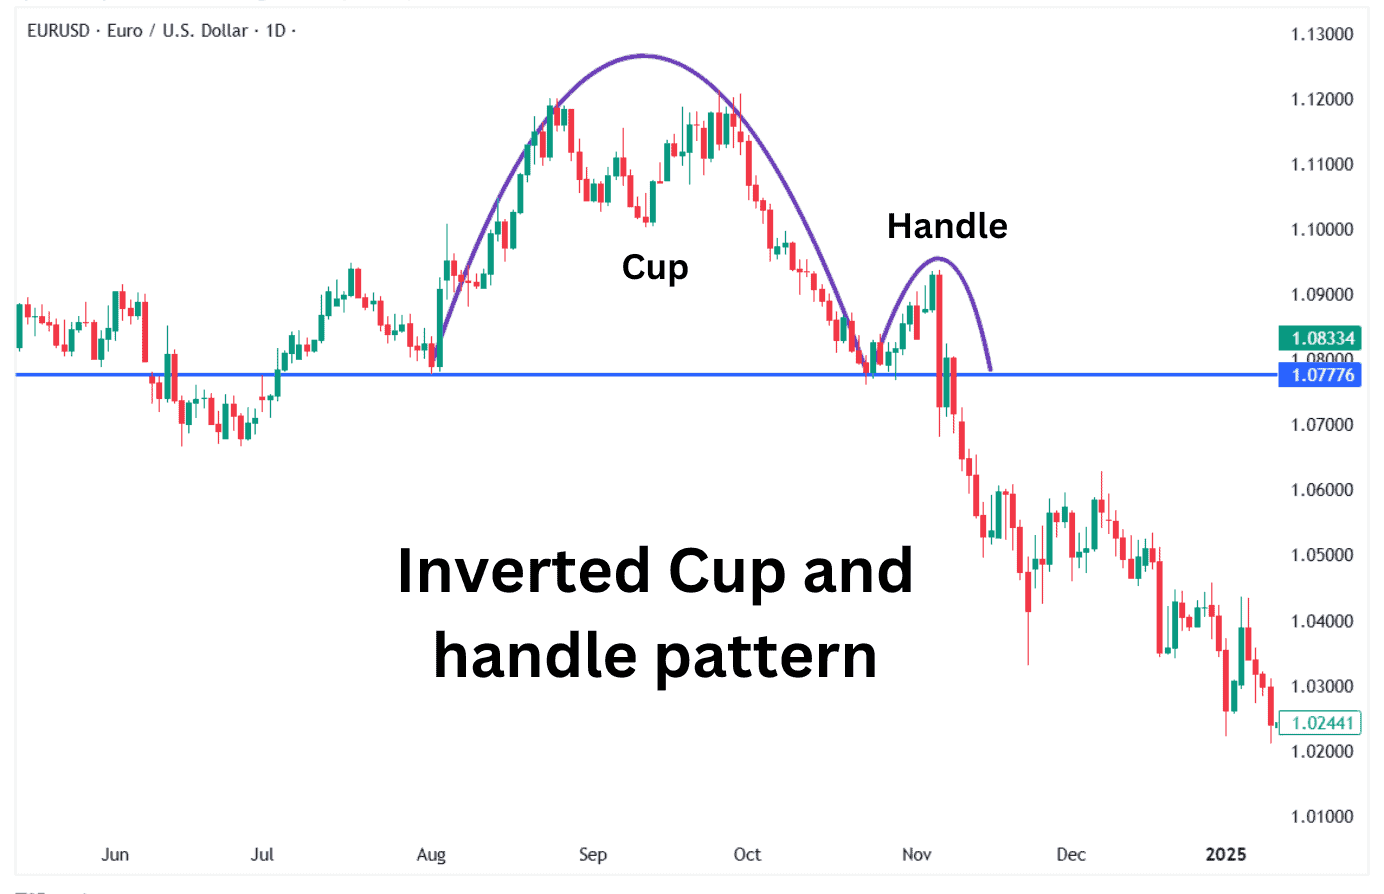
Why this candlestick pattern matters:
This setup suggests that an uptrend has weakened, and the market is preparing for further downside. The handle often tricks traders into thinking a recovery is underway, but when price fails to hold support, it signals that sellers are regaining control. A confirmed breakdown below the handle typically leads to a sharp decline, making this a key signal for traders looking to capitalize on bearish momentum.
26. Bear Flag
Here’s how to identify this candlestick pattern:
The bear flag pattern forms after a sharp drop in price, followed by a brief consolidation where the market moves slightly upward or sideways within a tight channel. The structure consists of a steep initial decline, known as the flagpole, and a weak retracement forming the flag. The pullback remains contained within parallel trendlines, showing that buying pressure is minimal.
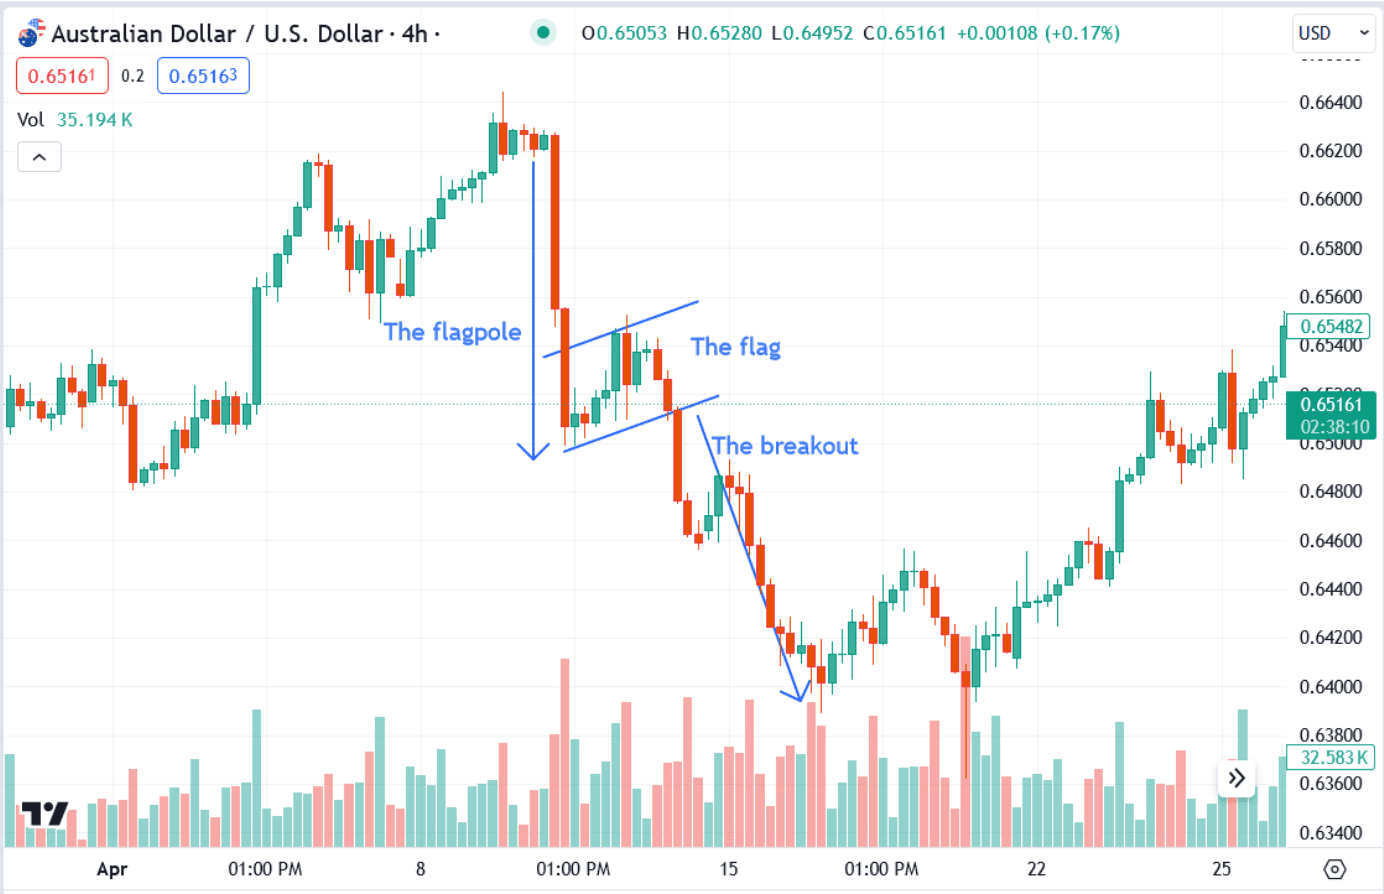
Why this candlestick pattern matters:
A bear flag suggests that sellers remain in control despite a short-term pause in the downtrend. The price struggles to push higher, and when it eventually breaks below the lower boundary of the flag, it signals a continuation of the decline. Traders look for this breakdown as confirmation of further downside, using it as a shorting opportunity to align with market momentum.
27. Bear Pennant
Here’s how to identify this candlestick pattern:
A bear pennant follows a sharp downward move, where price enters a brief consolidation in the form of a small symmetrical triangle.
Unlike a bear flag, which trends slightly upward, a pennant remains more balanced, with price making lower highs and higher lows. The range contracts as market participants wait for the next move.
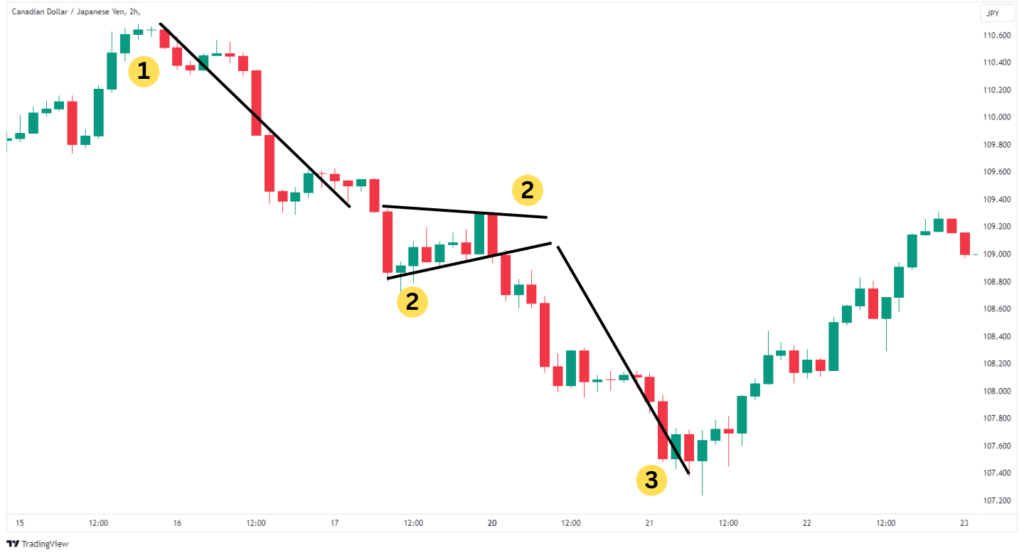
Alt text: Bear pennant pattern.
Why this candlestick pattern matters:
This pattern signals that the market is taking a short pause before continuing lower. The consolidation period does not indicate a reversal but rather a temporary slowdown before the selling pressure resumes. When price breaks below the lower boundary, it confirms that sellers are still in control, increasing the likelihood of further downside movement.
28. Head and Shoulders Pattern
Here’s how to identify this candlestick pattern:
The head and shoulders pattern consists of three peaks: a higher central peak (head) between two lower peaks (shoulders). A horizontal or slightly upward-sloping support line, known as the neckline, connects the low points between these peaks. The pattern is confirmed when price breaks below the neckline after forming the right shoulder.
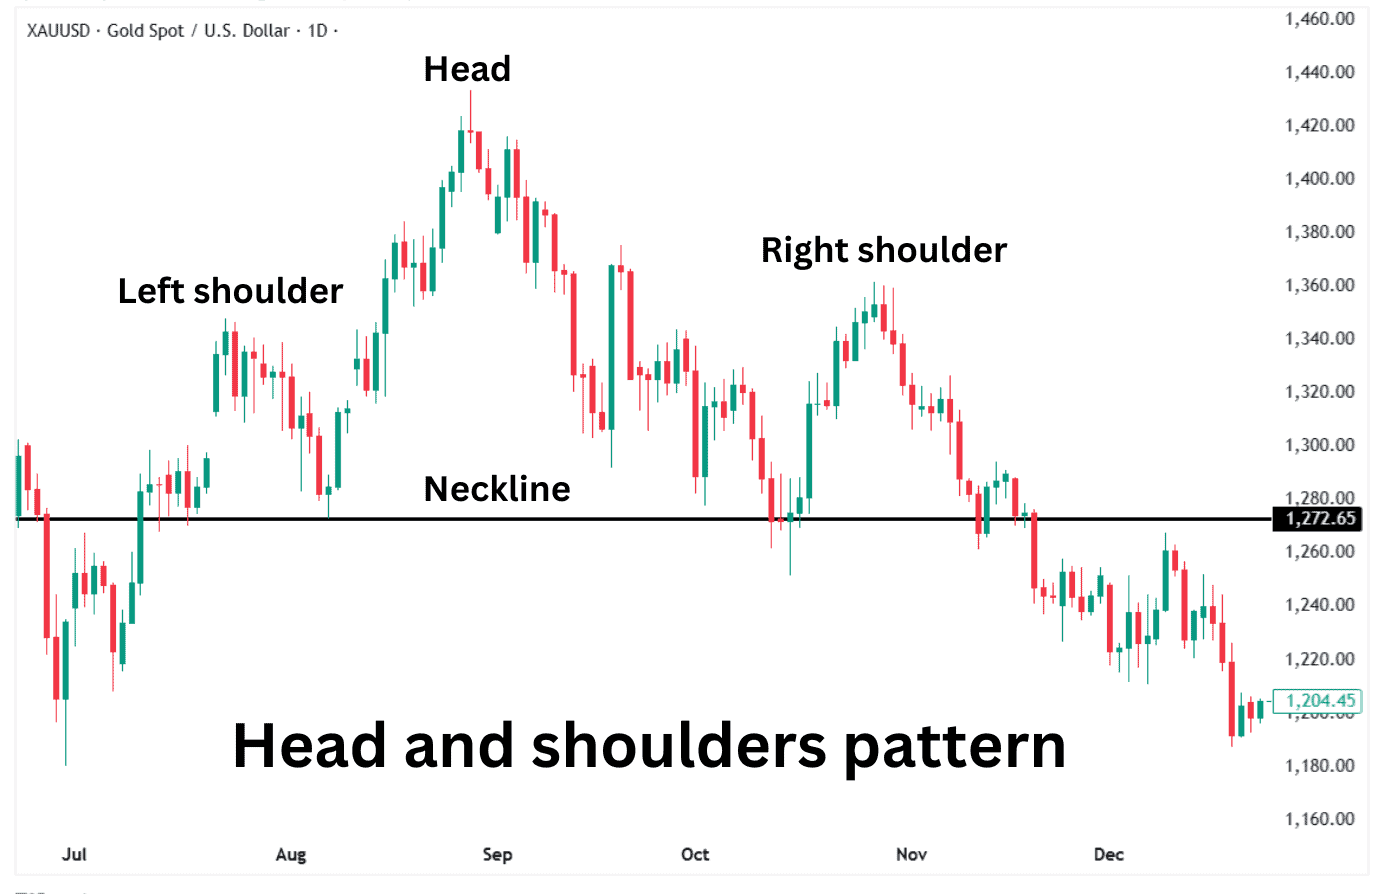
Why this candlestick pattern matters:
This structure signals a weakening uptrend and a potential trend reversal. The failure to push beyond the head’s high shows diminishing bullish strength, while the breakdown below the neckline confirms a shift toward selling pressure. Traders look for this pattern to anticipate a downward move, often using the distance between the head and neckline to estimate the decline’s potential.
29. Descending Triangle Pattern
Here’s how to identify this candlestick pattern:
A descending triangle forms when price creates a horizontal support level while making lower highs over time. The pattern consists of a flat bottom and a sloping downward trendline that connects the series of lower highs. This setup shows that selling pressure is increasing, as buyers fail to push the price higher. The structure remains valid as long as the price continues to respect both the support level and the descending resistance line.
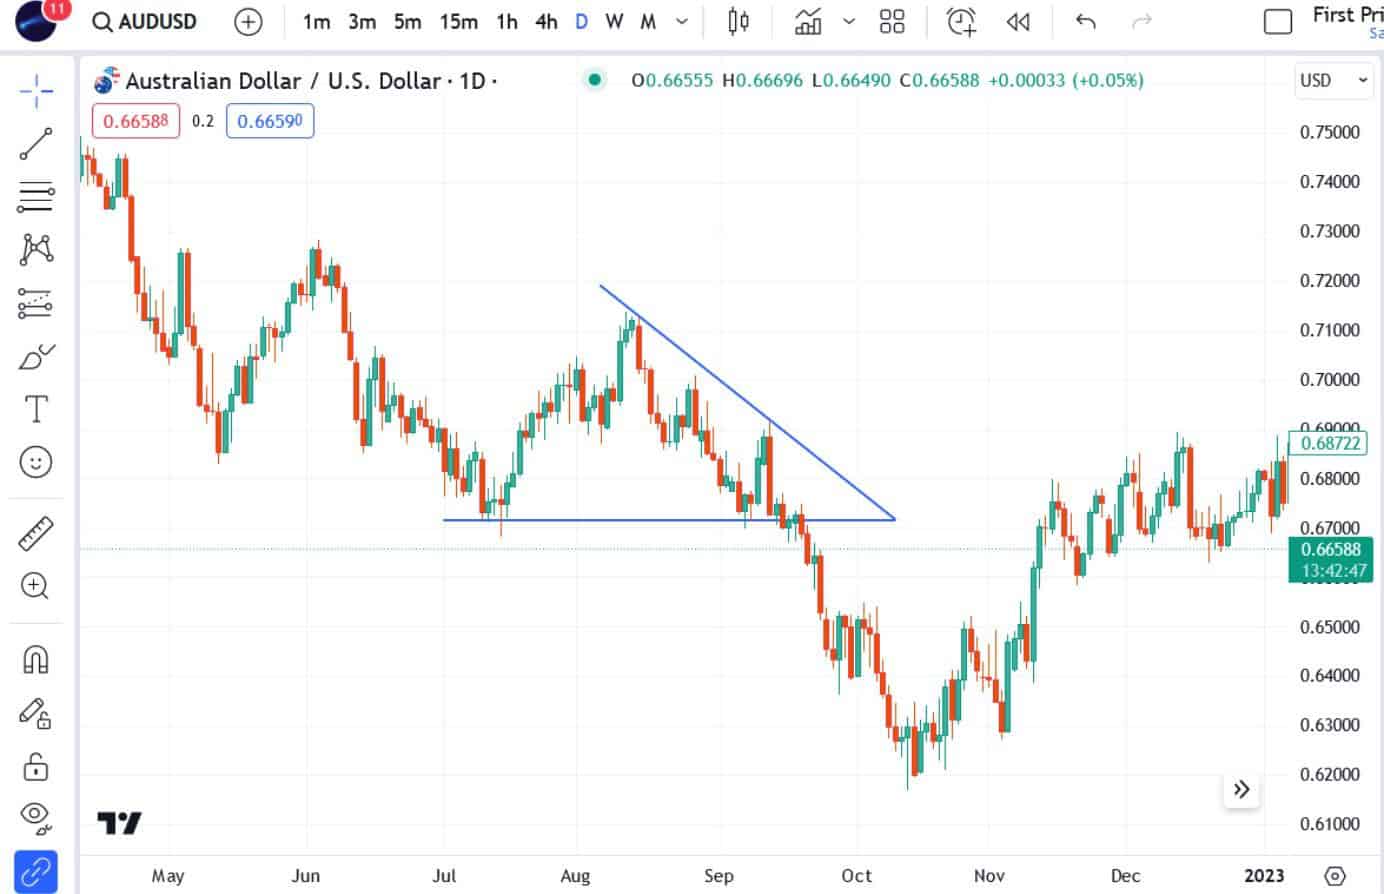
Why this candlestick pattern matters:
This pattern signals that sellers are gaining control, and a breakdown below the support level often leads to further downside. The longer price consolidates within the triangle, the stronger the breakout tends to be once support is breached. Traders watch for a decisive breakdown with increased volume, as this confirms that selling momentum is accelerating, providing an opportunity to enter short positions.
30. Rising Wedge
Here’s how to identify this candlestick pattern:
A rising wedge forms when price makes higher highs and higher lows, but the space between them narrows, creating a contracting structure. This pattern often appears near the end of an uptrend or within a bearish retracement, showing that buyers are losing strength. A drop in volume is common, signaling reduced conviction behind the upward move.
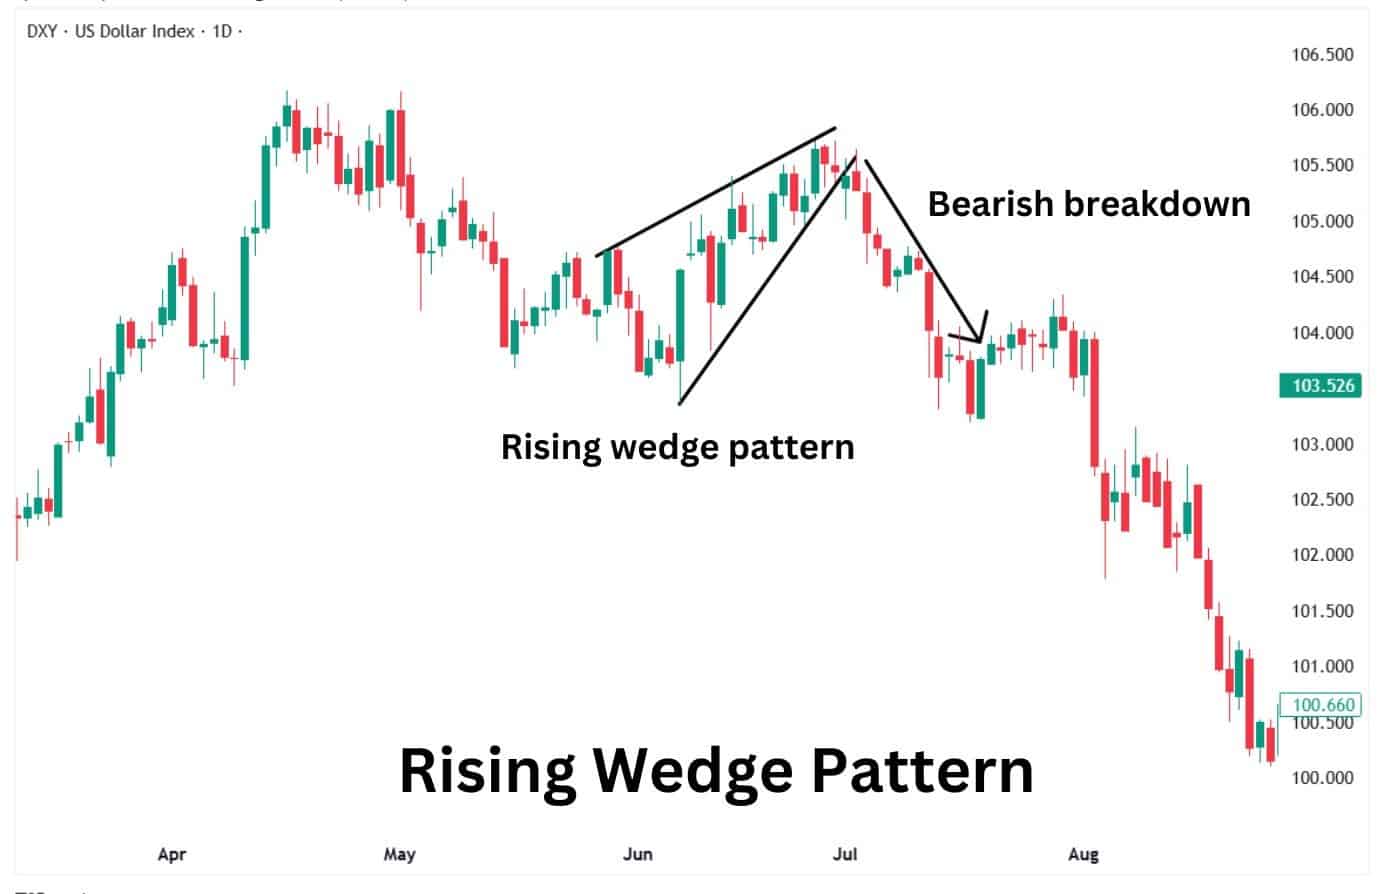
Why this candlestick pattern matters:
Despite the upward movement, a rising wedge is a bearish signal. The narrowing price range reflects hesitation, and once the price falls below the lower boundary, it suggests a shift in control toward sellers. Traders monitor this pattern closely, as a breakdown often leads to an accelerated decline, confirming that the earlier buying pressure was fading.
31. Island Top Pattern
Here’s how to identify this candlestick pattern:
An island top forms when a group of candles is isolated from the main price action due to gaps on both sides. The pattern starts with a gap up, where price moves higher and trades within a range before a gap down occurs, separating this cluster of candles from the broader trend. The key characteristic is that the gaps leave little opportunity for traders to exit before the reversal is confirmed.
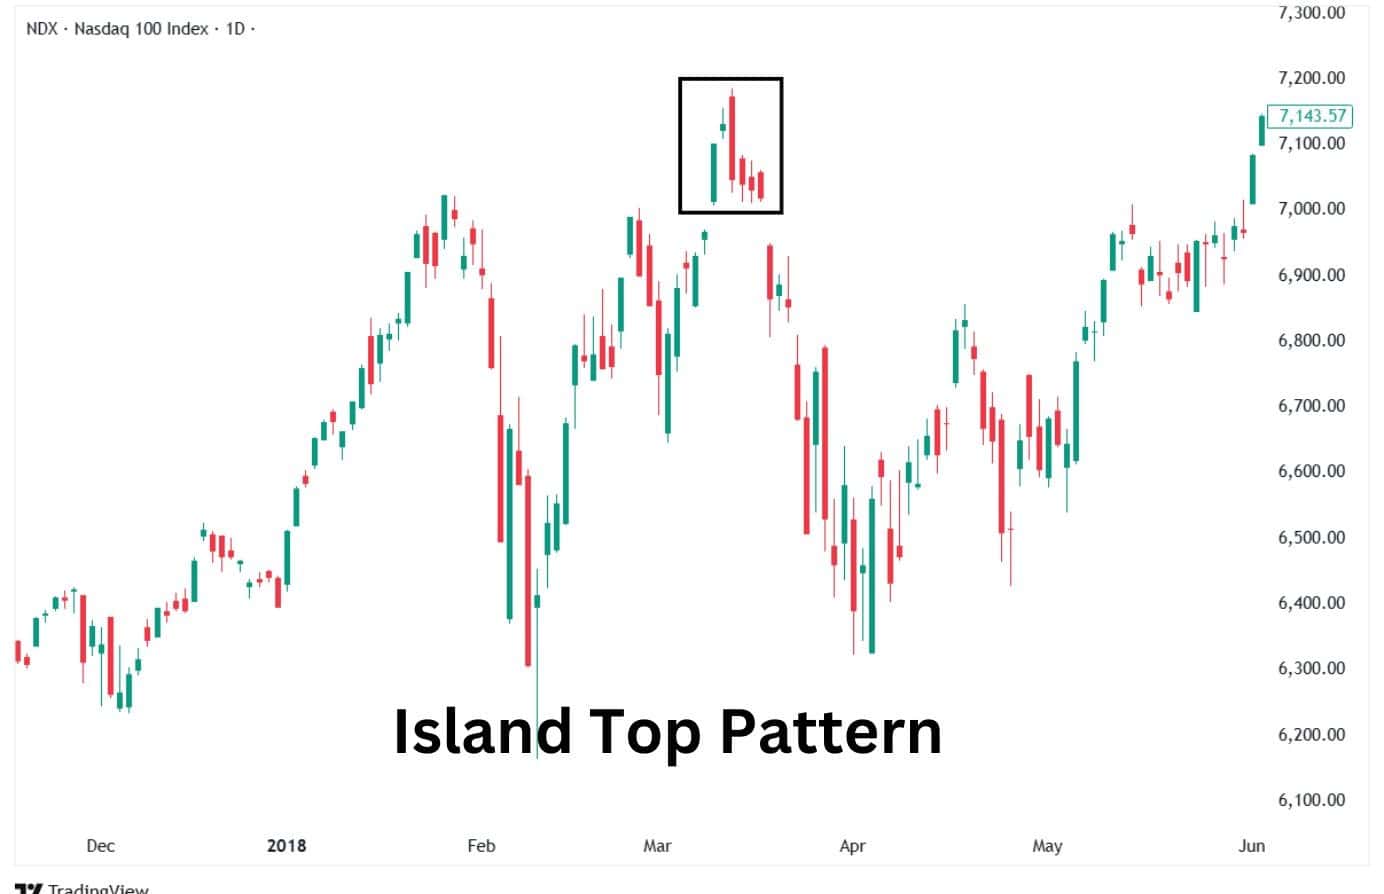
Why this candlestick pattern matters:
This setup signals that bullish momentum has faded, leading to a sudden shift in market sentiment. The gap down confirms that buyers have lost control, and price is likely to continue declining. Traders watch for this pattern as a strong bearish reversal signal, often waiting for additional confirmation before entering short positions.
32. Shrinking Candlestick Pattern
Here’s how to identify this candlestick pattern:
This pattern is characterized by a series of candles that progressively decrease in size, indicating a loss of momentum. The sequence can occur in either an uptrend or a downtrend, with each new candle having a smaller range than the previous one. The key feature is that price movement becomes increasingly weaker, showing hesitation among market participants.
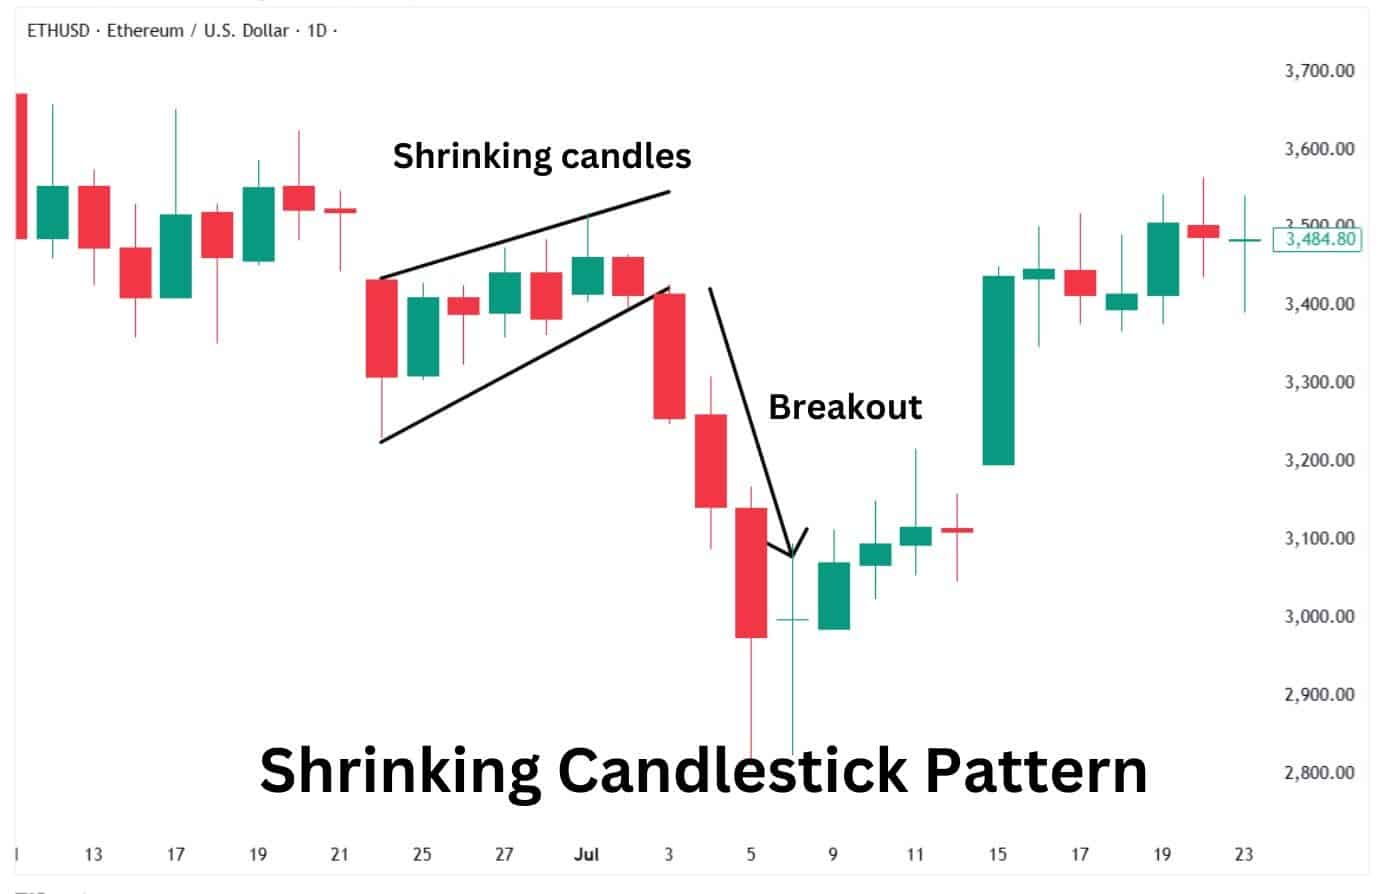
Alt text: Shrinking candlestick pattern.
Why this candlestick pattern matters:
Shrinking candles suggest that the current trend is losing strength, increasing the likelihood of a reversal or consolidation. If this pattern appears near key resistance or support levels, it often signals an upcoming breakout or trend change. Traders use this as a warning to adjust their positions, either locking in profits or waiting for stronger confirmation before taking new trades.
33. Falling Three Methods
Here’s how to identify this candlestick pattern:
This pattern consists of five candles, beginning with a strong red candle, followed by three smaller candles that move within its range, and ending with another strong red candle breaking lower. The middle candles represent a temporary pause, where buyers attempt to push back but fail to close above the first bearish candle. Their small bodies and wicks indicate uncertainty rather than strength.
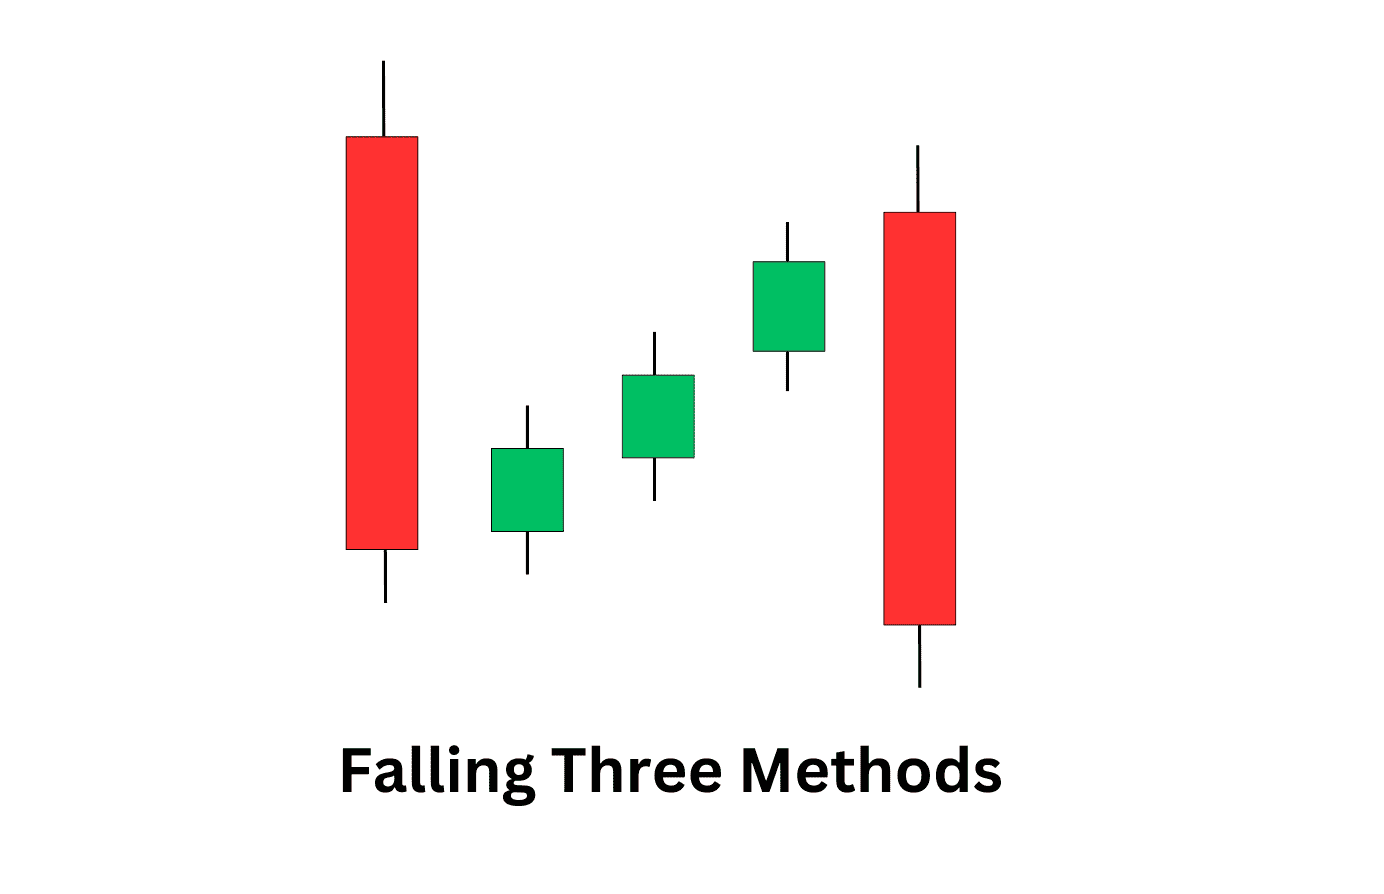
Why this candlestick pattern matters:
The falling three method confirms that the downtrend remains intact despite a brief period of indecision. The final bearish candle reinforces the dominance of sellers, signaling that the market is likely to move lower. Traders view this setup as a continuation pattern, waiting for the breakdown as a sign to enter short positions in anticipation of further declines.
Advantages of Using Bearish Candlestick Patterns
Early Warning of Market Reversals:
Bearish candlestick patterns indicate weakening buying momentum and increasing selling pressure, allowing traders to anticipate potential downtrends before they fully develop.
Clear Entry and Exit Points:
These patterns provide structured setups with precise entry and stop-loss placements. Bearish formations at resistance levels help traders manage risk effectively.
Effective in Multiple Timeframes:
Bearish candlestick patterns work across different timeframes, making them useful for short-term and long-term traders. A strong formation on a daily or weekly chart increases confidence.
Combines Well with Other Indicators:
When paired with technical indicators like RSI, MACD, or volume analysis, bearish patterns become more reliable, strengthening confirmation for trade decisions.
Helps Traders Avoid Buying at the Wrong Time:
Recognizing bearish candlestick patterns prevents traders from entering long positions when market conditions suggest a potential reversal, reducing unnecessary losses.
Disadvantages of Using Bearish Candlestick Patterns
False Signals in Choppy Markets:
In sideways or low-volume conditions, bearish patterns can produce misleading signals, leading traders to enter premature short positions without follow-through.
Requires Context for Accuracy:
A bearish pattern alone isn’t enough to confirm a reversal. It must appear in the right market structure, such as near resistance or after an extended uptrend.
Less Reliable in Strong Uptrends:
During strong bullish trends, bearish candlestick patterns often fail as buying pressure absorbs selling attempts, causing false breakdowns and short squeezes.
Dependent on Confirmation:
Bearish patterns need confirmation from the following candles to validate their signal. Without follow-through, traders may misinterpret temporary pullbacks as trend reversals.
Market Conditions Can Change Quickly:
Even after a valid bearish pattern forms, sudden news events or unexpected buying pressure can invalidate the setup, making it difficult to rely on patterns alone.
How to Identify Bearish Patterns
Recognising the Shift in Momentum:
Bearish candlestick patterns form when buyers start losing control, and sellers step in with increasing pressure. Look for key signals such as long upper wicks, engulfing red candles, or patterns that appear at resistance levels after a strong uptrend. Common bearish patterns like the shooting star, evening star, and bearish engulfing indicate that the market may be preparing to move lower.
Confirming the Bearish Signal:
A single bearish candle isn’t always enough to confirm a downtrend. Traders look for additional factors like high trading volume on bearish candles, failed attempts to push higher, or confirmation from technical indicators. If price closes below a key support level after forming a bearish pattern, it strengthens the case for further downside movement.
Putting Bearish Candlestick Patterns into Practice
Using Patterns for Trade Entries and Exits:
Traders use bearish candlestick patterns to identify ideal points to enter short trades or exit long positions. If a bearish pattern appears at a resistance level and is followed by a confirmation candle, it suggests that sellers are gaining control. Stop-loss orders can be placed above the pattern’s high to manage risk effectively.
Combining Bearish Patterns with Other Tools:
No pattern works in isolation, so traders often pair bearish candlestick formations with trend analysis, moving averages, or momentum indicators like RSI and MACD. When a bearish pattern aligns with overbought conditions or bearish divergence, the signal becomes stronger. This combination helps traders filter out false signals and make more confident decisions.
Bearish Candlestick Patterns – Continuations vs. Reversals
Understanding Continuation Patterns:
Continuation patterns suggest that the current downtrend will persist after a brief pause. Bearish formations like the falling three methods or bear flag indicate that sellers are taking a break before pushing the price lower. These patterns typically form within established downtrends and signal a continuation of selling pressure.
Spotting Reversal Patterns:
Reversal patterns signal a shift from an uptrend to a downtrend. The head and shoulders, evening star, and bearish engulfing patterns suggest that buyers are losing control, and a new bearish trend may begin. These patterns gain more significance when they appear near key resistance levels or after a prolonged bullish run.
FAQs
What is the most bearish candlestick pattern?
The bearish engulfing pattern is one of the strongest because it completely overtakes the previous candle, signaling aggressive selling pressure. It often appears at the end of an uptrend, confirming a potential reversal.
What is the best timeframe to use bearish candlestick patterns?
Bearish patterns work across all timeframes, but higher timeframes like the 4-hour, daily, and weekly charts provide stronger signals. Shorter timeframes can be useful for scalping, but they often produce more false signals.
What is the 3 candle rule in trading?
The 3 candle rule suggests waiting for three consecutive candles to confirm a trend change or continuation. It helps traders avoid false breakouts by ensuring that price action follows through after a pattern forms.
What conditions should be met for a pattern to be considered a bearish reversal?
A bearish reversal pattern is stronger when it appears at a key resistance level, follows an extended uptrend, and is confirmed by a strong red candle with high volume. Additional confirmation comes from indicators like the RSI showing overbought conditions.
How do volume-based indicators help in confirming reversals?
Volume indicators, like On-Balance Volume (OBV) or Volume Profile, confirm reversals when selling pressure increases as a bearish pattern forms. A high-volume bearish candle suggests strong conviction, making the reversal more reliable.
Do professional traders use candlestick patterns?
Yes, but they don’t rely on them alone—they combine them with trend analysis, key levels, and indicators to improve accuracy. Professionals use candlestick formations as part of a broader strategy rather than as standalone signals.
Are there certain market conditions where candlestick patterns are more effective?
Candlestick patterns work best in trending markets where momentum is clear and breakouts have the potential to follow-through. In sideways or choppy markets, patterns are less reliable because price movements lack strong direction.


