


Written by:

Reviewed by:

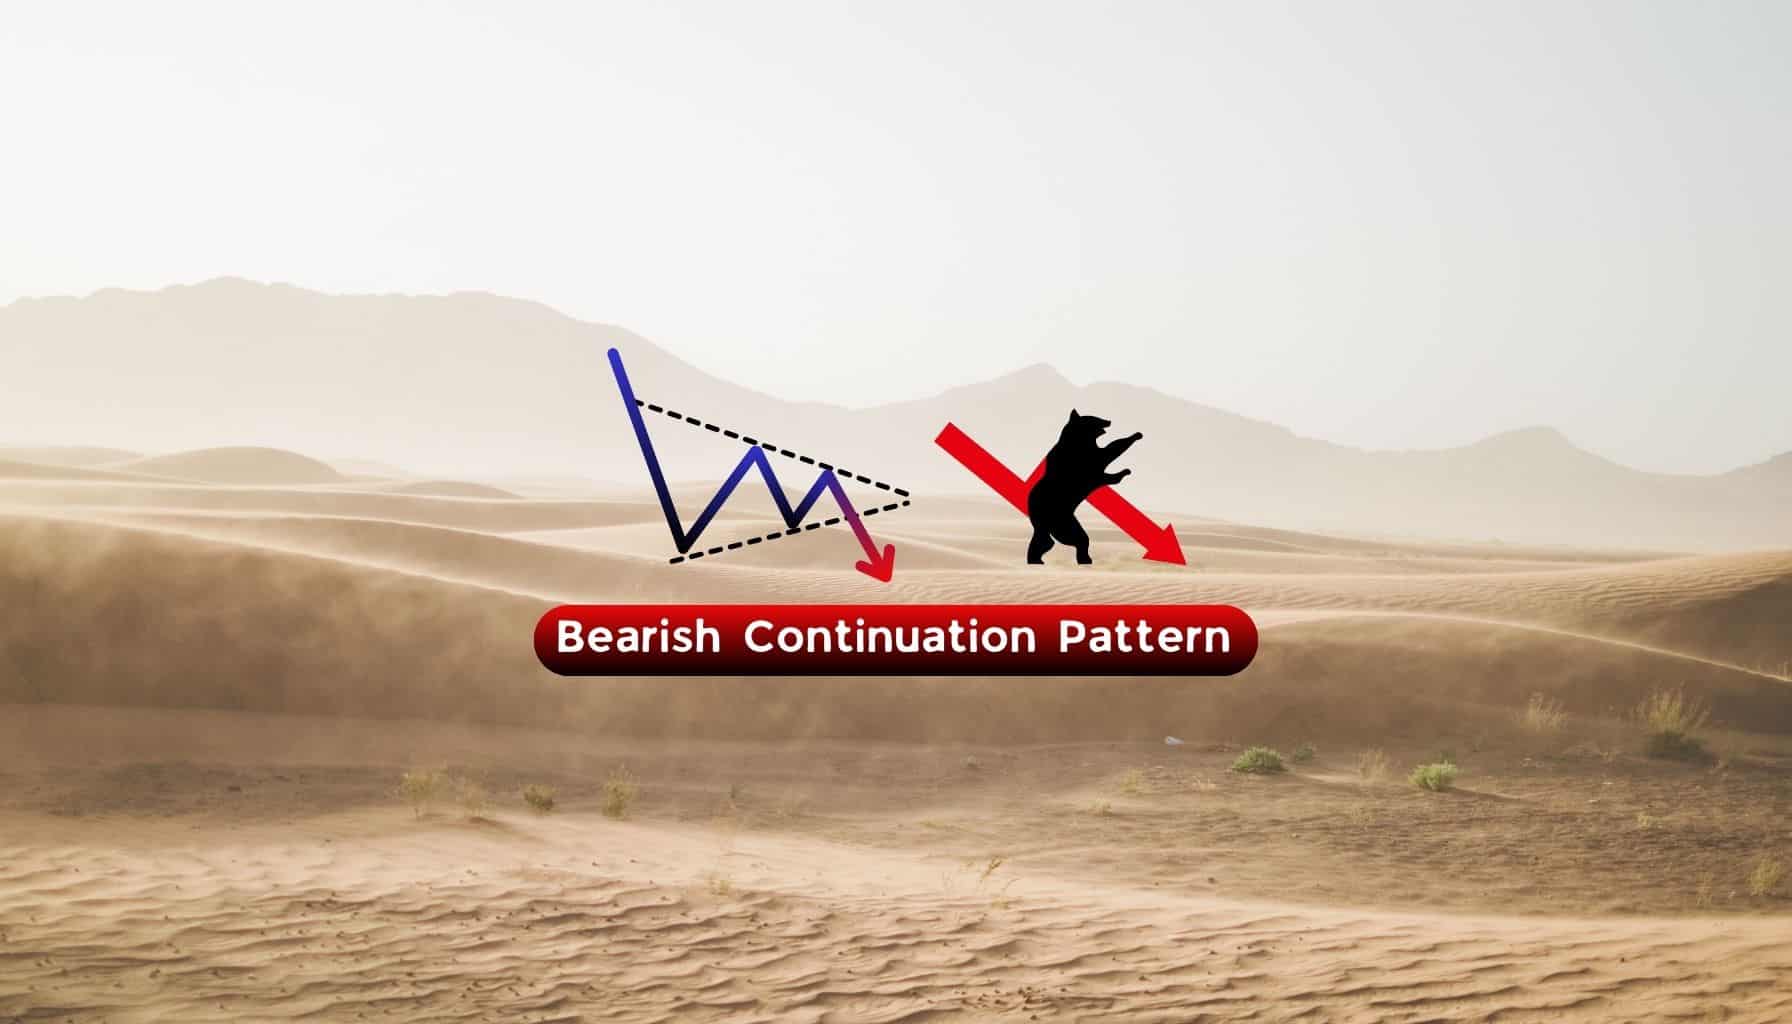
Bearish
- May 10, 2024
- 14 min read
Bear Pennant Pattern Complete Trading Guide
What is the Bear Pennant Pattern?
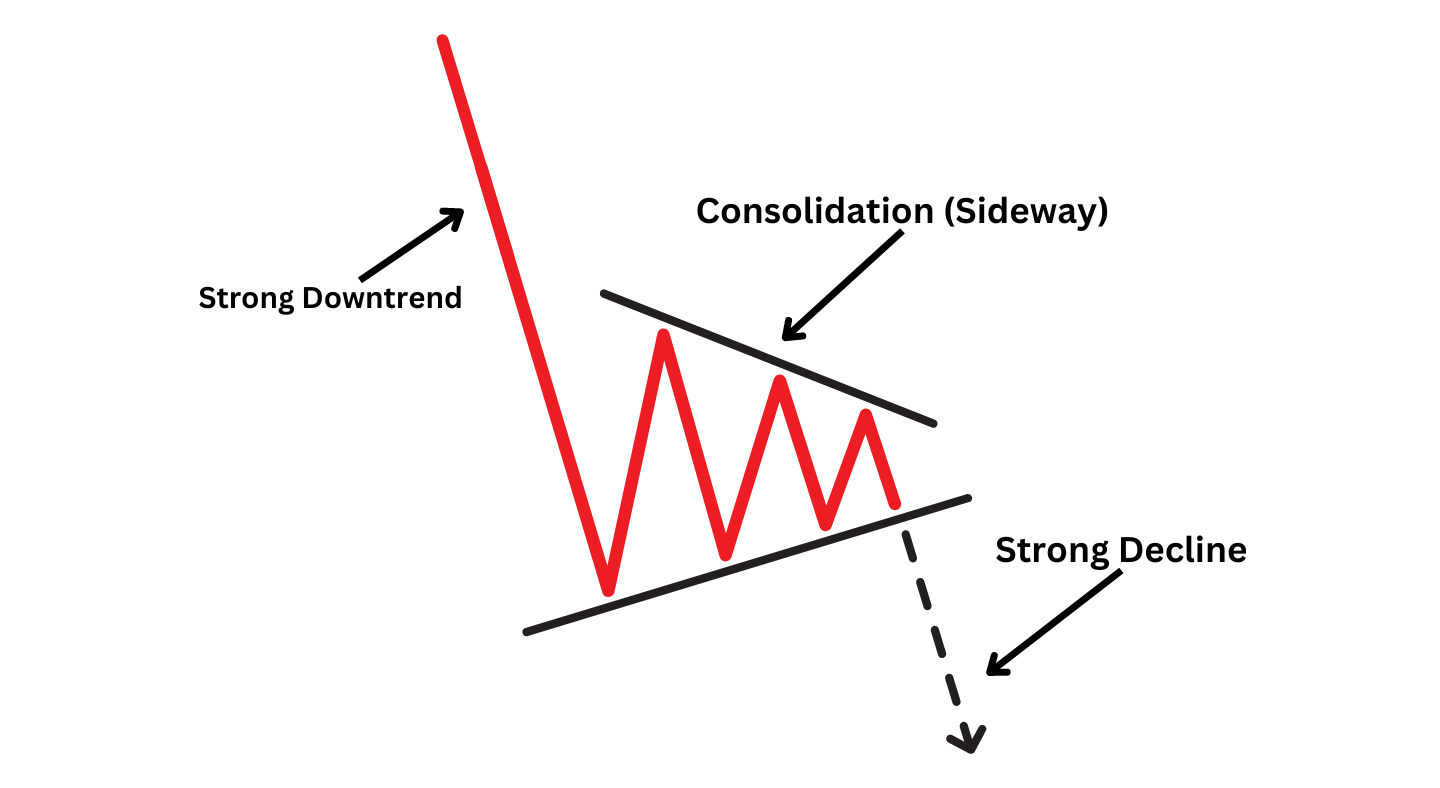
A bear pennant is a chart pattern that technical traders use to signal when the market is likely to decline. This pattern forms during a prevailing downtrend, characterized by two main phases; a significant initial drop and a subsequent period of consolidation.
The pattern begins with the price experiencing an obvious decline due to strong selling pressure, indicating the dominance of sellers over buyers.
After a sharp decline, the market enters a phase of consolidation. In this particular period, prices move sideways or slightly upward. This results from sellers pausing after the initial drop and some buyers entering the market to close out shorts or try to bottom-pick prices. Most everyone is waiting and observing, leading to a sideways consolidation on a lack of volume.
Then, sellers re-engage in the market and push to new lows. The bear pennant pattern completes with a breakout below the consolidation’s lower boundary. Traders can use this signal to enter short positions as the bearish trend resumes.
How to Identify Bearish Pennants
Identifying a bearish pennant involves recognizing its unique characteristics within the three phases:
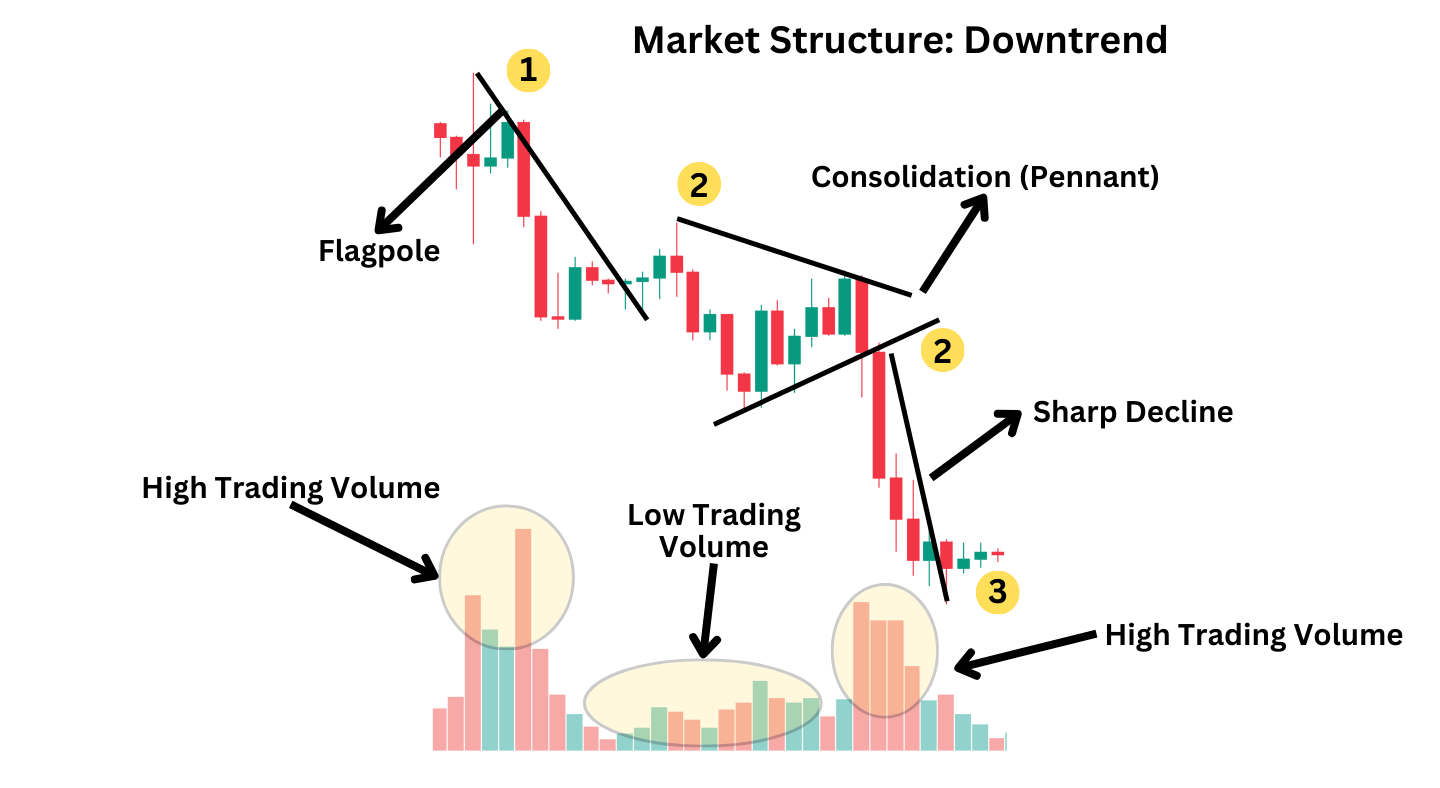
Phase One: The Initial Drop
During this phase, the market experiences a bearish trend, where sellers take control over the buyers and push prices down rapidly. The “flagpole” of the pennant is formed during this period, often accompanied by a spike in trading volume, confirming the bearish trend.
Phase Two: The Consolidation (Pennant Formation)
The market goes into a consolidation phase, commonly called the “pennant.” During this phase, prices tend to move sideways or upwards, forming a small triangle or pennant-shaped pattern. This period indicates a balance of power between the buyers and sellers, leading to decreased trading volume as the market awaits.
Phase Three: The Continuation Breakout
The bearish pennant pattern is considered complete when the lower boundary is broken, indicating a continued bearish trend. This is generally accompanied by a surge in trading volume, which strengthens the bearish sentiment in the market and suggests that sellers are taking charge again.
Trading the Bear Pennant Pattern
A strategic approach is necessary when trading the bear pennant pattern, just like with any other chart pattern.
Identify the Market Trend: It is important to confirm that the market is experiencing a bearish phase since the bear pennant is a pattern that occurs during a continuing downtrend. Look for a prolonged price decline, which suggests market sentiment is bearish.
Spotting the Pennant: After a sharp downward trend, keep an eye out for a consolidation phase, which takes the shape of a pennant. This consolidation should be relatively small and not retrace more than 50% of the initial drop to maintain the downtrend’s integrity.
Entry Point: The pattern signals a trade when the price breaks below the lower boundary of a pennant. However, wait for a candle to close below the pennant to avoid false breakouts and confirm the presence of strong bearish momentum.
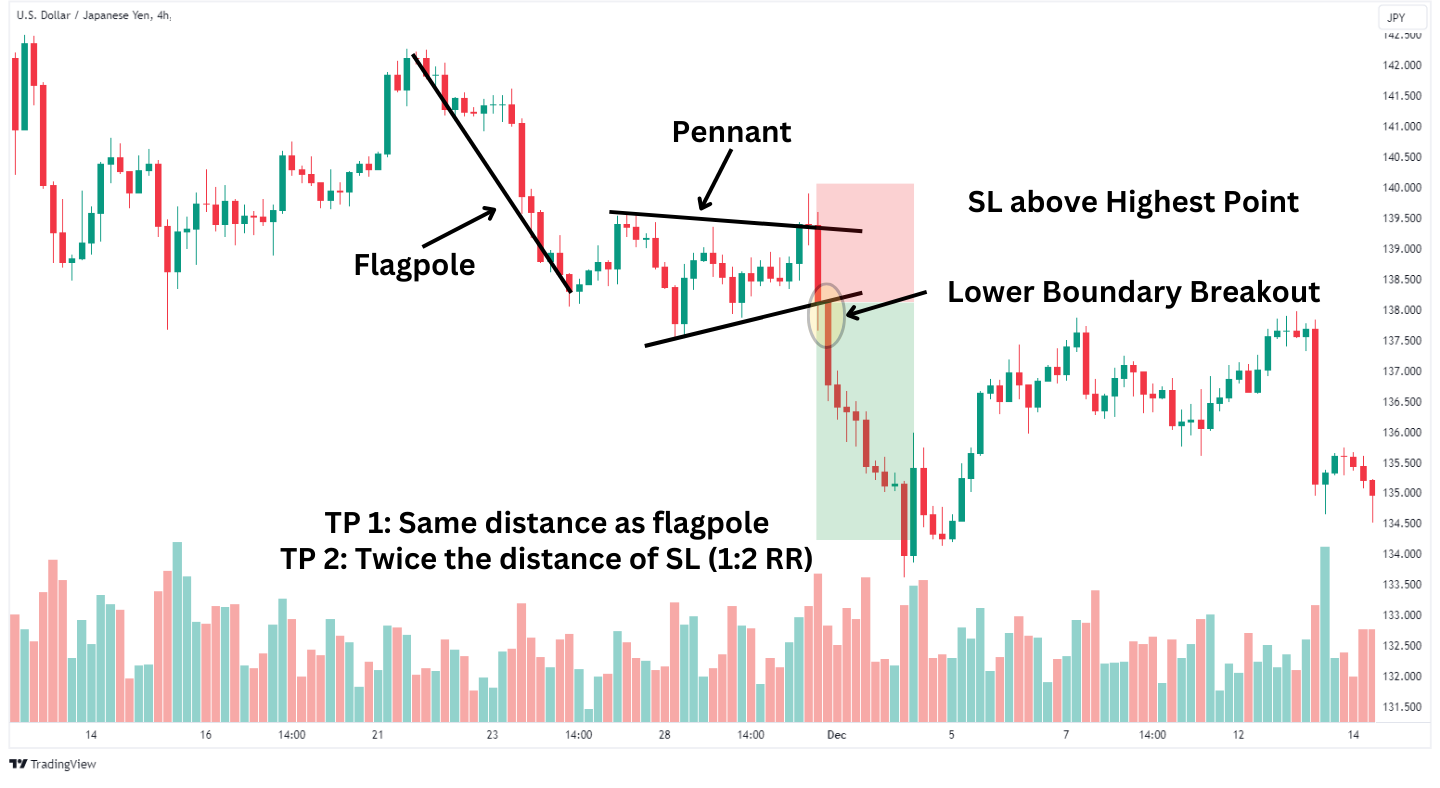
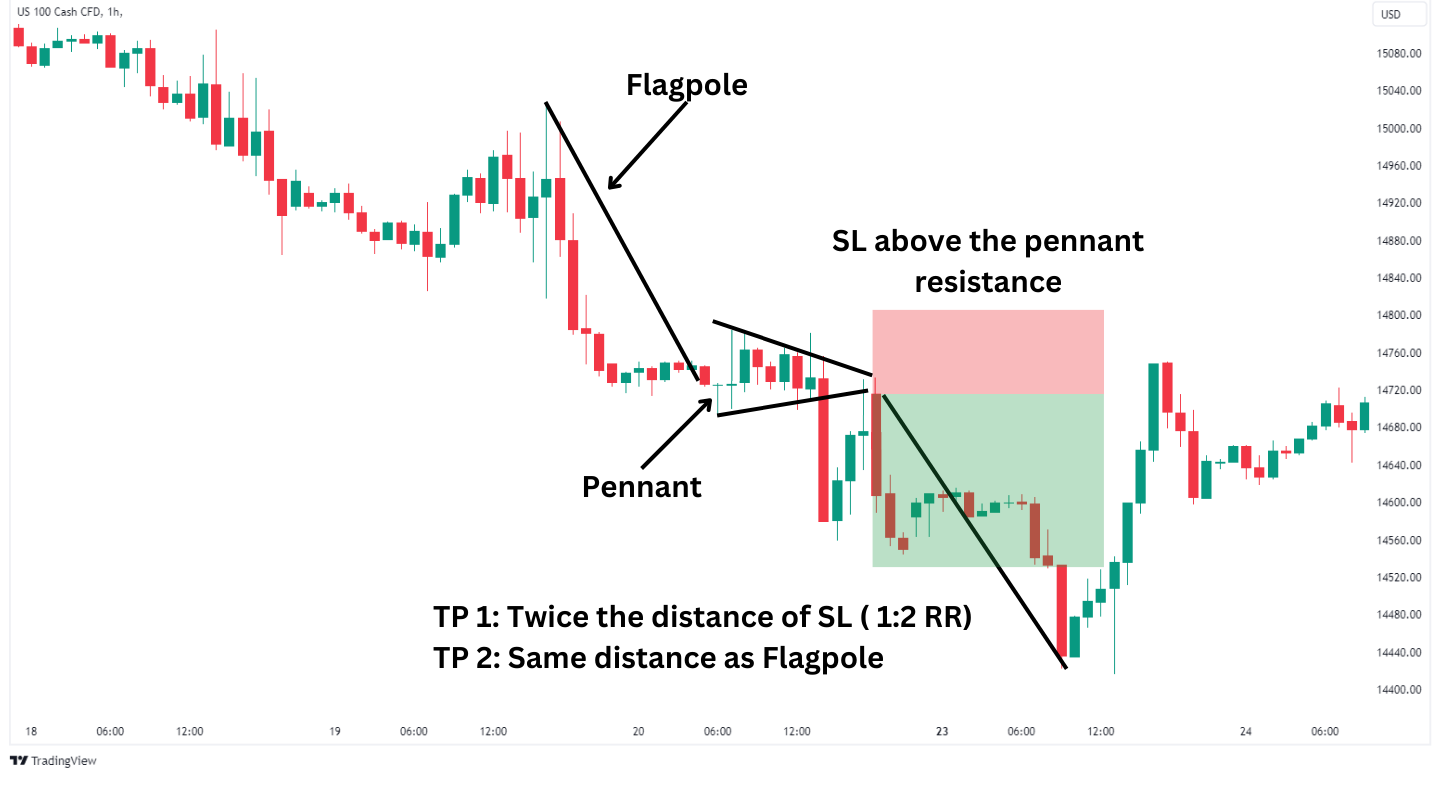
Stop Loss: To effectively manage risk, place a stop loss just above the highest point within the pennant. This location safeguards your trade against the possibility of the pattern failing and the price moving against the anticipated direction.
Take Profit: To estimate the take profit level, you need to measure the flagpole’s length. Then, project this distance downwards from the breakout point. The measured move helps establish a take profit level suggesting the pennant triangle is the midpoint of the pattern.
Bear Pennant Pattern Example
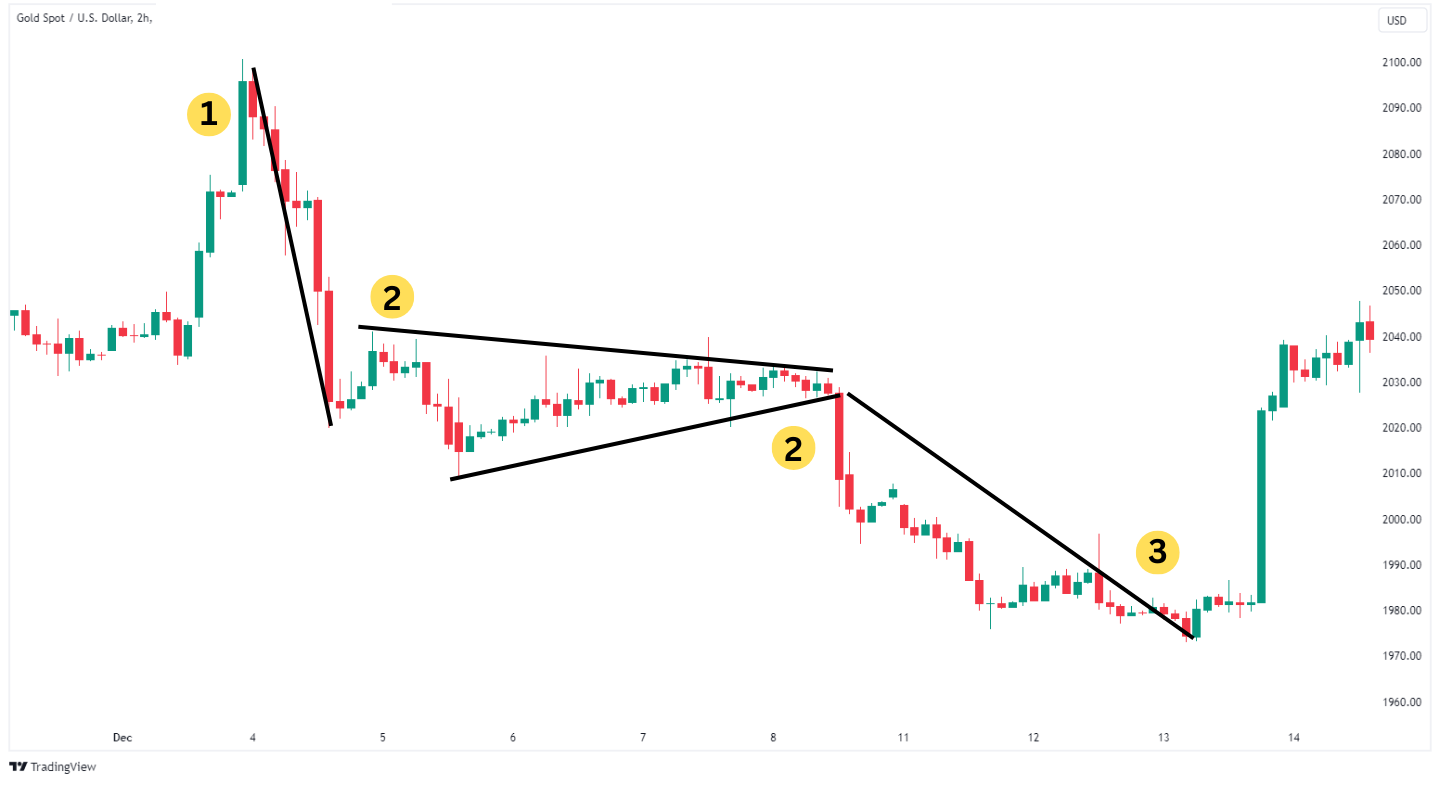
The 2-hour Gold chart above shows the formation of a bear pennant where there was a strong decline in prices followed by a deep consolidation. The pattern was complete with a strong breakout below the lower boundary of the pennant.
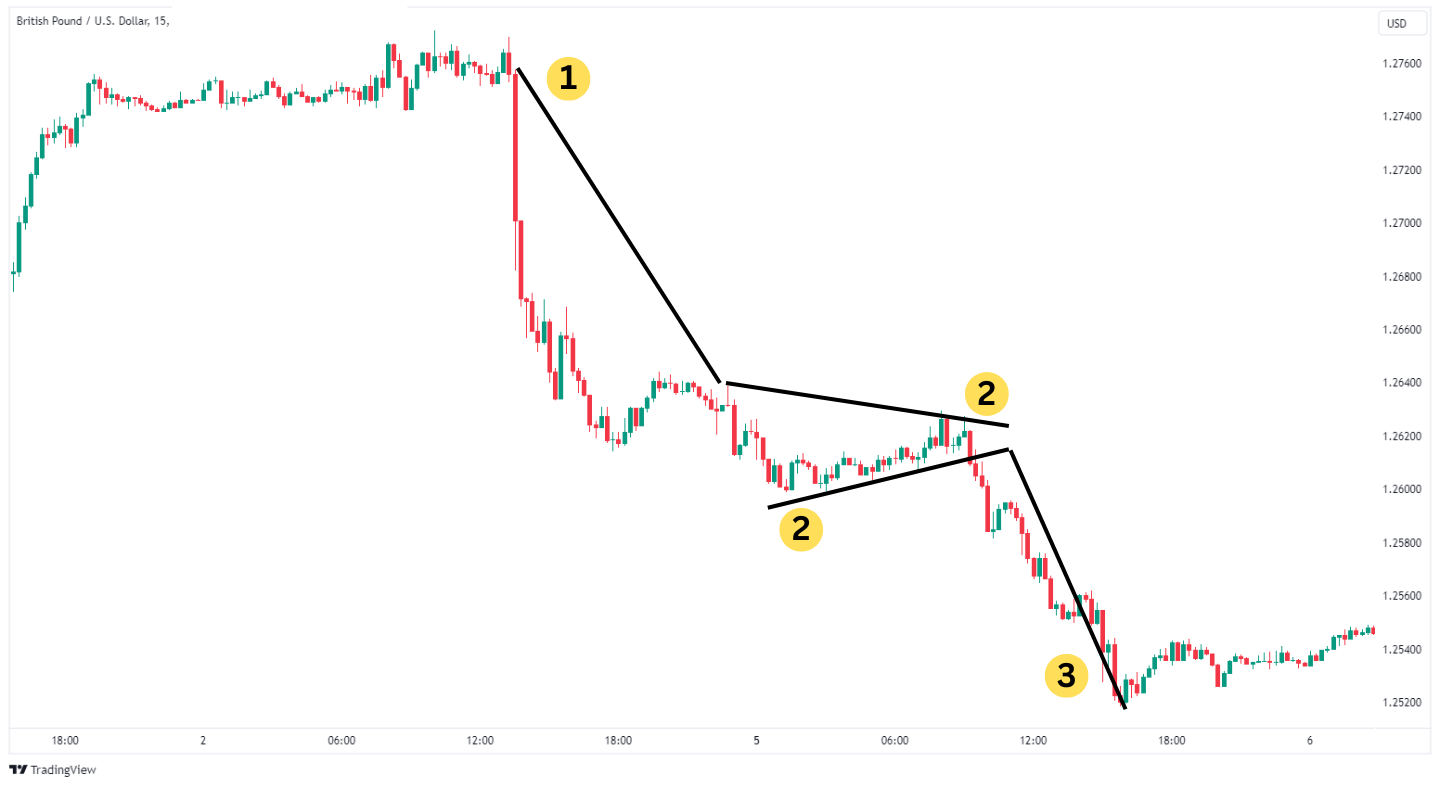
In the 15-minute GBP/USD chart, a strong bearish movement led to the consolidation of prices, forming a pennant. Subsequently, the price declined rapidly, mirroring the initial height of the flagpole.
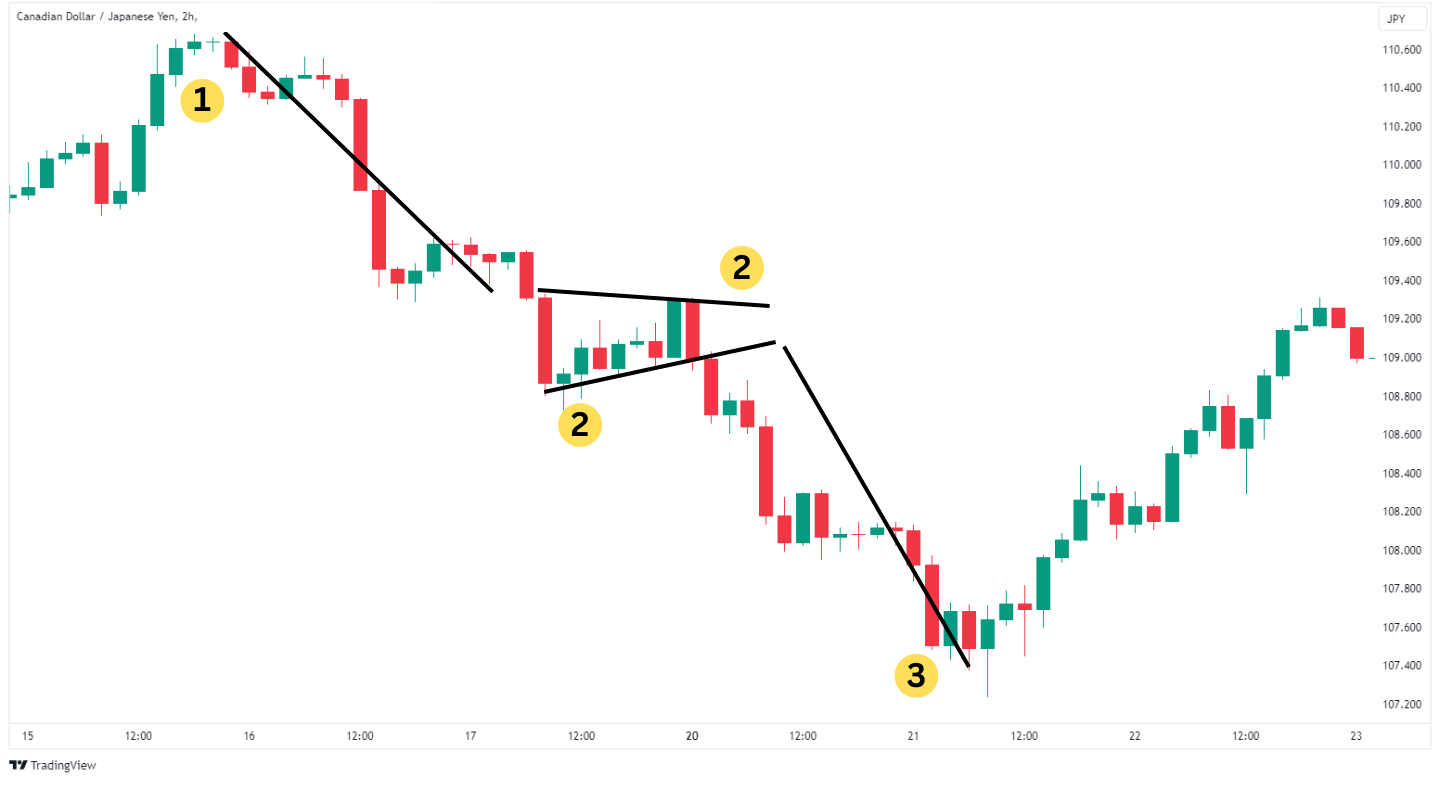
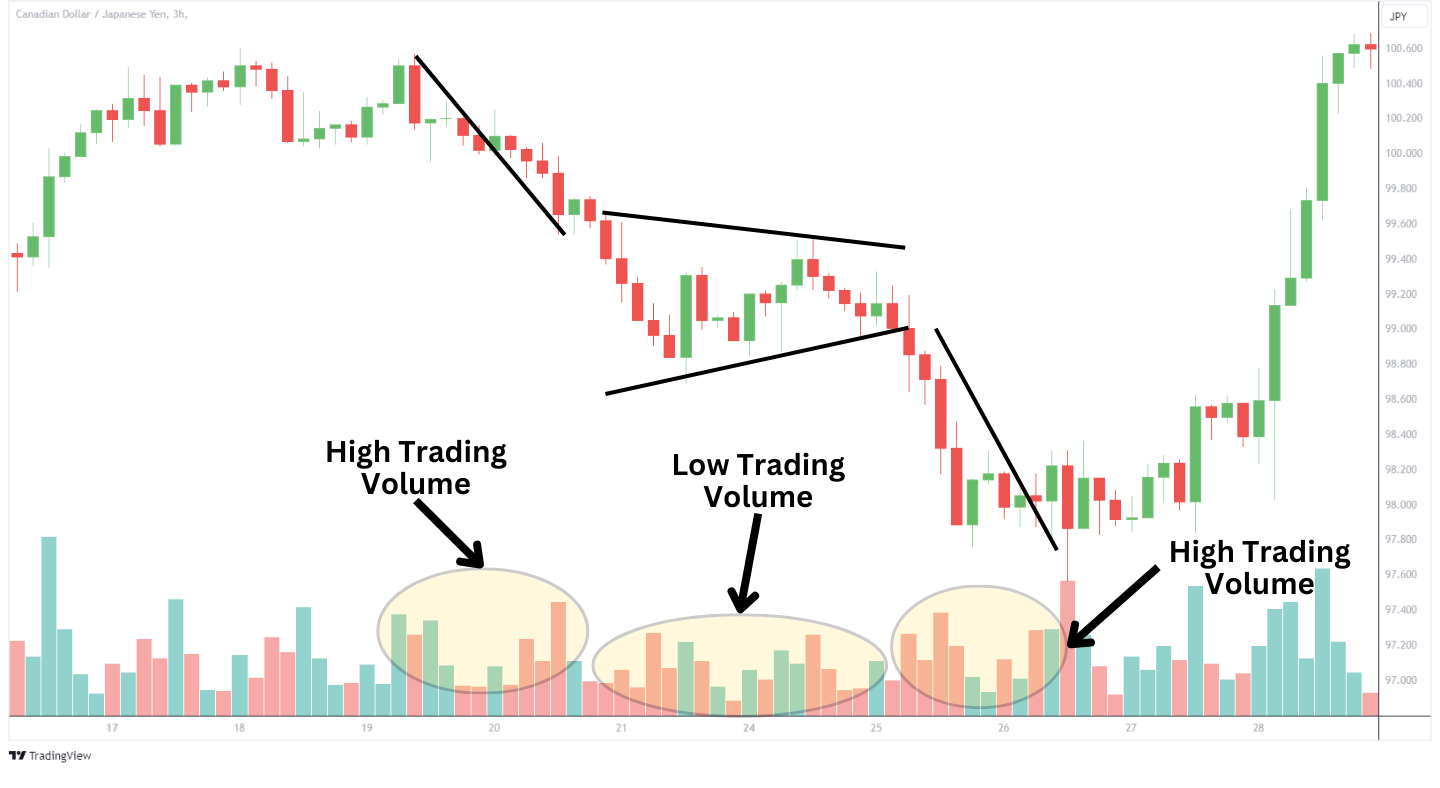
The CADJPY 2-hour chart above shows the formation of a bear pennant. Observe how there was a strong decline followed by a sideway resembling the shape of a pennant, a break below the pennant confirmed the bearish momentum.
Bear Pennant Pattern Strategies
Lower Boundary Breakout
This strategy requires traders to wait for the price to decisively break below the pennant’s lower boundary, a movement that signals the continuation of the prior downtrend. An increase in trading volume further strengthens the bearish directional bias.
An ideal entry point is shortly below the breakout, once the price action and volume have confirmed the pattern’s validity. To manage risk, place a stop loss just above the highest point of the pennant formation. This can help protect against potential reversals. To estimate the target for a trade, measure the height of a pennant’s pole and project that distance downward from the breakout point.
Breakout Retest
Observe the bear pennant until a clear breakout occurs below its lower trendline. This breakout should be accompanied by significant volume to confirm the bearish momentum. After a price trendline has been broken, it’s common for the price to retest from below. This retest acts as a resistance and confirms that the breakout is valid.
Enter a short position upon the retest when the price starts moving down again after hitting the resistance. Place your stop loss just above the highest point of the retest or the pennant’s peak to minimize potential losses if the trend reverses. Measure the height of the pole and project it downwards from the breakout point to set a realistic take-profit level, capturing the anticipated continuation of the downtrend.
Advantages of the Bear Pennant Pattern
The bear pennant pattern is a powerful tool in the arsenal of technical traders, offering more than just signals for the potential continuation of downtrends.
1. Precise Entry
Traders can use a pattern’s clear formation and breakout points to set precise entry and exit markers, allowing for better control over stop-loss orders and strategic placement of take-profit levels.
2. Versatility
The bear pennant pattern is highly versatile and can be utilized across various time frames and market conditions. Whether you’re a day trader who prefers to look at minute-by-minute charts or a long-term investor who analyzes weekly trends, this pattern can provide valuable insights. Furthermore, the pattern can be applied to various asset classes, including stocks, forex, crypto, and commodities, enhancing its utility as a versatile analytical tool.
3. Clarity in Market Direction
The bear pennant provides clear directional cues, starting with a sharp drop and a consolidation that confirms a bearish sentiment. This pattern, characterized by consolidation on lower volume, reassures traders of the downtrend’s continuation.
Disadvantages of the Bear Pennant Pattern
Like any trading strategy, trading the bear pennant pattern has challenges and disadvantages. Recognizing these limitations is crucial for traders to navigate the markets effectively and manage risks appropriately.
1. False Breakouts
The bear pennant pattern can sometimes lead to false breakouts, where the price appears to break the consolidation phase but quickly reverses direction. This can mislead traders into anticipating a downtrend continuation that doesn’t occur, potentially causing losses.
2. Timing Challenges
Trading the bear pennant requires precise timing for identifying and acting on breakout points. The short consolidation phase means the opportunity window can be narrow, demanding quick decision-making that may only suit some traders.
3. Volume Confirmation Reliance
Validating the breakout from a bear pennant often depends on an accompanying volume increase, which can be hard to confirm in less transparent markets. This reliance can introduce uncertainty in demonstrating the trend’s continuation strength.
What is the Psychology of Bear Pennant Formations?
The bear pennant formation signals a continuation of a downtrend as it begins with a sharp price decline that causes an asset’s value to drop further. This initial move lower is a dump from the current investors as a poor news release or some other news negatively impacting the asset is released.
The subsequent consolidation phase, or the pennant, represents a brief pause in this downward momentum. At this point, the sellers have become exhausted and need to catch their breath. However, they feel the downtrend is still early and don’t want to close out their shorts. Some buyers may try to bottom-pick prices; some short sellers take profit, and the price consolidates sideways.
The price cannot rally as both buyers and sellers hold their breath. Volume dries up during the consolidation. Then, sellers begin to bring in more volume, and the price adjusts lower. As the price moves lower, stop losses get hit, creating even more sellers and quickly pushing prices further down.
Once the sellers are exhausted, they are ready to buy back, and buyers are ready to rush in to close the pattern.
Bear Pennant vs Symmetrical Triangle
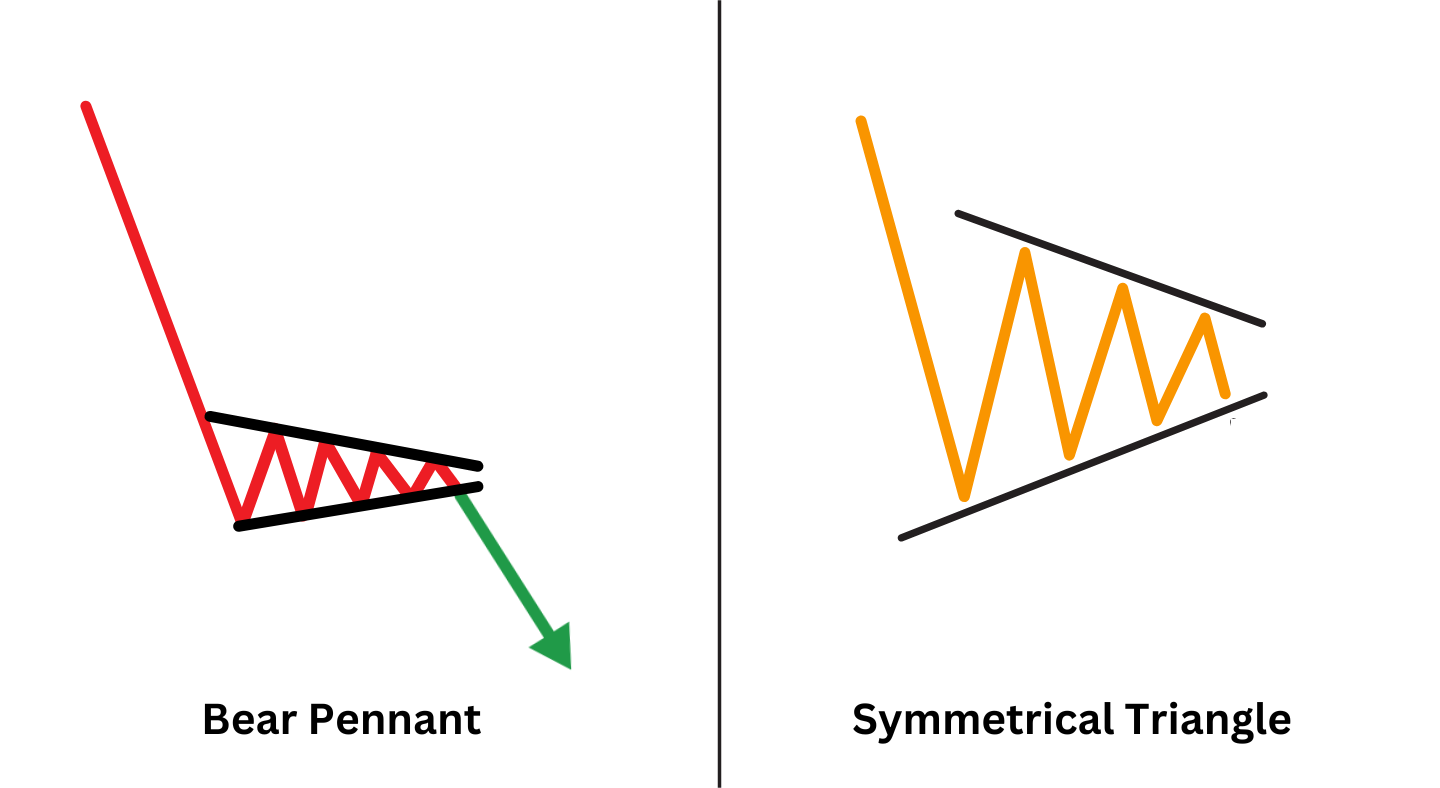
The bear pennant pattern is a continuation signal in a downtrend, characterized by a sharp price decline followed by a consolidation phase that forms a small, narrow triangle, concluding with a breakout that resumes the downtrend.
In contrast, the symmetrical triangle does not inherently signal a continuation or reversal but indicates a period of consolidation where the future direction is uncertain. This pattern represents a balance between buyers and sellers, formed by converging trendlines connecting lower and higher highs. The breakout direction from a symmetrical triangle can be either upward or downward, depending on which side of the triangle is breached.
Unlike the bear pennant, which suggests continuing the prior trend, the symmetrical triangle requires traders to wait for the breakout to determine the market’s next move, making it a pattern of indecision until the breakout occurs.
Bear Pennant vs Bear Flag
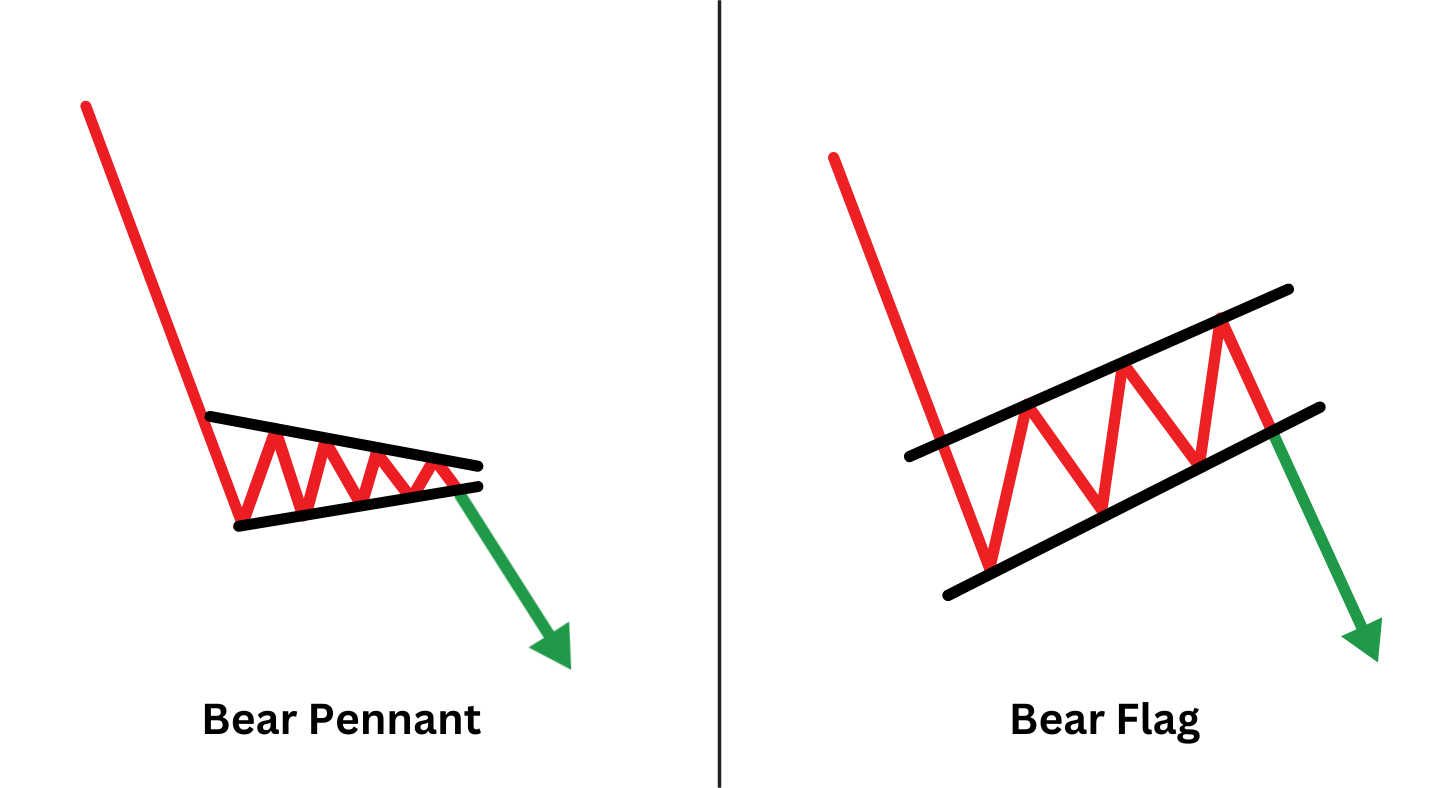
As already discussed, the bear pennant signals a downtrend continuation through a sharp initial decline followed by a consolidation phase, forming a small, narrow triangle.
On the other hand, the bear flag pattern shares a similar bearish continuation sentiment but differs in its consolidation phase’s appearance. After a significant downward move, the bear flag features a slight, upward-sloping rectangular consolidation, resembling a flag. This “flag” represents a brief counter-trend rally or pause before the price resumes its downward trajectory. While both patterns indicate bearish continuations, the bear flag’s consolidation phase is typically longer and has a clear, upward slope.
Bear vs Bull Pennant
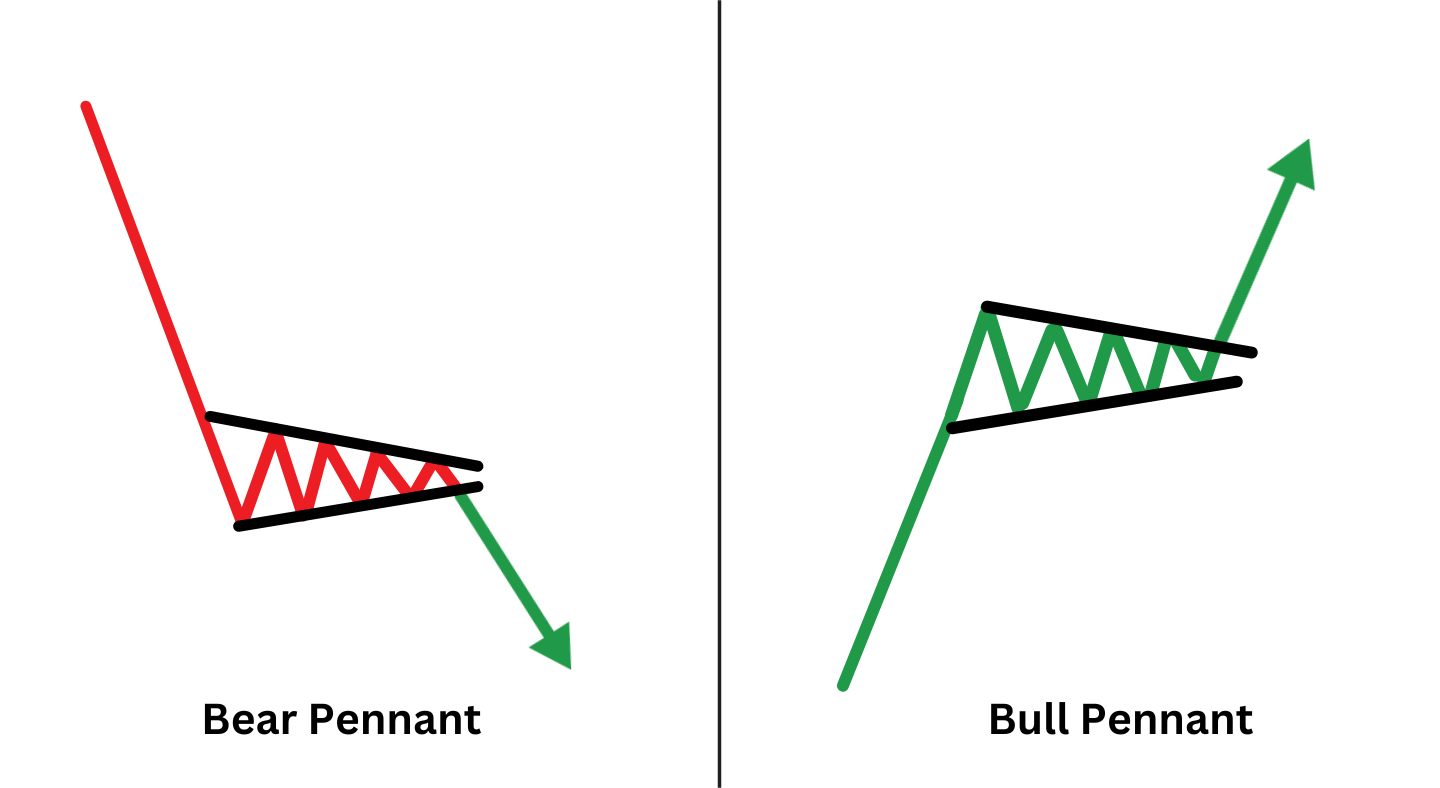
The bear pennant is a continuation pattern within a downtrend consisting of a flagpole and a flag.
Contrastingly, the bull pennant shares a similar structural formation but occurs in an uptrend. It starts with a significant price increase, creating the flagpole, followed by a consolidation phase, forming a small, narrow triangle. However, the bull pennant concludes with an upward breakout, signalling the continuation of the bullish momentum. While both pennants signal a continuation of the current trend, their key difference lies in the direction of the flagpole and eventually the breakout.
Bear Pennant vs. Wedges
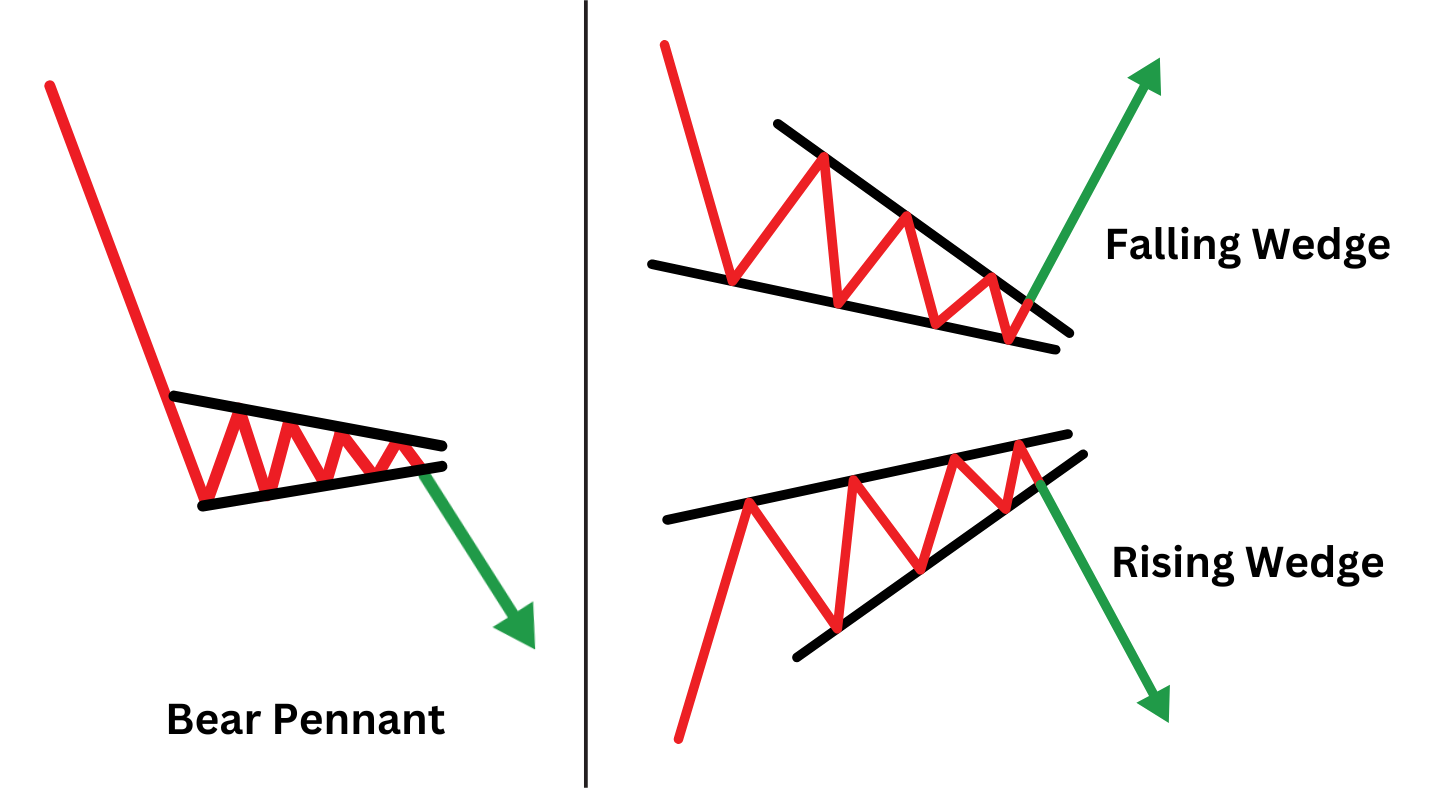
The bear pennant signals a continuation of a downtrend, characterized by a steep initial drop and a tightly formed consolidation, leading to a subsequent bearish breakout.
Wedges are a type of chart pattern that traders use to forecast market movements. The two types of wedges are rising wedges and falling wedges.
Rising wedges form when prices consolidate between converging trend lines that slope upwards, indicating a potential bearish reversal in an uptrend as buyers lose momentum.
On the other hand, falling wedges occur during a downtrend when prices consolidate within downward-sloping lines. Unlike the bear pennant, which suggests a continuation, falling wedges often indicate a bullish reversal. This hints that the downtrend could be reversed as selling pressure weakens.
What Indicator is Best to Trade With a Bear Pennant Pattern?
The best indicators to use when trading the bear pennant pattern are volume and Fibonacci retracement levels. Volume analysis ensures that the breakout from the pennant is backed by significant market participation, indicating a strong move.
Fibonacci retracement levels are used for verifying that the pennant’s consolidation does not retrace more than 50% of the initial flagpole drop. This helps maintain the pattern’s validity and signals a continuation of the bearish trend. Together, these indicators provide a solid foundation for confirming entry points and enhancing the accuracy of trades based on the bear pennant.
Trading Bearish Pennant With Volume Confirmations
Volume confirmations help validate the pattern’s breakout, enhancing the reliability of the trading signal.
Keep an eye out for a gradual decrease in trading volume during the formation of the bearish pennant. This decrease in volume indicates the consolidation phase, where market participants take a break to evaluate their next moves. The diminishing volume is typical of the pennant’s consolidation, which signals a temporary halt in selling pressure.
When using volume to trade bearish pennants, it is important to identify a significant increase in volume as the price falls below the lower boundary of the pennant. This sudden spike in volume indicates that the market has accepted the bearish move, and increased selling activity is pushing the price further down. It suggests that the breakout is not a false signal but a continuation of a bearish trend.
Implementing the Strategy:
Enter a short position after confirming the breakout with a volume spike. This entry is based on the premise that the increased volume signifies strong market participation in the bearish continuation, offering a higher probability of a successful trade.
To manage risk effectively, place a stop loss just above the pennant’s highest or breakout point. This protects the trade against the possibility of a reversal back into the pennant formation. Set a take profit level by projecting the flagpole height from the breakout point. This method estimates the potential downward move, allowing traders to lock in profits at a strategic level.
What Are Common Mistakes Traders Make When Trading a Pennant Pattern?
Deep Retracement Level: Traders engage in trades when the pennant’s retracement level is too deep, such as at 60%. This can significantly diminish the chart pattern’s reliability and increase the risk of unsuccessful trades.
Ignoring Volume Indicators: Traders must pay more attention to volume during the pennant’s formation. Generally, the volume should decrease during the consolidation phase and then increase significantly when the price breaks downward. You may receive false signals if you enter a trade without considering this volume confirmation.
Stop Loss levels: Setting the stop-loss just above the high point of the pennant is important to limit potential losses from an unexpected upward price reversal. Traders should avoid placing it too tight to prevent premature stop-outs.
FAQ
How do you tell if a pennant is bullish or bearish?
A pennant is bullish if it forms during an uptrend, signalling a further rally in price. Conversely, it is bearish if it forms during a downtrend, suggesting the price will likely continue falling after the pattern’s completion.
Can bear pennants break up?
Yes, bear pennants can break upwards in rare cases, indicating a false breakout or a significant change in market sentiment that reverses the expected downtrend.
What happens with a failed bear pennant pattern?
When a bear pennant pattern fails, the price may reverse direction or break upwards, invalidating the expected bearish continuation signal instead of continuing the downtrend. Obviously, the sentiment in the market is changing as a result of a positive fundamental development.
How often does the bear pennant pattern happen?
The bear pennant pattern occurs relatively frequently in markets experiencing strong downtrends, but its frequency can vary depending on market conditions and the time frame being observed.
How reliable is the bear pennant?
The reliability of the bear pennant pattern is enhanced when there is an increase in volume during the breakout, signalling strong market agreement on the continuation of the downtrend.
Can pennant formations signal both continuation and reversal patterns?
Pennant formations primarily signal continuation patterns, indicating that the price is likely to continue in the same direction as the trend before the formation. They are not typically used to signal reversal patterns.


