Written by:

Reviewed by:

- June 6, 2024
- 24 min read
Volume-Weighted Average Price Indicator (VWAP) With Examples
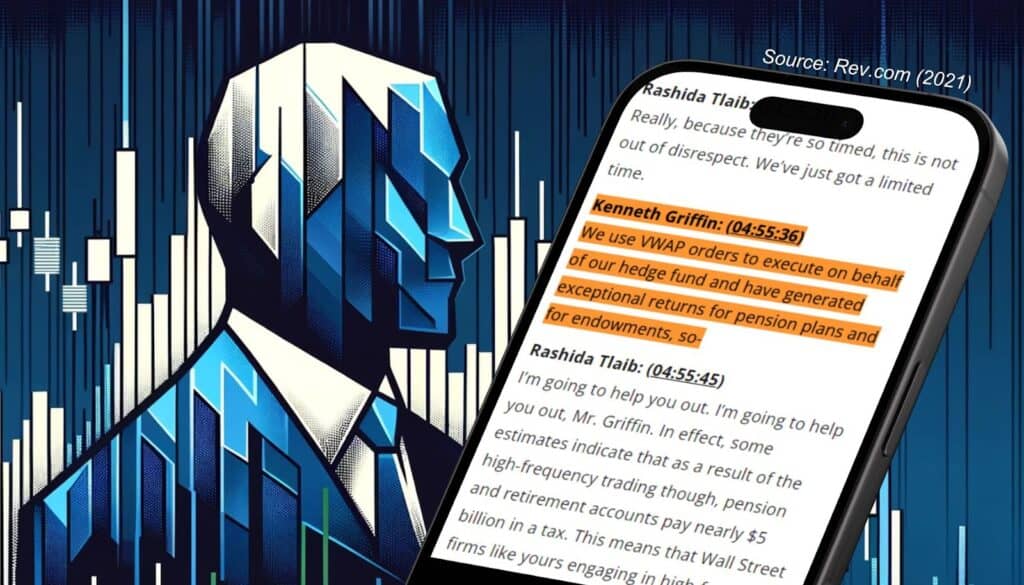
Pictured: The CEO of Citadel, a Hedge Fund with over $62 Billion in assets under management, openly stating that they use vWAP to execute trades with great returns. (Source: rev.com, 2021)
The vWAP is often regarded highly in the trading world for its usage by big financial institutions, and hedge funds like Citadel, which manage billions of assets for their clients. Here’s a factual tidbit, back in 2021, the CEO of Citadel openly stated they indeed use the vWAP to generate returns for their clients!
Aside from being utilised by big financial institutions, the vWAP is a versatile indicator in understanding the “True Average Price” of the markets, and is considered by many as more accurate than a moving average indicator. So without further ado, let’s get into how the vWAP works, and the strategies you can use to trade it.
What is the VWAP indicator?
vWAP (Volume-Weighted Average Price) is a cumulative indicator used by technical traders to determine the true average price of an asset. It appears as a line on the chart that includes volume in the calculation of the average price. Many traders believe that this method of calculation gives a more accurate indication of the true average price relative to using the standard moving average indicators.
This technical indicator is beloved by financial institutions such as Citadel, which manages over $63 Billion in assets for their clients as of 2022, because of its ability to factor in volume.
Since the vWAP tells us where the average price is, it’s also used as a benchmark to judge how cheap or expensive you traded an asset for. Did you buy below the average price and get a better deal? Or did you sell above the average and make a steal?
Of course, this isn’t the go-ahead to buy whenever the price is below vWAP, or sell whenever the price is above. Using this indicator properly requires a contextual understanding of market conditions and basic market structure.
Importance of VWAP in Technical Analysis
The vWAP is an amazing tool that is useful as a benchmark for recognising the market trend direction, strength of trend, and true average price.
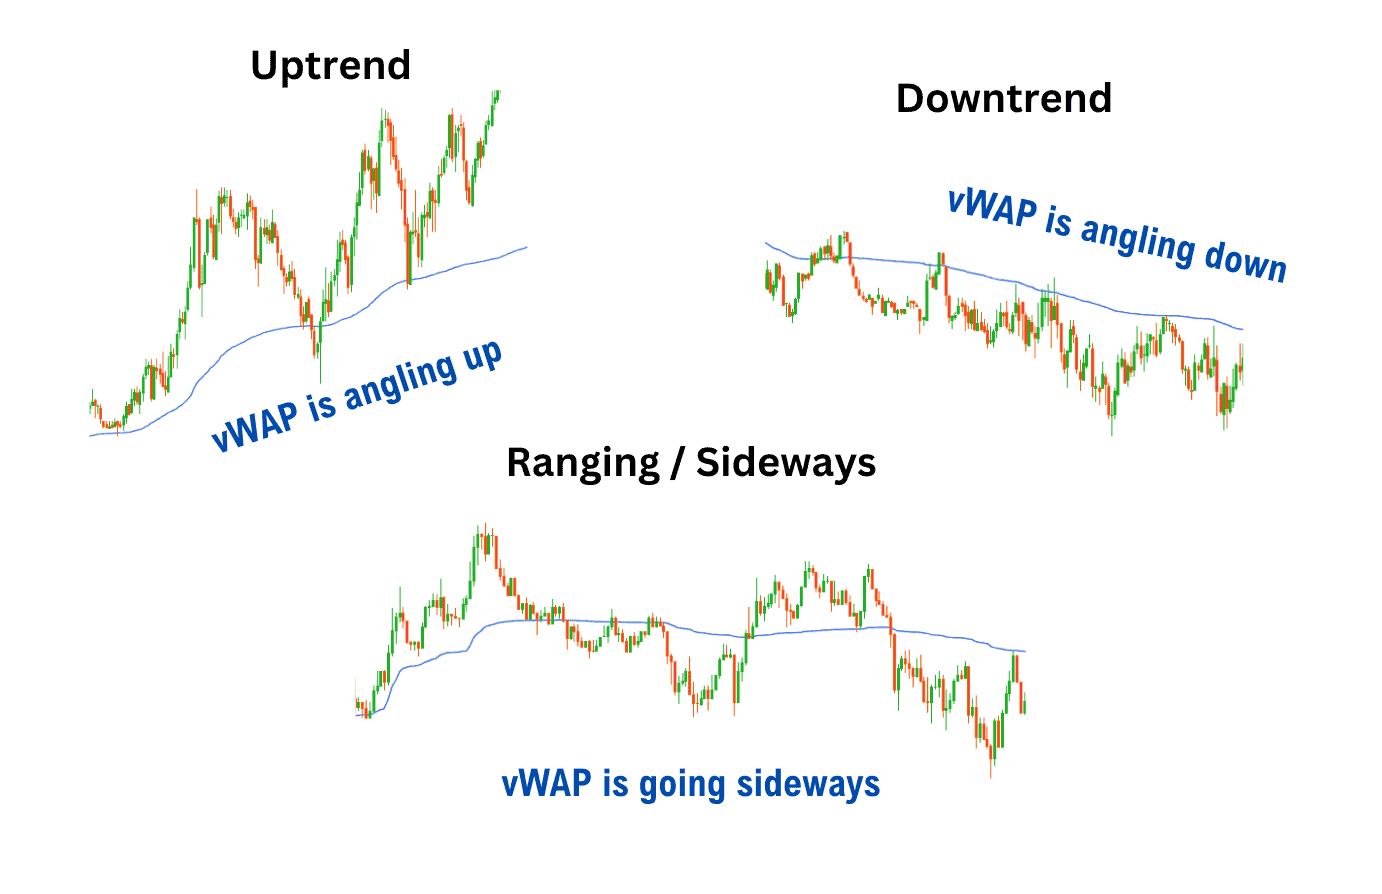
vWAP can identify the trend direction when it begins to curve in either direction. When it curves up, the market is in an uptrend. When it curves down, the market is in a downtrend. The strength of a trend can also be identified by how far and how long the price remains away from the average price. Finally, vWAP uniquely factors in trading volume to provide users with a reading of the true average price.
As vWAP is one of the most used indicators by financial institutions – which have enough liquidity to move the markets – it’s important to at least have an understanding of how this indicator works.
How does the VWAP indicator work?
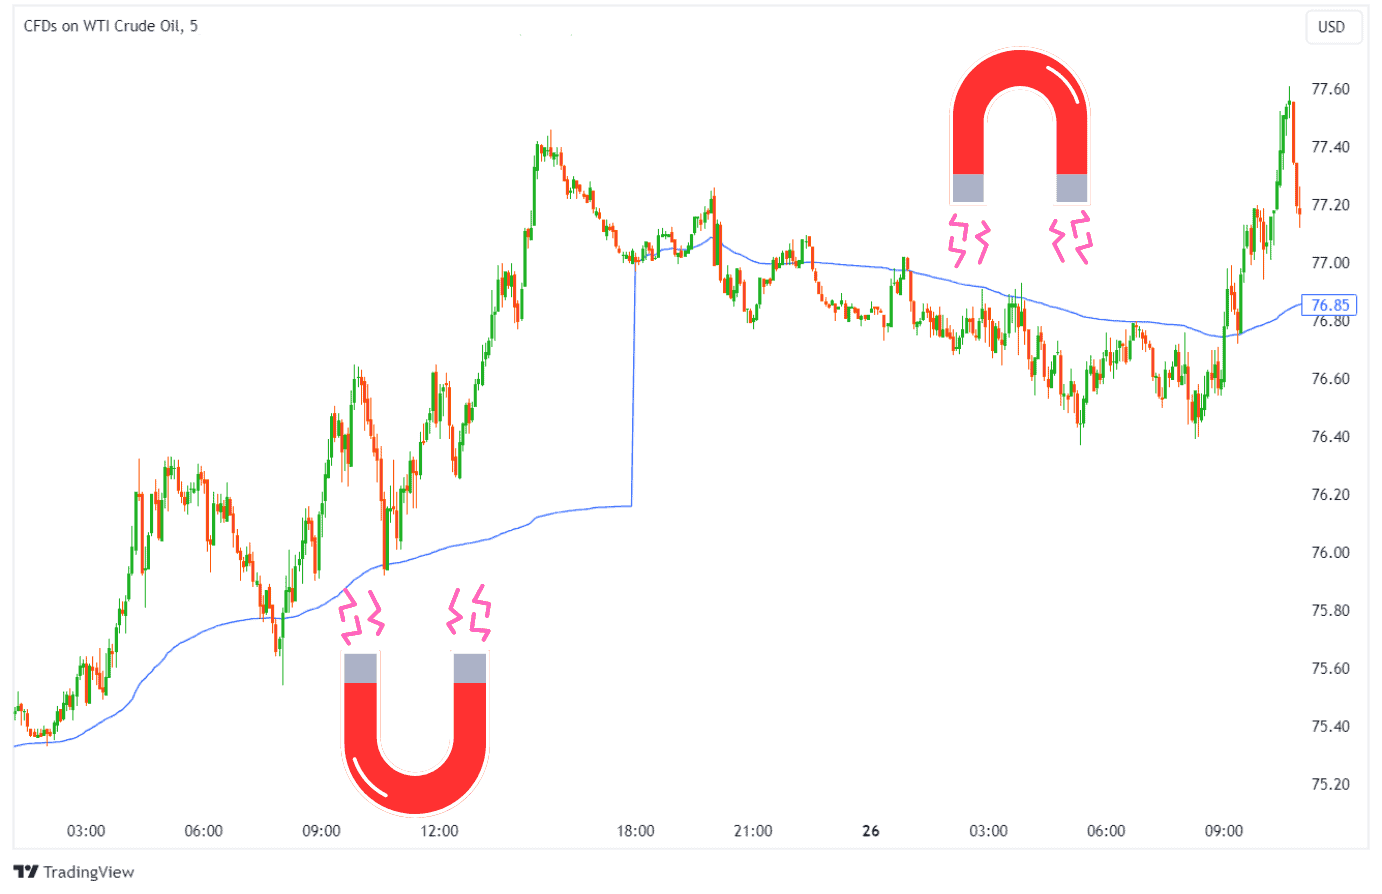
The vWAP often acts like a magnet, guiding the price back to it. The markets tend to return to their fair values, or rather, average prices to test the buyers’ and sellers’ intentions. This is what’s known as ‘mean reversion’ – a concept that drives the effectiveness of the vWAP indicator.
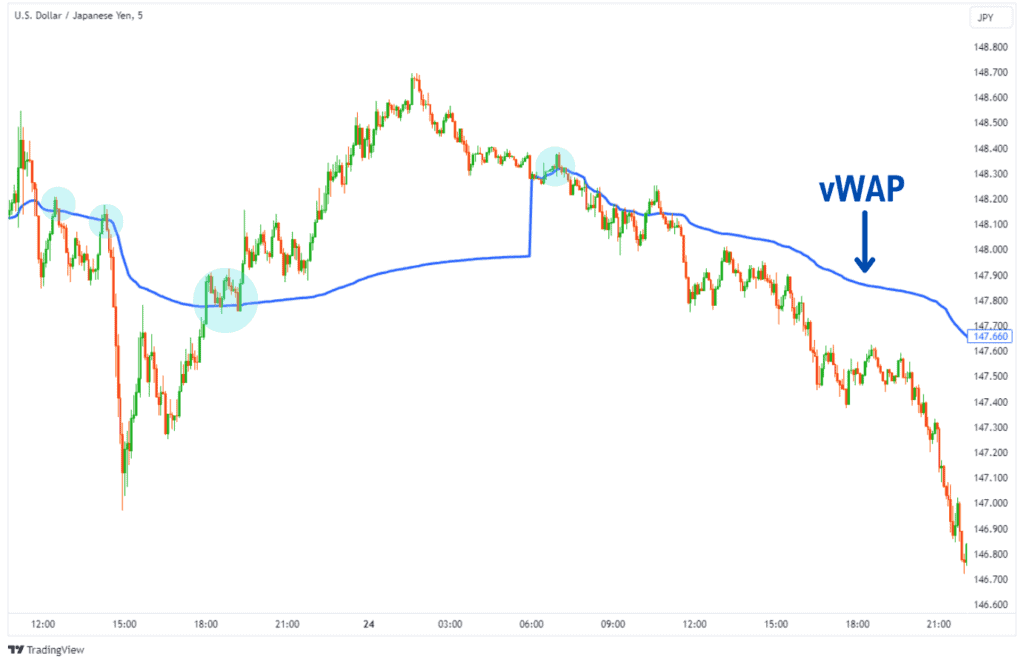
As you can see in the example below, the price will often return to the vWAP after moving away from it.
Volume-weighted average price is visualised as a dynamic price line, similar to a moving average. It’s a clear level of interest for traders to keep an eye on, and use as extra confluence to enter trades.
The vWAP is a resetting indicator that is tied to an Anchor Period, this refers to the range of historical data the vWAP will pull from. For example, if you set the anchor period to “Session”, the vWAP will take data points from a trading day (consisting of 24H), and then restart its calculation the next day.
If you set the anchor period to “Week”, the vWAP calculates the average price of an entire week, then resets its calculation at the start of next week.
How to Calculate Volume Weighted Average Price?
The vWAP is calculated by multiplying the high, low, and close price of each candlestick by its trading volume. Then, that value is divided by the total trading volume in the range to form the vWAP value.
It can be a mouthful to understand, but thankfully, the vWAP indicator does this calculation automatically for you and visualises it on the chart seamlessly.
Here’s what the formula looks like.
VWAP Formula
vWAP = Sum (HLC of Each Candle / 3 * Volume of Each Candle) / Cumulative Volume in the vWAP Range
HLC = High, Low, Close of a Candlestick
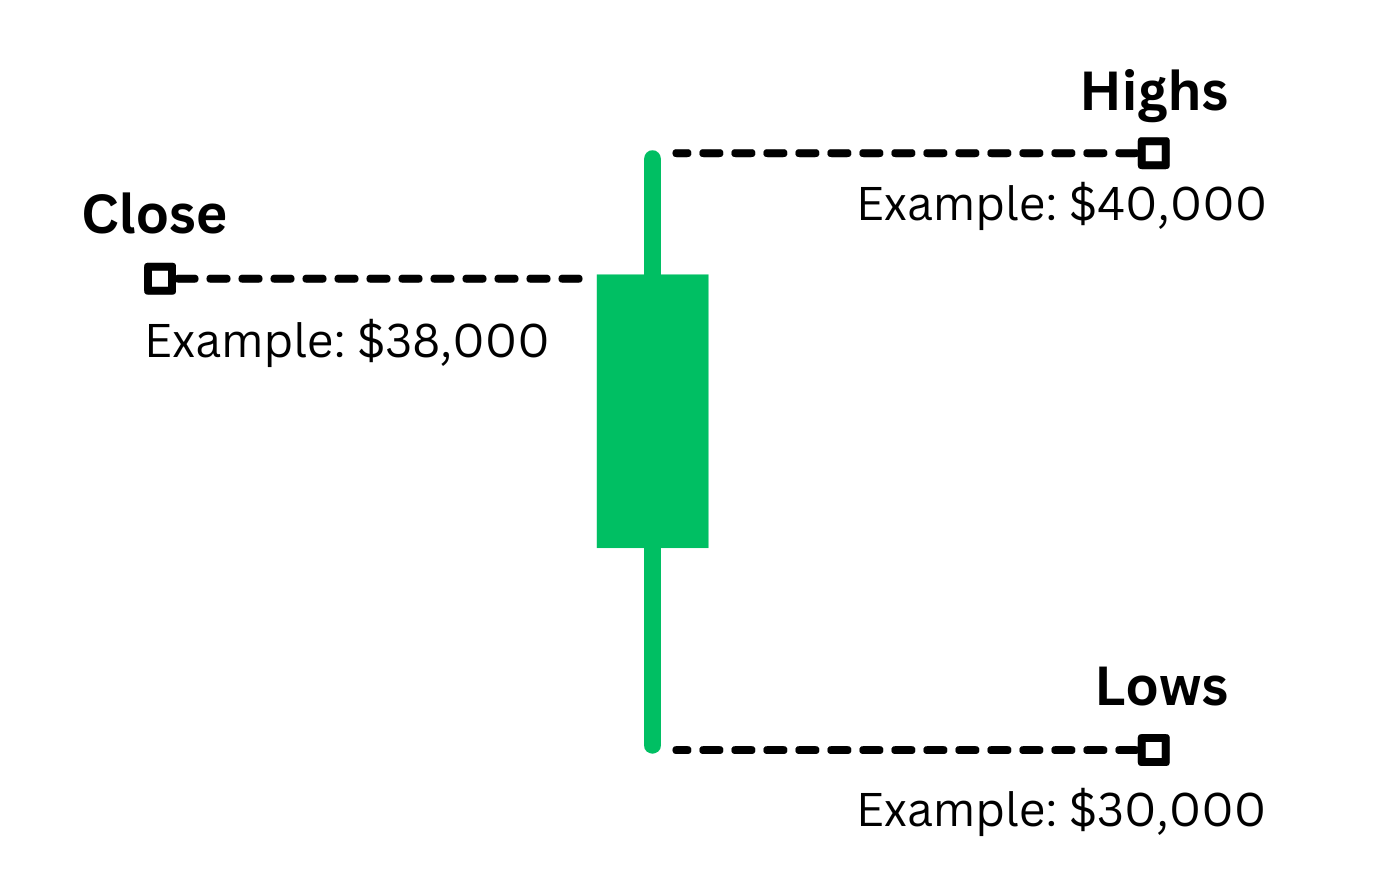
Let’s see it in an example:
We want to calculate the vWAP for a daily candle on Bitcoin Futures, where 50,000 contracts were traded. What would that calculation look like?
vWAP = (40,000 + 38,000 + 30,000)/ 3 * 50,000 / 50,000
Volume-Weighted Average Price = $36,000
Taking the values in the picture above, and adding the trading volume to it, we would get the vWAP value of $36,000 for this daily candle.
How is volume factored into the VWAP calculation?
In simple terms, vWAP factors volume in by multiplying price times volume. This gives each candlestick a certain amount of ‘weight’. More volume means the heavier weight of that candle, and the more the vWAP will gravitate towards that value.
For example, let’s say we want to calculate the vWAP between the daily Bitcoin Futures example above, and with another daily candle with $45,000 (highs), $42,000 (close), and $38,000 (Lows). Depending on the trading volume, the results would be vastly different.
If the second candle had 50,000 contracts in trading volume:
vWAP = [((40K + 38K + 30K)/ 3 * 50,000) + ((45K + 42K + 38K) / 3 * 50,000)] / [50,000 + 50,000]
Volume-Weighted Average Price = $38,833.33
If the second candle had 100,000 contracts in trading volume:
vWAP = [((40K + 38K + 30K)/ 3 * 50,000) + ((45K + 42K + 38K) / 3 * 100,000)] / [50,000 + 100,000]
Volume-Weighted Average Price = $39,777.78
As you’ve noticed, the vWAP reading was changed because of the trading volume. This is how factoring in the trading volume can change our perception of where the ‘True Average Price’ really lies.
How does the time period used for the calculation of VWAP affect its accuracy?
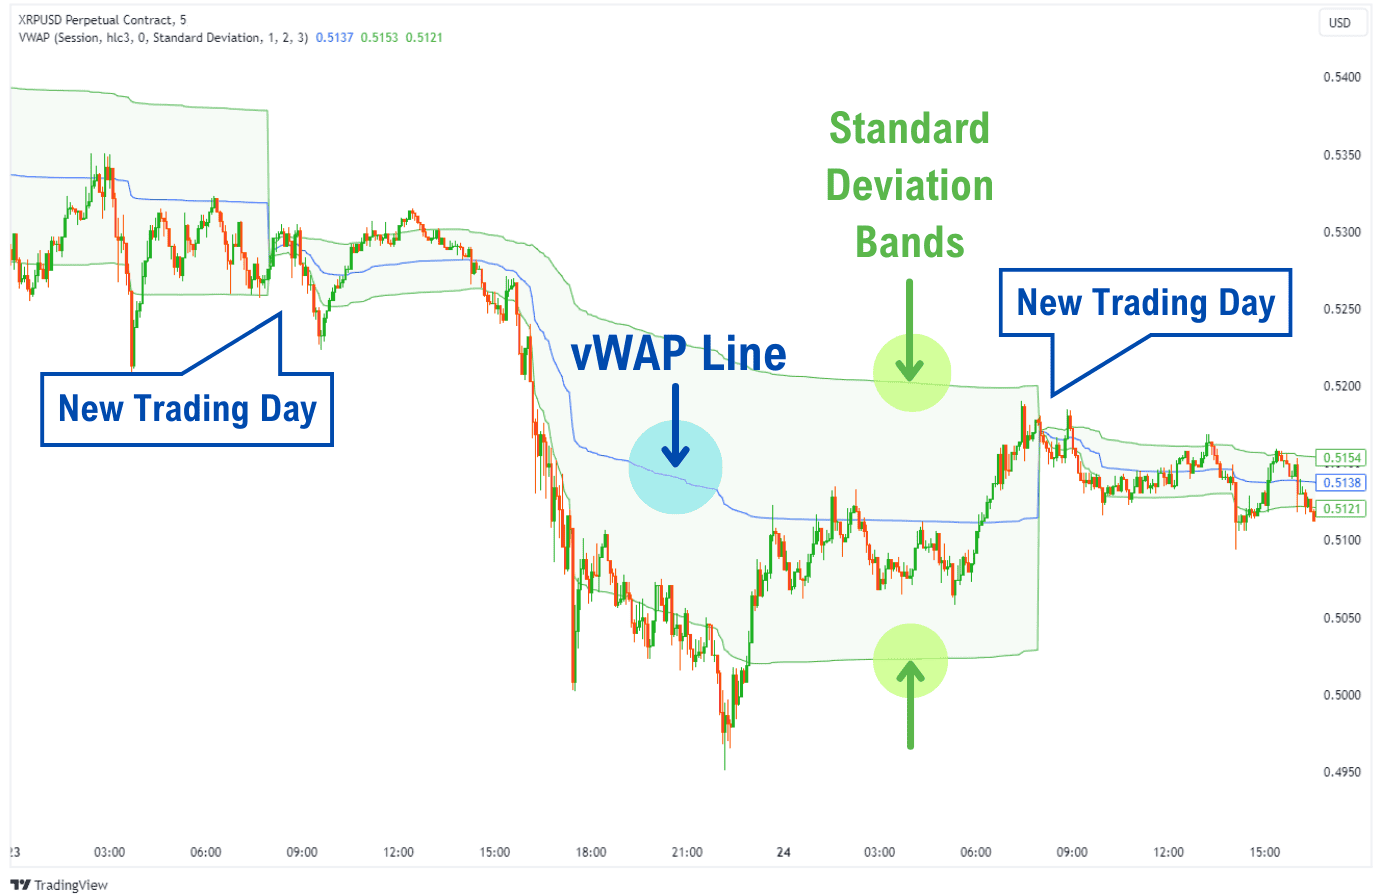
The vWAP’s calculation resets every so often, which creates a ‘blackout’ period where you cannot reliably use it to trade. At the start of every new range, you’ll notice that the vWAP is extremely contracted. This is because there is not enough trading volume for the vWAP to accurately pinpoint the ‘true average price’ and the standard deviations from the average price.
Generally, it is advisable to avoid trading using the vWAP at these times. Here are three easy-to-remember guidelines to support your trading:
- Do not rely on the vWAP for signals when its bands are contracted/squished together.
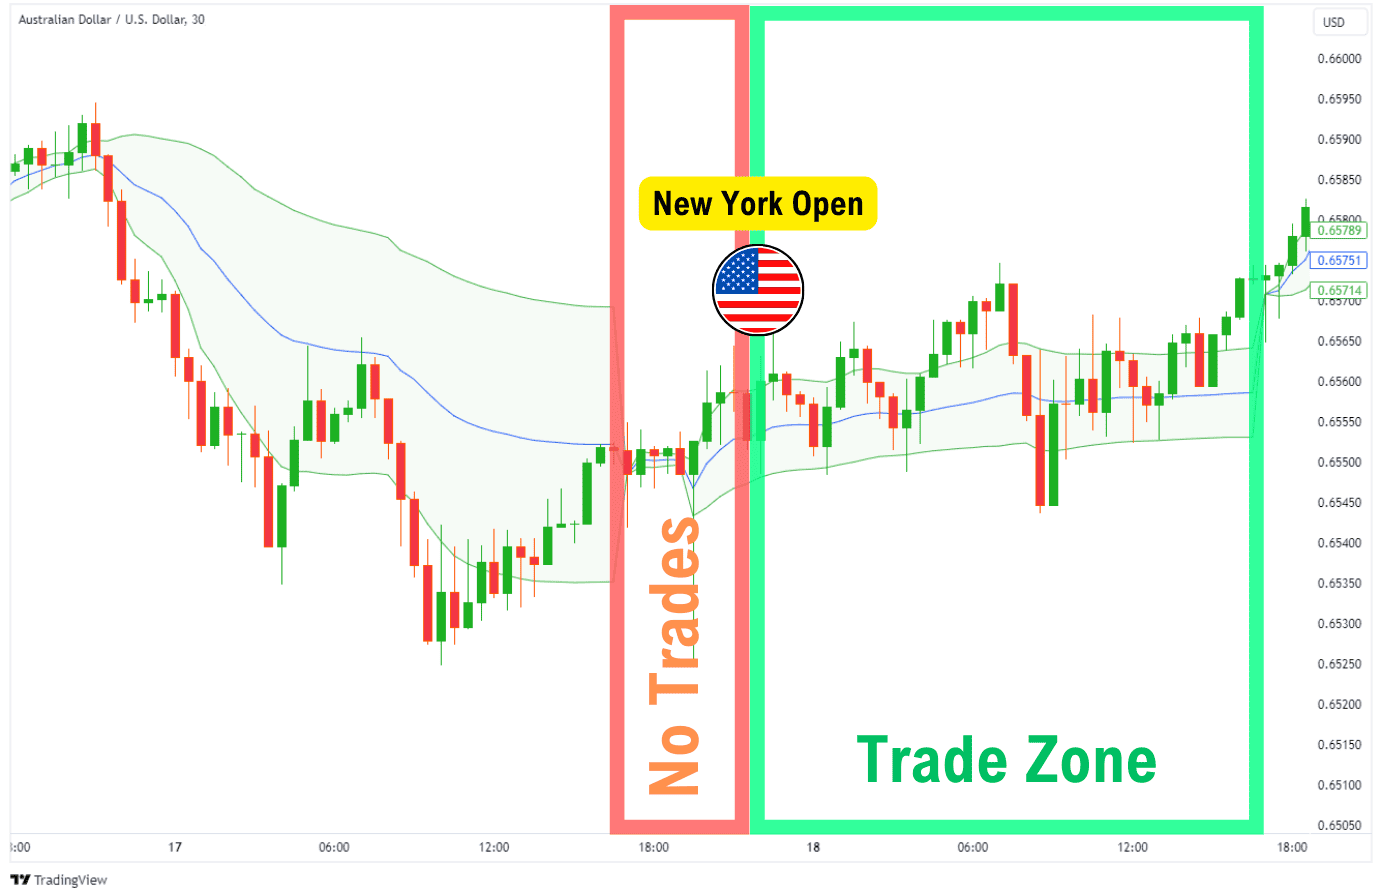
- If you are trading the Session vWAP, don’t trade before the New York Open (UTC-5, 21:30).
- If you are using the weekly anchor, wait for 1 day of data to be collected before trading.
Alternatively, during these periods where you cannot use the vWAP, switching the anchor period to higher time periods such as ‘Week’ will present you with fresh, and valid new opportunities.
How is VWAP then used to identify market trends and momentum?
Based on how the vWAP line is angling, you can determine whether the market is in a trend, or is ranging. When the vWAP line is angling up or down, it’s currently in an uptrend or downtrend. Conversely, when the vWAP is flat, that means the market is currently in a range.
For identifying momentum, we only have to look at how far the price is currently from the vWAP. If the price is far away, then the market is trending with strong momentum. To make things clearer, you can turn on the ‘Standard Deviation Bands’ for the vWAP, and take note of when the price breaks the first standard deviation band, and outside the band.
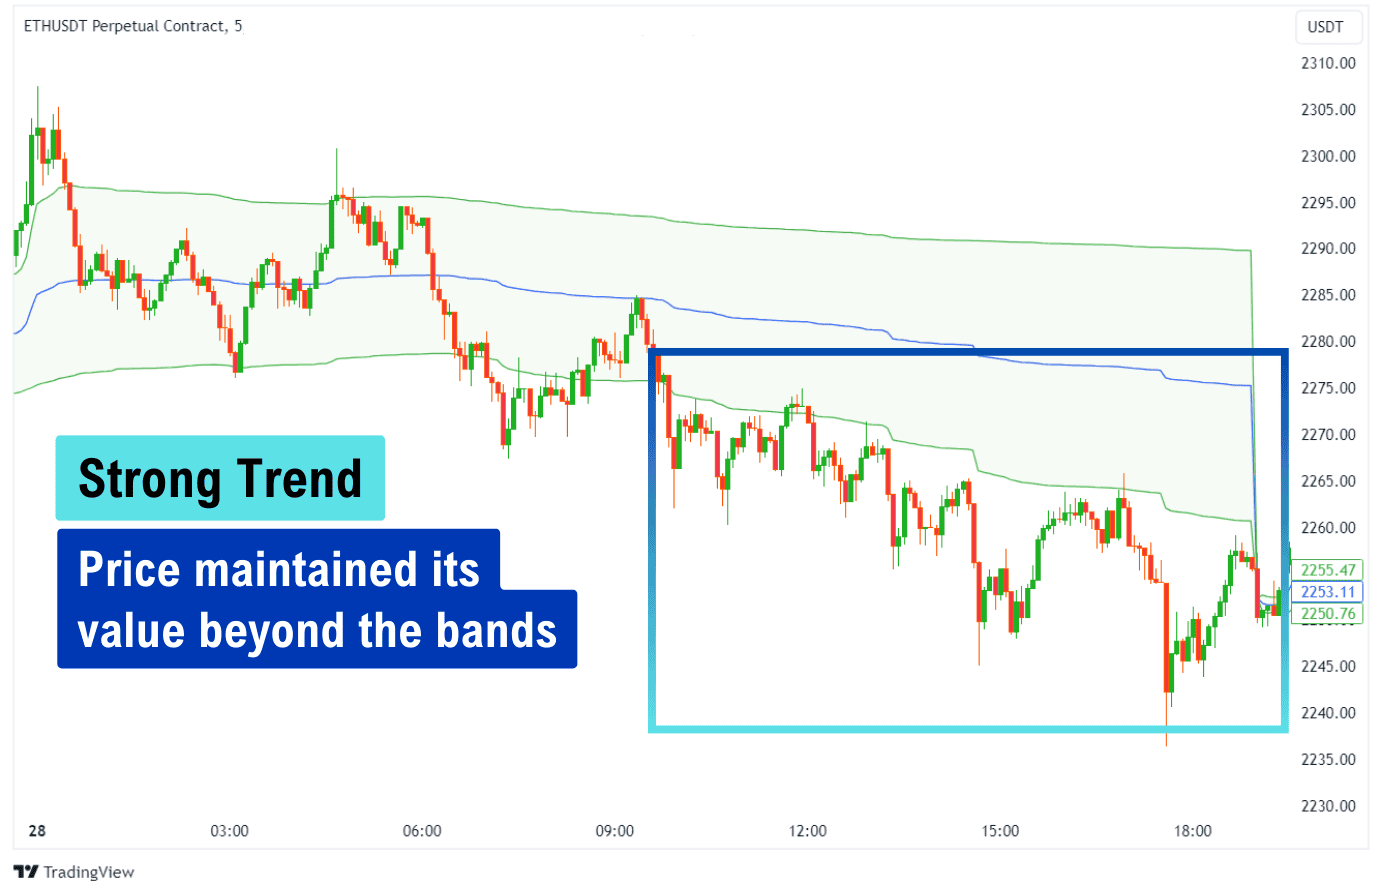
For example, in a strong trend, like the one noted above, the price will stay outside of the standard deviation band for an extended period.
Prior to the price moving outside of the lower band, notice how the price was contained inside the band and trading in a sideways range. The standard deviation bands can also provide more context about the price trends.
How to use VWAP as a benchmark for evaluating the performance of their trades?
vWAP acts as the benchmark goal to beat, no matter the type of trade position you’re taking. For instance, if you’re aiming for a buy position, the goal is to get it cheaper than the calculated vWAP price. If you’re building a sell position, the goal is to sell it more expensive than the calculated vWAP price.
Oftentimes, you’ll see the vWAP and its bands go flat in an area before a large move. It is a sign that large institutions are in play and using the vWAP to gauge how much they can purchase or sell in in the session without shifting the average price. This allows them to build up a favourable position with a large sum before the market prices shift.
Let’s also talk about how the vWAP is used as a benchmark by institutions.
Institutional investors use the vWAP as a reference point to build buy and sell positions without causing large price swings in the market. Because the vWAP incorporates volume into its calculation, institutions can use reverse engineering to figure out how much volume they can transact without shifting the average stock price drastically.
By stalling in an area, the institutions can build a large favourable buy or sell position before a larger move happens. Let’s say Bitcoin was at $40,000, and an institution wishes to sell all its Bitcoin. If it did so at $40,000 in one go – some orders would be filled at $39,000, some at $38,000, which is not as favourable as stalling at $40,000 to build a more optimal sell position.
VWAP Example
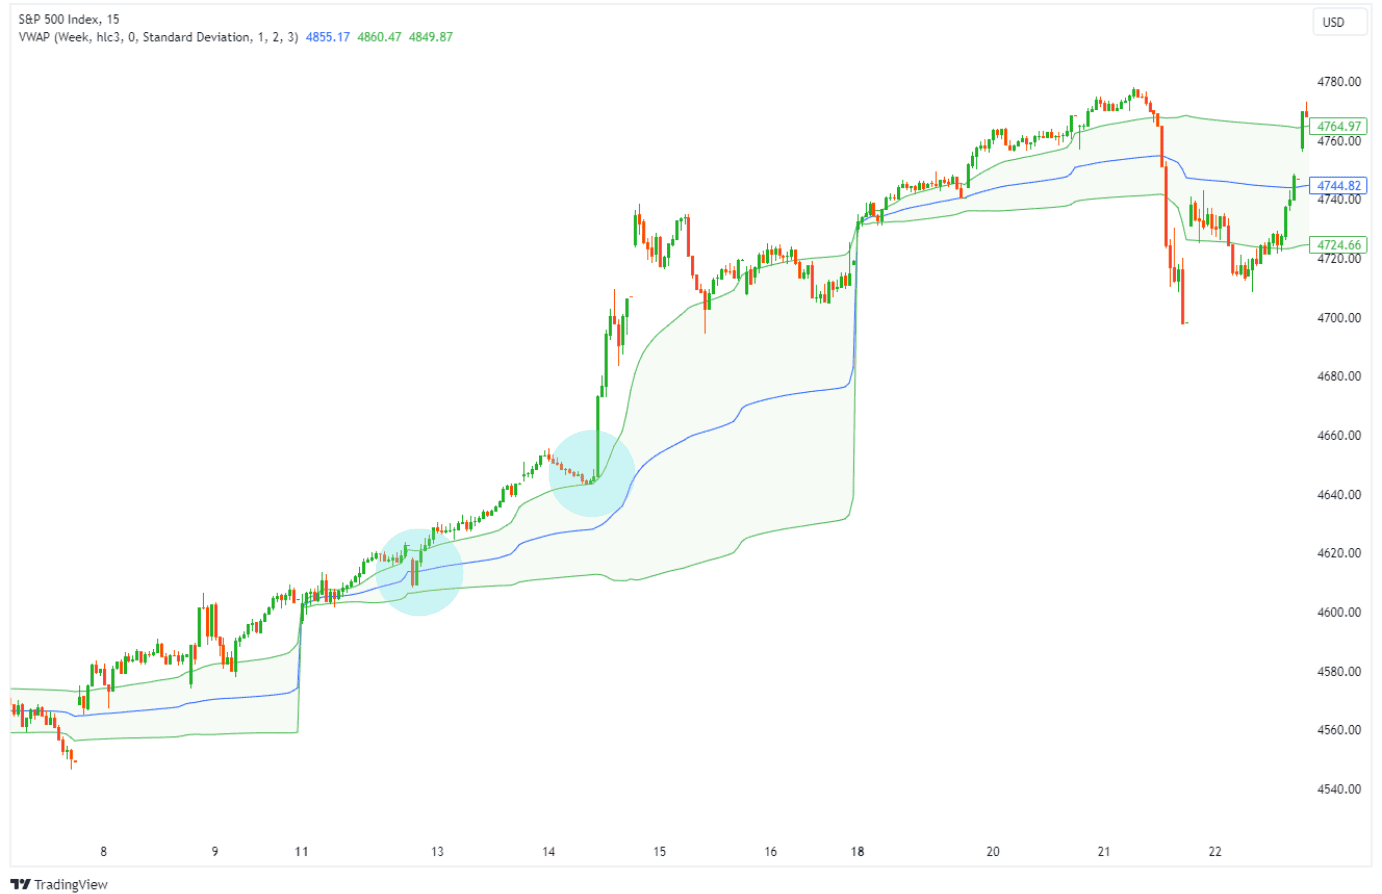
Here is a good example of a day trade done right using the vWAP, with the anchor period set to ‘week’. This trade takes place from December 11th to December 12th, 2023.
The vWAP is represented by the blue line, which denotes the volume-weighted average price. Think of it as the “True” average price of the asset. The green lines or area are the standard deviation bands of the vWAP, which represent the range price would be moving around the vWAP.
In this example, because the price moved beyond the standard deviation bands, it tells us that the price is moving in a strong trend. Thus, we can go for a breakout trade at multiple points in the chart.
Longer anchor periods tend to mean stronger moves when the vWAP is retested, or when the standard deviation bands are broken out of. As we see here, the S&P 500 price moved all the way up to $4780 after a retest of the vWAP at $4610.
VWAP Trading Strategies
One of the greatest strengths of the vWAP indicator is its versatility. It’s usable on most assets, on all timeframes, and for either long or short positions.
Here are the calibrations for using the vWAP in your trading strategies:
| Style | Chart Timeframe | Anchor Period |
| Intraday Trading,Scalping | 1m – 15m RecommendedApplicable up to 1H | Session, Week |
| Swing Trading | 2H, 3H, 4H, Day | Week, Month |
| Position Trading,Buy & Hold | Day, Week | Quarter, Year |
Simple S/R Trading with vWAP and Bands
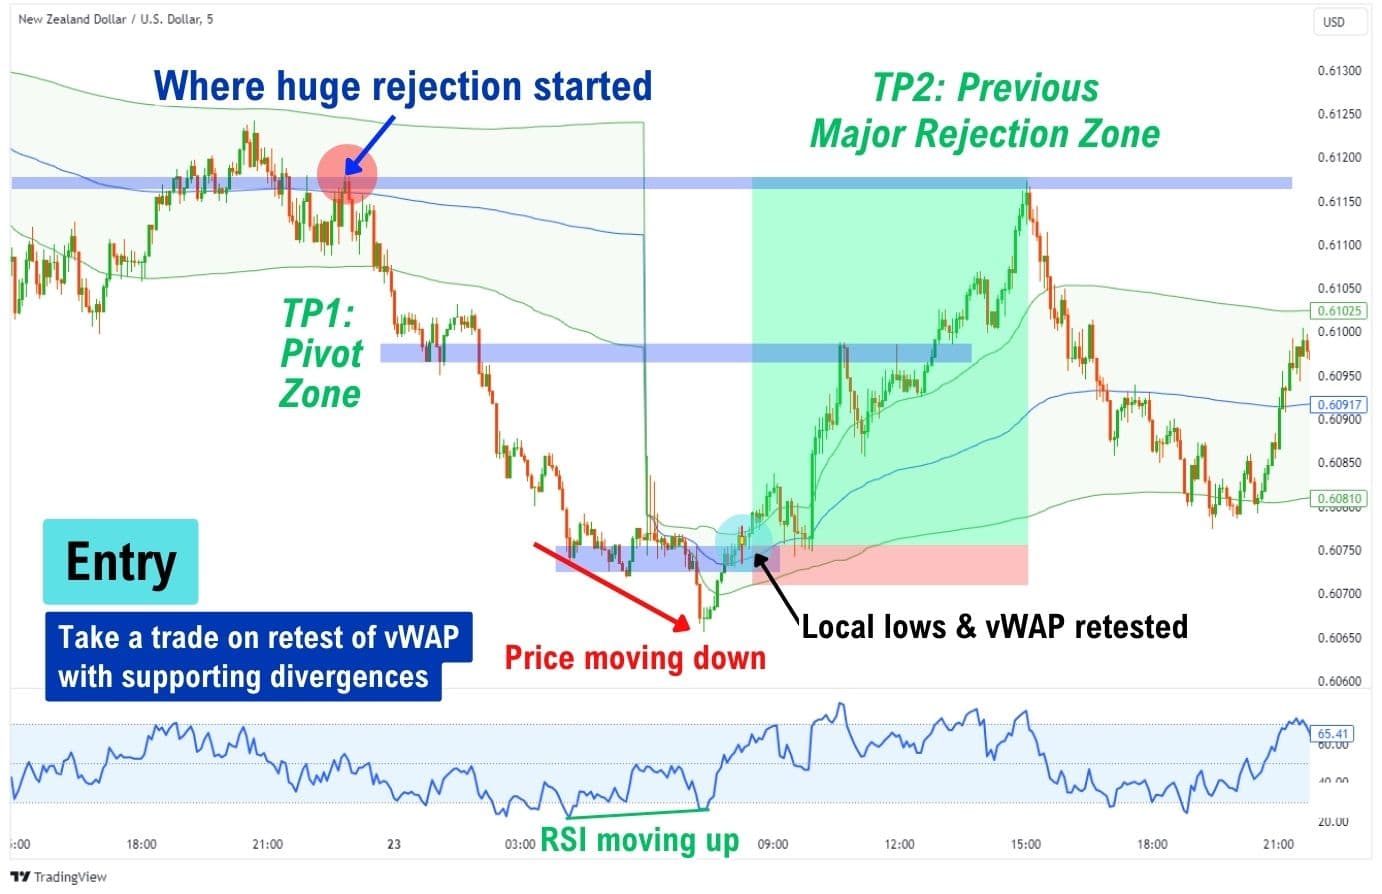
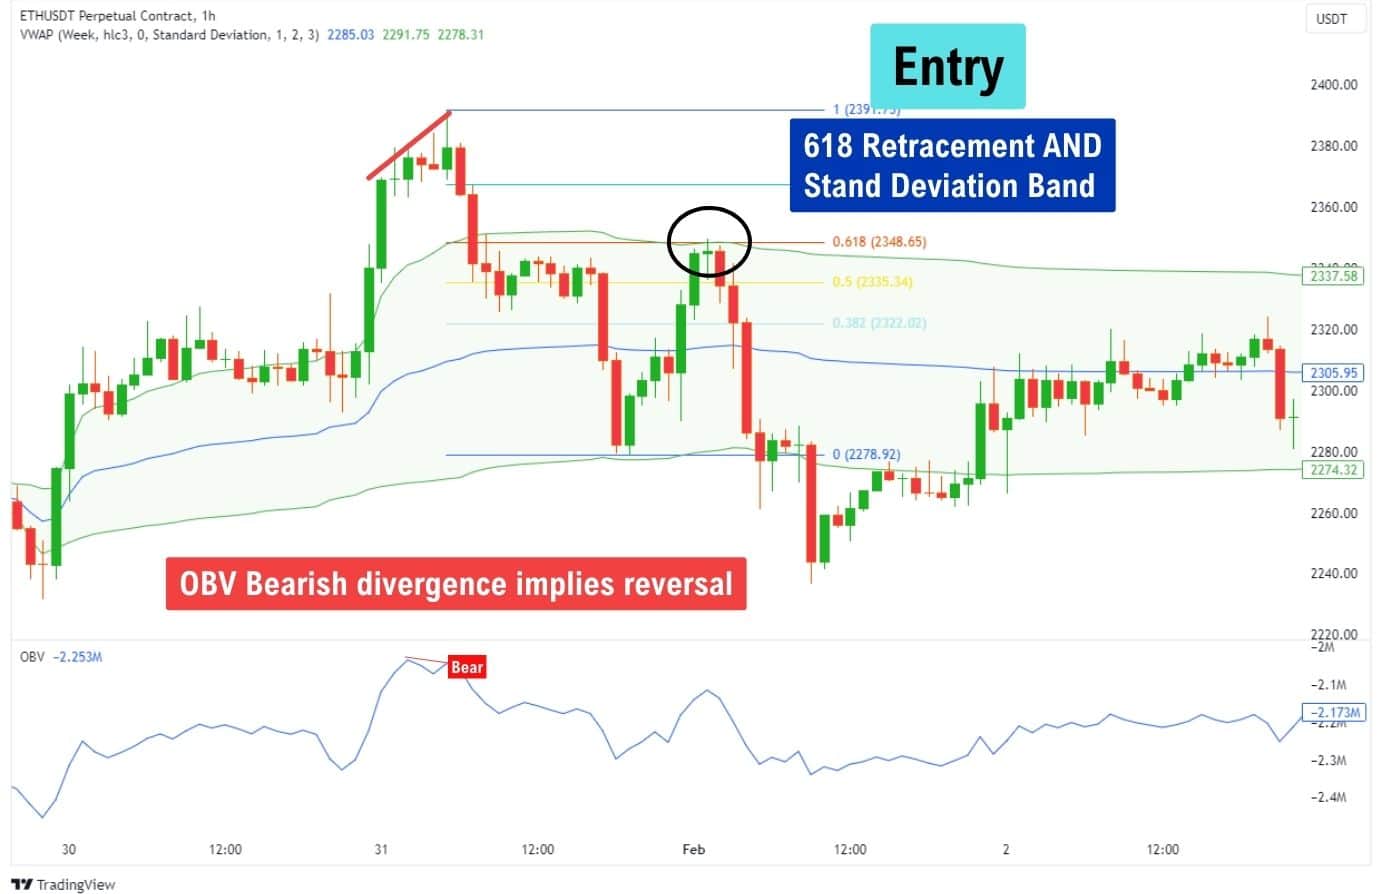
This strategy uses the vWAP as simple support and resistance, setting up simple long trades when the price retests the vWAP or its standard deviation band. As long as the price fails to break these levels, you have what’s called a rejection, which is a reversal trade signal that can be taken.
Here’s how it works:
- Find an asset with the vWAP line curving up or down.
- Mark out the support and resistances on your timeframe.
- Use a momentum oscillator like the Relative Strength Index (RSI) to find a bullish or bearish divergence.
- Check if these conditions are met when the price approaches your marked levels:
- Is the oscillator forming a bullish or bearish divergence?
- Did the price create a rejection with a closed candle?
- If the price managed to break the level, was it quickly reclaimed? For example in the image above, the price broke falsely lower, then rebounded to above the vWAP.
- Only enter a trade when 2 or more of the listed conditions in Step 4 are met.
In our example, you’ll also notice how the price has broken out of the standard deviation bands, showing a strong trend
In our example, you’ll also notice how the price has broken out of the standard deviation bands, showing a strong trend
| Recommended Indicators: -vWAP -RSI (Relative Strength Index) Entry Signal: -In an uptrend, look for a bullish divergence and long trade -In a downtrend, look for a bearish divergence and short trade Exit Signal: -Stop Loss at the most recent high or low -Take Profit at the next S/R Level |
Mean Reversion Trade to vWAP
Recommended Indicators:
- vWAP
- RSI (Relative Strength Index)
Entry Signal:
- In an uptrend, look for a bullish divergence and long trade
- In a downtrend, look for a bearish divergence and short trade
Exit Signal:
- Stop Loss at the most recent high or low
- Take Profit at the next S/R Level
Mean Reversion Strategy Trade to vWAP
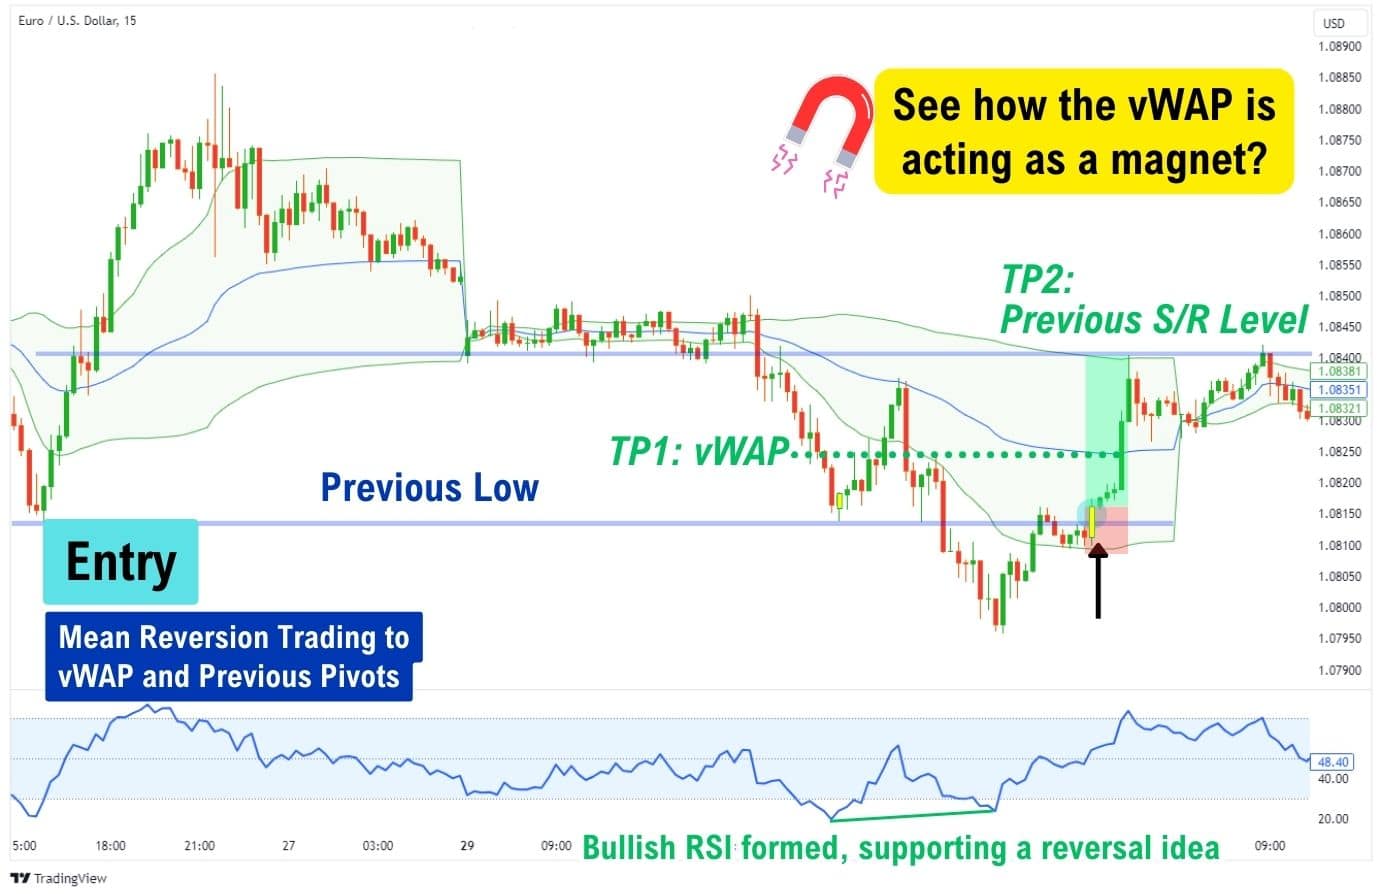
Because the market loves to retest the vWAP, we can flip the simple support and resistance trading strategy on its head and create another strategy. Rather than trade from the vWAP, we can trade towards it.
Here’s how it works:
- Find an asset with the price moving outside of the standard deviation bands.
- Mark out the support and resistances on your timeframe.
- Using a momentum oscillator like the RSI to find a bullish or bearish divergence.
- Check if these conditions are met when the price approaches your marked levels:
- Has the price fallen out of the standard deviation band?
- Was there an RSI divergence that formed and supports your reversal trade idea?
- Did the price create a rejection at the support or resistance level with a closed candle?
- If the price managed to break the level, was it quickly reclaimed?
- Only enter a trade when 2 or more of the listed conditions in Step 4 are met.
Recommended Indicators:
- vWAP
- RSI (Relative Strength Index)
Entry Signal:
- On the formation of a bullish or bearish divergence at a key level
- If the price is above the vWAP, look for a short trade from a resistance above the vWAP
- If the price is below the vWAP, look for a long trade from support below the vWAP
Exit Signal:
- Stop Loss at the most recent high or low
- Take Profit at the vWAP, or next S/R Level
Secret S/R Level: Previous Day vWAP Strategy
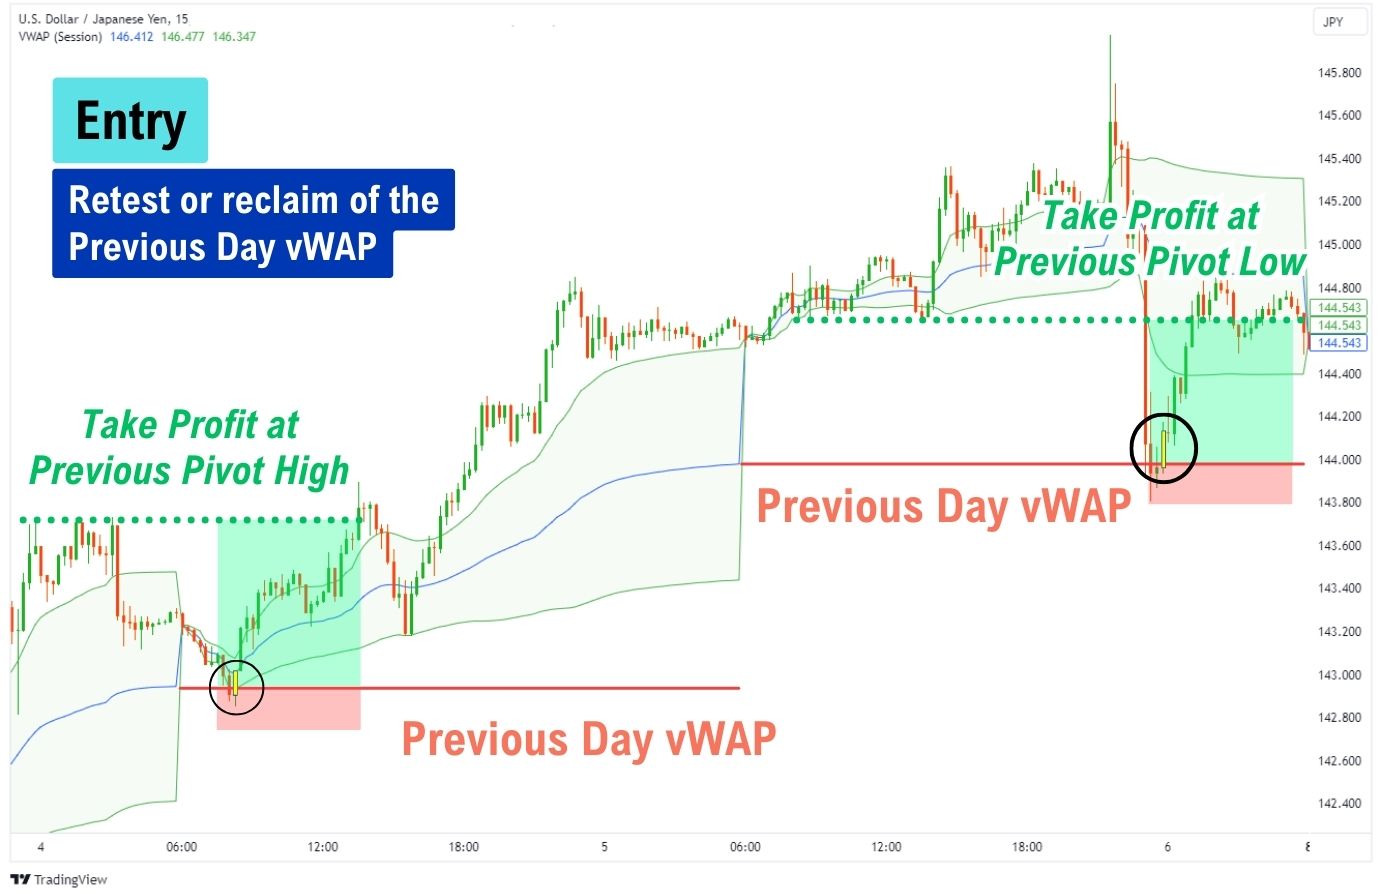
Not many people know that the previous day’s vWAP is a hidden support/resistance level you can trade! Sometimes even the previous 2-day vWAP is a hidden level. The logic behind this is that they are values of interest as they are both the average price of the previous day, but with the area where the most volume was transacted yesterday – this implies market interest in these areas.
This strategy is simple to execute and provides a new rhythm for beginners. It’s essentially a “One day, one trade” type of strategy. However, it’s key to remember not to chase for a trade as there will be days that prices do not retest the previous day’s vWAP.
Here’s how it works:
- Choose ‘Session’ as your anchor period. This is your intraday period.
- Mark the closing price with a horizontal line of the previous day vWAP.
- Pick a smaller timeframe such as 5 – 15 minutes.
- Wait for a rejection or bounce at the previous day’s vWAP (pfvWAP) on the price chart.
- On the formation of a confirmed bullish or bearish candle, enter a trade.
- Take Profit at the current day vWAP or next S/R Level.
As always, do keep in mind that the vWAP works best if you have a greater understanding of market conditions and market structure.
Recommended Indicators:
- vWAP
Recommended Settings:
- 15 15-minute timeframe or less (For best entries)
Entry Signal:
- On the retest of pdvWAP, look for a formation of a bullish or bearish candle
- If the price is above the pdvWAP, look for a long trade (bullish candle)
- If the price is below the pdvWAP, look for a short trade (bearish candle)
Exit Signal:
- Stop Loss at the previous high or low
- Take Profit at the vWAP, or the next S/R Level
Advantages of VWAP
Like every other indicator, the vWAP has its pros and cons. The key is to backtest the anchor period that’s best for your trading style and best for the asset you’re trading. Since the vWAP is volume-based, it works better with assets that are more frequently traded.
Easy to understand: The vWAP can be traded easily by just using it as a dynamic Support/Resistance price line, just like a moving average.
Versatility: The vWAP can help find trades in any direction, on any timeframe and on any asset. The anchor period can be adjusted for traders to find both short and long-term opportunities.
Many Trade Opportunities: The vWAP will provide many scalp signals on smaller timeframes such as the 1 minute, to 15 minute.
Disadvantages of VWAP
Although the vWAP comes with a whole suite of flexibility, this also means it can provide too many signals at times, with many being false signals.
Choppy: Price may not respect the vWAP or the bands at times, leading to extremely choppy price behaviour which often will wick traders out of positions.
Cannot be used reliably when contracted: Because of the vWAP’s nature to reset its calculations, it’s not advised to use the vWAP at the start of a new session. The general rule of thumb is not to use the vWAP when it is contracted (squished together).
If you’re trading on a daily session, wait until the New York Open (UTC-5, 21:30). If you’re using a weekly anchor period, it’s a good idea to wait for at least 24 hours.
No Stop Loss or Take Profit: Standalone, the vWAP indicator does not provide a stop loss or take profit for trades. You need to apply an understanding of the market structure, or use other tools such as the ATR indicator to set an optimal stop loss and take profit.
What indicators work best with VWAP?
Some suggestions of the technical indicators you can add to your vWAP trading are:
- Relative Strength Index (RSI)
- On Balance Volume (OBV)
- Money Flow Index (MFI)
- Fibonacci Retracement
The vWAP works best when combined with the momentum oscillators, divergences, and also a strong understanding of support and resistances. So with that being said, let’s break down each simple suggestion we’ve listed here.
Relative Strength Index (RSI)
By looking for RSI divergences at key levels such as the vWAP or the vWAP bands, traders can get an early indication of when to enter a trade. This indicator can refine your entries to have better risk-to-reward ratios and a tighter stop loss.
Other Momentum Indicators
Similarly to the RSI, you can use the On-Balance-Volume (OBV) or Money Flow Index (MFI) momentum indicators to look for divergences. Both these indicators display how much money is coming in or moving out of an asset, which can provide a leading insight into trend reversals.
Fibonacci Retracement
The Fibonacci may appear deceptively complex, but it’s a rather simple tool to add conviction to your trade ideas. By combining the vWAP with Fibonacci, you can get a clear idea of which retracement level the price is more likely to react to. The most common traded levels are 0.382, 0.5, and 0.618.
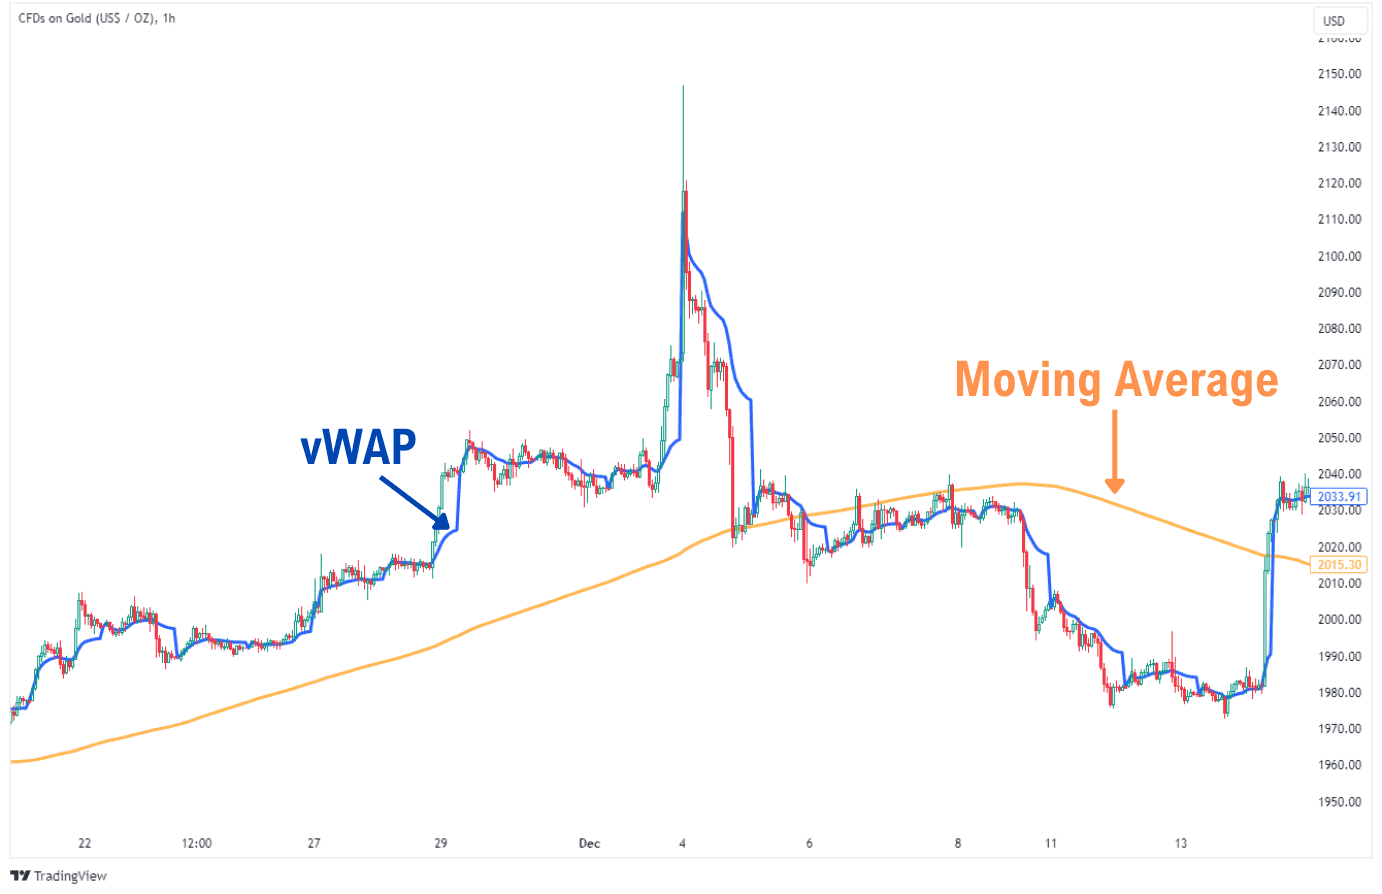
VWAP vs Moving Averages?
When compared to the moving average, the location of the vWAP will not change when you change the timeframe. This is because the vWAP is calculated according to fixed time periods, such as session (24-hour trading day), week, month, quarter, year, decade, and century.
Moving average indicators also do not take volume into account, and simply find the average price of previous candlesticks. Many financial institutions use the vWAP instead as it takes volume into account.
Simple Moving Average (SMA) vs vWAP
The simple moving average will not take into consideration price and therefore is just an average of prices traded. However, if a lot of volume is traded at a given price, this implies a lot of interest from traders at that price level.
As a result, volume weighted average price may be preferred in certain scenarios to discern what the true typical price is.
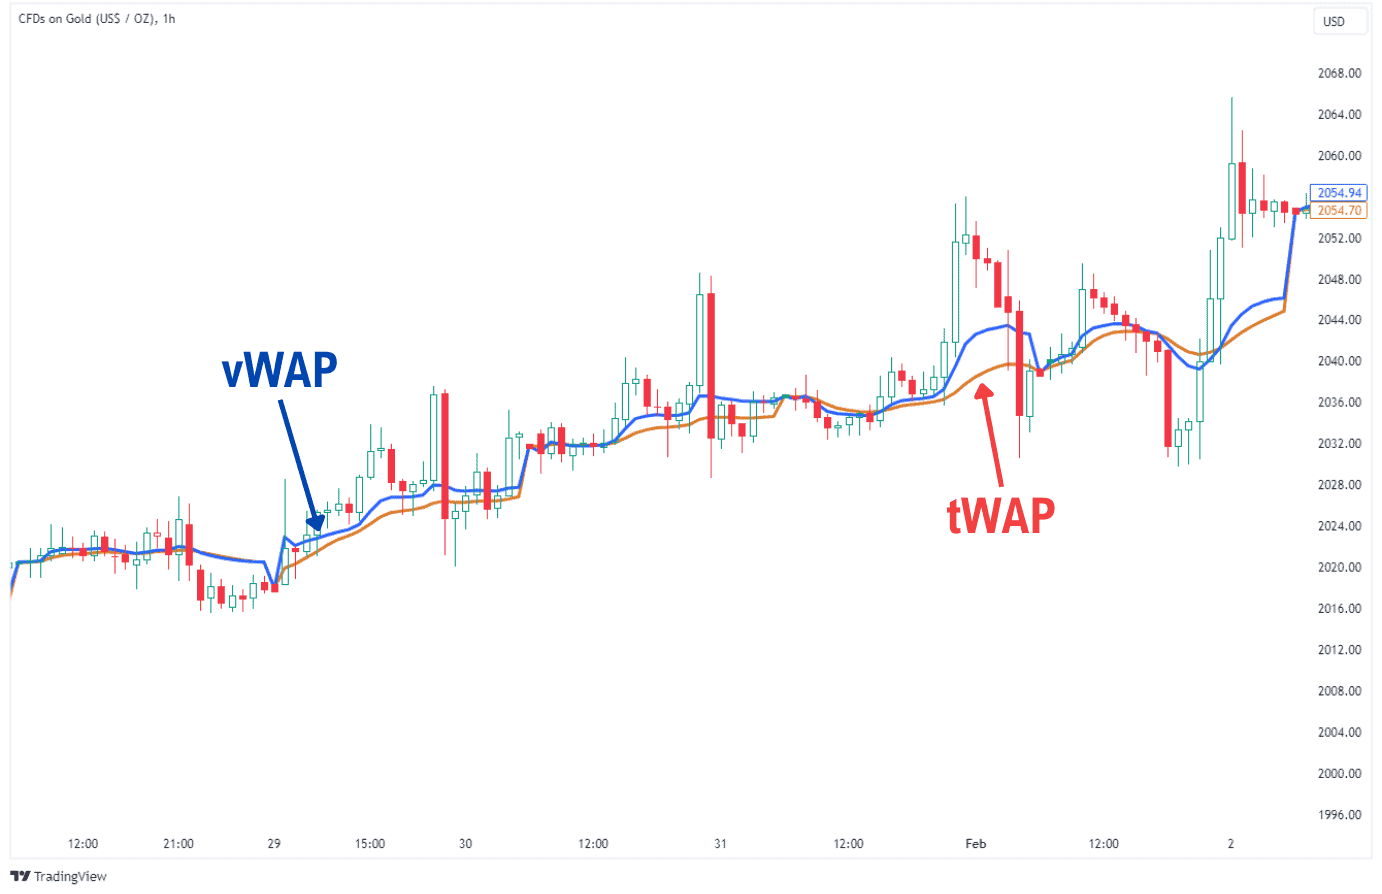
VWAP vs TWAP
tWAP refers to Time-weighted Average Price, which behaves similarly to the vWAP, but instead of factoring in volume, it factors in time into its calculation. Like the vWAP, the tWAP has a calculation period that resets with its anchor period, resulting in a similar presentation of the price line.
The user experience and the way you operate the tWAP is similar to the vWAP indicator.
VWAP vs VWMA
vWMA refers to the Volume-weighted Moving Average, a moving average that considers volume just like the vWAP. Unlike vWAP, the vWMA does not reset its calculation period. This results in a continuously flowing, smoother-looking, more rounded-out price line, unlike the more jagged vWAP line.
The user experience and the way you operate the vWMA is similar to the moving average indicator.

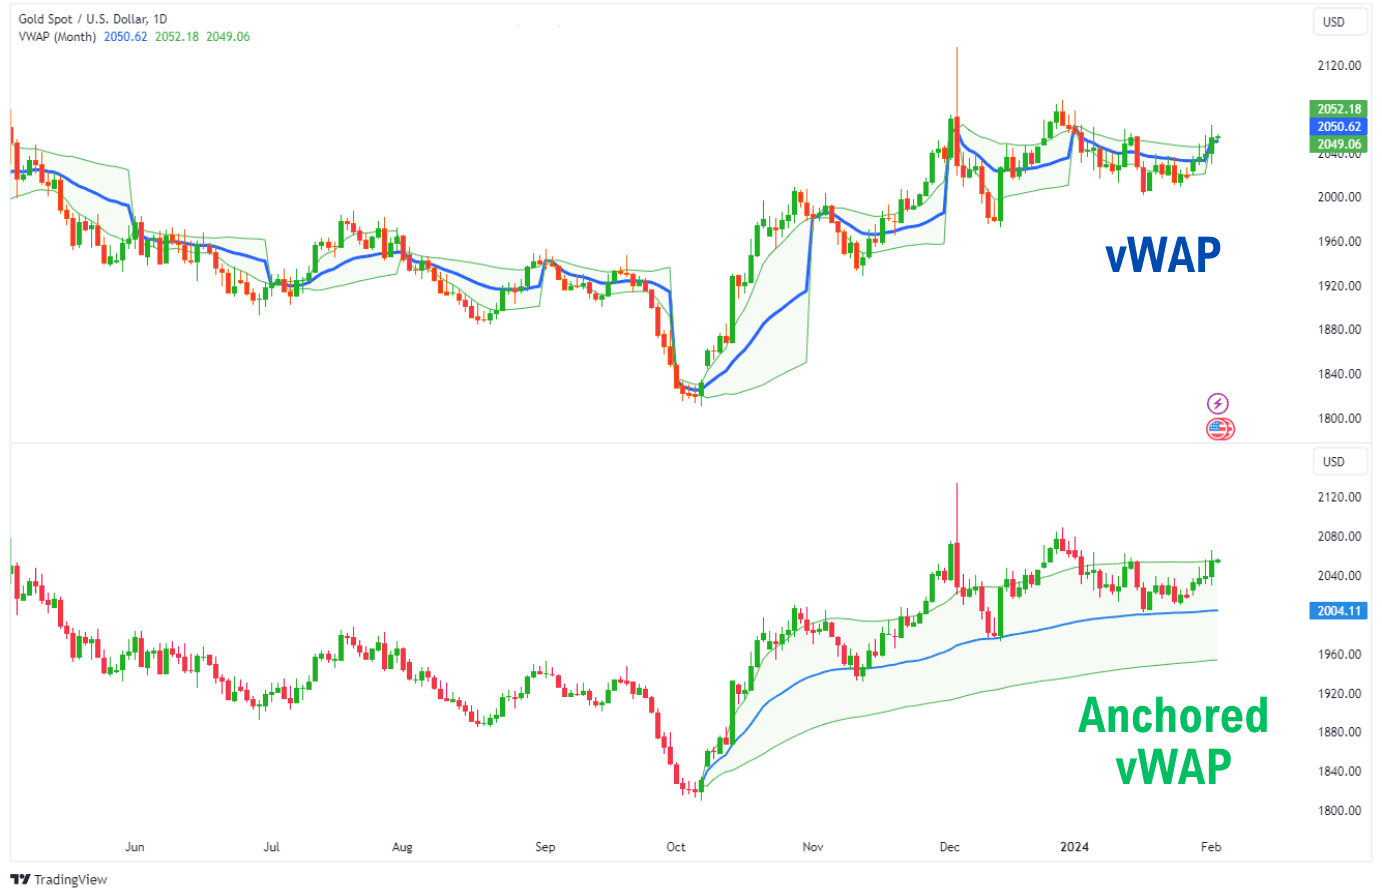
Anchored VWAP vs VWAP
The anchored vWAP is like a cross between the vWMA and the vWAP. It is a tool used to fix the vWAP to a starting location of your choice, and calculate the vWAP until the most recent candlestick. Just like the vWAP, you can display standard deviation bands. Unlike the vWAP however, the anchored vWAP does not reset its calculation period and merely calculates from your starting point to the most recent candle.
Since the anchored vWAP is a tool on most charting platforms, this will not count as an indicator, and will be treated like a drawing like the Fibonacci retracement tool.
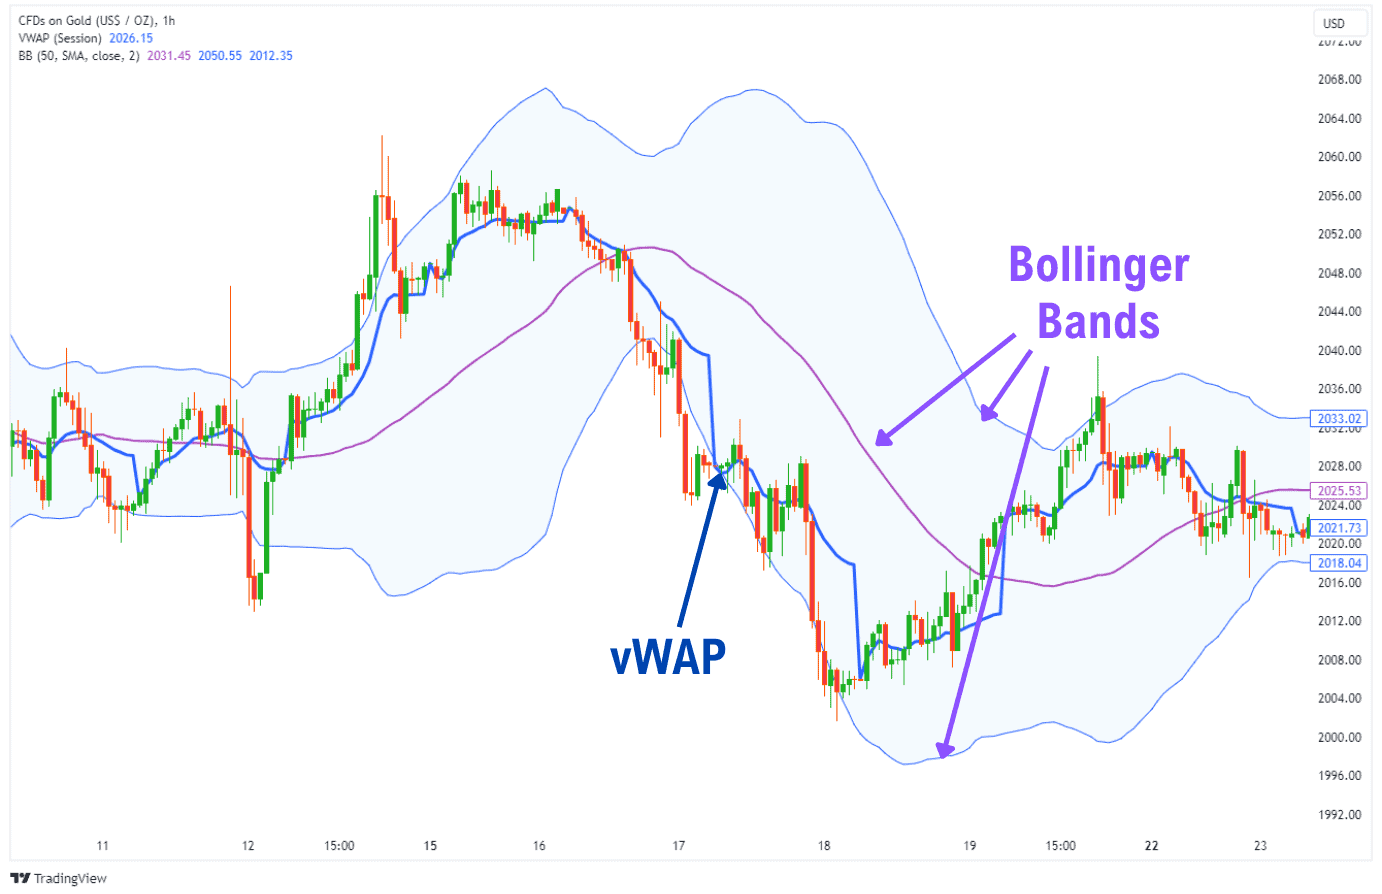
VWAP vs Bollinger Bands
The Bollinger bands are similar to the vWAP’s standard deviation bands, where the top and bottom bands are zones for anticipating a reversal. Both indicators calculate the standard deviation away from their mid-line, which is the average price.
The vWAP calculates its average price by factoring in trading volume, meanwhile, the Bollinger bands rely on an adjustable moving average. The top and bottom bands in both indicators are used as reversal signals, however, it’s worth noting that in strong trending conditions the price may hug the top or bottom bands continuously (until it truly begins to reverse). This can be seen in the example below.
VWAP vs RSI
The RSI refers to the Relative Strength Index. It is a type of indicator that belongs to the oscillator family, which seeks to measure price momentum. Unlike the vWAP, the RSI indicator does not reveal the average price, standard deviation bands, and exact price points to pay attention to. Instead, the RSI appears in a separate pane, and aims to achieve a few things:
- Measure the momentum and strength of an asset
- Show when the asset is overbought or oversold, signalling a reversal
- Show when there is a divergence in the price action and the momentum, signalling a potential reversal
Both the vWAP and RSI can be used simultaneously to create more powerful entry signals.

FAQ
Common mistakes traders make when using VWAP?
When trading the vWAP indicator, many traders make the mistake of blindly taking reversal trades on the vWAP or the standard deviation bands. The key here is to observe the market conditions, so we can avoid taking low-probability trades.
Here are three main factors to help you identify the market conditions.
- Check the trend: If the vWAP is curving up or down, we’re in a trending environment. If the vWAP is flat, we are in a range. Checking the trend will help you determine which strategy has a higher probability of playing out.
- Check for conflicting signals: There may be bigger, more worrying signals that go against your vWAP trade idea. One of which could be a macro divergence that’s formed on a daily, weekly, or even monthly timeframe. If this divergence is going against your vWAP trade, it is better to proceed with caution. The danger is doubled if this divergence forms as we reach a macro S/R level, such as a yearly high or low.
- Check for upcoming economic announcements: Using a tool like an economic calendar can help you have better expectations of market behaviour when you trade. During announcements such as the FOMC, nonfarm payrolls etc., prices can move erratically and not respect the vWAP. This is simply because of volatility skyrocketing in these situations. In such scenarios, it may not be a good idea to rely on vWAP.
What are the best VWAP settings for Day Trading?
The best vWAP settings for day trading, or intraday trading would be ‘Session’ or ‘Week’ anchor periods. These settings inform you of the ‘True Average Price’ traded during the day, or week (if you are looking to hold the trade for hours).
What are some common applications of VWAP in algorithmic trading?
vWAP is commonly used in algorithmic trading as a benchmark to build buying positions at a lower price, and build selling positions at a higher price than the vWAP. The idea here is to fetch a better deal than the typical price. Generally, the vWAP algorithms perform better by trading during volume spikes that either lead into a sharp mean reversion, or trending environment.
vWAP algorithms are not perfect, but they can be greatly improved by incorporating predictive mechanisms for volume spikes – i.e. incoming volatility.
How reliable is VWAP?
The vWAP’s reliability depends on the asset you’re trading, and the strategies you employ. While institutions favour the vWAP, keep in mind they are also able to absorb larger drawdowns than the average trader, and thus, play with a larger stop loss. The same cannot be said for retail traders.
Generally, the vWAP will not perform well on assets with low liquidity as there isn’t enough volume data. Blindly taking trades based on the vWAP line or standard deviation bands can be dangerous as well, especially when using high leverage and a tight stop loss.
So in conclusion? The vWAP isn’t going to be that magic indicator to tell you the exact reversal levels. But then again, no indicator will do that.
Rather, retail traders should think of the vWAP as an additional layer of confluence to add to your market analysis. Observe where the vWAP lines up with support and resistances, Fibonacci levels, and divergences, and you’ll be able to use the vWAP reliably.
Should you buy the above VWAP?
You should only buy above the vWAP if the asset has experienced a spike in price (breaking the vWAP line) and volume recently. This makes the vWAP a likely support zone, where the price can bounce and resume its uptrend.
Is VWAP bullish?
The vWAP is not inherently bullish or bearish, but rather, it shows a stock’s average price. When the vWAP line is curving up, you can then consider the asset to be in a bullish state.
Is VWAP Leading or Lagging?
The vWAP is a lagging indicator as it waits for the concurrent candle to first develop, then takes the trading volume that occurred in the candlestick. Since it is a lagging indicator, it is best complemented with the use of leading indicators as well.
Is Stock Market best suited for using VWAP?
The stock market is a great place to apply the vWAP and algos based on it, as it’s a high liquidity market. However, it’s important to remember to wait for the New York open, so that trading volume can come into the markets.