


Written by:

Reviewed by:

- May 10, 2024
- 31 min read
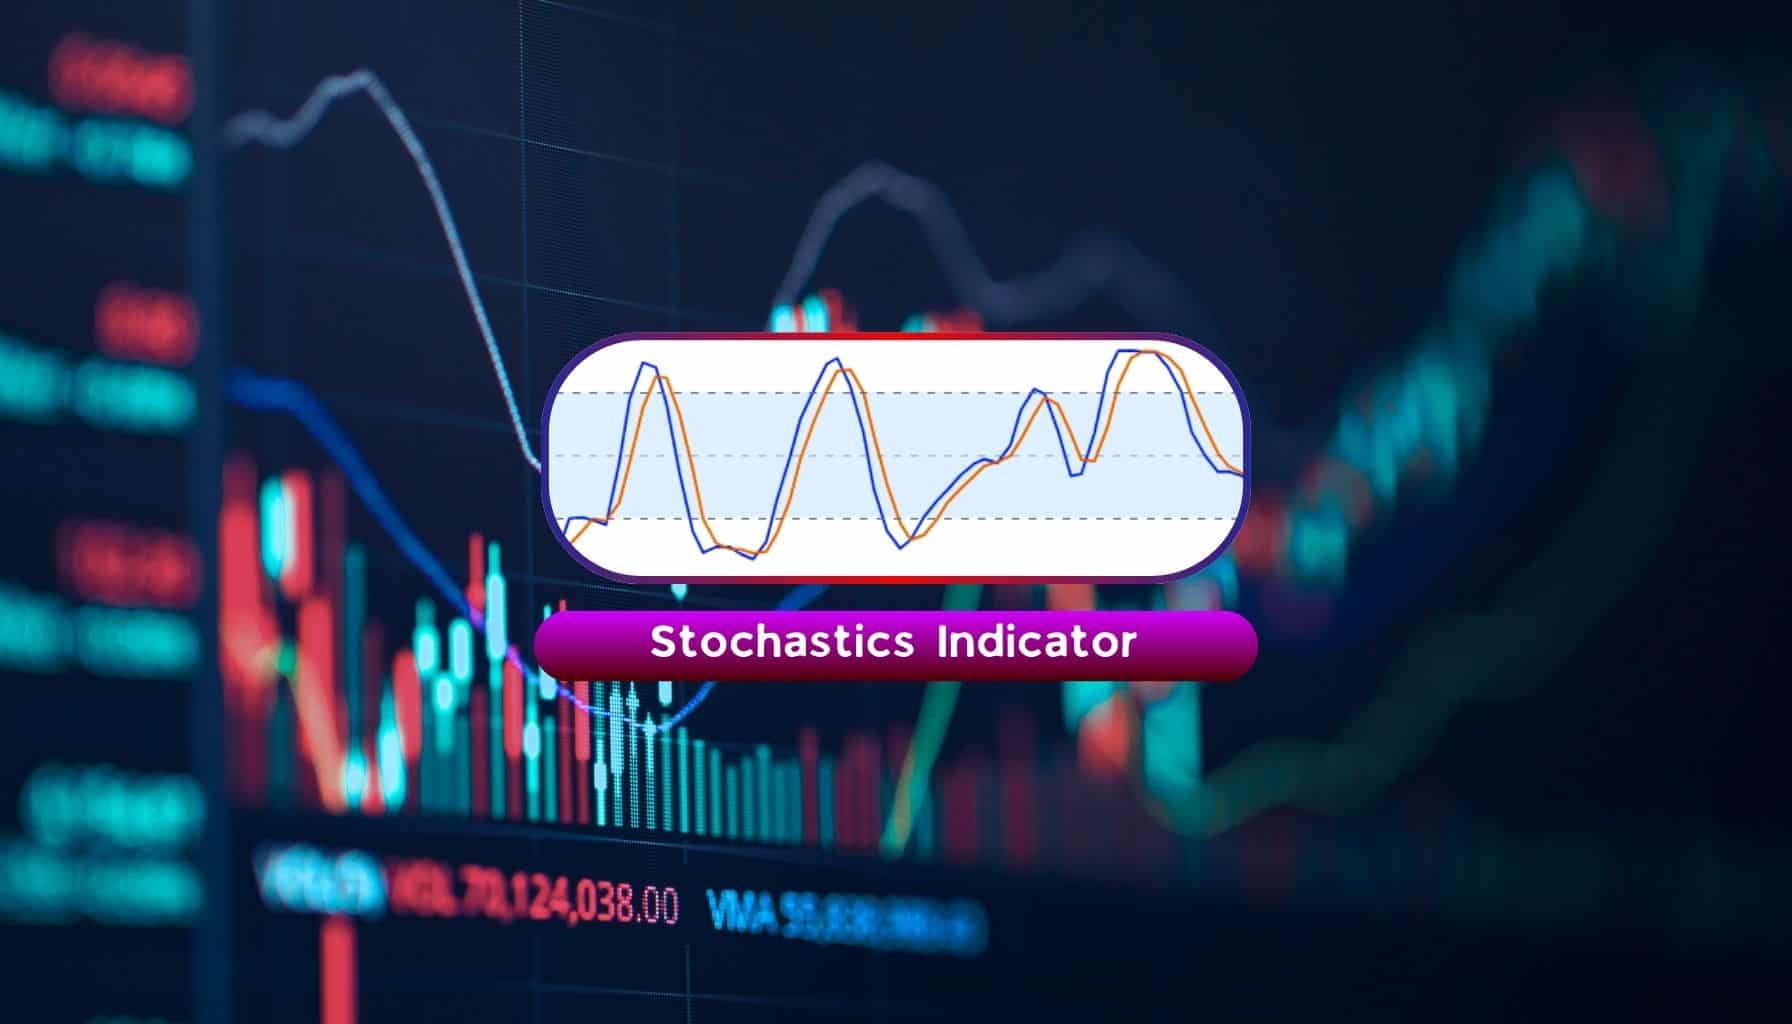
Stochastic Oscillator Indicator Explained
What is the Stochastic Oscillator (aka Stochastic Indicator)?
The Stochastic Oscillator is a momentum indicator which in simple terms evaluates a specific closing price of a financial instrument in relation to its range over a defined time span. The idea is that this will help traders understand the momentum and speed at which prices change.
The Stochastic oscillator is a popular and well-known technical indicator that was developed in the 1950s, yet remains relevant today thanks in large part to its versatile nature. The developer of the Stochastic Oscillator, George C. Lane stated in an interview that “the Stochastic Oscillator “doesn’t follow price, it doesn’t follow volume or anything like that. It follows the speed or the momentum of price. As a rule, the momentum changes direction before price.”
Another key point to remember is that the stochastic oscillator operates on the principle that a market trending upward will generally see prices close near their high. In a downtrend, prices tend to close near their low.
What is Momentum?
Momentum has been a key part of securities trading and trading in general. Momentum may simply be defined as “how quickly the price of a financial product, like a stock, bond or currency pair, is increasing or decreasing. It’s like watching a car speed up or slow down. The faster the car’s speed (or price), the more momentum it has.”
What is the Importance of Stochastic Oscillator?
The stochastic oscillator assists traders with identifying turning points and confirming price divergences.
When the oscillator turns down from high levels, it suggests the bullish momentum is slowing. Additionally, if the oscillator turns up from low levels, the bearish momentum is slowing.
The Stochastic Oscillator acts like a fuel gauge for trends. When a trend is running out of steam, this tool gives a heads-up that a reversal might be around the corner. It also takes into account how quickly prices are changing, similar to how a speedometer shows how fast a car is going. This helps traders understand the intensity of price movements within a certain range.
The stochastic oscillator shows traders when price divergences appear. Price divergences are a result of when the asset goes one way, but the stochastic marches in the opposite direction. This is another signal of slowing momentum and a price reversal is potentially around the corner.
How to Calculate the Stochastic Oscillator
Knowing the stochastic calculation is important to understand how it works. Fortunately, most trading platforms have these calculations built in which saves a lot of time and reduces mistakes.
This is the simplest way to explain the calculation of the Stochastic Oscillator:
- Find the last price at which the security was traded. We’ll call this C.
- Look at the past 14 trading sessions and find the lowest (L14) and highest (H14) prices at which the security was traded.
- Take C and subtract L14 from it. Then, divide that by the difference between H14 and L14. Finally, multiply the result by 100. This gives you the value of the Stochastic Oscillator.
This will give you a number from 0 to 100. This number shows where the last price falls compared to the highest and lowest prices over the last 14 trading days.
Stochastic Indicator formula
The formula used to calculate the Stochastic Oscillator is relatively straightforward. The calculation presented below is based on a period of 14 days but can be changed according to the preferences of the trader.
| %K = [(C – L14) / H14 -L14)] x 100 |
A quick breakdown of the symbols used:
| C = Latest closing price L14 = Lowest low over the period in question (14 days) H14 = Highest high over the period (14 days) Once %K is calculated, it is plotted as a line on a section below the chart. |
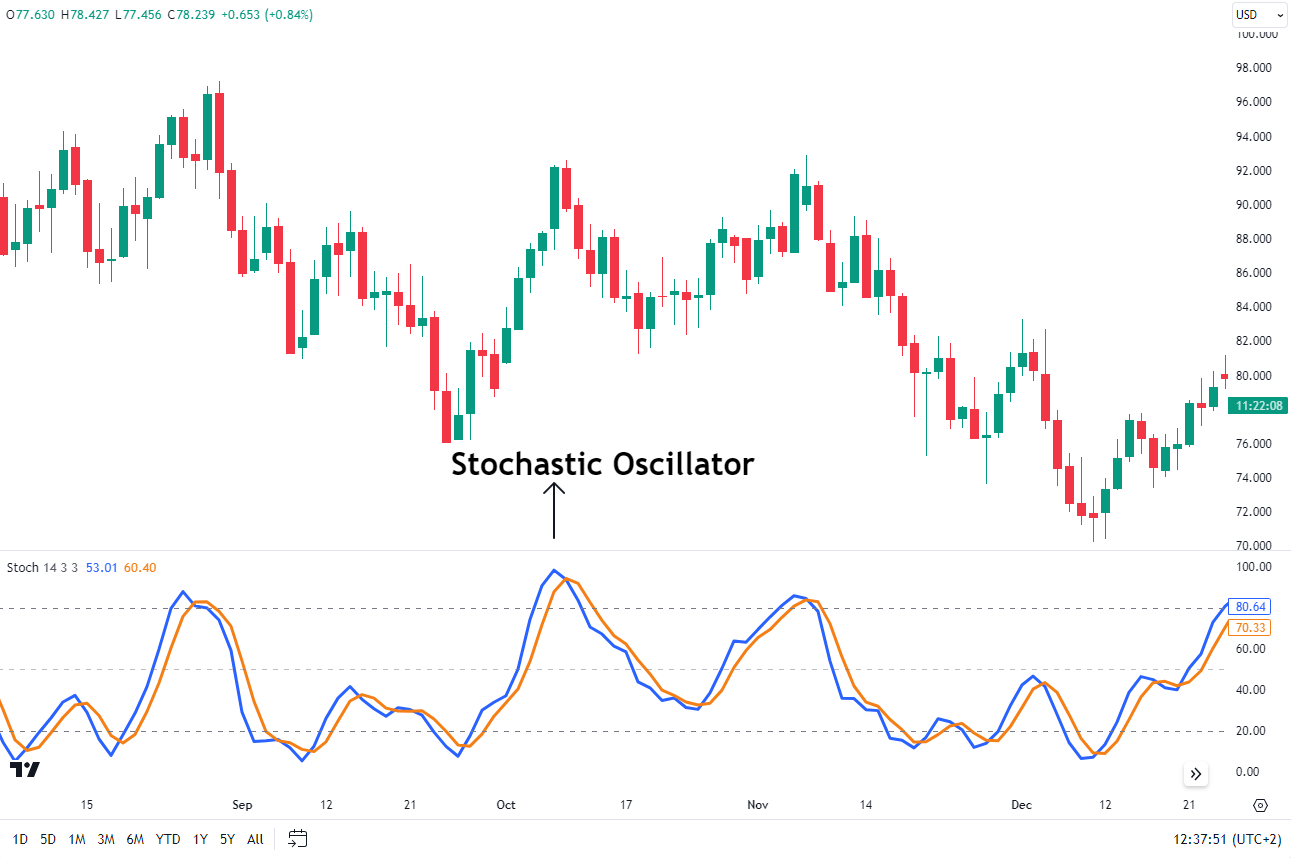
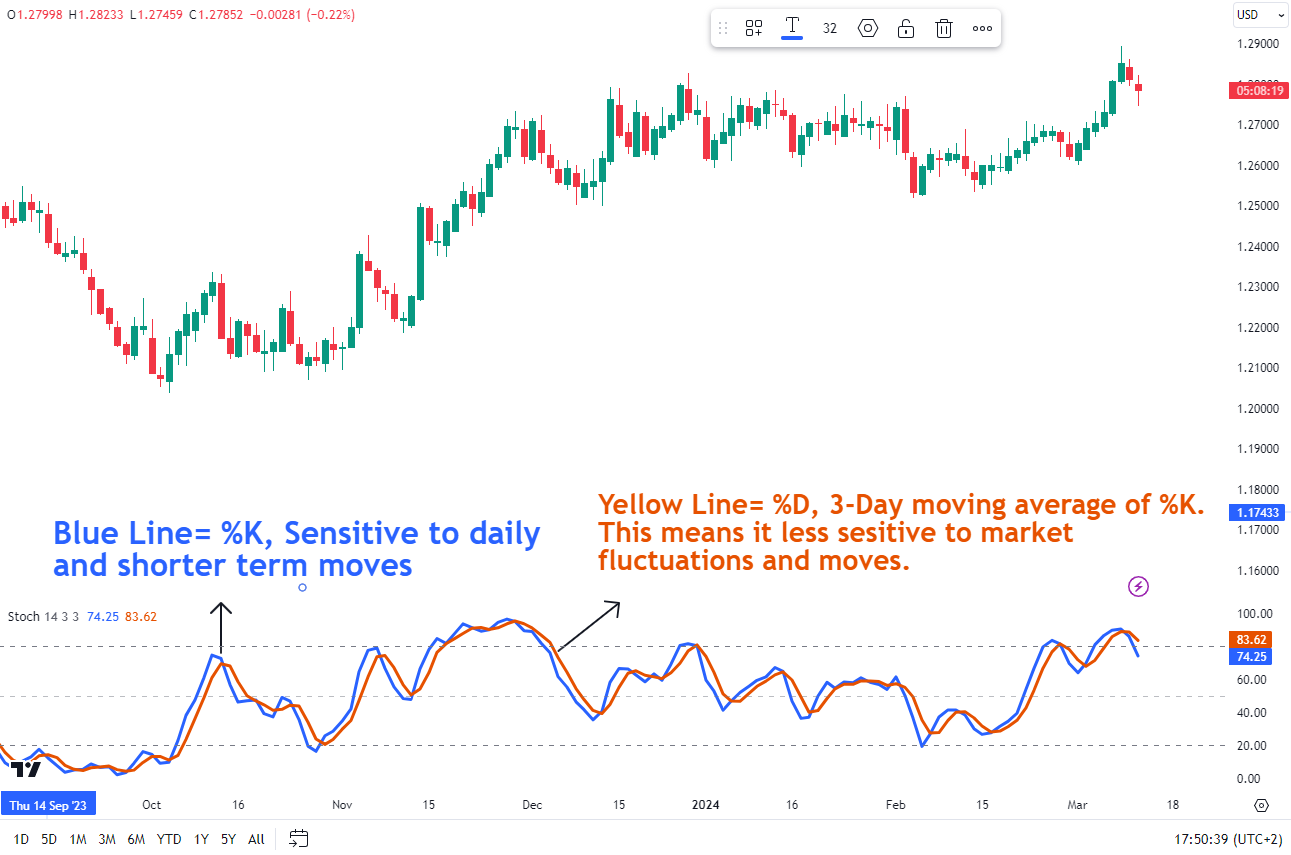
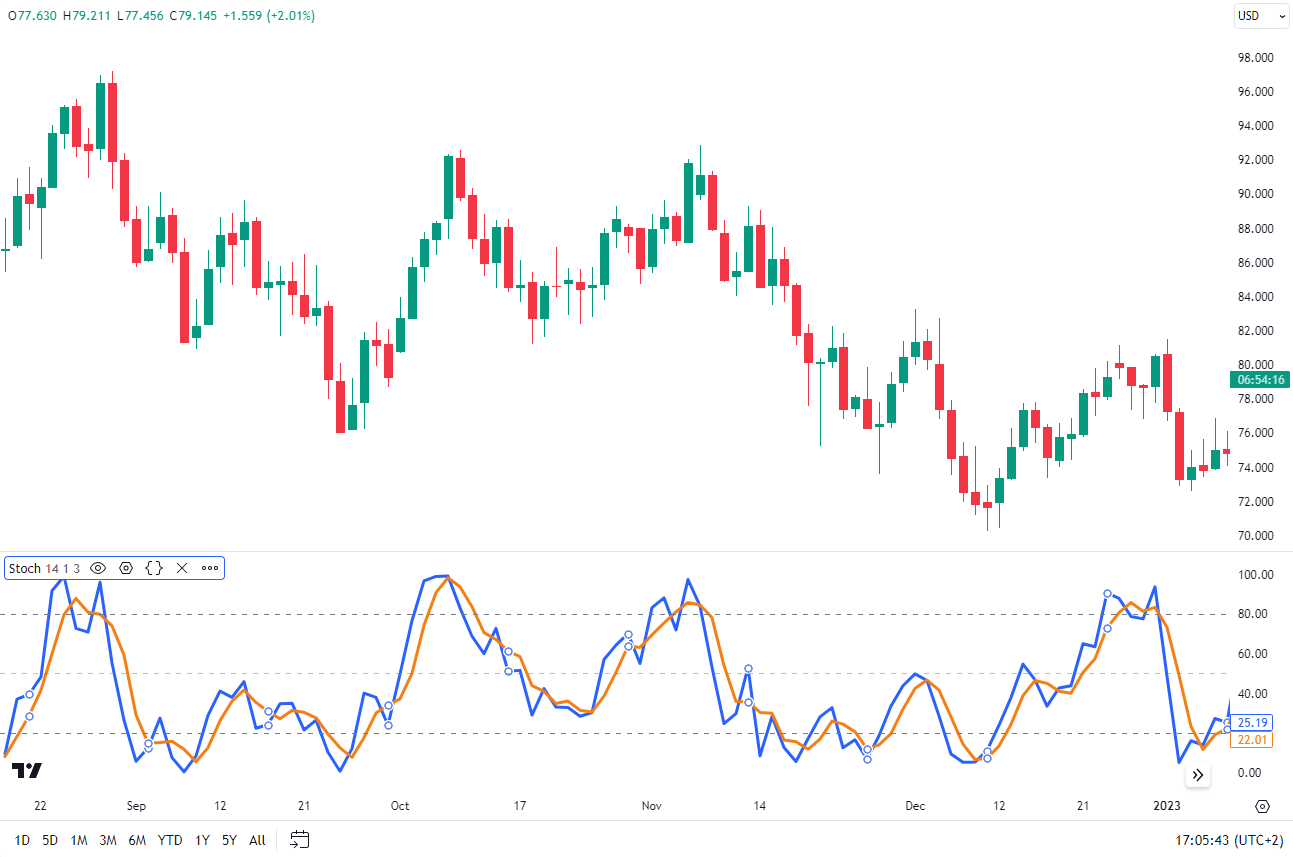
You may notice there are two lines that appear on the chart. The second line, the %D line, is a moving average of the %K line.
%D is a 3-period simple moving average (SMA) of %K. It is also called the ‘stochastic slow’ due its slower reactions to market price changes, as compared to %K.
Example of the %K and %D lines on a chart
How Does the Stochastic Indicator Work?
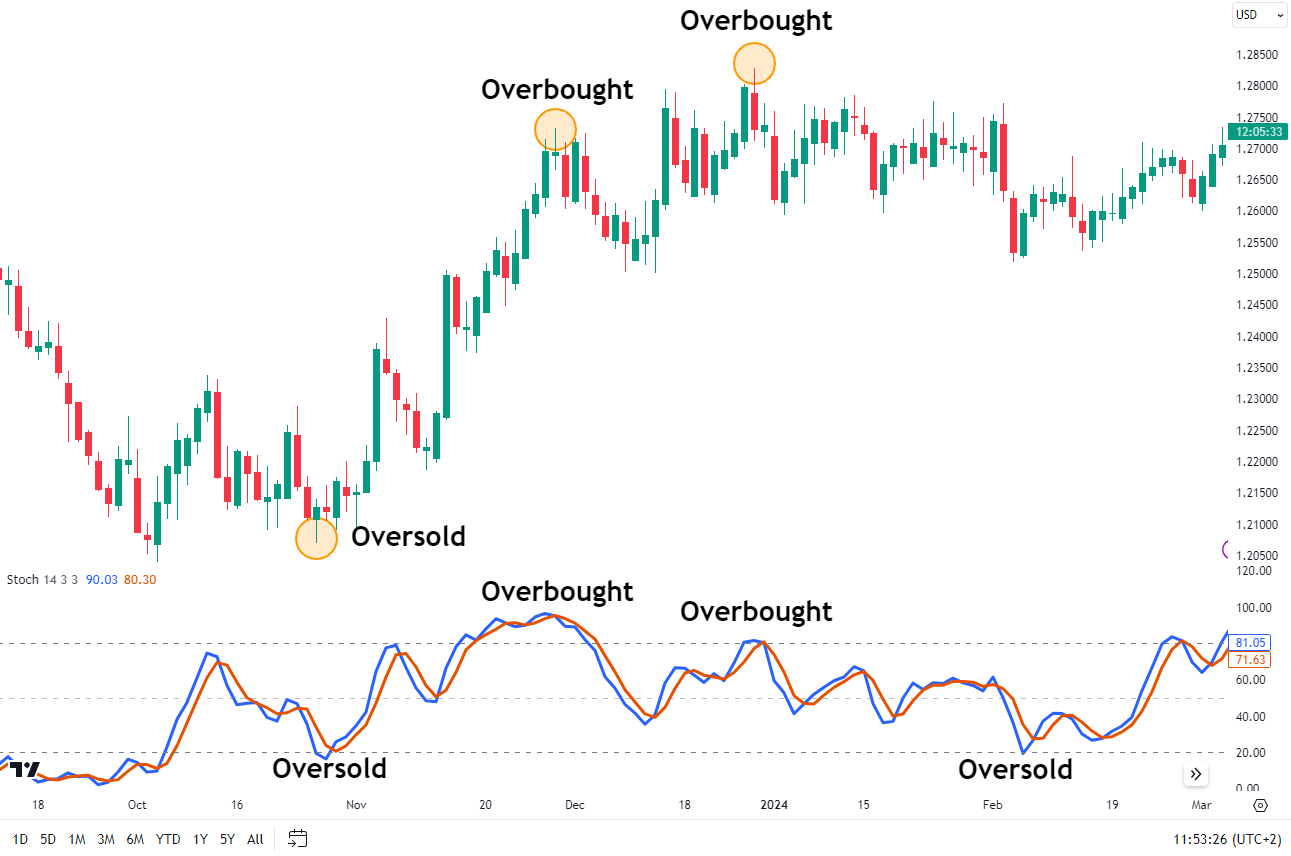
Stochastics is a bounded oscillator which provides readings between 0 and 100. As a result, it is often used to generate overbought and oversold readings indicating a potential trend reversal.
An asset is considered overbought when its price has climbed too quickly and is now trading above its fair value. The expectation is that the market will likely correct the price downward soon. An asset is considered oversold when its price has fallen rapidly and is now trading below its fair value.
The standard default settings are 80 and 20. The stochastic readings above 80 mark are an indication that we have entered overbought territory while a reading below 20 is seen as oversold.
When the market is in overbought territory and the stochastic crosses back below the 80 level this is a sign that suggests momentum may be shifting from up to down. When the market is in oversold territory and crosses back above the 20 level then this is a sign that momentum may be shifting from down to up.
Traders occasionally alter these overbought and oversold levels to 85 and 15 as a means to reduce ‘false signals”. Widening the overbought and oversold levels will generate less signals so there is a balance to finding a quality signal with less market noise.
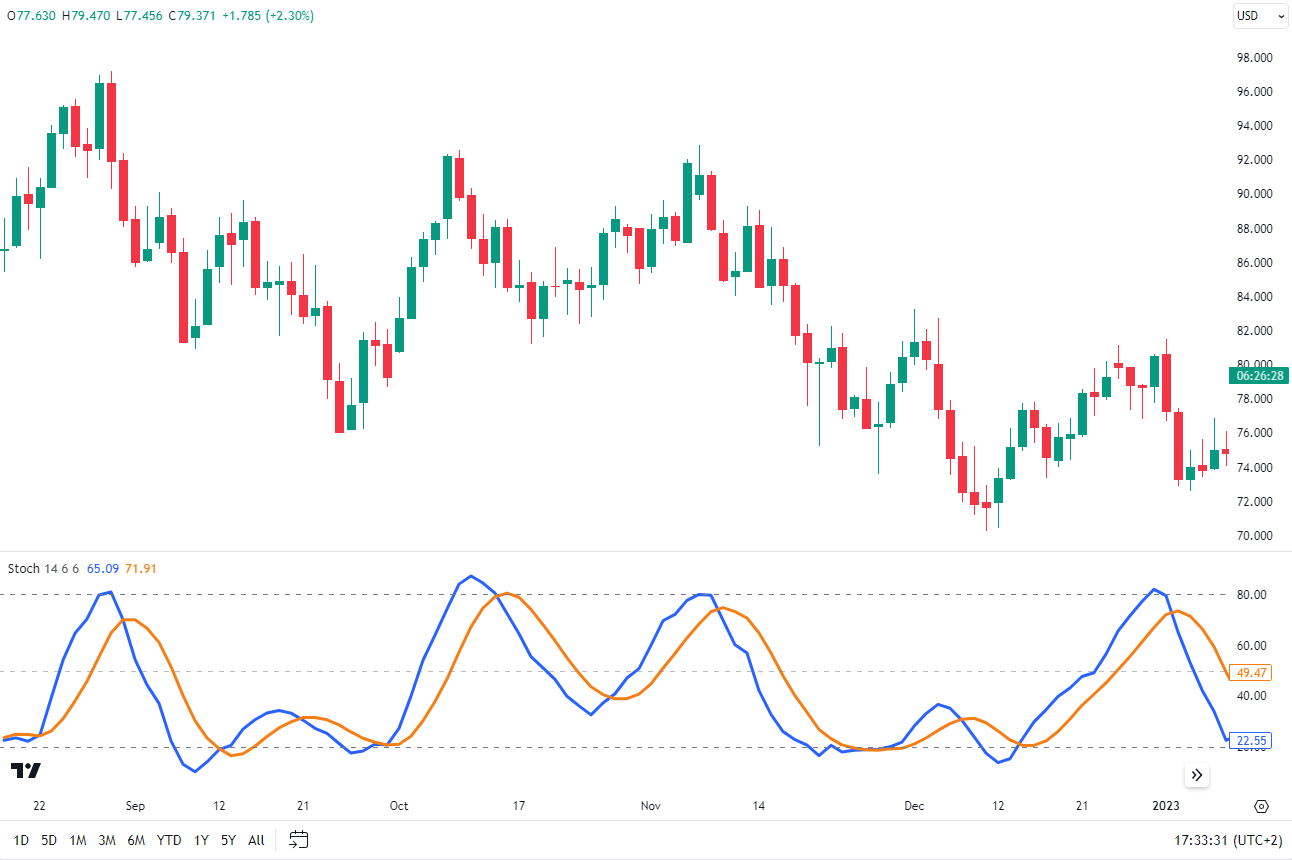
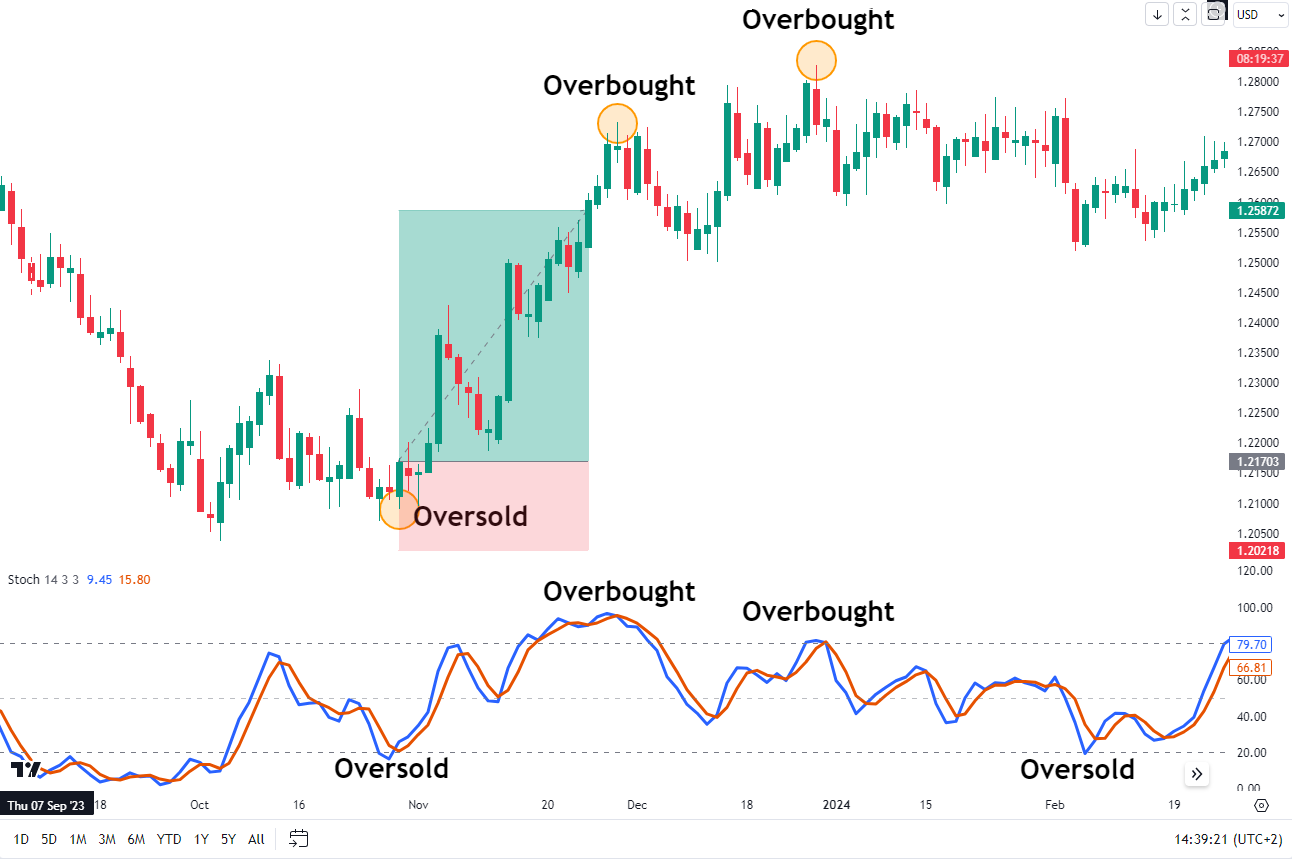
Stochastic Oscillator with Overbought and Oversold On a GBP/USD Daily Chart
| %K Line is in Blue %D Line is in Orange |
When you look at a stochastic, you’ll see the blue line %K and the red line %D. The blue line shows the current value of the oscillator for each trading session. The red line (sometimes a dotted line) is a three-day average of the blue values.When these two lines cross each other, it could mean that the trend might be about to change. This is because the crossing indicates a big change in momentum from one day to the next.
How to Read the Stochastic Indicator
The stochastic oscillator is easy to interpret. It includes two main lines to identify overbought (above 80) and oversold (below 20) thresholds. A third line, often found at the 50 mark in many charting tools, represents the midpoint of the price range. Values above 50 indicate that the asset is trading in the upper part of its recent range, hinting at a possible continuation of an upward trend. Conversely, readings below 50 suggest the asset is in the lower half of its range, possibly indicating a continuing downtrend.
Although the concept is straightforward, it’s important to understand that strong trends can defy expected reversals. Assets can remain in overbought or oversold states for longer than anticipated, underscoring the importance of supplementary analysis. Consider the following when using stochastic in a strategy:
Monitoring Crossovers: A crossover of the two lines could signal an imminent trend reversal by highlighting a significant momentum shift.
Look for Bullish or Bearish Divergence: A divergence between the stochastic oscillator and the price trend is a strong indicator of a potential trend reversal. For instance, if the price hits new lows but the oscillator doesn’t, it may suggest the downtrend is weakening, and prices could start to climb.
Another form of confluence: Combine the oscillator’s readings with support and resistance levels to add confidence of a potential reversal. For example, a stochastic reading turning up from below 20, coinciding with a key support level, provides greater confidence in making a trade, enhancing its chance of success.
The chart above provides an example of the effectiveness of combining the stochastic oscillator with other analysis methods for confirming trading signals.
Types of Stochastic Indicators
Let us take a look at the different type of Stochastics, their uses and the different values associated with each one.
Slow Stochastic Oscillator
The slow stochastic oscillator was created to focus on this important role of %D in Fast Stochastic.The slow stochastic oscillator takes the %D of fast stochastic and turns it into the %K of slow stochastic. Then, another 3-period moving average is applied to create the %D of slow stochastic. In essence, the slow stochastic %D is taking another 3 period SMA of the fast stochastic %D.
This makes the slow oscillator less choppy and easier to read.
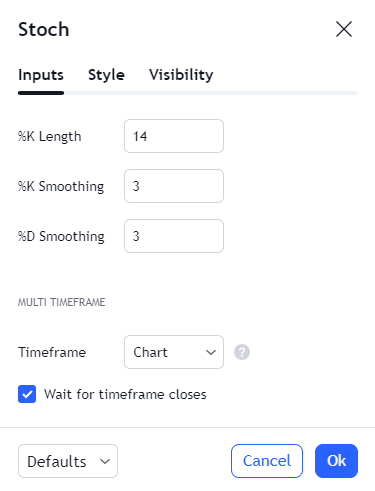
| The Slow Stochastic Input Values on TradingView: |
|---|
| -Slow %K = Fast %K smoothed with 3-period SMA (same as Fast %D) -Slow %D = 3-period SMA of Slow %K |
The settings for the slow stochastic are the original ones as developed by Lane, which is 14, 3, 3.
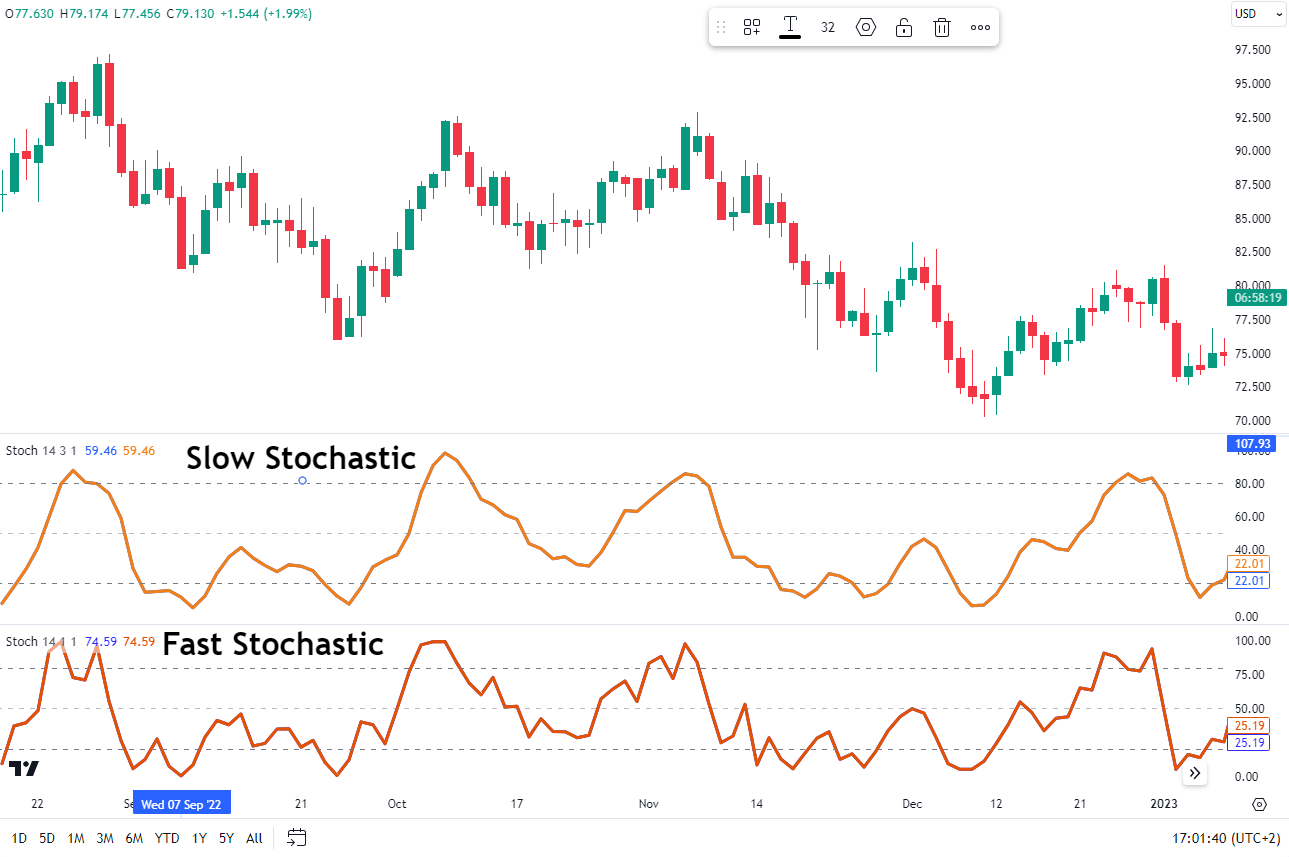
Now this is where it gets interesting as you can see from the chart below. I have played around with the settings and left the %K line to show the different reactions of both the slow and fast stochastic. This gives a clear indication that the fast stochastic (bottom indicator panel, red line) is a lot more responsive to price movements and thus more susceptible to ‘market noise’. The slow stochastic (top indicator panel, orange/brown line) is a lot more smooth and thus less susceptible to price fluctuations.
Comparison of the movements of the fast and slow stochastic oscillators are represented in the image below.
Fast Stochastic Oscillator
The fast stochastic oscillator was created using George Lane’s original calculations for %K and %D. In this ‘fast’ version, the %K line might look a bit jagged or uneven.Therefore, the %D is applied to the %K as a moving average to smooth out the readings of %K.
In an uptrend, if %D showed a positive change, Lane thought, “Time to buy!” as he believed the asset price may continue to rise. When the trend was down, and %D dropped, Lane said, “Let’s sell!” on the belief that the asset price will continue to fall.In short, %D was Lane’s secret weapon. Whenever it changed, he made his move. Simple, right?
Let’s review what this looks like on a chart.
| The Fast Stochastic Input Values on TradingView: |
|---|
| Period = 14 Fast %K = 1 Fast %D = 3-period SMA |
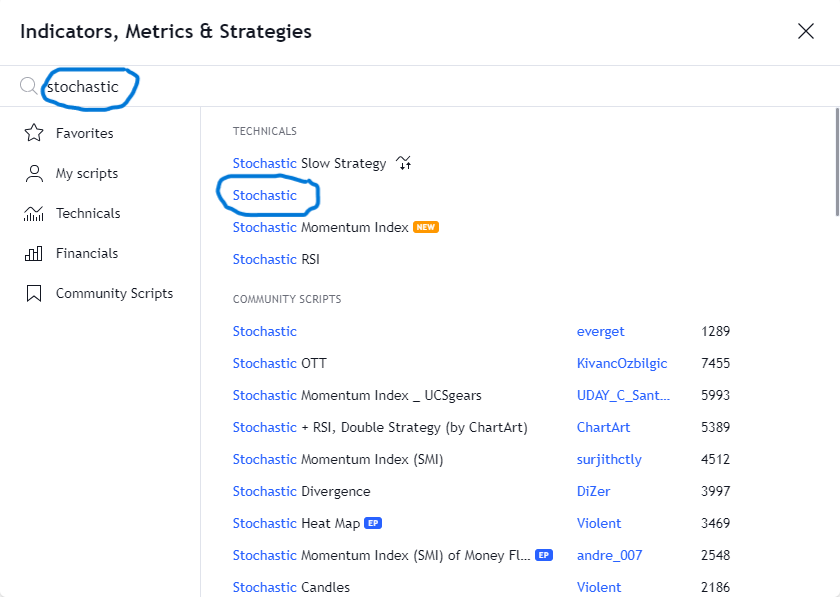
To find the stochastic indicator on TradingView, type “stochastic” into the search field and click on “stochastic”.. This can be located under the indicator tab at the top of the page.
Once you have located the stochastic you will be able to adjust the settings to reflect the adequate values to reflect the Stochastic you wish to use. The settings for the fast stochastic sees a change in the period which is usually the standard 14, the %K is 1 and %D is 3.
Full Stochastic Oscillator
Once you have located the stochastic you will be able to adjust the settings to reflect the adequate values to reflect the Stochastic you wish to use. The settings for the fast stochastic sees a change in the period which is usually the standard 14, the %K is 1 and %D is 3.
The only real difference I have found between the full stochastic and the slow stochastic is in the settings and what is focused on. When using the full stochastic priority should be given to the %K line that looks at the latest price data and reacts quickly. The slow stochastic meanwhile is like a ‘smooth operator’ where the %D serves as %K chilled out cousin and provides a more reliable signal of overbought and oversold.
| Full Stochastic Oscillator: |
|---|
| Full %K = Fast %K smoothed with X-period SMA Full %D = X-period SMA of Full %K |
Stochastic Momentum Index
The Stochastic Momentum Index (SMI) was developed by William Blau in 1993 and is a refined version of stochastic as it compares the current price level against the median price for the lookback period.
The SMI looks at the difference between the current closing price and the middle value of the highest and lowest prices over a certain period. It’s shown on a chart as a line that moves up and down between +100 and -100.
If the closing price is higher than the middle value of the high/low range, the SMI goes up. If the closing price is lower, the SMI goes down.
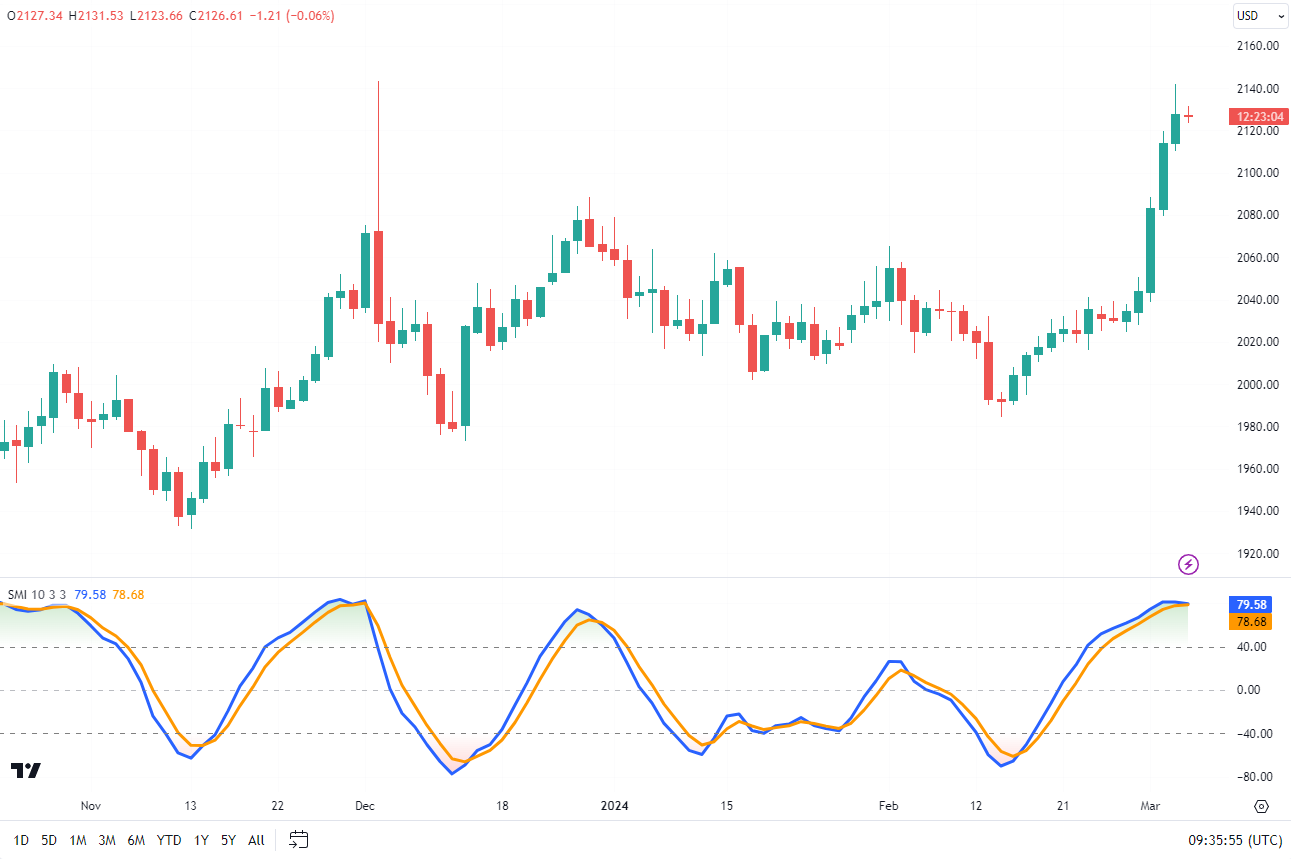
Just like the older tool it was based on, the SMI is used by traders to see if a market is overbought (prices might be about to fall) or oversold (prices might be about to rise). Additionally, when adding the volume indicator, it can assist with determining the extent of buying or selling pressure.
In short, the SMI is like a more sensitive version of the stochastic oscillator. Think of this way, the SMI is like a magnifying glass for momentum – it zooms in and gives you a clearer picture.
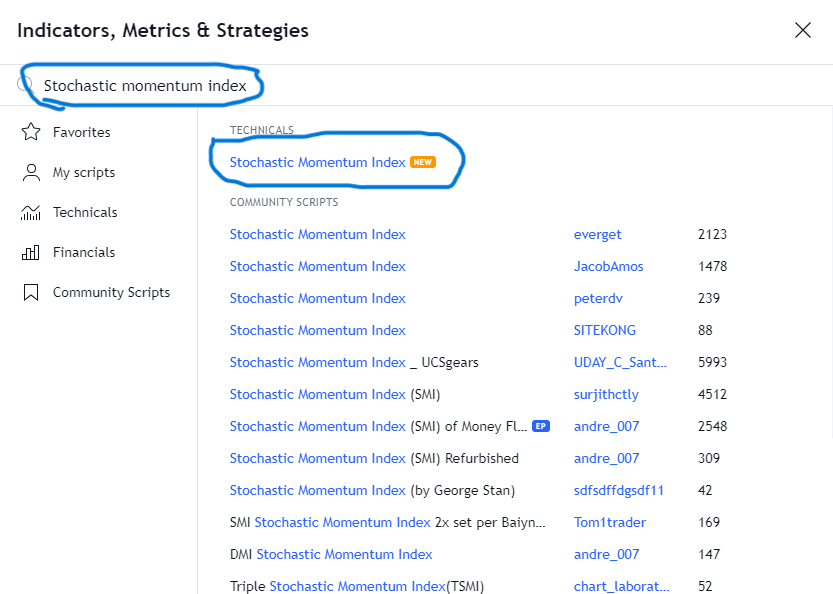
To find it in TradingView, search through the indicators section for the “stochastic momentum index.”
The SMI includes three input values, just like its stochastic cousin.
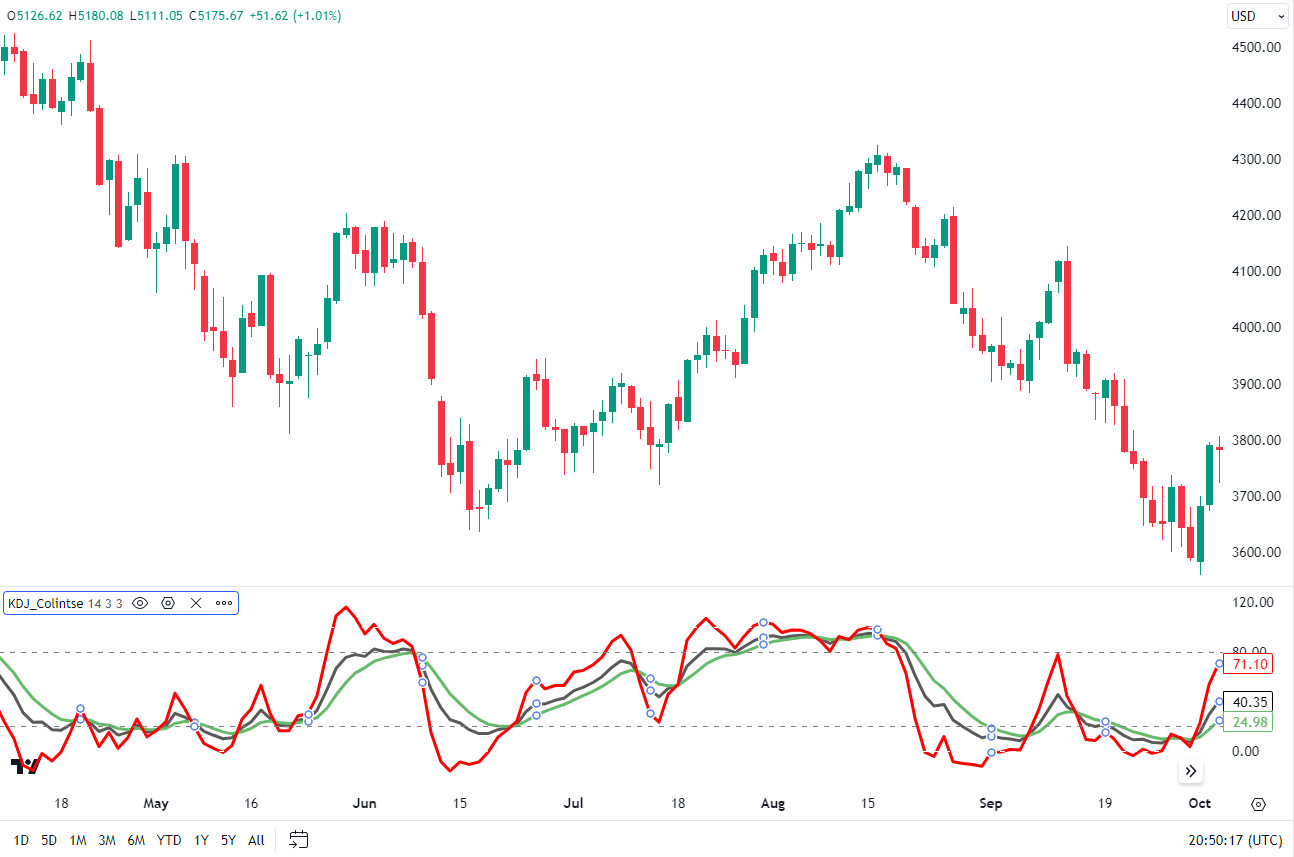
KDJ Indicator
The KDJ Indicator is like a mix of the stochastic oscillator and some features of the well-known RSI indicator. The KDJ adds an extra line for momentum and a signal line to help spot when things are overbought or oversold. the components of the KDJ indicator are as follows:
1) K-Line: Represents the smoothed version of the price relative to previous trading ranges over a specific period.
2) D-Line: A smoother version of the K-Line, showing long-term trends.
3) J-Line: Derived from K and D lines, indicating potential overbought or oversold levels.
The J Line being the new addition. The calculation for the indicator starts by obtaining the Relative Strength Value (RSV) based on the highest, lowest, and closing prices. Smoothing of the RSV using moving averages assists in getting the K and D values.
The newest addition J and the calculation is as follows:
J = 3K – 2D
This combined indicator gives traders another way to spot potential points where the trend might reverse. It brings together the best parts of the stochastic and RSI indicators.
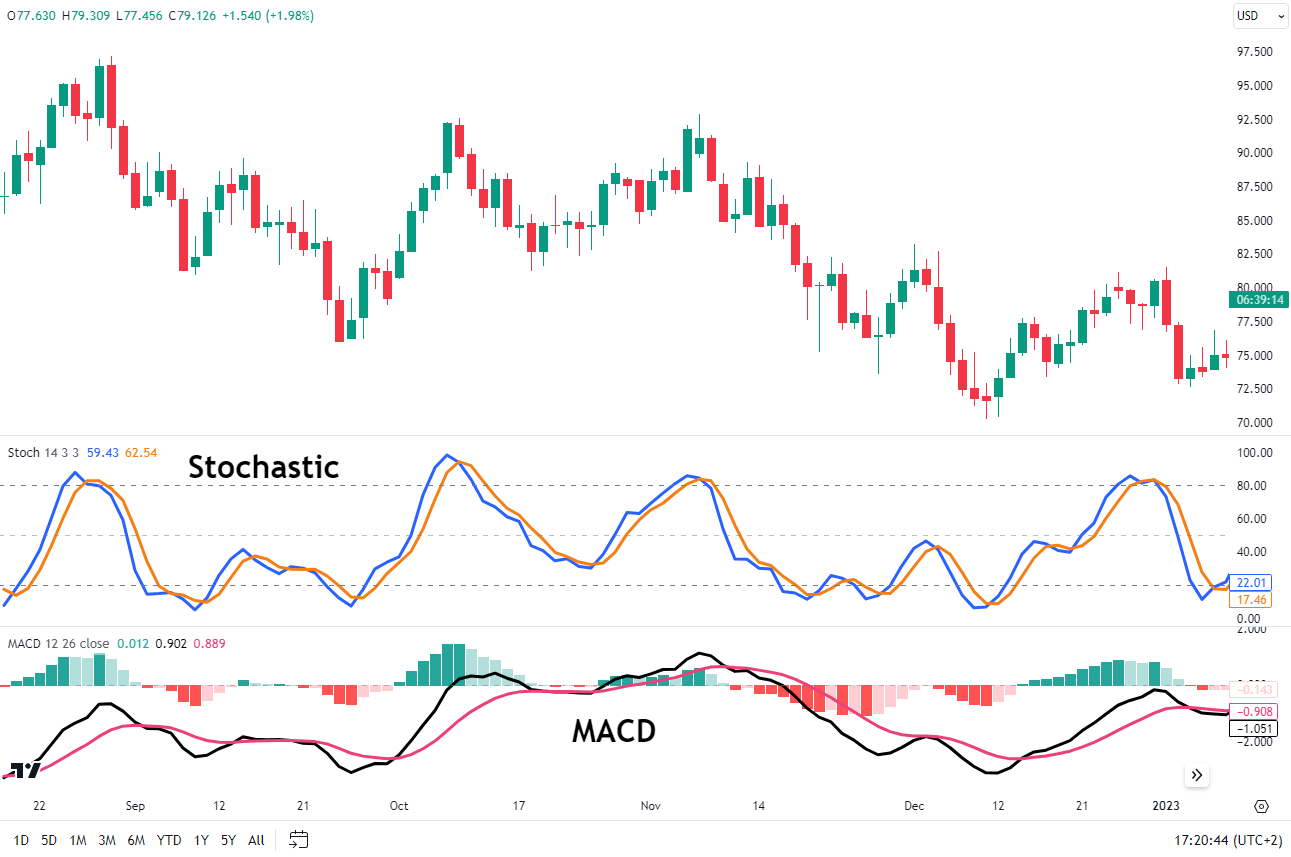
The stochastic can use different time-frames. It uses different periods for its %K and %D calculations based on the chart time frame. An example, the hourly charts use (10,5,5) while daily charts use (14,3,3). Using these settings makes the signals more relevant and reduces the risk of false signals.
Besides the different versions of the stochastic, traders also change the overbought/oversold levels. While 80 and 20 are the usual levels, some traders use other levels like 90/10, 70/30 or 60/40.
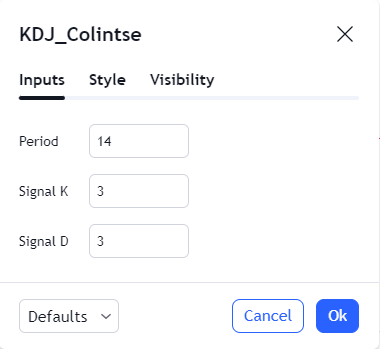
Once we have located the KDJ Indicator we need to make sure we are using the correct settings. As mentioned above the Daily charts use 14 3 3 (Image Below).
Stochastic Oscillator Trading Strategies
The Stochastic is a versatile tool that can be used in a variety of ways. Below are 8 different strategies a trader can implement using stochastics.
Stochastic Overbought vs Oversold Strategy
The Stochastic overbought vs oversold strategy is one of the easier and simple strategies to understand and put into practice. Using the basic settings of 20, 50 and 80, any reading above 80 indicates that price has entered overbought territory. Conversely, a reading below the 20 mark is seen as being in oversold territory, thus implying the asset may be undervalued and a price rise could be imminent. Important to note that when price is in overbought territory, a potential entry only materializes when the stochastic crosses back below the 80 mark, as this is a sign that momentum may be shifting from up to down.
GBPUSD Daily Chart
Traders look to enter a buy trade when the %K line crosses above the 20 threshold after being in oversold territory. The stop loss should ideally be placed either below the most recent low with a take profit at the next level of resistance near your desired risk to reward ratio.
The opposite is true when considering selling opportunities with the stop loss placed above the recent swing high and take profit near the next level of support.
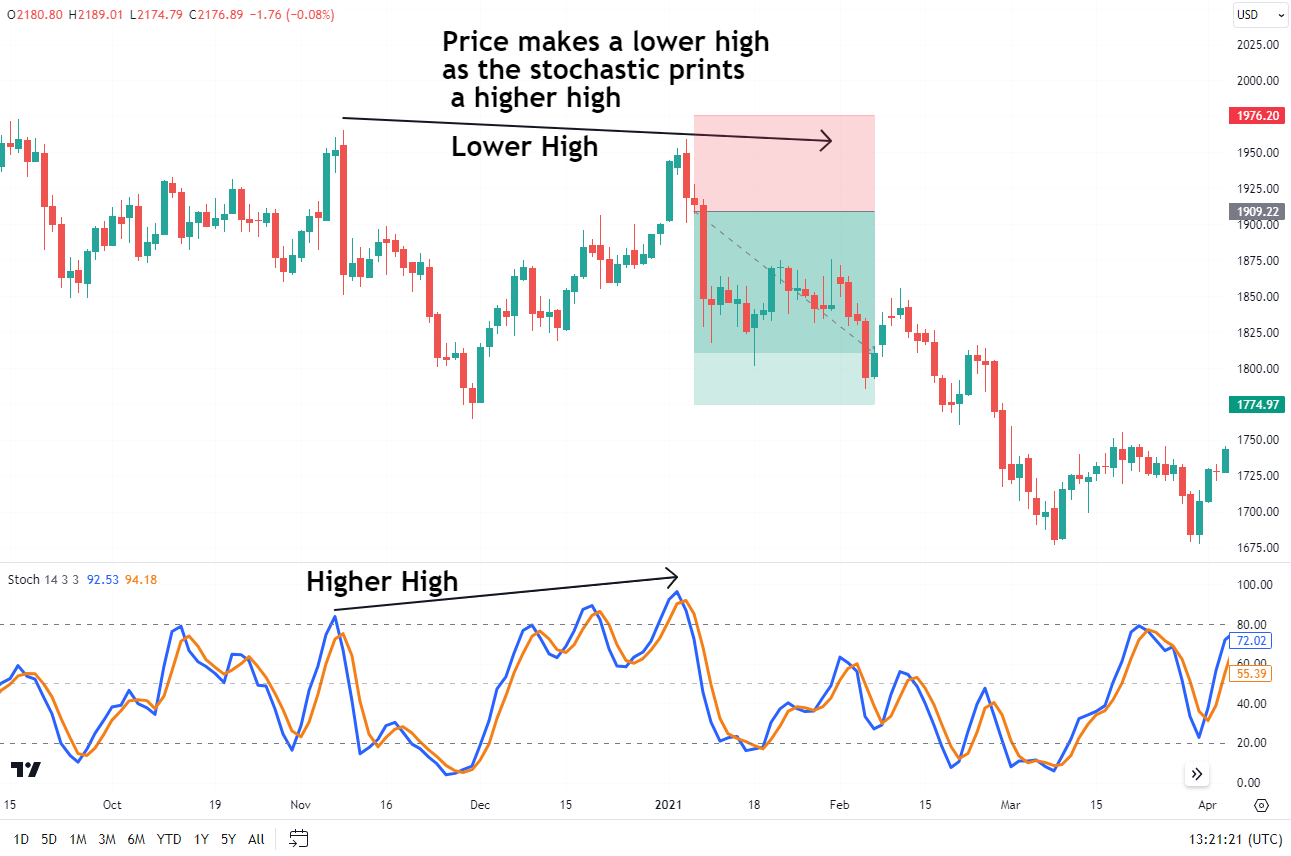
Stochastic Divergence Strategy
The stochastic divergence strategy is a technique where traders compare the direction of the asset’s price with the direction of the stochastic oscillator. If the price is making higher highs but the oscillator is making lower highs, this is a sign of bearish divergence. This serves as a hint that the price might fall soon.
Conversely, bullish divergence occurs when the price is making lower lows but the oscillator is making higher lows, indicating a possible price rise. This strategy helps traders spot potential trend reversals early.
When using the stochastic divergence strategy the placement of the stop loss and take profit levels are key. Keeping things simple, for a bullish divergence one would place the stop loss just below the recent swing low. As for the take profit levels this may vary and should be placed near a previous swing high but traders may manage it at their own discretion and based on their strategy. If you are targeting a 1:1 risk-to-reward then once that is reached a trader may close their position.
Source: TradingView
Great example of bearish divergence in the chart above as we can see prices print a new high while the stochastic prints a lower high. Immediately thereafter we see a selloff and a change in trend. Such a setup will see the stop loss placed above the recent high with the take profit either at the most recent support or when the stochastic enters oversold territory.
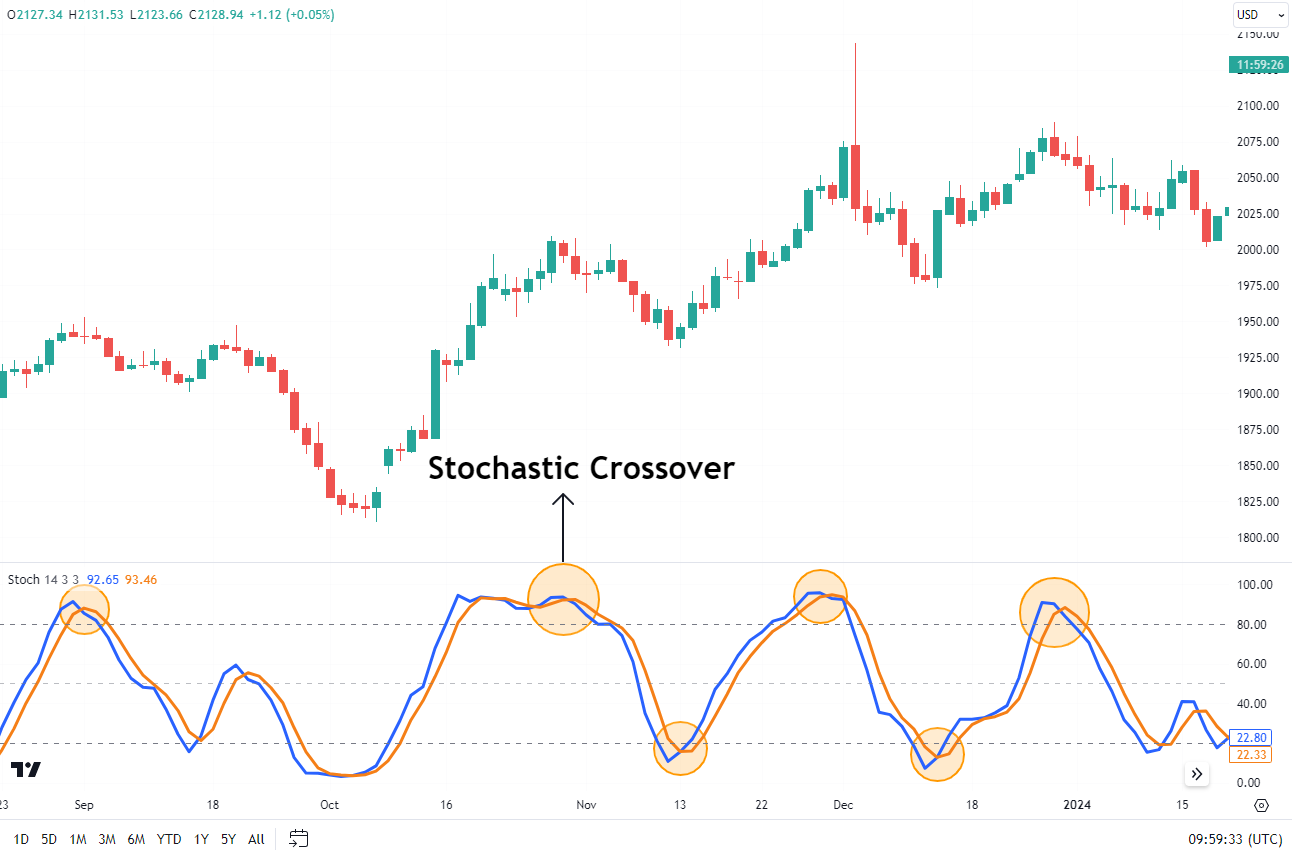
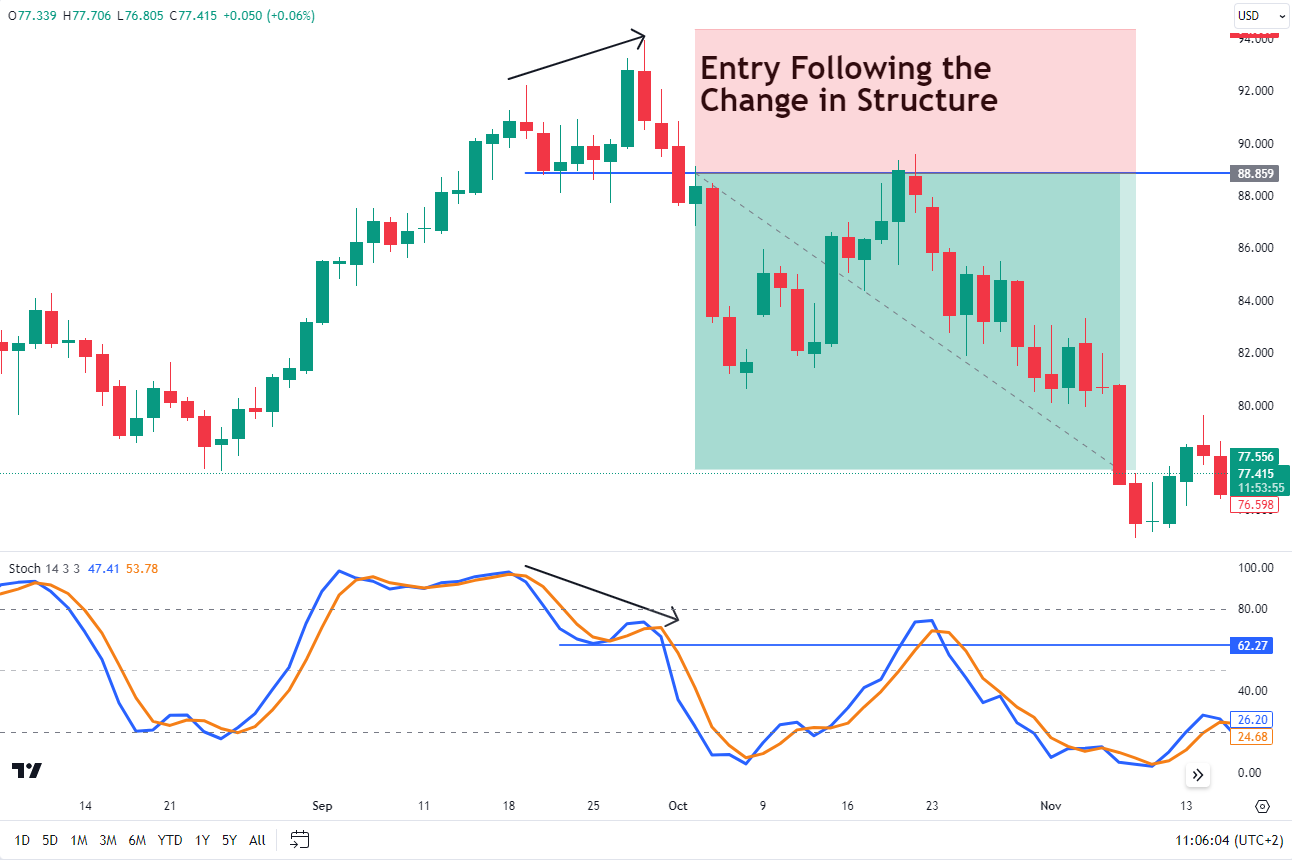
Stochastic Crossover
The stochastic crossover strategy is like watching two racers, %K and %D. When %K (the faster racer) passes %D (the slower racer), it’s a sign that it might be a good time to buy. But when %K falls behind %D, it’s a hint that it might be a good time to sell.
The S&P 500 chart above provides an excellent illustration of using the stochastic crossover strategy. This strategy is best used during trending markets rather than range-bound market conditions. You see, in an uptrend, the stochastic lines are likely to hold above the 50 mark. In a downtrend, the stochastic oscillator forms below 50.
In the chart above we can see the overall trend is up and bullish. Therefore, we are only looking for buying opportunities on a pullback toward the 50 level and wait for the stochastic crossover to occur. If a deeper correction were to occur, a trader could consider buying when the stochastic indicator moves higher out of oversold readings.
The vertical line shows when the crossover takes place which is followed by a 200+ point rally to the upside once the %K crosses above the %D.
The placement of the stop loss and potential profit levels are also key. The stop loss may be placed below the most recent swing low, while the profit target may be set at a previous resistance level or one may monitor the stochastics and wait for it to leave overbought territory and cross back below the 80 level. This would be a sign to close the trade.
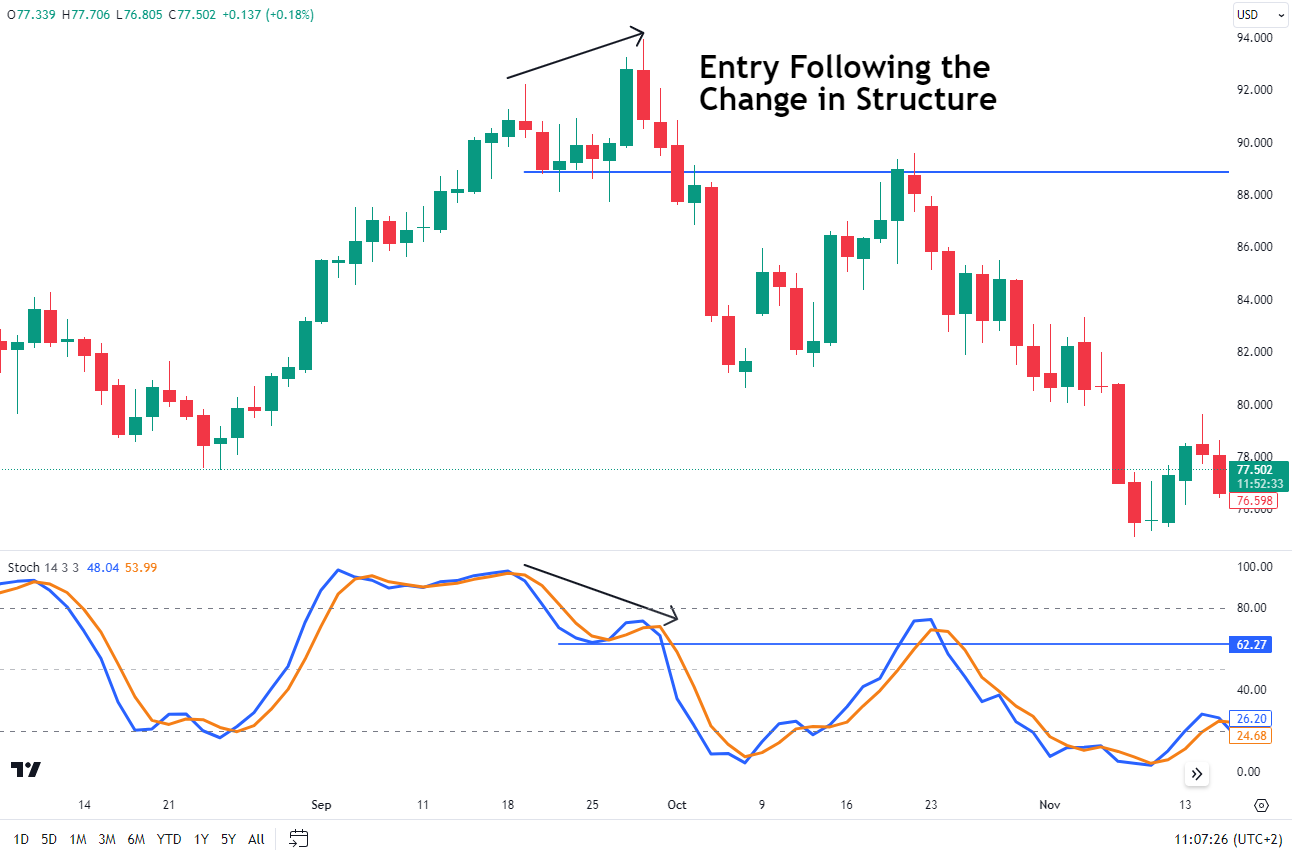
Bull/Bear Set-Ups
The bull/bear set-ups strategy serves as a trend predictor, and it differs from the bull/bear divergence strategy. In a ‘bull setup’, when prices hit a new low but the oscillator doesn’t, it may signal prices will rise, an inverse of the bullish divergence strategy previously. In a ‘bear setup’, when prices reach a new high but the oscillator doesn’t, instead printing a lower low, it may indicate prices will fall. This is seen as a sign that momentum in the asset/instrument may be weakening.
As with most strategies in this section, highlighting the point of entry, stop loss and take profit levels is key. Entry level for me would be when the stochastic crosses back below the 80 level which would be a sign that momentum may be shifting (see example above). Now as you can see on the chart above the stop loss will be placed above or below the most recent swing high or low with the take profit either at a key area of support and resistance or based on a risk to reward ratio which is in line with your strategy.
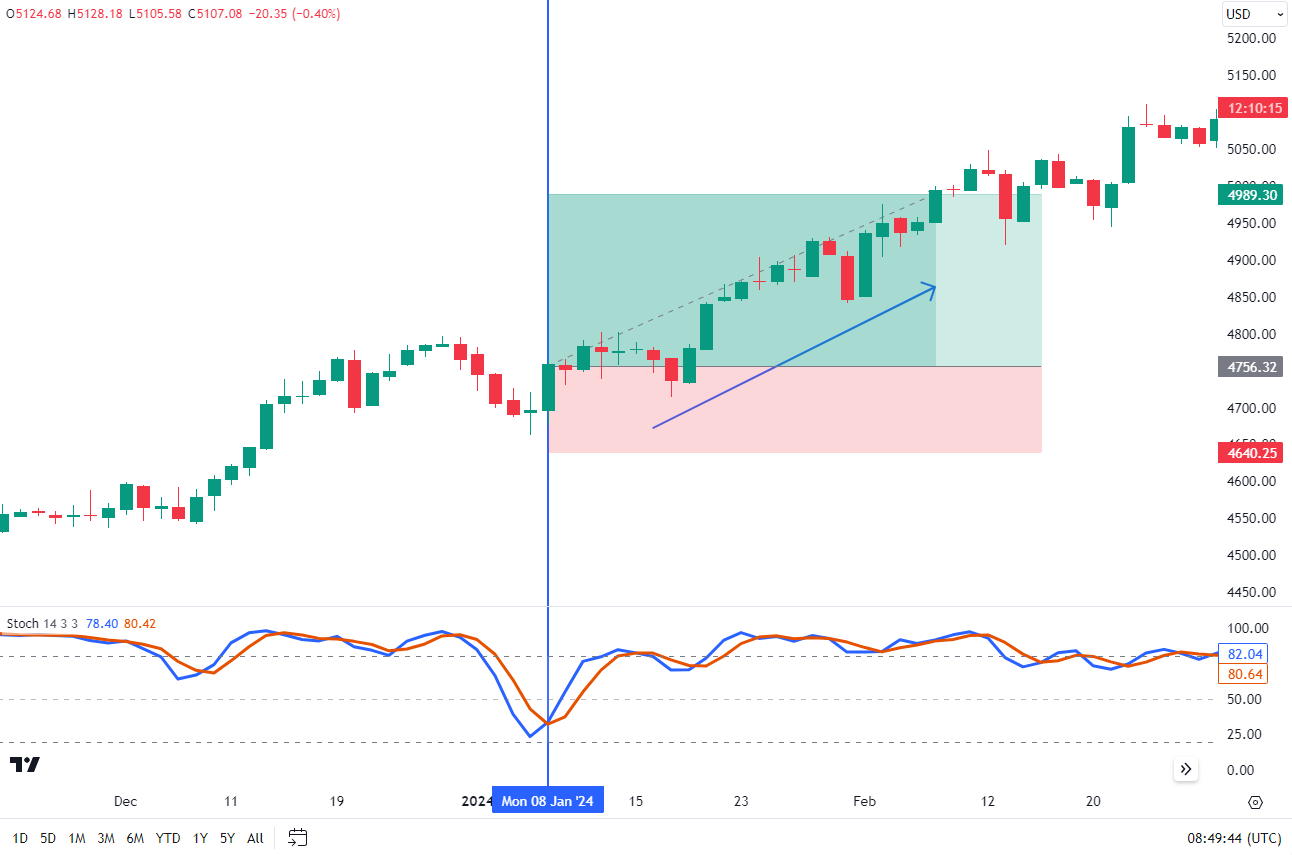
Riding Trends
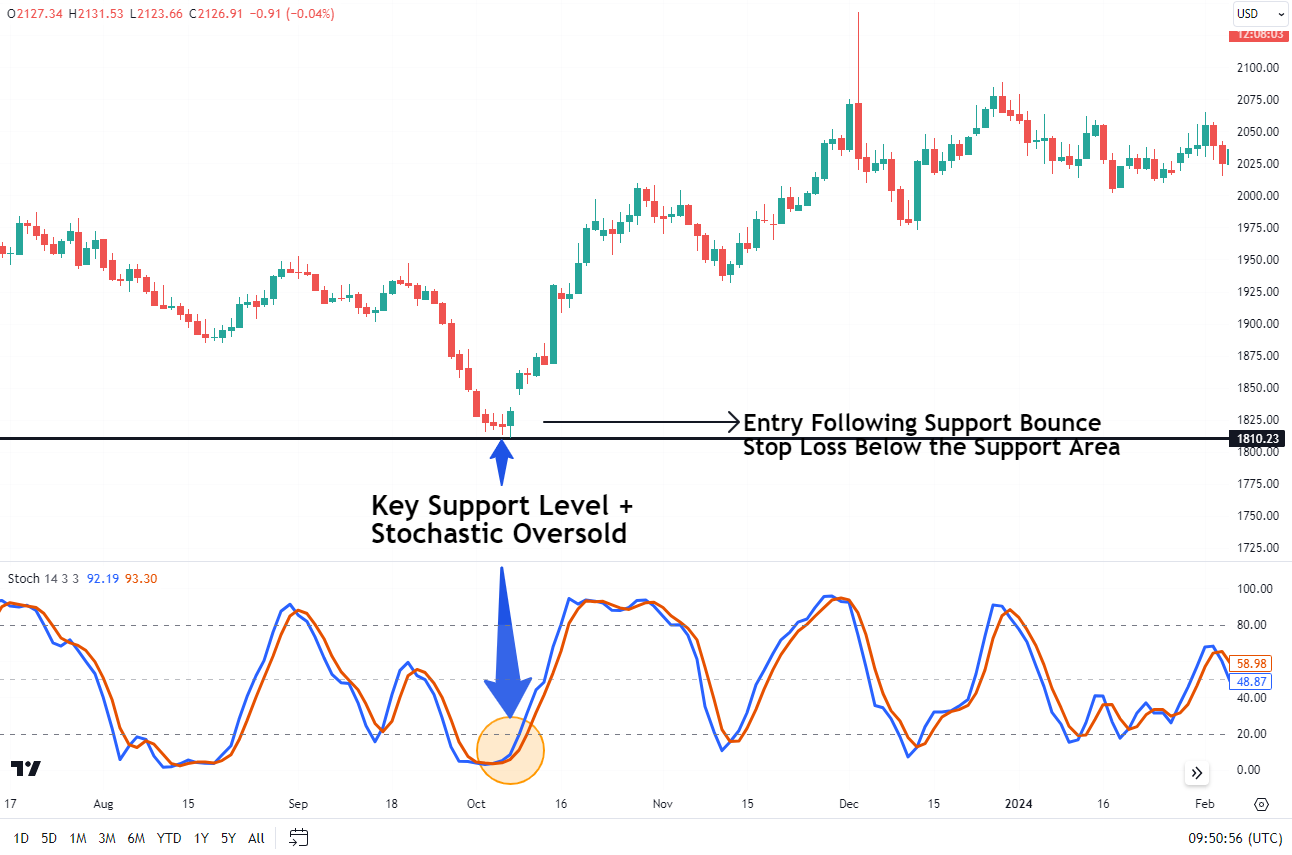
The stochastic oscillator may also be used to identify strong trending markets in order to find opportunities to jump on the bandwagon. As the saying goes, the trend is your friend.
The manner in which this would work is usually involving an instrument that has passed the overbought or oversold levels at 80 and 20 respectively. When this happens traders will wait for the stochastic oscillator to pull back toward the 50 level midpoint before executing a trade and riding the next leg of the wave.
First step here is to identify the trend. As we can see from the chart below we are in a uptrend and have crossed above the 80 level. This is followed by a pullback of the stochastic toward the 50 level while the price on the chart still remains in a bullish trend. A bounce of the 50 level on the stochastic would be my entry signal with a stop loss just below the most recent swing low and a take profit target at a key resistance level or in line with your own strategy and risk profile.
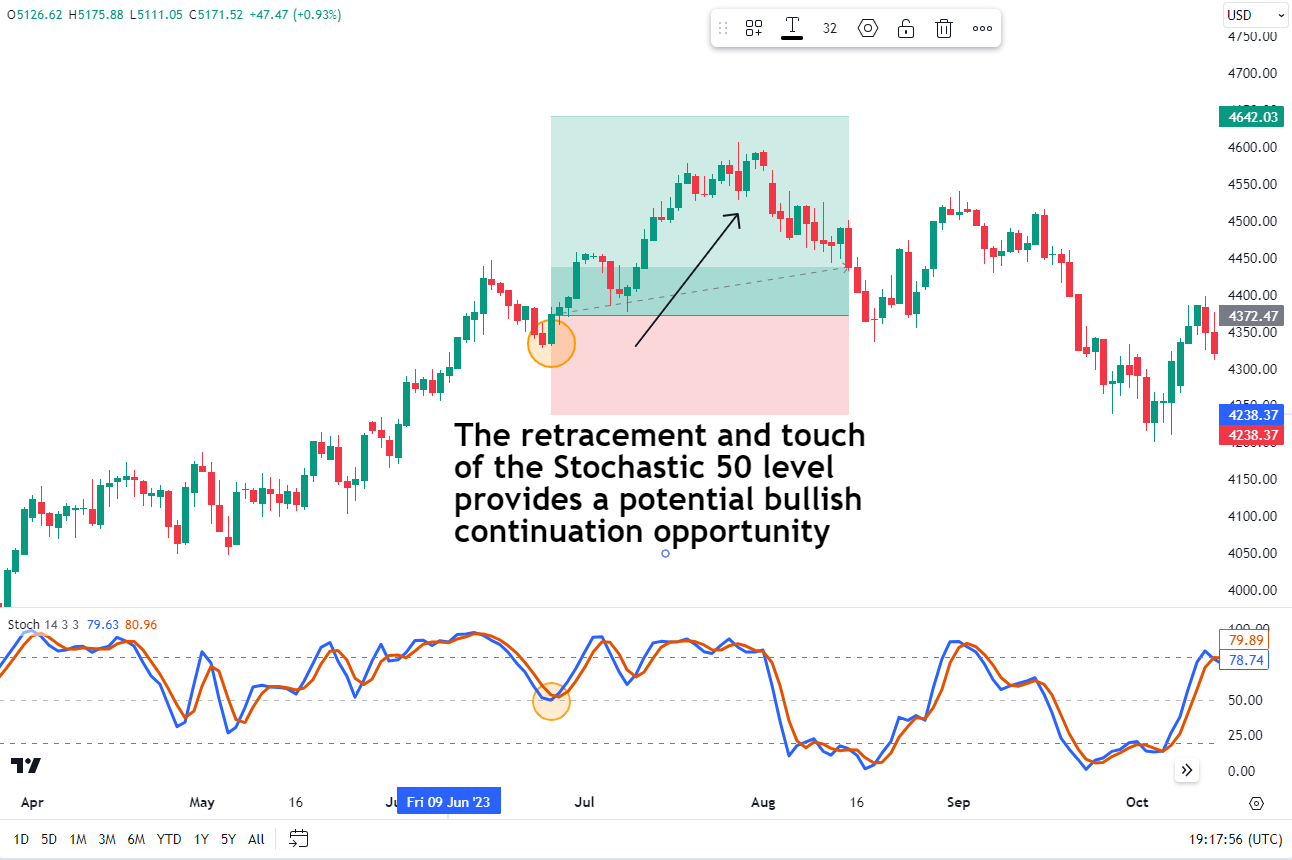
The placement of the stop loss goes below the most recent swing low in the example above, while the take profit target will either be based on a risk to reward profile of 1:2 or resistance levels ahead.
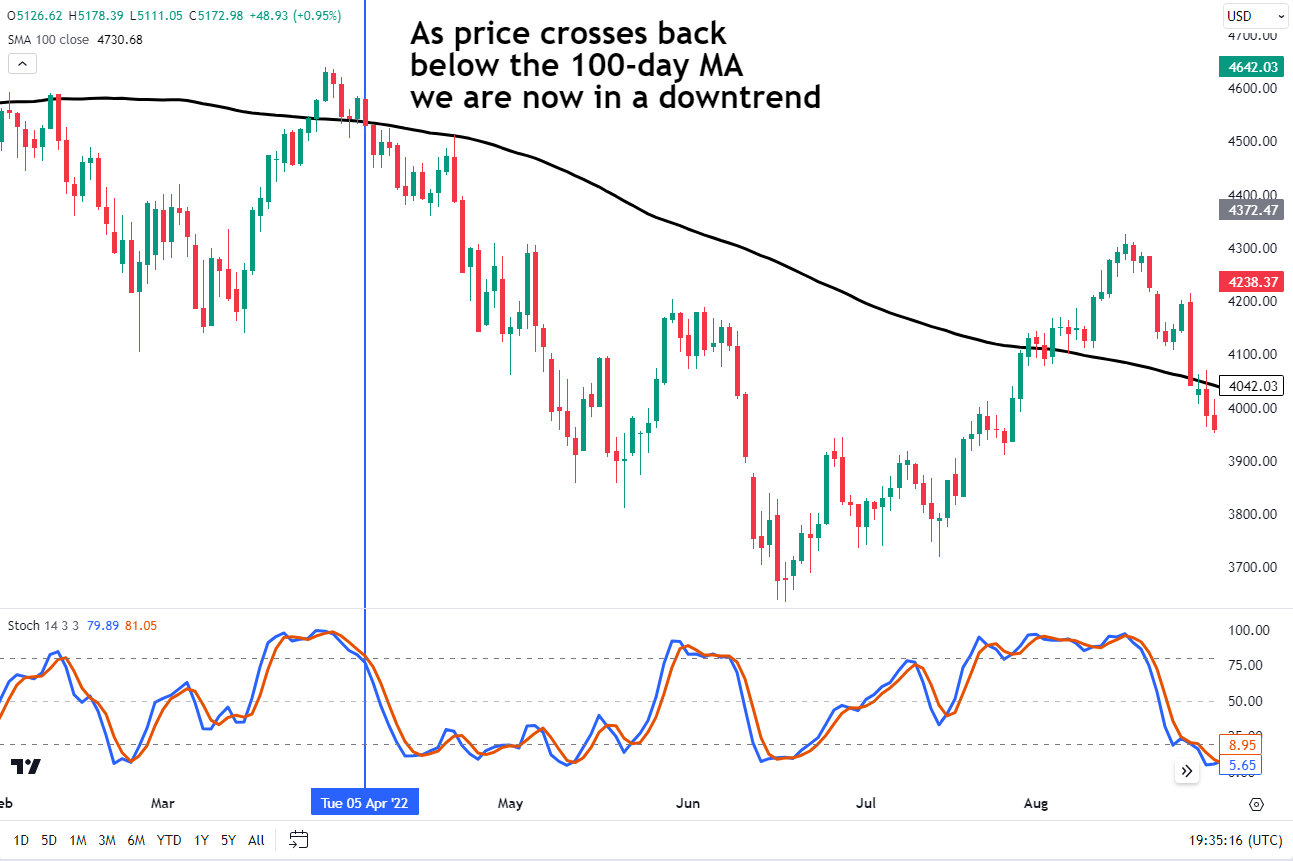
Stochastic Oscillator with Moving Averages
Using the stochastic with one of the most popular and one of my favorite indicators, moving averages is an intriguing one. In this scenario the moving averages are used to map out the long-term trend and key support and resistance levels. With this in mind this could be used as a form of multi-timeframe analysis with the moving average used to determine the longer term trend.
Once the longer term trend is identified market participants could scale down to a lower time frame for a potential entry making use of the stochastic oscillator.
Now to utilize this strategy you would need to firstly trade in the direction of the moving averages. Looking at a more in depth breakdown of the strategy and multi-timeframe analysis:
Step 1: Find the direction of the trend on the daily chart. Add a 50-period moving average. If the price is above the 50 SMA, then the trend is up. If the price is below the 50 SMA, then the trend is down.
SPX DAILY CHART
Step 2: Scale down to a 2-hr chart. Filter your stochastic signals so that you are only taking those signals that are aligned with the direction of the daily trend found in step 1.
If the daily trend is up, then look only for buy signals when the stochastic is crossing up above the 20 mark. If the daily trend is down, then look only for sell signals when the stochastic is crossing down from above 80 mark.
SPX 2HR CHART
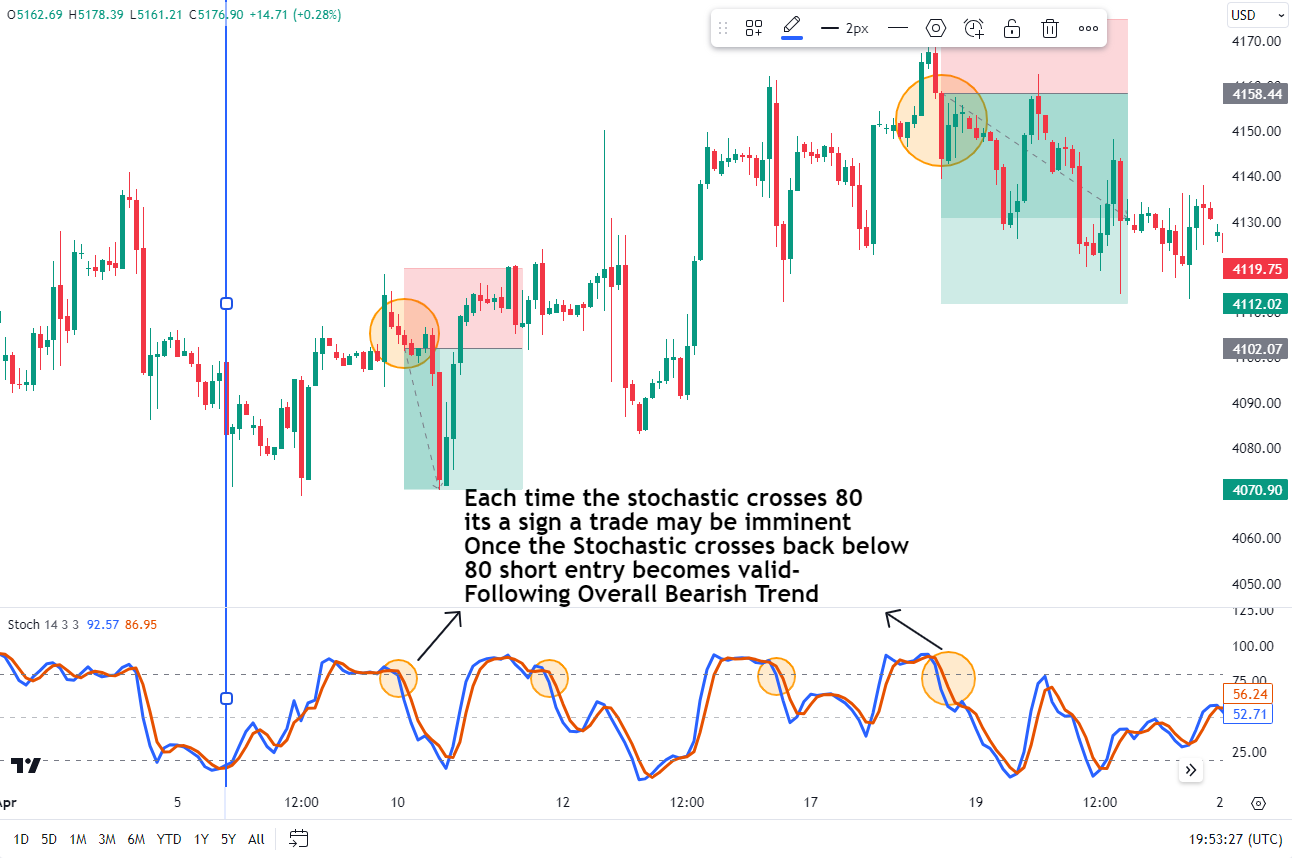
The chart above provides examples of potential trade entries with stop losses placed just abve the recent highs. Only sell signals are considered and this occurs when the stochastic is above 80 and crosses back below, a sign of momentum potentially changing. As with all strategies there will be winners and losers, so if you are utiliizing this strategy make sure you maintain consistency.
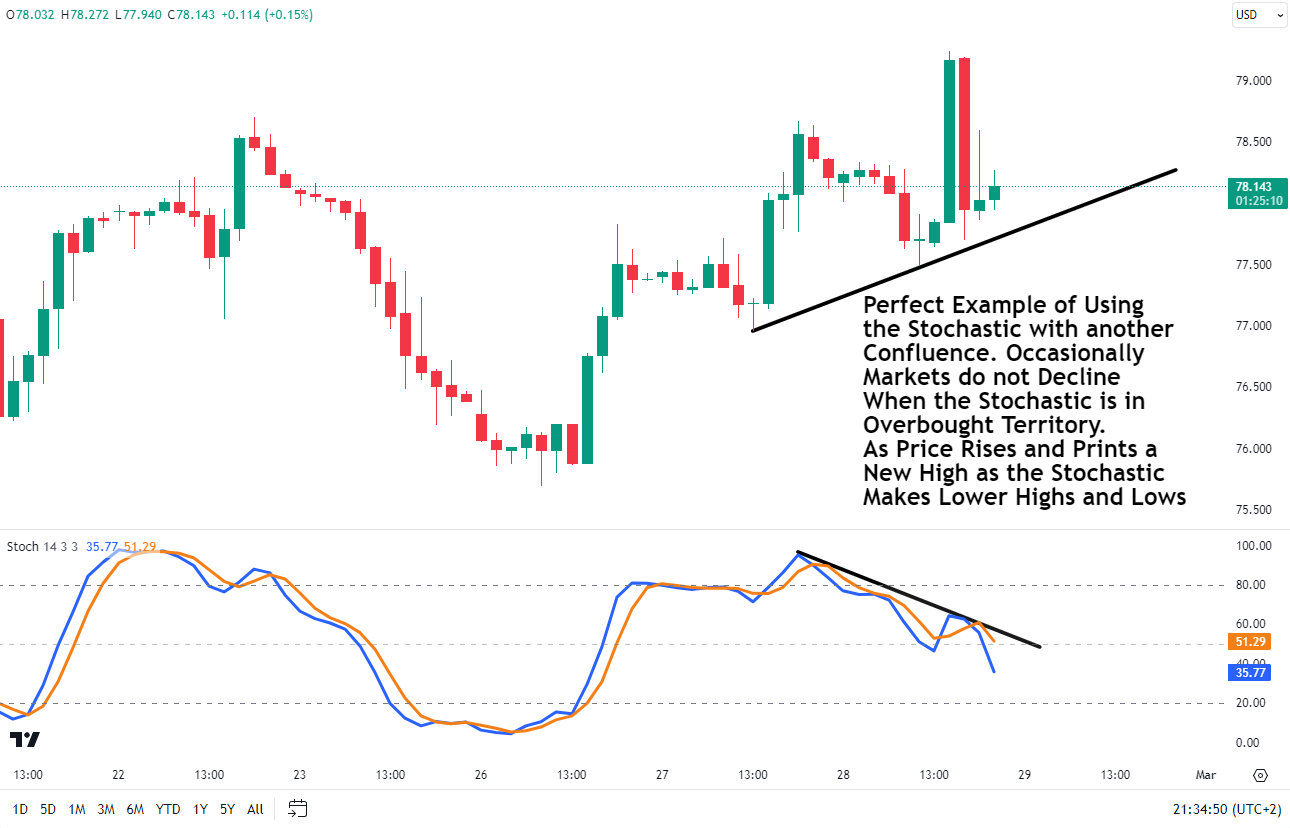
Stochastic Oscillator with Price Patterns
Another strategy that has been used by traders is the combination of the stochastic oscillator in conjunction with price patterns. For example, when a wedge pattern forms and a breakout occurs to the upside pay attention to the stochastic oscillator. If the stochastic begins to move from oversold territory back above the 20 mark this could be seen as a confirmation of sorts that the breakout may be a successful one. In other words using the two indicators together will only serve to increase the probability that the trade will be a success.
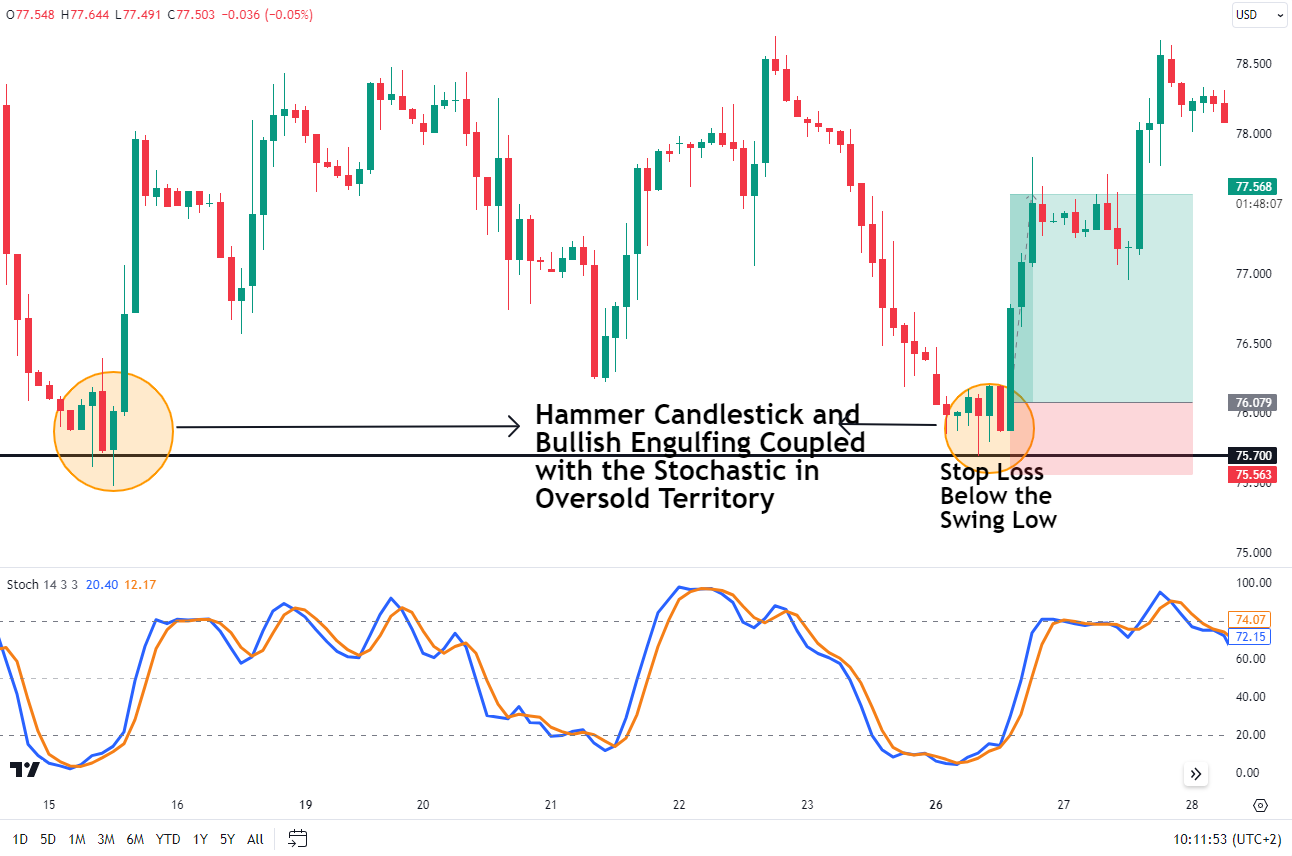
As another example, the chart above illustrates a situation of price action and Japanese candlesticks patterns used in conjunction with the stochastic being in oversold territory.
Entry would happen when the stochastic crosses back above the 20 mark with the stop loss below the most recent lows. Take profit levels can be at a risk to reward ratio of 1:1 or better. Alternatively you could use previous support turned resistance as potential take profit levels.
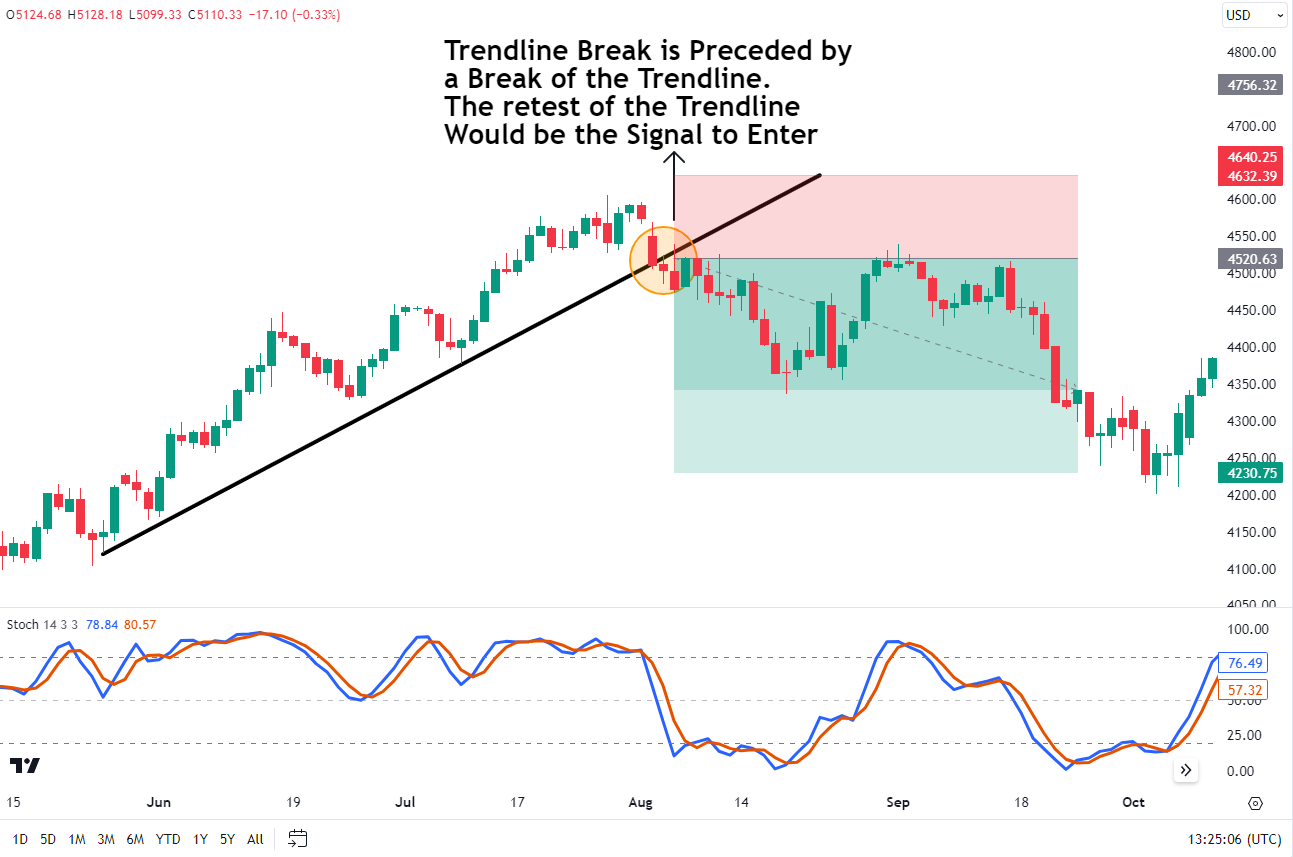
Stochastic Oscillator with Trendline
Stochastic divergences or reversals can be used well with trendlines for trading. Once you’ve spotted a clear trend line, the signal comes on a break of the trendline. If stochastic is confirming the break of the trendline, then you have a signal.
Stochastic Oscillator with RSI
One popular indicator is when stochastic is combined with the Relative Strength Index (RSI) to become the Stochastic RSI indicator. Stochastic RSI helps spot when an asset might be overpriced (overbought) or underpriced (oversold), which can hint at good times to buy or sell. If the Stochastic RSI is over 80, the asset might be overpriced. If it’s under 20, it might be underpriced.
Putting this into practice and setting up the chart with the Stochastic RSI and RSI involves the following steps:
1) Add Stochastic RSI to the chart: Most platforms have an ‘Indicators’ menu where you can select ‘Stochastic RSI’ or ‘Stoch RSI’.
2) Default Settings: Using the standard setting for the stochastic oscillator which would be K=3, D=3, RSI=14, with the stochastic length =14.
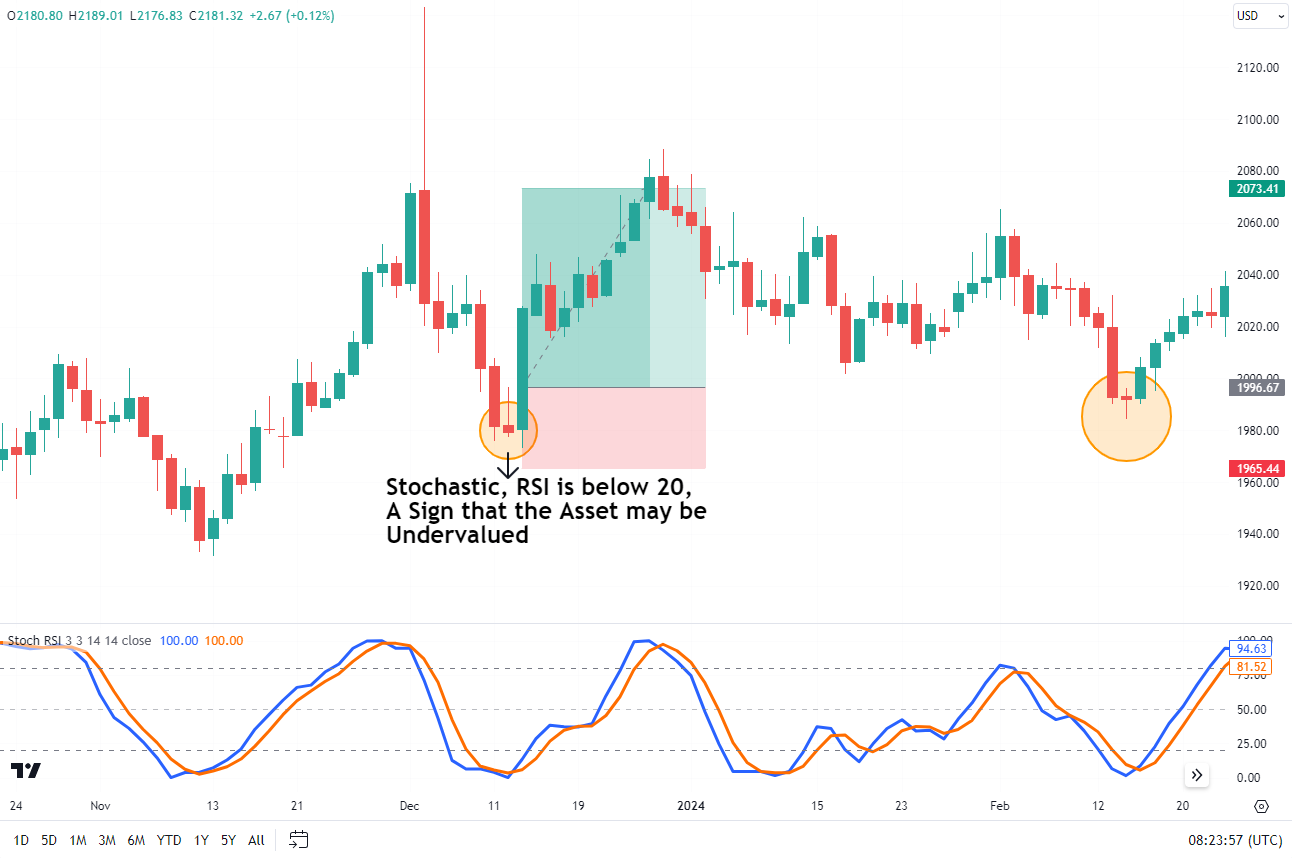
The chart above provides an example of the stochastic RSI below the 20 mark. This obviously a sign that the asset may be underpriced/undervalued and a retracement/bounce may be incoming. As mentioned previously this could still be used in conjunction with price action/candlestick patterns etc to confirm an entry should you desire to do so.
My major gripe with the stochastic RSI and one of the main reasons I do not use it is that it simply runs the algorithm over the RSI values and not price. I consider this a major issue as a trader I am trading price and not the value of the RSI or stochastic. As a trader, the price is the heartbeat of trading and the price is what matters most. Indicators are simply serving as a sidekick.
Advantages of Using the Stochastic Oscillator
As you can probably tell by now, there are some obvious benefits to using stochastic.
1) Clear Entry/Exit Signals: The oscillator makes visual signs when it hits a high or low point. This can help a trader know when to buy or sell.
2) Overbought/Oversold Indicator: It is a bounded oscillator using a scale from zero to 100 making it easy to spot overbought (too expensive) or oversold (too cheap) situations.
Now pulling from personal experiences, stochastic is helpful to use with other chart patterns or indicators. It helps weed out setups that are not high probability and also helps me identify in which direction the market momentum is currently flowing. If I have the momentum and price action going in the same direction when the Stochastic also gives a signal in the same direction, this just gives me greater conviction regarding the trade setup.
Disadvantages of Using the Stochastic Oscillator
Looking at a breakdown of the disadvantages of the stochastic oscillator and the following concerns stuck out for me.
1) Choppiness and Inconsistent Range: Imagine the price bouncing up and down like a yo-yo. Sometimes, these movements can be choppy, not always matching the actual price changes. For example, when the stochastic goes from a low level (around 20) to a high level (around 80), it might signal a big price move. But when it reverses from 80 back to 20, the price change might be smaller. This inconsistency can be frustrating for traders who expect more predictable patterns based on price movements.
2) Overbought/Oversold Signals During Trends: During periods when an asset is in the midst of a strong trend the stochastic can stay in the overbought or oversold zone for a long time. Too many signals can happen during these trends, and can generate false signals or confusion for traders. To use an apt analogy, Imagine a traffic light staying red or green for a really long time, it can be misleading!
3) Additional Confirmation Needed: Traders often use the stochastic along with other indicators or trading patterns to double-check their decisions. For example, if the stochstic indicator is cross up while the price is near support, then you have a confirmation of a bullish signal. Relying solely on stochastic readings for buying or selling can be risky. It’s like using just one piece of a puzzle, you need more information.
Some keys to avoiding false signals includes finding the right trading environment. If the market is trending, then filter signals only in the direction of the larger trend. Additionally, look for other confirming signals from technical analysis patterns to and other indicators to confirm the trend.
It is thus essential to be aware and take into account these limitations and find ways to mitigate the risks associated with them.
What is the Difference Between RSI and Stochastic Oscillator?
The Relative Strength Index (RSI) looks at recent gains and losses from one day to the next to gauge the momentum. It uses a scale from 0 to 100. If it’s above 70, it might mean that things are overpriced. If it’s below 30, things might be underpriced. Traders use the Relative Strength Index (RSI) to find support and resistance areas, spot possible reversals, and confirm signals from other tools.
Stochastic Oscillator, made by George Lane, compares the closing price of a stock to its price range over a certain time period. It assumes that prices close near their highest in rising markets and near their lowest in falling ones. Like the RSI, it uses a scale from 0 to 100. If it’s above 80, it might mean that things are overpriced. If it’s below 20, things might be underpriced.
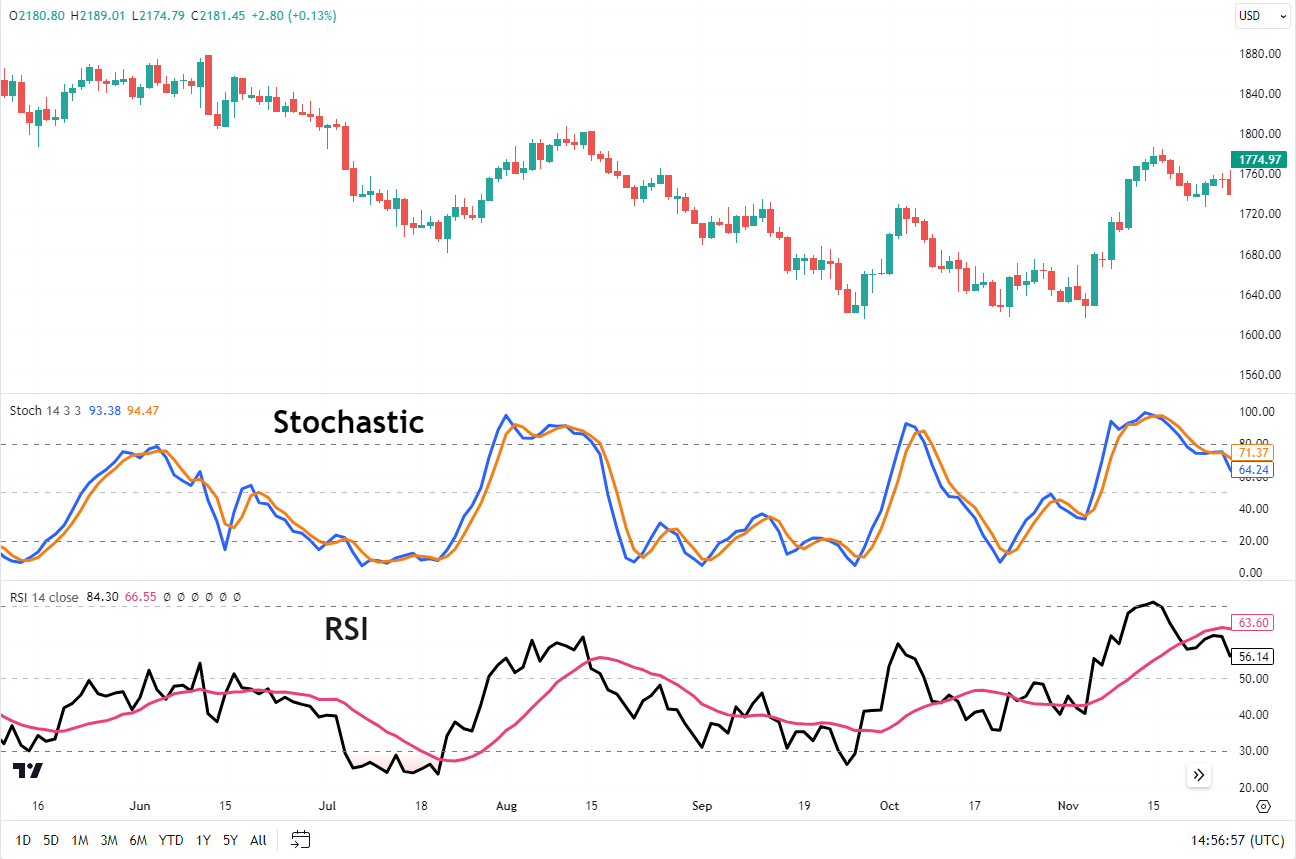
To summarize, RSI will look at the series of individual gains and losses from one day to the next whereas stochastic simply looks at where the current price sits within the larger range of the lookback period.
What is the Difference Between Stochastic and MACD?
The Stochastic Oscillator and the MACD are both momentum tools. They look at past prices to see what the momentum is and the direction of the trends. While both are momentum indicators, the Stochastic Oscillator is bounded and gives information about price relative to high-low range. MACD, on the other hand, is unbounded and gives information about the relationship between two moving averages. Both can be useful depending on market conditions, so traders often use them together for a more complete analysis.
To summarize the differences:
Stochastic Oscillator:
- It looks at a stock’s final price compared to its prices over a certain time.
- It uses a scale from 0 to 100. If it’s above 80, it might mean things are overpriced. If it’s below 20, it might mean things are underpriced.
- It’s a bounded indicator because its values are always between 0 and 100.
MACD:
- It looks at the relationship between two moving averages of a stock’s price.
- It’s an unbounded indicator because its values can be any number from negative infinity to positive infinity.
FAQ
What is the Best Stochastic Oscillator Settings
Most traders use the slow stochastic. Depending on their style of trading depends on the settings that are typically used.
Day traders using shorter time frames like M5, M15, M30 like to use settings (10,7,3), (7,3,3) or (5,3,3).
Swing traders using longer timeframes like H1, H4, and D1, they like to use settings (9, 3, 3), (14, 3, 3) or (21, 3, 3). Remember, these are just suggestions. The best settings for you will depend on your specific trading strategy and the market conditions.
What is the Rationale Behind the Stochastic Oscillator?
The rationale behind the stochastic oscillator is that if the asset is closing in the upper portion of its trading range for the lookback period, then the momentum is considered strong. If the asset turns sideways in a range, then the stochastic reading will fall indicating less momentum.
What is the History of the Stochastic Oscillator
The Stochastic Oscillator was created by George Lane in the late 1950s. Lane was one of the first researchers to publish papers on the use of stochastics as it was developed while he was teaching at a charting and Elliott Wave school.
The biggest takeaway by Lane was that the Stochastic should not be confused with trend indicators such as moving averages. It was created to be used in technical analysis of various securities that checks where a stock’s closing price stands compared to its recent high and low prices.
Is Stochastic Oscillator a Leading Indicator or a Lagging Indicator?
Stochastic is considered by some to be a leading indicator. Its calculation can alert the trader when momentum is slowing. Slowing momentum indicates a consolidation or potential reversal in price.
What Does %K Represent on the Stochastic Oscillator?
The %K component is occasionally referred to as the fast stochastic indicator. Think of the %K as the current mood of the market which represents the closing price of an instrument relative to the price range over a specific period.
What Does %D Represent on the Stochastic Oscillator?
Now the opposite end of the spectrum, %D also known as the slow K. This is seen as the average mood of the market where the %D is typically a 3-period moving average of %K. It’s an indication of whether the current trend is set to continue or change.
Can the Stochastic Oscillator be Used for Trending Securities?
The Stochastic Oscillator can be used in trends in a multi-time frame analysis strategy. The key is to filter the entry signals in the direction of the larger trend so you are not counter trend trading.
This is the biggest challenge with utilizing the stochastic oscillator in trending markets is that even when the oscillator is in overbought territory in an uptrend, the price could continue to rise.
What is the Best Timeframe to Trade With a Stochastic Oscillator?
The timeframe the Stochastic is used is dependent on the trading style and plan of the trader. However, as with most indicators the higher the timeframe the more reliable the signals tend to be.
There is another way in which market participants may utilize the Stochastic and that would be by taking a multi timeframe approach. Traders look at longer timeframes (like daily or H4) to spot overbought or oversold conditions, then zoom in to shorter timeframes (like H1 or M15) for precise decisions.
Is Stochastic Oscillator Accurate?
The stochastic oscillator is accurate simply because it is an algorithm and the calculations don’t lie. I think your question is better stated if stochastic oscillator is reliable? Like any indicator the accuracy and effectiveness do depend on the correct application. Generally the Stochastic does provide accurate signals as to overbought and oversold conditions but market participants should take into account the current mood of the market and the mood of the instrument in question.
It is key to note that the Stochastic Oscillator was never meant to be used in isolation and thus the accuracy is much better when used in conjunction with other indicators, price action patterns and key levels.
What is Stochastic 14 3 3?
I am going to try and break this down in a way that I think may be more understandable. The Stochastic 14,3,3 may be described as the roller coaster of stocks. Imagine you’re at an amusement park, and there’s a roller coaster. Sometimes it goes up, and sometimes it comes down. Stocks do the same thing, they go up and down in price.
The Stochastic Oscillator has two buddies, the %K (Fast Line): This line shows where the stock’s current price is compared to its recent high and low. %D (Slow Line): %D is like %K’s chill friend. It’s a simple average of %K. Both %K and %D move between 0 and 100.
When the stock’s closing price is in the upper half of its recent high/low range, %K goes up. It’s like saying, “Hey, the stock is feeling strong!” When the closing price is in the lower half, %K goes down. It’s like saying, “Whoa, the stock needs a break!”
What is 5 3 3 Stochastic Settings?
The change in settings from the more traditional 14 3 3 to a 5 3 3 makes the stochastic oscillator more responsive. This means that such settings would be more suited to short-term trading but will not block out any of the ‘market noise’ while at the same time the lines might not actually reach overbought and oversold levels.
This in turn can make the Stochastic Oscillator lines fluctuate more wildly but they may not actually cross the overbought and oversold territories. As with any indicator the settings will depend on your trading style and if you are a short term trader these settings could help as one form of confirmation.


