Written by:

Reviewed by:

Neutral
- December 30, 2024
- 25 min read
Long-Legged Doji Candlestick Pattern Explained
What is a Long-Legged Doji Pattern?
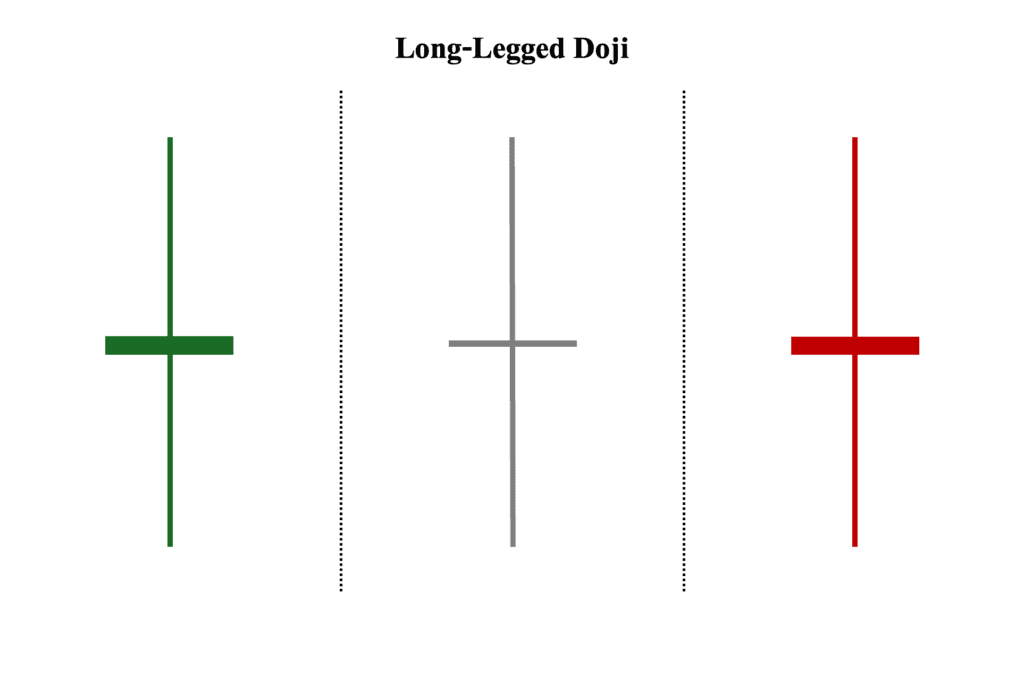
A long-legged doji is a single-candlestick pattern where there is a tall upper shadow, long lower shadow, and very tiny body. The non-existent real body plus the long-ranged candle helps this pattern stand out visually on a price chart. The pattern is neutral and represents market indecision and uncertainty regarding the future direction of price movement.
What Does a Long-Legged Doji Pattern Tell You
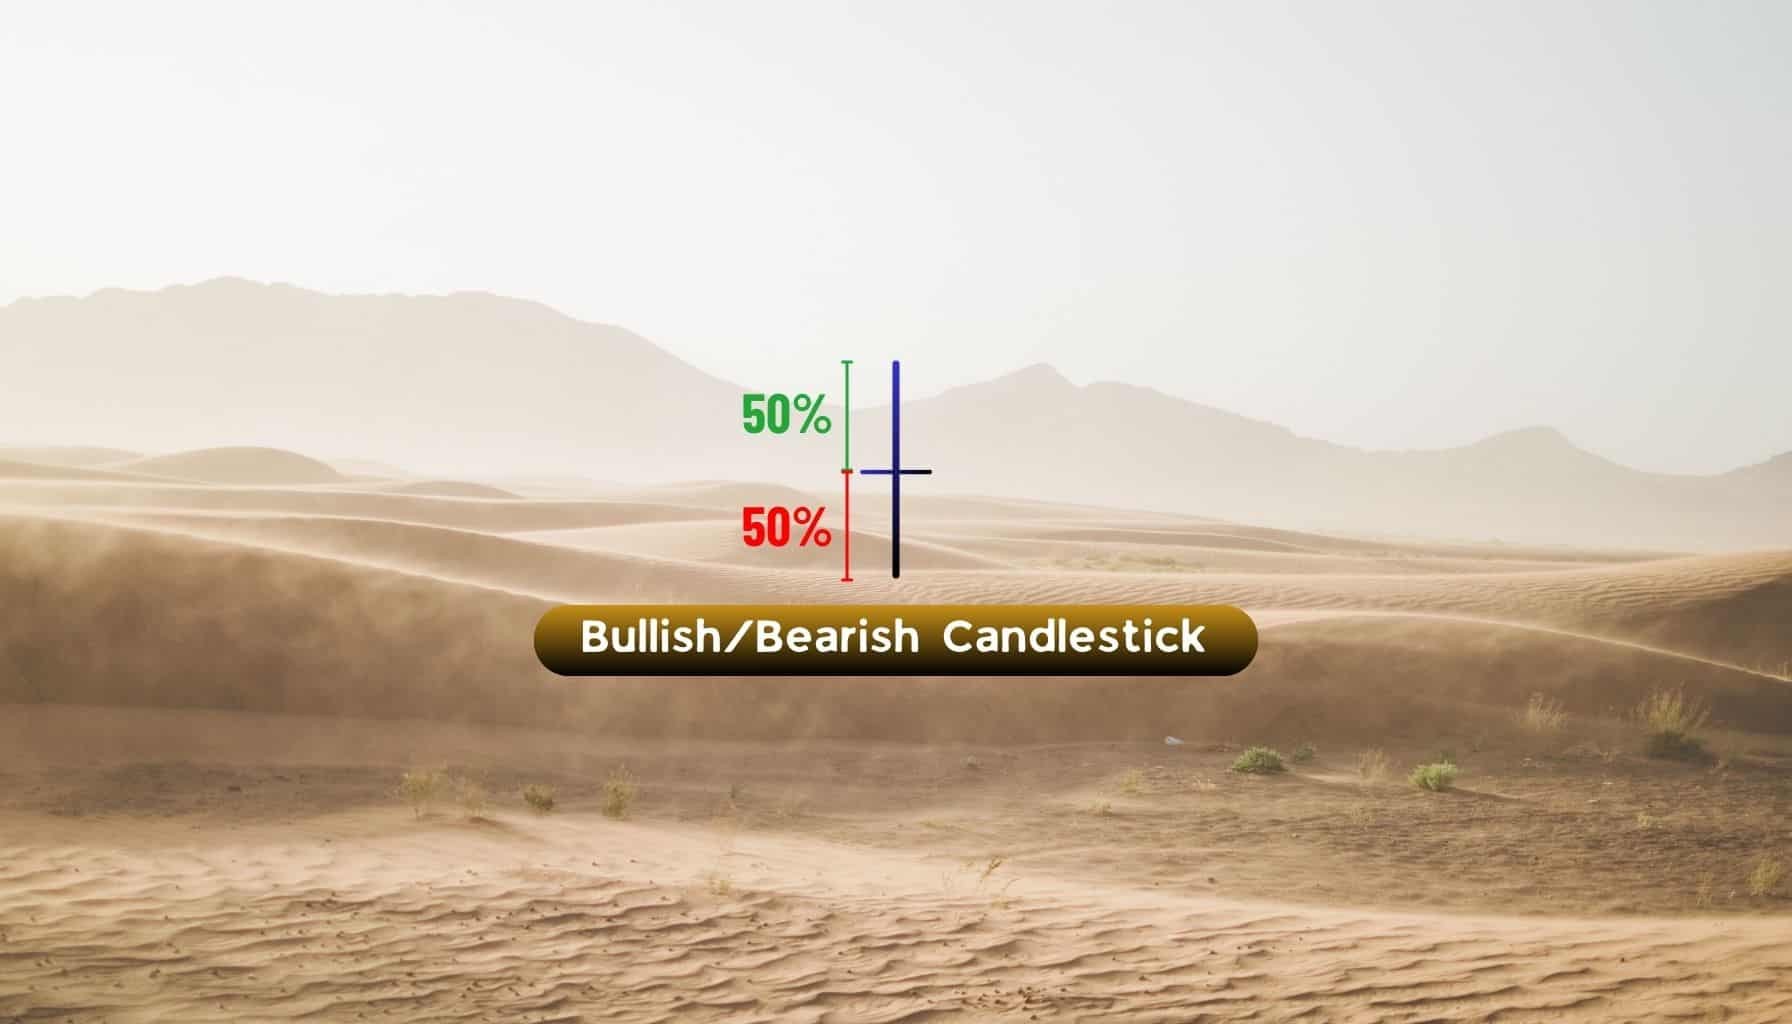
As a candlestick pattern, the long-legged doji represents a state of “market equilibrium”—where neither buyers nor sellers are in control of price movement. This is especially true when the opening and closing prices are near the midpoint of the candle’s range, making the upper and lower shadows virtually equal in length.
That said, when the pattern appears in a prevailing trend—either at the top of an uptrend or the bottom of a downtrend—it may be a precursor to a potential trend reversal. This is because, in a trending market environment, one would generally expect one party to dominate price action: buyers in an uptrend and sellers in a downtrend. However, with the long-legged doji, a temporary stalemate is observed.
Pro Tip: As a neutral candlestick pattern, the long-legged doji does not necessarily or decisively point to a potential reversal. Hence, we recommend waiting for the next candle to serve as a confirmation of either a potential price reversal or simply the continuation of the prevailing trend. We will discuss and illustrate this point in detail in the Examples section below.
How to Identify the Long-Legged Doji Pattern?
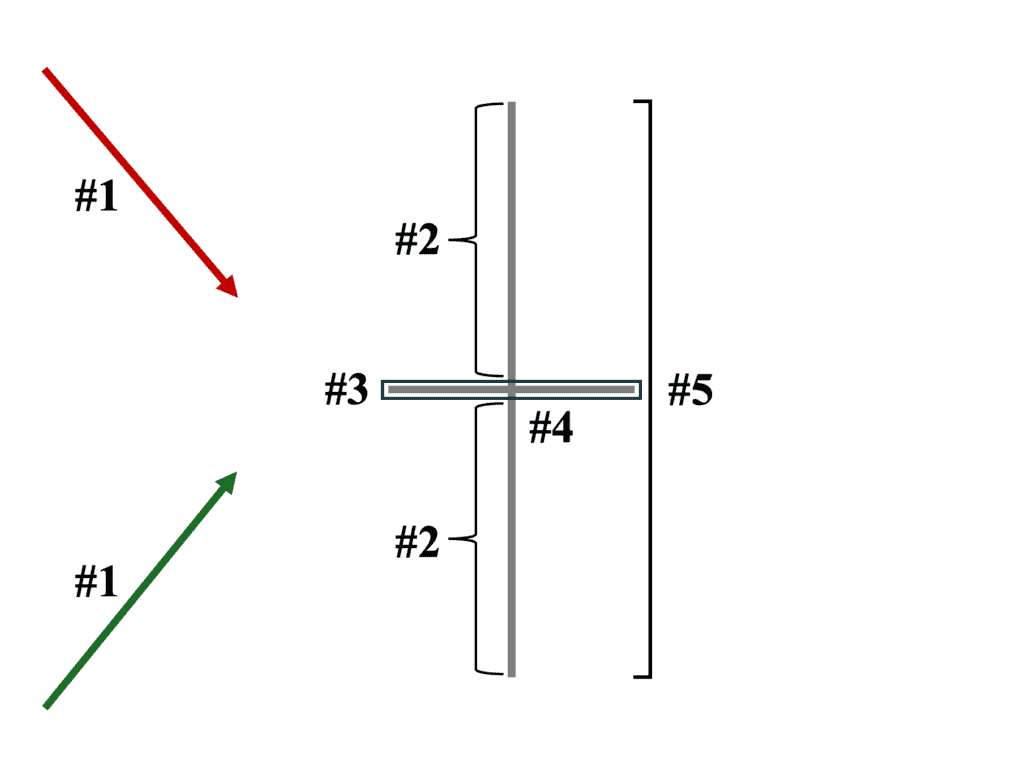
Here are the five key characteristics of a valid long-legged candlestick pattern on a price chart:
1. Position on the Chart: The candlestick pattern must appear during a trending market movement—either at the top of an uptrend or the bottom of a downtrend—in order to signal potential market indecision or a possible trend reversal.
Note: A long-legged doji that appears in a non-trending (sideways) market environment is invalid, as market sentiment is already indecisive, and there is no active trend to reverse.
2. Candle’s Shadows: Both upper and lower shadows (wicks) must be relatively long.
Note: This reflects the significant price movement (high volatility) and the struggle for control between buyers and sellers during that specific trading session.
3. Candle’s Body: The real body must be extremely small or even non-existent, as this represents the identical or nearly identical opening and closing prices.
4. Candle’s Color: The color is not important. That said, depending on the opening and closing prices, it may appear as:
a) grey if both the opening and closing prices are identical,
b) green or white if the closing price is slightly higher than the opening price,
c) red or black if the closing price is slightly lower than the opening price.
5. Candle’s Range: The candle’s range must be relatively large, making it stand out visually on the price chart.
Importance of Long-Legged Doji Pattern
The long-legged doji can provide deep insights into the current market dynamics of price action, even when compared to other candlestick patterns (especially other doji formations). For instance, a standard doji candle with much shorter upper and lower shadows—though also a neutral candle—usually just indicates a “pause” or even a reduced interest from market participants altogether.
In contrast, even without looking at the volume, the long-legged doji demonstrates a high degree of volatility within the trading session. This shows that while a stalemate occurs at the end of the trading period (similar to the standard doji), there was an elevated level of interest from both buyers and sellers—as evidenced by the significant price swings in both directions. Hence, regardless of whether the pattern leads to a trend reversal or continuation, the sheer level of volatility signifies a likely explosive move in either direction.
What Does the Red Long-Legged Doji Candlestick Pattern Indicate?
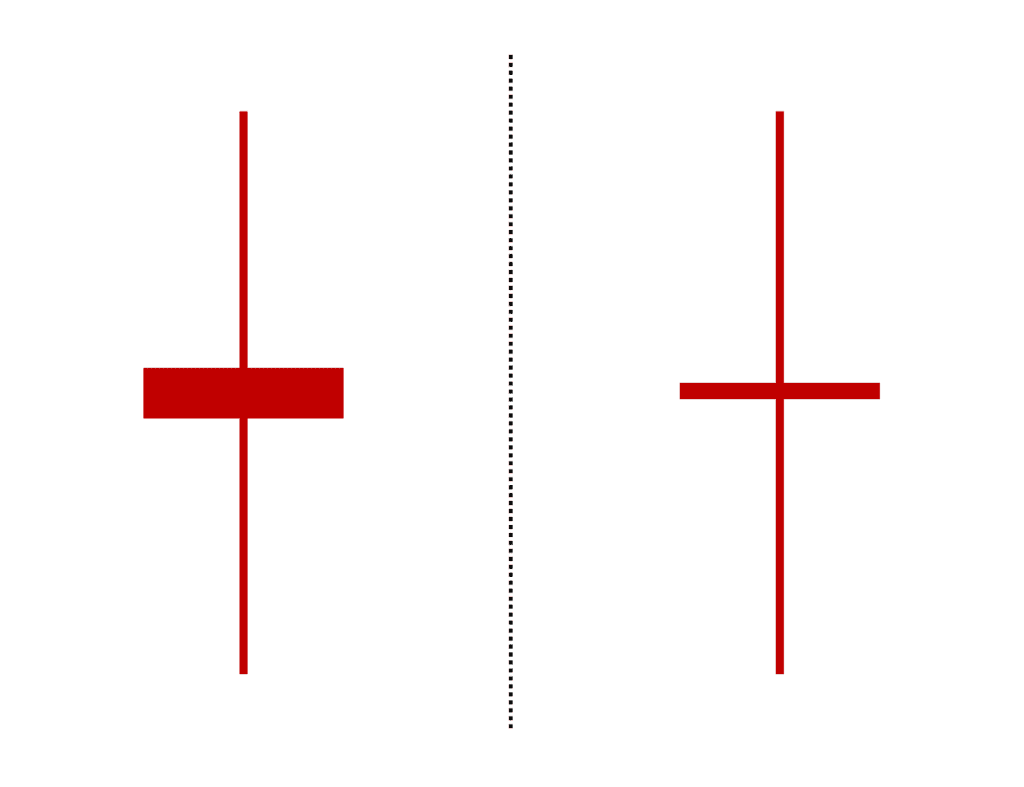
The red long-legged doji candle indicates that the pattern’s closing price is slightly lower than its opening price. Nevertheless, as previously mentioned, the color of the long-legged doji is not important. Hence, a red long-legged doji is not inherently bearish. In fact, whether the long-legged doji represents a bearish or bullish pattern depends entirely on its position on the chart and the next candle.
In general, the pattern is considered “bearish” in two market scenarios:
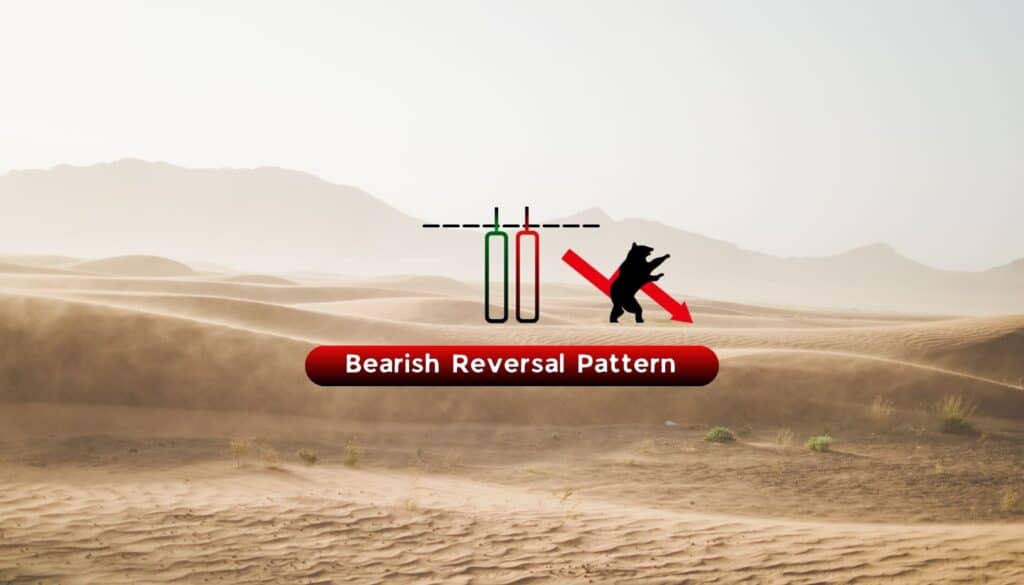
1. As a Bearish Reversal Signal – When the pattern (regardless of color) appears at the top of an uptrend and is followed by a bearish candle closing below the low of the long-legged doji.
2. As a Bearish Continuation Signal – When the pattern (regardless of color) appears at the bottom of a downtrend and is followed by a bearish candle closing below the low of the long-legged doji.
What Does the Green Long-Legged Doji Candlestick Pattern Indicate?
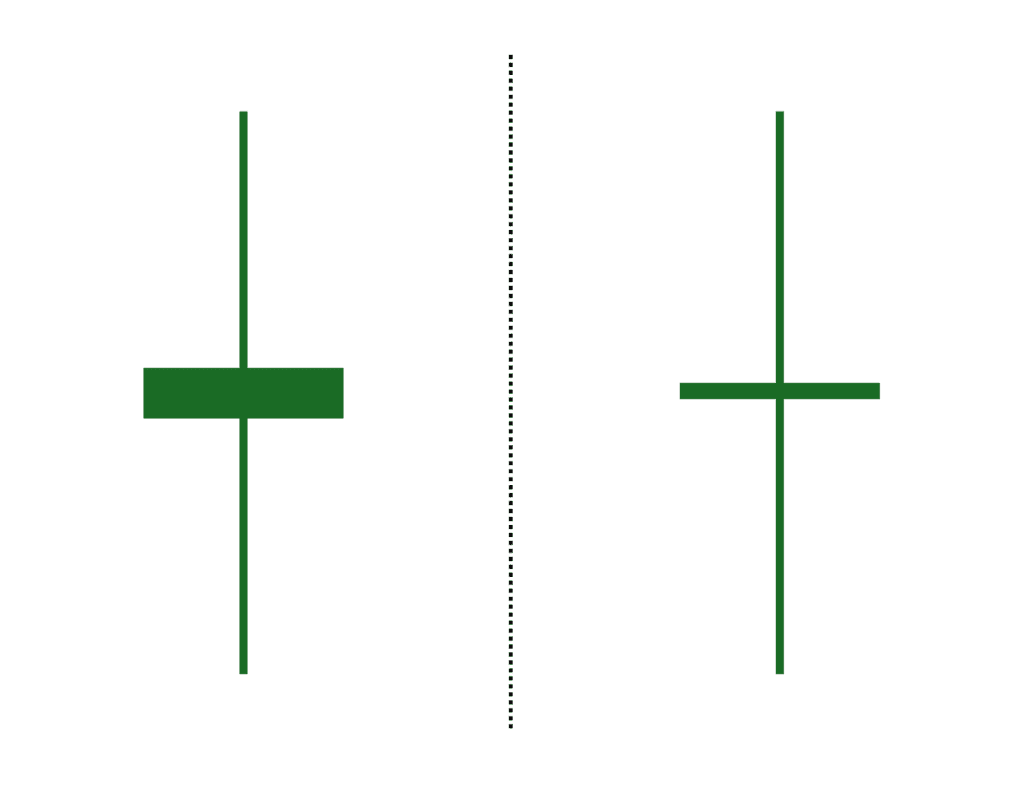
The green long-legged doji candle indicates that the pattern’s closing price is slightly higher than its opening price. Similar to its counterpart—the red long-legged doji—the green color does not inherently mean that the pattern is bullish. Instead, whether the long-legged doji represents a bullish or bearish pattern depends entirely on its position on the chart and the following candle that validates its likely direction.
Overall, the pattern is considered “bullish” in two market scenarios:
1. As a Bullish Reversal Signal – When the pattern (regardless of color) appears at the bottom of a downtrend and is followed by a bullish candle closing above the high of the long-legged doji.
2. As a Bullish Continuation Signal – When the pattern (regardless of color) appears at the top of an uptrend and is followed by a bullish candle closing above the high of the long-legged doji.
Long-Legged Doji Candlestick Pattern Examples
The following are five unique examples of the long-legged doji formation on a price chart:
Example 1: Bearish Reversal Scenario (Uptrend to Downtrend)
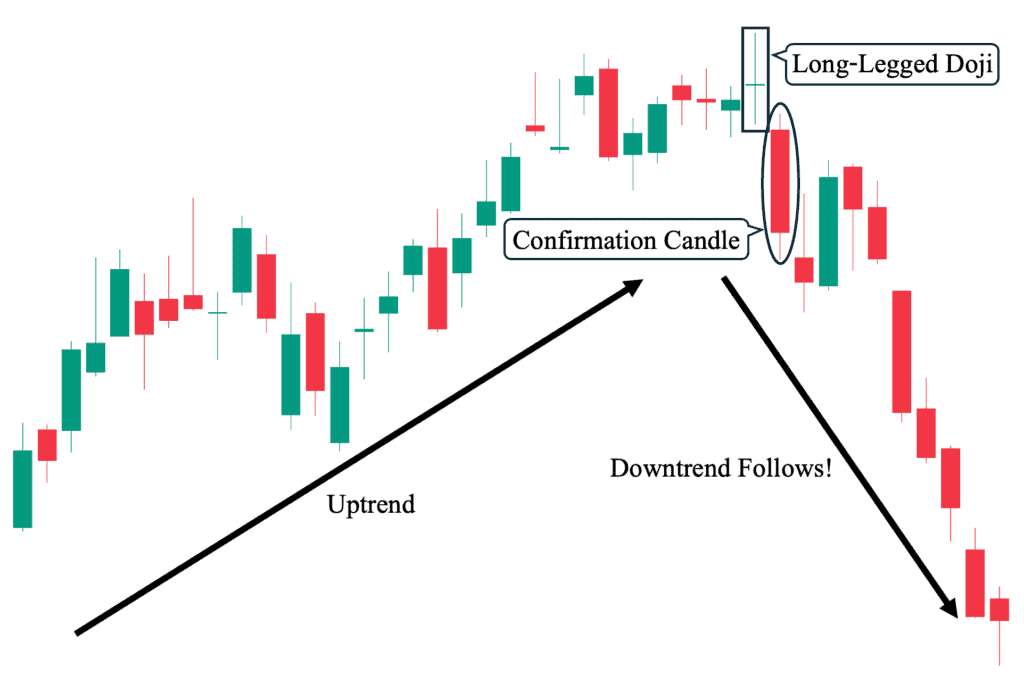
This first example demonstrates how a long-legged doji can appear at the top of a prevailing uptrend and point to a bearish reversal. As shown, there was a strong upward price movement. Then, the long-legged doji appeared at the top, creating a new high (as reflected by the long upper shadow) before ultimately closing near its opening price level.
Yet, while the extended upper shadow may suggest a likely resistance level in this market context—the long-legged doji alone does not provide a strong indication of a bearish reversal. This is why we recommend waiting for the next candle, as in this scenario, we observe a long bearish candle closing below the low of the candlestick formation—confirming that sellers had taken control of price action and triggering the downward price momentum that followed.
Example 2: Bullish Trend Continuation Scenario (Uptrend Continues)
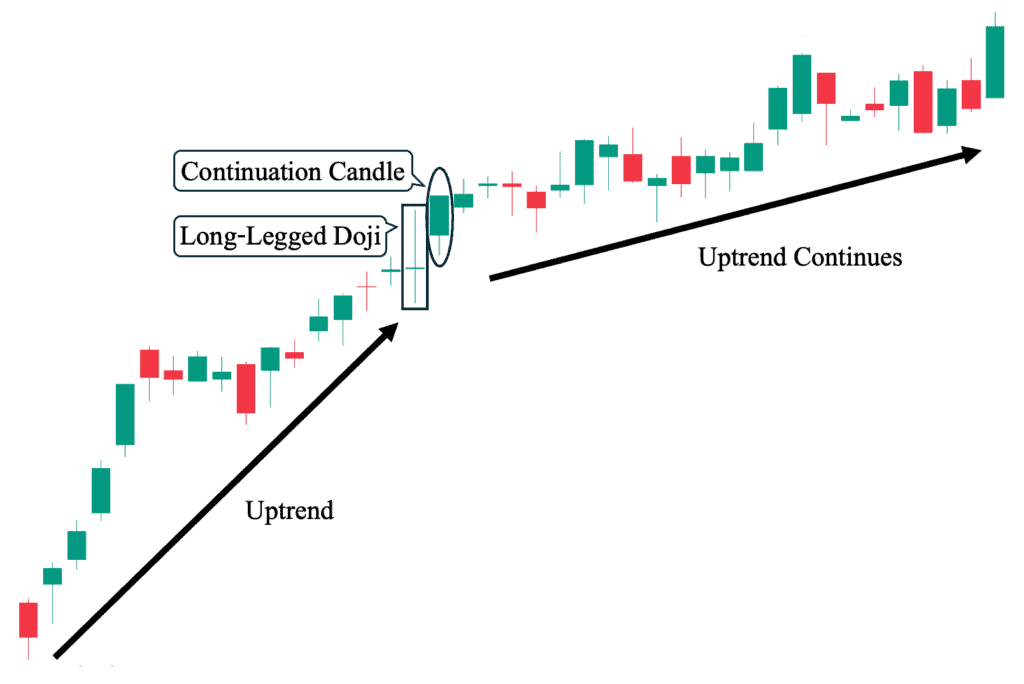
Similar to our first example, this second scenario shows the long-legged doji appearing after a sustained upward price movement on the candlestick chart. However, instead of resulting in a trend reversal like the first example, the long-legged doji, in this case, simply led to the continuation of the existing uptrend. This highlights the “neutral” nature of the candlestick pattern, as it cannot predict the likely future direction on its own—unlike other candlestick patterns explicitly labeled as “bullish” or “bearish.”
Instead, as in the first example, the following candle indicates the market sentiment bias, which the succeeding price movement will likely follow. In this case, the long-legged doji was followed by a bullish candle closing above the pattern’s long upper shadow, signaling that the existing uptrend was more likely to continue—and indeed, it did.
Example 3: Bullish Reversal Scenario (Downtrend to Uptrend)
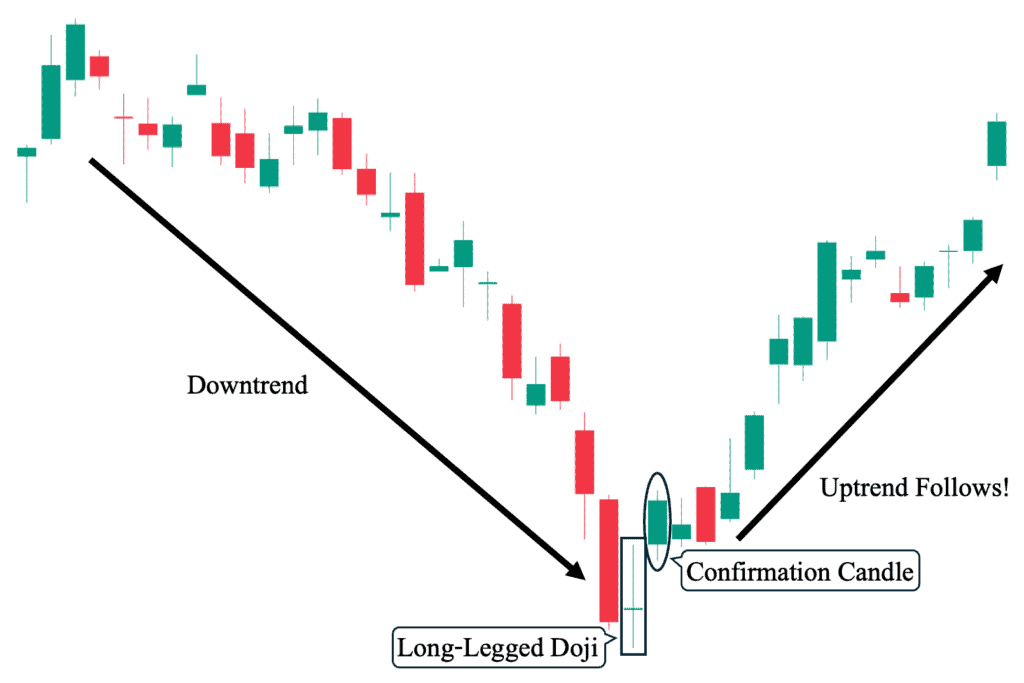
In contrast to the first and second examples, this third example demonstrates how the long-legged doji can also appear at the bottom of a sustained downward price movement. In this scenario, we observe a prevailing downtrend leading to the formation of the long-legged doji—even making a new low, as represented by the extended lower shadow.
Again, it is not advisable to “guess” whether it will result in a potential bullish reversal or merely a temporary pause before the bearish trend resumes solely based on this neutral pattern. That said, the long-legged doji was immediately followed by a bullish candle that closed above the pattern’s upper shadow, clearly signaling a potential bullish reversal—which did occur in this case.
Example 4: Bearish Trend Continuation Scenario (Downtrend Continues)
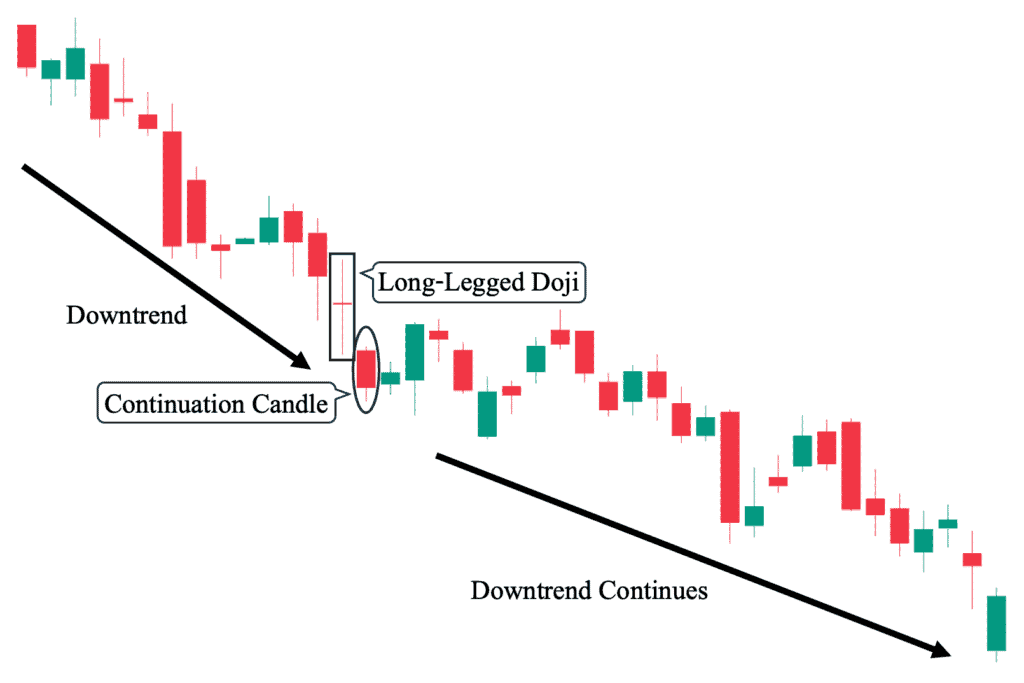
Similar to the third example, this fourth scenario shows a sustained downward price movement leading to the formation of the long-legged doji. However, unlike the third example where a bullish reversal followed, this pattern was succeeded by a bearish candle that closed below its lower shadow—signaling a likely continuation of the prevailing downtrend. This was indeed the case, as the downtrend eventually continued.
In this scenario, as well as in the previous three examples, we observe how the second candle effectively breaks the “stalemate” between buyers and sellers by decisively moving in one direction.
Note: Considering these four scenarios, you may wonder—”What if the following candle fails to break either the upper or lower shadow?” Well, in such a case, the future direction of the price is likely to remain uncertain until the price action finally breaks through either the upper or lower shadow. Hence, we generally do not recommend trading under such market conditions unless you receive a confirmation from other technical analysis tools (e.g., an RSI divergence, a break of a key moving average, etc.) that suggest a bullish or bearish bias.
Example 5: Non-Trending Scenario (Sideways Movement)
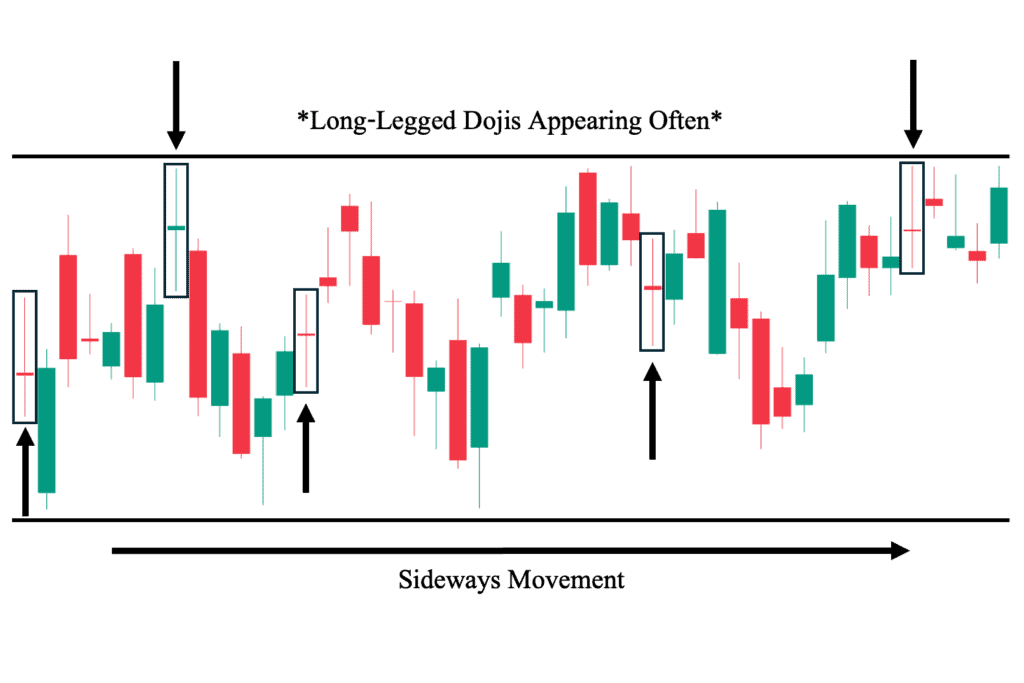
Finally, we also want to include the market environment in which you do not want to use the long-legged doji—during non-trending or sideways-moving market conditions. First of all, a long-legged doji appearing under such market conditions is already not considered valid, as market sentiment is already indecisive and there is no active trend to reverse or continue.
In addition, in this type of market environment, you are likely to encounter frequent neutral candlestick patterns, which, as shown in the illustration above, appear frequently and in seemingly random places—making them both unreliable and insignificant in this market environment. However, these locations are not random if you draw horizontal lines to create support or resistance. It is common for the long legged doji candles to appear near horizontal support or resistance levels.
Long-Legged Doji Pattern Trading Strategies
Here are some key trading strategies that focus on potential trend reversals and can be incorporated with the long-legged doji candlestick pattern:
Trading the Long-Legged Doji Near the Support and Resistances Level
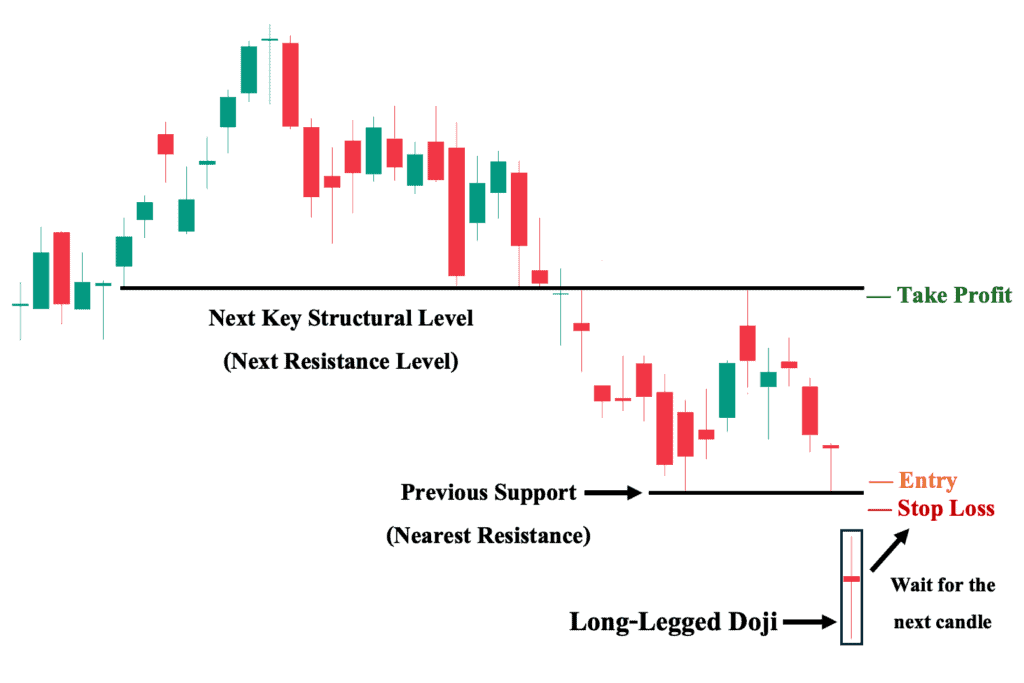
You can incorporate the long-legged doji into your comprehensive analysis of the market structure. This strategy involves a clear understanding of key price levels—structural support and resistance areas—to anticipate how price action may develop after the appearance of the long-legged doji.
To illustrate, first draw horizontal support or resistance lines that contain the most number of touch points with the wicks of the candles. In the illustration above the top structural level was former support, was broken, then acted like future resistance.
Further down another horizontal support level contained prices until price gapped lower creating the long legged doji. As a result, we can observe an established downtrend prior to the formation of the long legged doji candlestick pattern. Since the long-legged doji is a neutral candlestick pattern, it would be improper to base your trading decision solely on this pattern, as it does not necessarily indicate a bullish or bearish bias.
That said, suppose we are considering a potential reversal that may follow the pattern. In this case, it is essential to wait for a possible bullish candle to confirm the reversal. Moreover, the confirmation candle must not only close above the high of the long-legged doji (minimum requirement), but it is essential that the price breaks and close above the nearest resistance level (in this case, the previous support level) to clearly signal a bullish control of price action.
Overall, if the next candle successfully breaks this resistance, it significantly increases the likelihood of the beginning of a bullish trend reversal. In contrast, if the following candle’s price falls below the low of the long-legged doji, then the downtrend will likely continue—effectively invalidating this trade setup.
1. Entry Point: A few ticks above the nearest resistance level (the next candle must first close above this level to confirm the bullish reversal).
2. Stop Loss Point: Set your stop loss a few ticks below the nearest resistance level.
3. Take Profit (TP) Level: Set your TP a few ticks below the nearest key structural support level. In this case, the downtrend’s previous key support level (which serves as a potential key resistance area if the subsequent price action following the long-legged doji breaks the nearest resistance level, as shown above).
4. Risk-Reward Ratio: The risk/reward ratio must be at least 1:1. We do not recommend taking trades with a ratio below this in any trading situation. The higher the potential reward relative to the risk, the better. Nevertheless, ensure you use an objective approach when setting your TP and SL levels rather than inflating them artificially.
Trading the Long-Legged Doji with Moving Averages
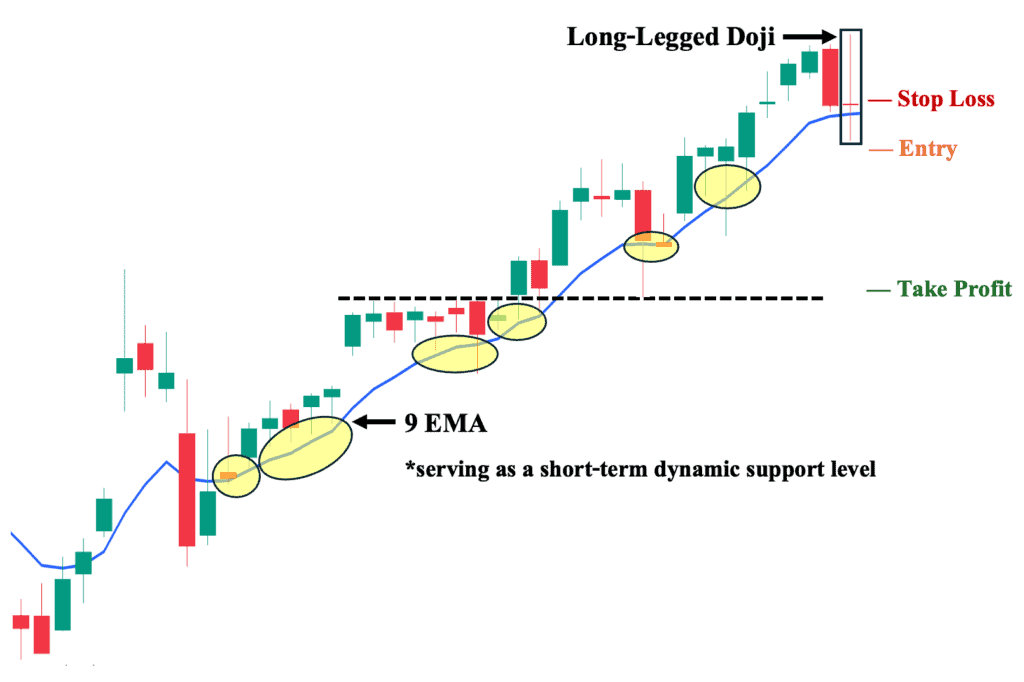
One of the most effective technical indicators to use is Moving Averages (MAs), particularly those with settings appropriately tuned to the price action the specific asset “respects.” This is because, compared to other technical indicators, Moving Averages (MAs) is arguably the most widely used and integrated tool in technical analysis among both institutional and retail investors, enhancing its overall effectiveness in a candlestick chart.
To illustrate, we can observe a prolonged uptrend prior to the formation of the long-legged doji—which features an extended upper shadow representing a new price high. Highlighted in yellow, we can also observe how the price “respects” this specific exponential moving average—the 9 EMA—by consistently bouncing back above the MA line, thereby establishing the 9 EMA as a key dynamic support level. Hence, if we are looking for a potential trend reversal (allowing us to take a short position) that may follow the long-legged doji, the major requirement would be that the following candle’s price breaks this MA. Otherwise, if the following candle does not manage to close below this moving average, the trend is likely to hold.
1. Entry Point: A few ticks below the 9 EMA (the price must close below this dynamic support level first).
2. Stop Loss Point: Set your stop loss a few ticks above the 9 EMA.
3. Take Profit (TP) Level: Set your TP a few ticks above the nearest key structural level.
4. Trailing Stop: Once in the trade, sell if the price closes above the 9 EMA before reaching your TP, as this signifies a likely renewed bullish momentum.
5. Risk-Reward Ratio: The risk/reward ratio must be at least 1:1. We do not recommend taking trades with a ratio below this in any trading situation.
Trading the Long-Legged Doji as a Bullish Reversal Signal
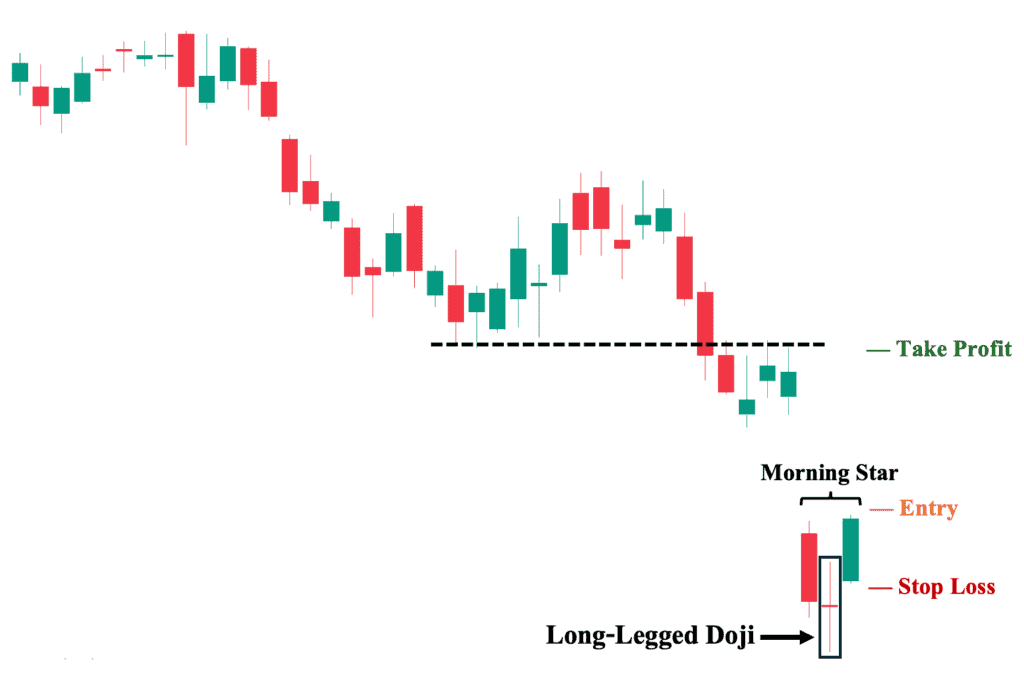
As a single candlestick formation, the long-legged doji has the potential to develop into more decisive candlestick patterns—either a bearish or bullish reversal pattern. To illustrate, we can see an established downtrend prior to the appearance of the long-legged doji at the bottom of the trend. In fact, the candle before the pattern represented a gap down (where the price falls significantly at the open), illustrating an extremely bearish sentiment. However, after the long-legged doji appeared, it was immediately followed by a long bullish candle, forming a morning star pattern and signaling a complete 180-degree shift toward bullish sentiment and a potential bullish reversal.
1. Entry: A few ticks above the high of the Morning Star pattern’s bullish candlestick.
2. Stop Loss Point: Set your stop loss a few ticks below the low of the Morning Star pattern’s bullish candlestick.
3. Take Profit (TP) Level: Set your TP a few ticks just below the nearest key structural level. In this case, the downtrend’s previous support level (which now serves as a potential key resistance area if the Morning Star pattern materializes).
4. Risk-Reward Ratio: The risk/reward ratio must be at least 1:1. We do not recommend taking trades with a ratio below this in any trading situation.
Trading the Long-Legged Doji as a Bearish Reversal Signal
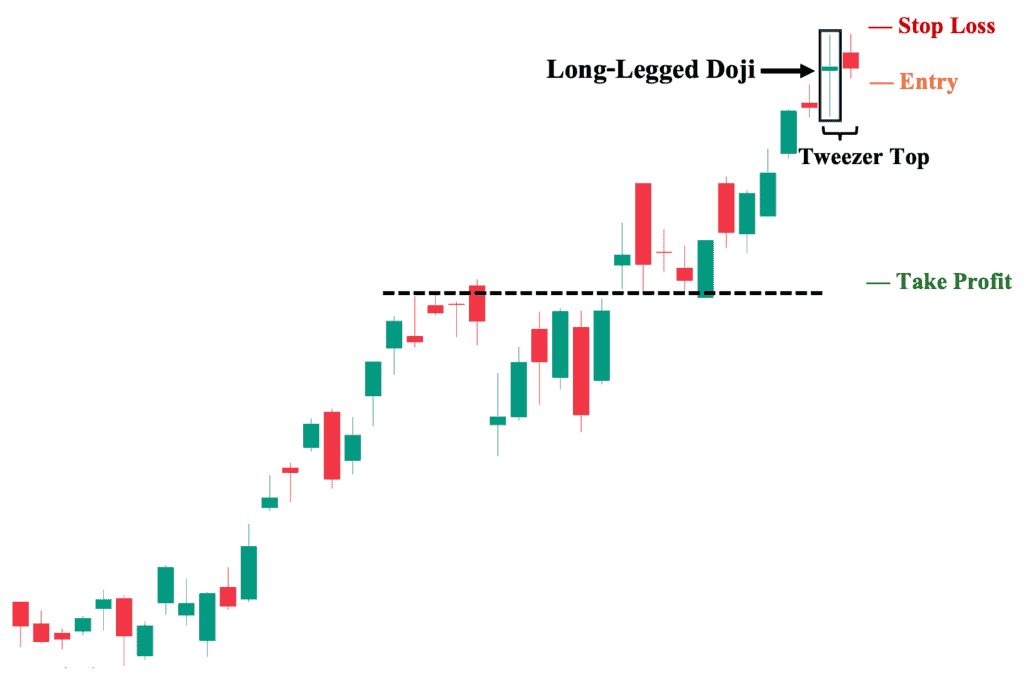
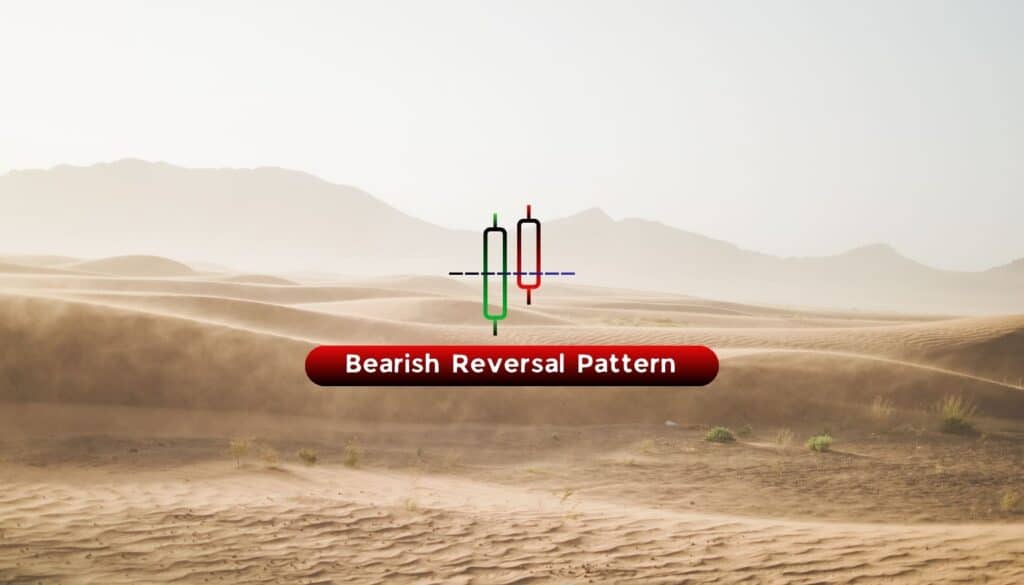
Similar to the third trading strategy, where the long-legged doji developed into a bullish reversal candlestick pattern during a downtrend, the pattern can also evolve into a potential reversal signal during an uptrend. To illustrate, we can observe a strong upward price movement leading to the formation of the long-legged doji, which establishes a new price high for the trend.
Then, it was followed by a bearish candle with shadows that matched the height of the extended upper shadows of the long-legged doji. Together, the two candles formed a new candlestick pattern—the tweezer top, characterized by virtually equal highs and is considered a bearish reversal pattern. That said, this newly formed pattern provides an opportunity for a short position, as market sentiment has shifted to bearish.
1. Entry: A few ticks below the low of the tweezer top pattern’s second (bearish) candlestick.
2. Stop Loss Point: Set your stop loss a few ticks above the high of the tweezer top pattern’s second candle.
3. Take Profit (TP) Level: Set your TP a few ticks above the nearest key structural level. In this case, the uptrend’s previous resistance level (which now serves as a potential key support area if the bearish reversal materializes).
4. Risk-Reward Ratio: The risk/reward ratio must be at least 1:1. We do not recommend taking trades with a ratio below this in any trading situation.
Advantages of Trading the Long-Legged Doji Candlestick Pattern
Here are the key advantages of the long-legged doji formation that can help elevate your trading approach:
1. Insight on market dynamics
First, the long-legged doji provides invaluable insight into the current market indecision between buyers and sellers. While market dynamics can be challenging to gauge with other candlestick patterns—especially decisive formations—the long-legged doji instantly conveys a narrative of market equilibrium, where both sides have reached a stalemate. In contrast, other candlestick formations, particularly two- or three-candle patterns, require more careful evaluation of each individual candle.
2. Easy to spot and recognize
Second, the long-legged doji is arguably one of the easiest candlestick formations to identify on a price chart. Its long shadows and small or non-existent real body make it stand out visually due to its sheer size. In contrast, other candlestick patterns often require a more discerning eye to ensure they meet specific criteria. For example, a piercing line pattern requires its second candle to close above 50% of the first candle’s body. While this may seem straightforward, it can sometimes be confusing (especially for beginners), as a candle’s body differs from its total range, which includes the shadows.
3. Reflects volatility and interest level
Third, the long-legged doji is one of the most effective candlestick formations for illustrating high volatility and heightened interest from market participants. The long upper and lower shadows reflect one side aggressively driving the price in one direction, only to have the opposing side swiftly push it the other way. This intense push-pull dynamic signifies an increased engagement from both buyers and sellers as both parties actively try to take control. As a result, when one side eventually gains control of the price action, it often leads to an explosive move in that direction.
Disadvantages of Trading the Long-Legged Doji Candlestick Pattern
Here are the key disadvantages of the long-legged doji candlestick pattern that you should be aware of:
1. Inability to give a decisive price action forecast
First and foremost, the most significant disadvantage of the long-legged doji is its inherently neutral nature as a candlestick formation. Unlike decisive patterns, it cannot independently indicate the likely direction of future price movement. Instead, it merely highlights the market’s indecision and the struggle for control between buyers and sellers in that specific trading session.
2. Reliant on a confirmation candle
Second, and closely related to the first point, the long-legged doji is entirely reliant on the following candle to signal the likely direction of future price movement. As a result, it is crucial to wait for a confirmation candle before acting on the long-legged doji—failing to do so risks entering a position that could be incorrect from the get-go.
3. Uncertain risk-reward profile
Third, the need to wait for the following candle after the appearance of the long-legged doji often leaves the risk-to-reward ratio uncertain. This is crucial because, even if the subsequent candle aligns with the desired trade direction, an unfavorable risk-to-reward ratio—such as an entry point too far from the stop-loss level—can make opening a position suboptimal. Hence, in such cases, the potential downside if the trade goes against the plan is disproportionately high.
Long-Legged Doji vs. Common Doji Pattern
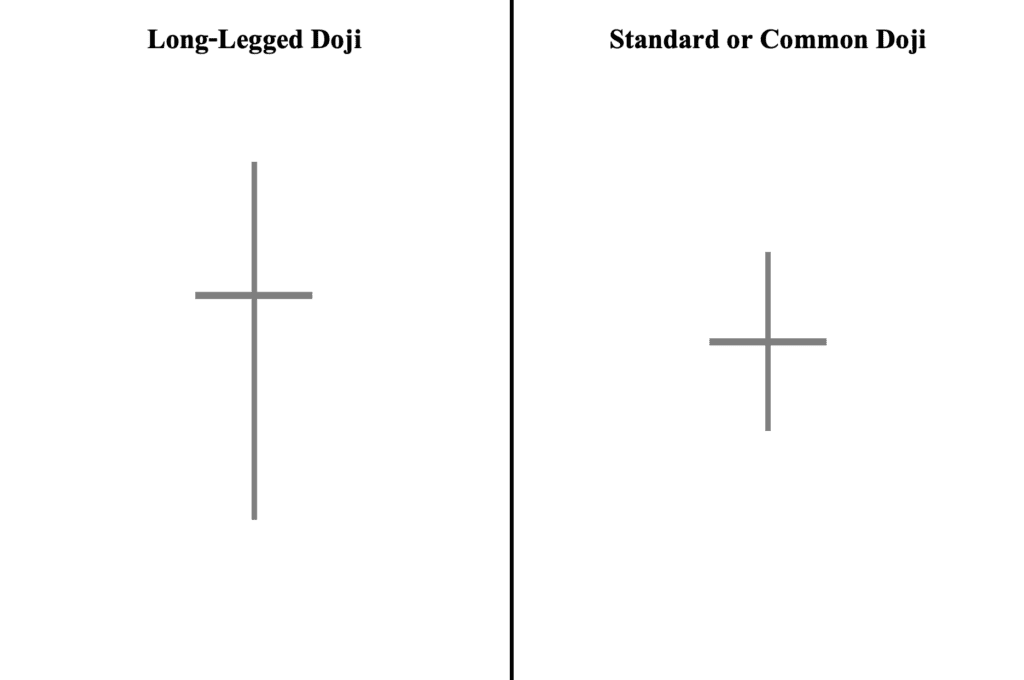
Both the long-legged doji and the standard doji are considered neutral candlestick patterns that show a state of uncertainty about the future direction of price movement. The key difference, however, lies in the size of the upper and lower shadows of each candlestick pattern.
The long-legged doji, as the name implies, is characterized by long upper and lower shadows, whereas a standard doji has much shorter upper and lower shadows. In terms of market sentiment, the long shadows of the long-legged doji represent a higher level of price volatility as well as heightened interest from both buyers and sellers, whereas the short shadows of the standard doji represent lower volatility as well as minimal interest from both market participants.
Long-Legged Doji vs. Dragonfly Doji Pattern
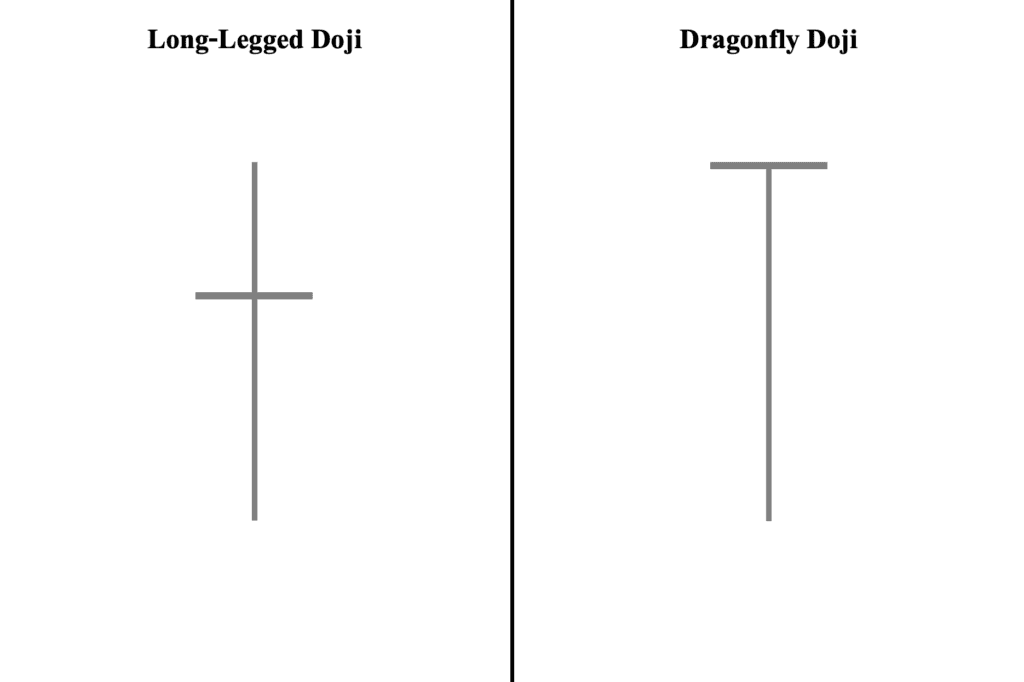
Like the long-legged variant, the dragonfly doji is likewise a single-candlestick formation with little to no real body—representing identical or nearly identical open and close prices. That said, while the long-legged doji forms with extended upper and lower shadows, the dragonfly doji resembles a capital “T,” with an extended lower shadow but little to no upper shadow.
As a candlestick formation, the dragonfly doji is considered a bullish reversal pattern when it appears at the bottom of a downtrend. This is because its long lower shadow represents a strong rejection of lower prices.
Long-Legged Doji vs. Gravestone Doji Pattern
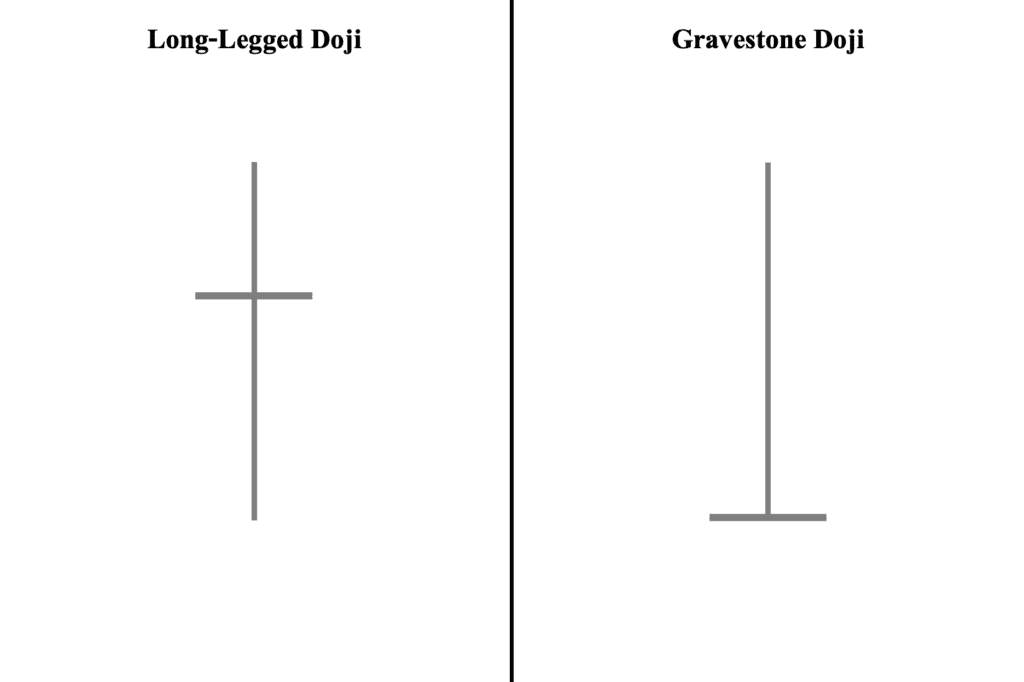
Similar to the long-legged variant, the gravestone doji is also a single-candlestick formation with little to no real body—representing identical or nearly identical open and close prices. Nevertheless, while the long-legged doji forms with long lower and upper shadows, the gravestone doji resembles an inverse capital “T,” with a long upper shadow but little to no lower shadow.
As a candlestick pattern, the gravestone doji is considered a bearish reversal formation when it forms at the top of an uptrend. This is due to the fact that its long upper shadow represents a strong rejection of further price rallies.
Long-Legged Doji vs. Four-Price Doji Pattern
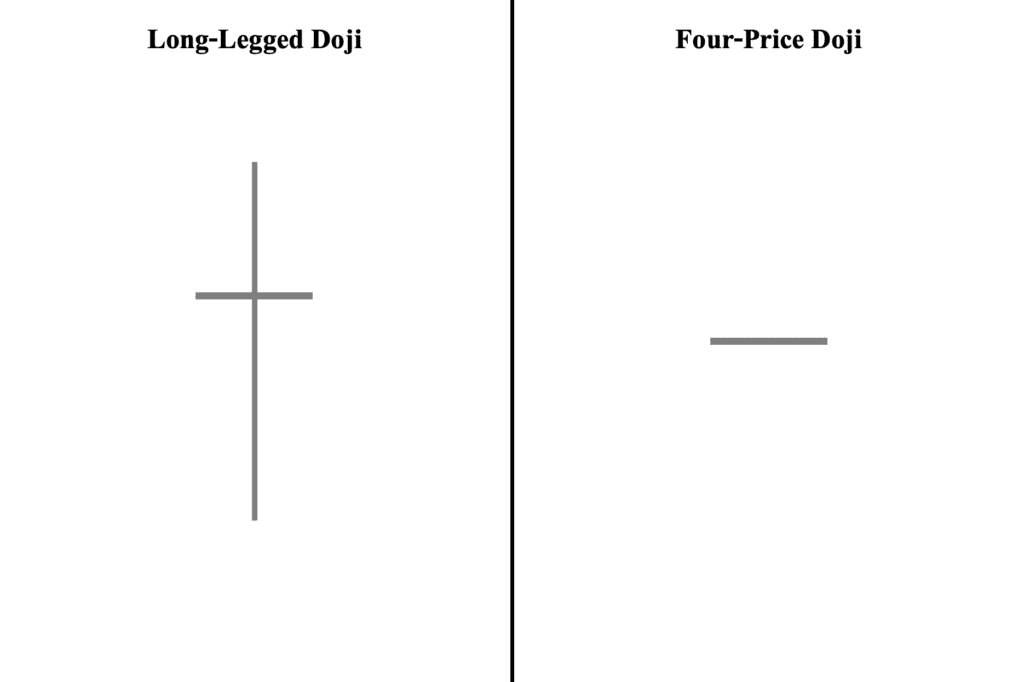
Fourth, like the long-legged variant, the four-price doji is also a single-candlestick formation with little to no real body—representing identical or nearly identical opening and closing prices. However, while the long-legged doji forms with long shadows on each side, the four-price doji has no lower or upper shadow at all.
This means that its opening, closing, high, and low prices are completely identical. Thus, while the long-legged doji demonstrates a high degree of volatility, the four-price doji is the opposite—reflecting zero volatility.
Long-Legged Doji vs. Rickshaw Man Doji Pattern
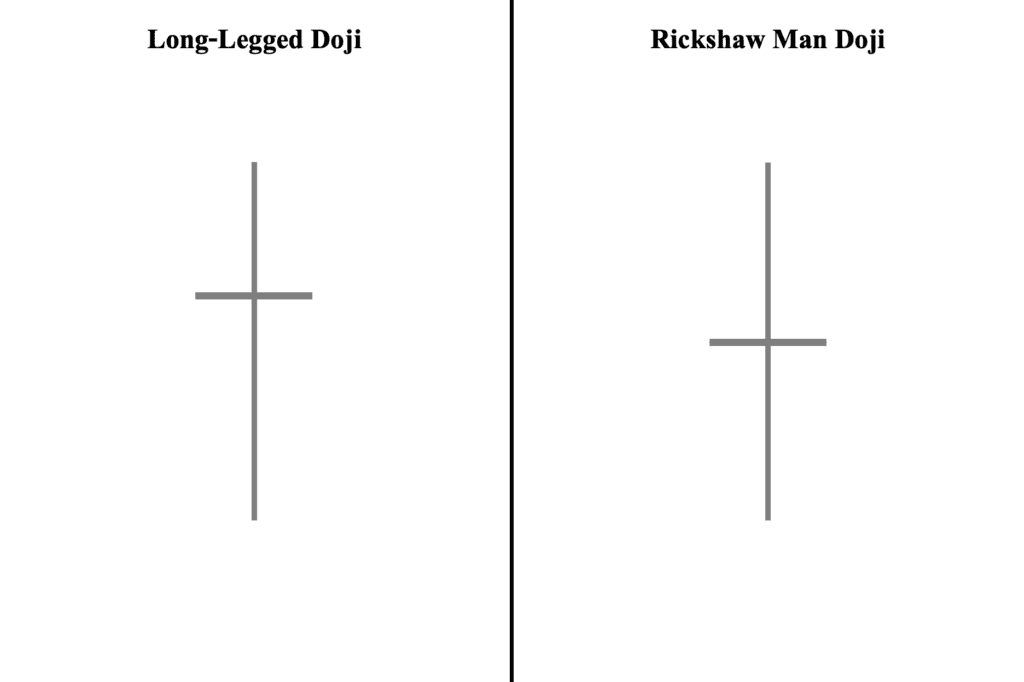
Finally, like the long-legged variant, the rickshaw man doji is also a single-candlestick formation with little to no real body—reflecting identical or nearly identical open and close prices. Nevertheless, compared to the other doji candlesticks we have covered, the long-legged doji and the rickshaw man are the most similar and, in fact, can be used interchangeably.
As shown, while the long-legged doji typically has disproportionate long shadows on each side (i.e., one shadow is usually longer or shorter than the other), the rickshaw man doji is characterized by having proportionate shadows on each side (i.e., both the lower and upper shadows are equal or nearly equal in length).
What is the Psychology Behind the Long-Legged Doji Pattern?
The market psychology behind the long-legged doji primarily revolves around the heightened volatility that occurs during the specific trading period. Specifically, the extended upper and lower shadows represent one party aggressively driving the price in one direction, only for the other party to swiftly push it in the opposite direction. Yet, despite the best efforts of both buyers and sellers, the closing price ultimately moves back toward the opening price—hence making the opening and closing prices appear virtually equal as buyers and sellers reach a state of market equilibrium or a temporary stalemate.
In a strong trending move (either in a prolonged uptrend or downtrend), this stalemate can be seen as a sign of the dominant party’s weakening control over price action. However, this weakening control does not necessarily signal a decisive trend reversal, especially if the dominant party quickly regains control in the following candle. This is why we recommend waiting for the next candle to confirm whether a potential trend reversal is likely to occur or if the original trend is likely to resume.
What is the Opposite of Long-Legged Doji Patterns?
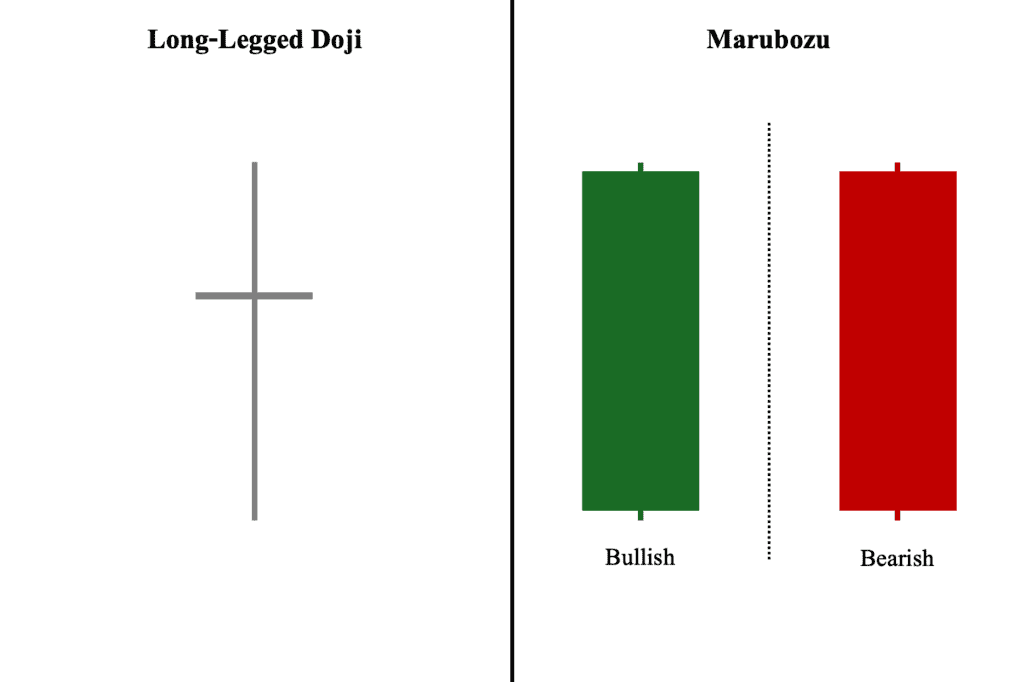
When comparing the long-legged doji with other candlestick patterns, the candlestick formation that stands out as its direct opposite is the Marubozu. First, while the long-legged doji has little to no real body (representing nearly identical open and close prices), the Marubozu candle features a large real body, indicating a significant distance between the open and close prices.
Second, while the long-legged doji has long shadows on each side, the Marubozu candle has little to no shadows at all. Third, while the color of the long-legged doji is not important, the color of a Marubozu candle is crucial in determining its function. Finally, while the long-legged doji is a neutral pattern that reflects market indecision, Marubozu candles represent a decisive market sentiment depending on their color—green signifies bullish sentiment, while red signifies bearish sentiment.
Frequently Asked Questions (FAQs)
What is the best time frame to use the Long-Legged Doji pattern?
Like other candlestick patterns, the long-legged doji works best on longer time frames (i.e., daily and weekly candlestick chart setups). This is due to the fact that most market participants, particularly institutional investors, primarily use these two longer time frames as the basis for their trading strategies and decisions, which enhances their reliability. On the other hand, lower time frames (i.e., those shorter than a day) are highly susceptible to intraday market noise, leading to long-legged doji appearing more frequently, diminishing the pattern’s significance.
Who first identified the Long-Legged Doji pattern?
Steve Nison is widely credited with introducing many candlestick patterns into the mainstream, including the long-legged doji pattern and other neutral patterns, such as the spinning top and various doji variants, through his book Japanese Candlestick Charting Techniques in the early 1990s. Since then, the long-legged doji has become a widely used candlestick pattern in various financial markets.
How reliable and accurate is the Long-Legged Doji pattern?
As a neutral candlestick pattern, the long-legged doji does not inherently signal either a trend reversal or continuation. Hence, it is not advisable to rely on this pattern in isolation. To drastically enhance its reliability and accuracy, it is crucial to wait for the following candle to either confirm a potential reversal or signal a continuation of the prevailing trend. Likewise, combining the long-legged doji with complementary technical analysis tools—such as Moving Averages, RSI, or other technical indicators—can further strengthen its reliability. That said, note that no pattern, including the long-legged doji, can be 100% reliable or accurate.
Can a Long-Legged Doji pattern occur in both uptrends and downtrends?
Yes, the long-legged doji can occur in either market trends—uptrend or downtrend—in a candlestick chart. In fact, it is a requirement for validity, as a long-legged doji that appears in a non-trending environment is considered invalid since there is no trend to either reverse or continue to begin with. Also, as a “neutral” candlestick pattern, it can appear in both market trends, unlike explicitly bullish or bearish candlestick patterns, which are only valid when they occur within a specific trend.
Is the Long-Legged Doji pattern bullish or bearish?
Strictly speaking, the long-legged doji is considered a “neutral” pattern and is neither bullish nor bearish on its own when it appears on a candlestick chart. That said, the pattern can provide a bullish or bearish signal when analyzed alongside the succeeding candle—which serves to confirm the likely future direction of price movement.
What do the shadows of the Long-Legged Doji mean?
Simply put, the long shadows of the long-legged doji represent the extent to which the price has moved within the trading session. More specifically, the long upper shadow illustrates the highest price level reached during the session, reflecting buyers’ failed attempt to push prices upward. By the same token, the long lower shadow represents the lowest price level reached, highlighting sellers’ failed attempt to drive prices downward.