


Written by:

Reviewed by:

Bullish
- February 15, 2026
- 29 min read
30 Bullish Candlestick Patterns Traders Use
What is a Bullish Candlestick Pattern?
A bullish candlestick pattern shows how price reacts at specific points in the market. The shape of each candle gives traders insight into sentiment, buying pressure, and potential shifts in trend.
These formations may appear as a single candlestick or as a series of candles that create a larger structure.
Candlestick patterns appear in both rising and falling markets. They fall into two broad categories:
- Bullish and bearish
- Reversal and continuation
Bullish reversal patterns signal that downward pressure may be ending, while continuation patterns suggest an existing uptrend is likely to continue. Bearish formations tend to predict the opposite.
At first glance many patterns look similar, but their structure and colour reveal important differences.
This guide focuses purely on bullish candlesticks, so you can recognise when a downtrend is about to end, or when bullish momentum is building.
Factors to Consider When Trading Bullish Candlestick Patterns
Volume Adds Conviction
Increased trading volume as the bullish pattern forms can confirm the trend change to up. When more traders are active, the price movement behind the pattern holds more weight.
Patterns should be combined with other trading indicators
Relying on candlesticks alone can be risky. Use additional tools like moving averages or oscillators to validate the potential price direction.
- Fibonacci retracement levels represent hidden levels where price pullbacks and bullish reversals may occur. A bullish candlestick pattern adds confirmation for a bounce.
- ATR (Average True Range) helps gauge volatility. A bullish pattern in a high-volatility market might signal stronger momentum, while low volatility might suggest weaker follow-through.
- VWAP (Volume-Weighted Average Price) is an average price based on volume. When a bullish candlestick pattern develops near the VWAP line or above it, then a rally may continue.
- Stochastic oscillators help identify overbought or oversold conditions. If the oscillator shows the market is oversold, a bullish candlestick pattern could signal a potential reversal.
- RSI (Relative Strength Index) shows how strong (or weak) the market is. A bullish candlestick appearing after the RSI is climbing from low levels suggests a potential price recovery.
- Support and Resistance Levels can make bullish and bearish patterns more reliable.
Trends
Bullish candlestick patterns formed in an uptrend are more likely to succeed than those in a downtrend. These patterns have the strength of the underlying trend behind them.
Context Matters
Where the pattern appears on the chart matters. A bullish pattern appearing at a key pivot point, after a consolidation phase, or during a trend correction is more significant.
Patterns are NOT guaranteed to work all the time
No pattern works 100% of the time and there will be times the market moves in the opposite direction. Always manage risk, use stop-loss orders, and avoid trading patterns in isolation.
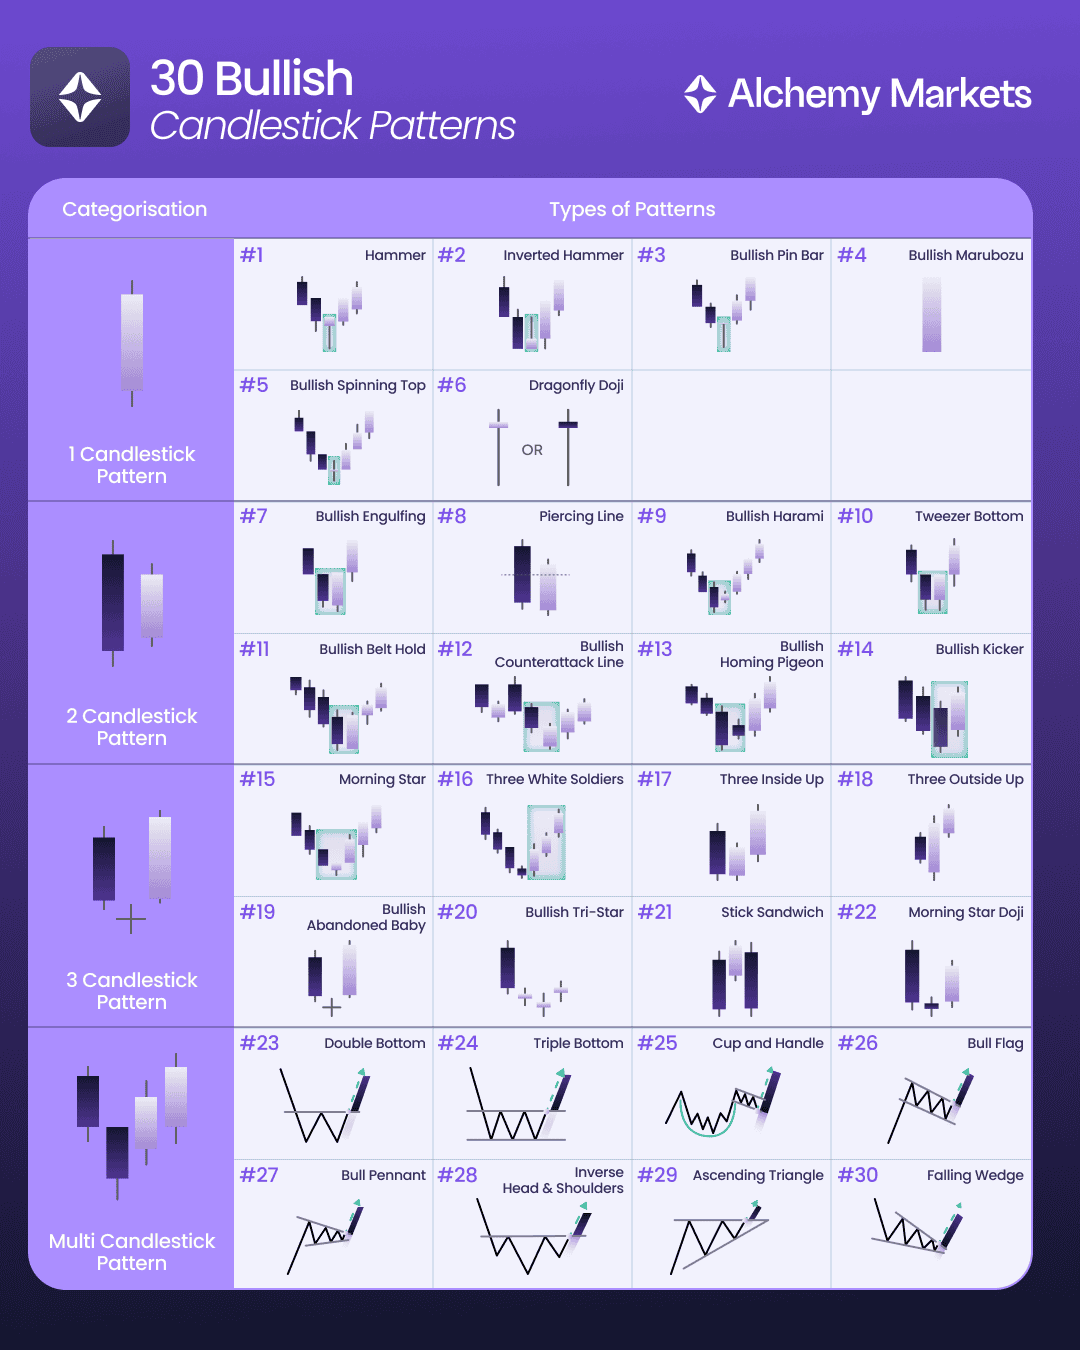
Bullish Candlestick Patterns Cheat Sheet
30 bullish patterns can be a lot. That’s why we’ve created this “Bullish Candlestick Patterns PDF”.
The cheat sheet summarises all of the 30 patterns in the same order as below in a visually appealing format.
Bullish Single Candlestick Patterns
A single candlestick is like the battle report for a specific time frame, showing who won between buyers and sellers. For example, a 5-minute candle is made up of five 1-minute skirmishes. If it closes bullish, it means the bulls claimed victory.
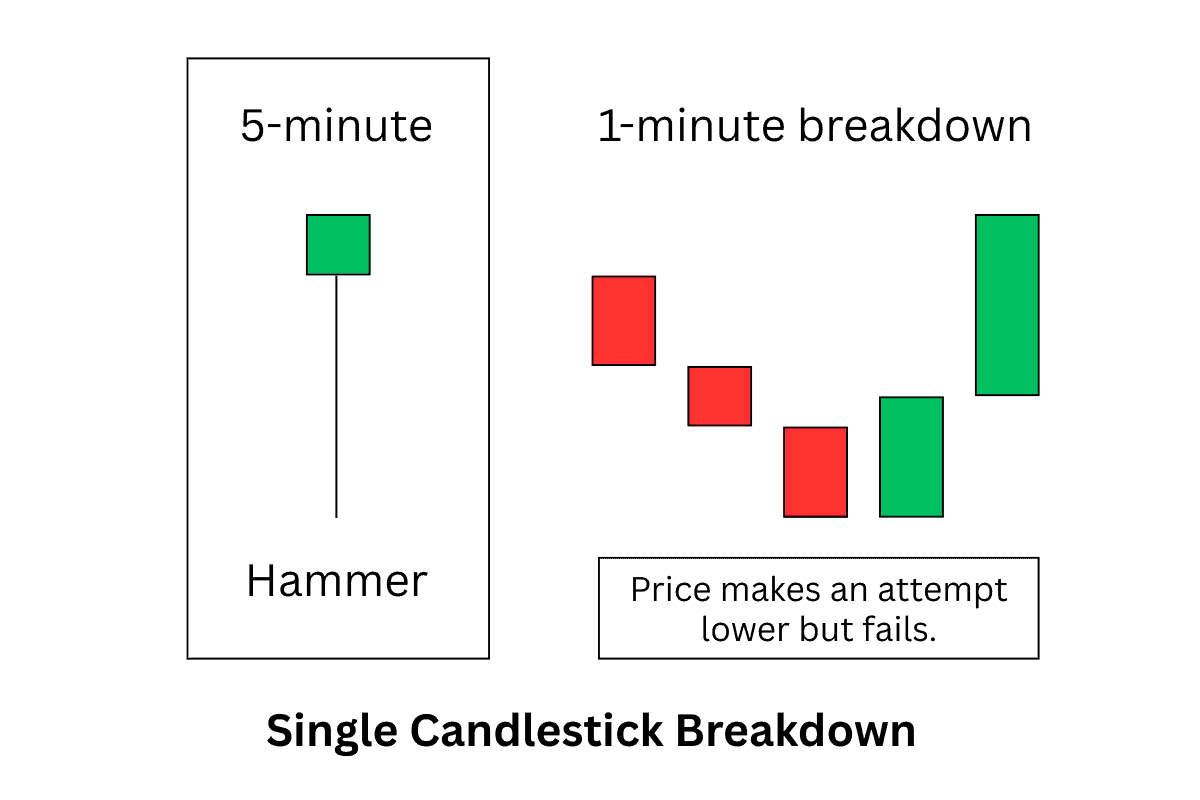
This condensed view makes it easier to spot potential reversals or continuation points, especially when combined with context like support, resistance, or volume.
Here are the top bullish single candlestick patterns traders use.
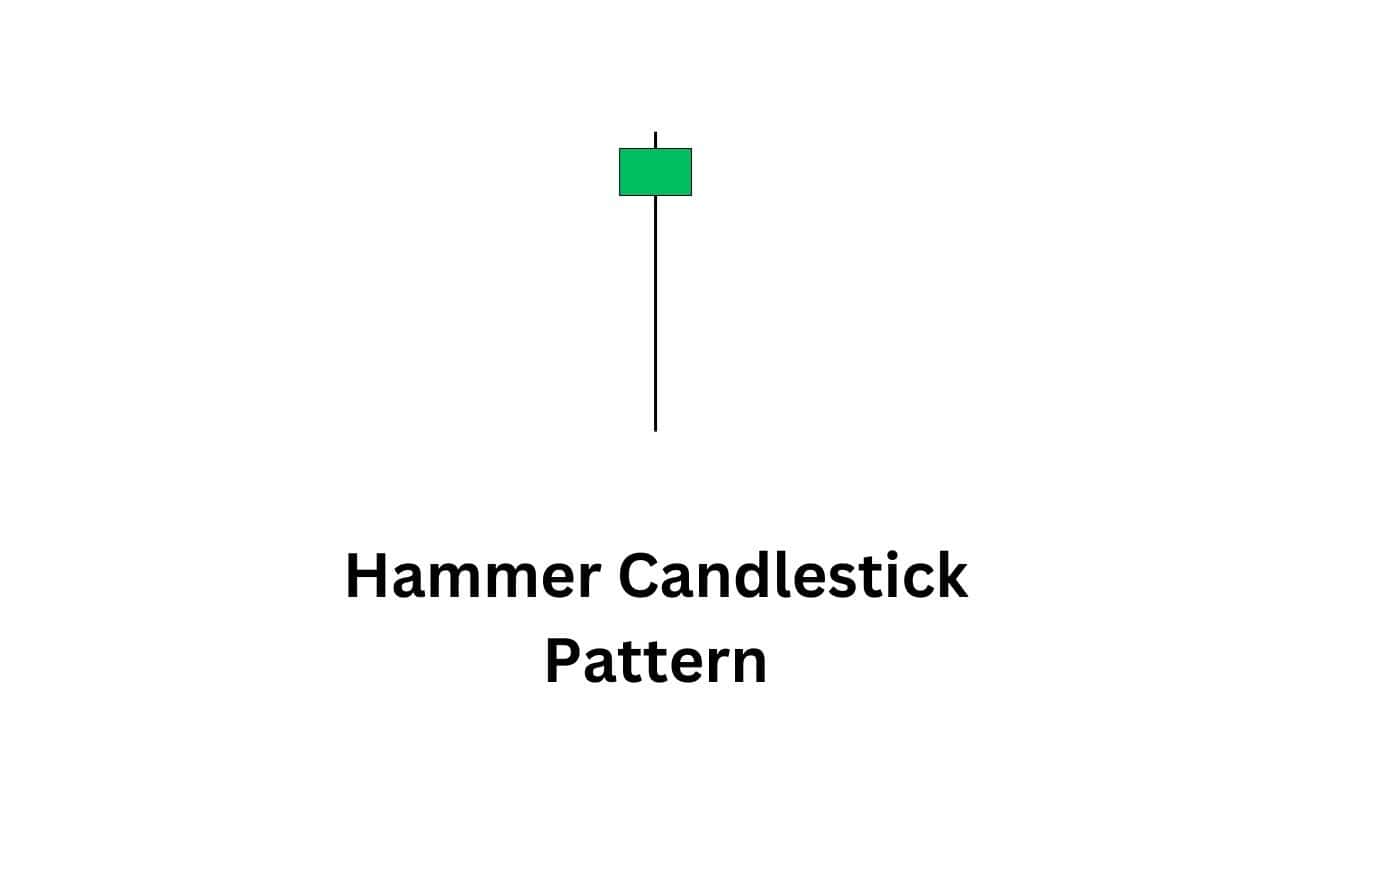
1. Hammer Candlestick
Here’s how to identify this candlestick pattern:
The hammer candlestick pattern is a single candle bullish reversal pattern with a small body at the upper end and a long lower wick. The downside tail is typically twice the size of the body, if not larger. The candle’s body can be either green or red, with green carrying more weight. The hammer also has little to no upper wick at the top.
Here’s how it looks on a price chart.
Why this candlestick pattern matters:
The hammer usually occurs after a downtrend and signals a possible reversal higher. The long lower wick shows that sellers initially drove prices lower but were later overpowered by buyers who pushed prices back up.
The pattern is significant if it forms at a support level, as it indicates shifting sentiment among investors.
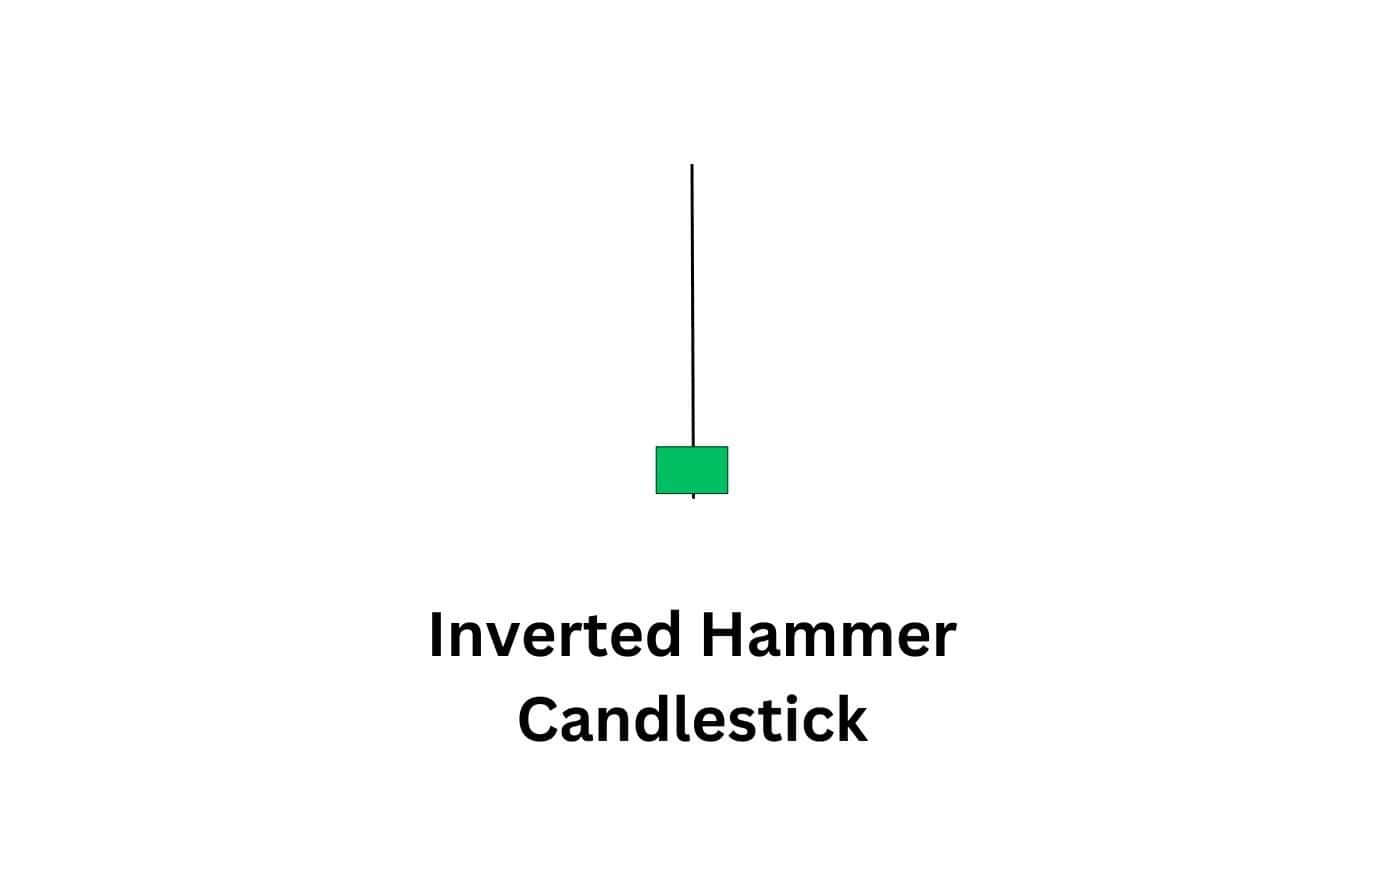
2. Inverted Hammer Candlestick
Here’s how to identify this candlestick pattern:
The inverted hammer candlestick pattern is a single candle pattern that typically forms at the bottom of a downtrend. It has a small body at the bottom and a large upper wick that is at least twice the size of the candle’s body. The candlestick usually has little to no lower wick.
Here’s how it looks on a price chart.
Why this candlestick pattern matters:
The candle starts off with a strong rally suggesting that the sellers are losing momentum. Then, the sellers try to push prices back down, but are unsuccessful in driving it below the opening low leaving them exhausted. This opens the door for buyers to step in and push the prices higher.
The pattern signals a potential bullish reversal if it occurs at a support level and can be confirmed by a bullish candle that follows it.
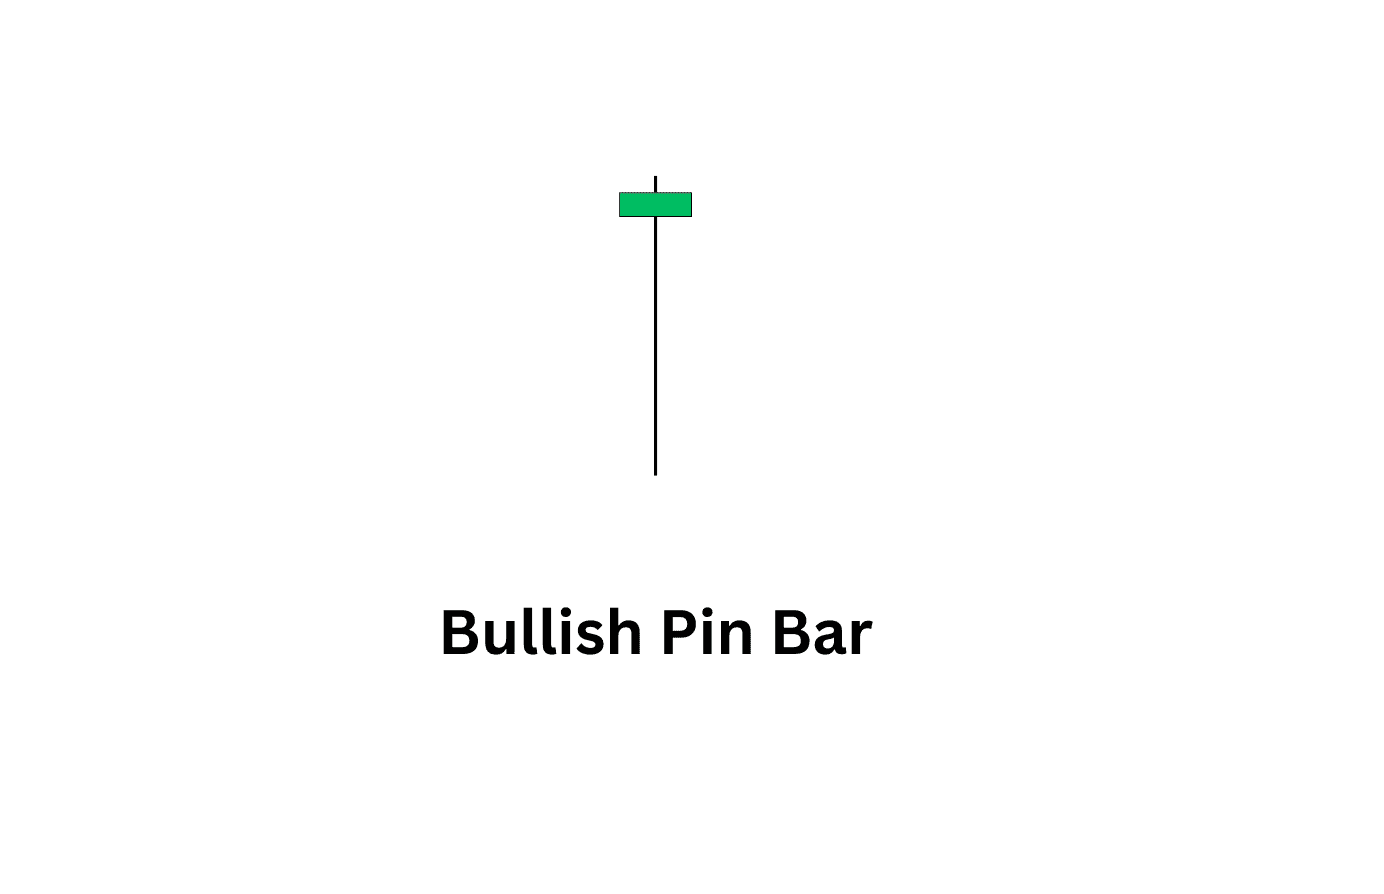
3. Bullish Pin Bar
Here’s how to identify this candlestick pattern:
The bullish pin bar is a single candlestick pattern with a small body, which is bigger than that of a dragonfly doji. The pin bar candlestick indicates that sellers initially pushed prices lower, but buyers stepped in and drove prices higher almost to the point where the candle opened. You can think of the bull pin bar as a hammer with a super long tail.
Why this candlestick pattern matters:
This pin bar candlestick chart pattern matters because it reveals buyers are about to control the price. The pattern is more significant if it appears at the end of a downtrend or a support level since it signals that the sellers are losing momentum. It acts as a signal to traders that an uptrend could be about to begin. However, you should not trade this candlestick in isolation; always confirm it with the following candles.
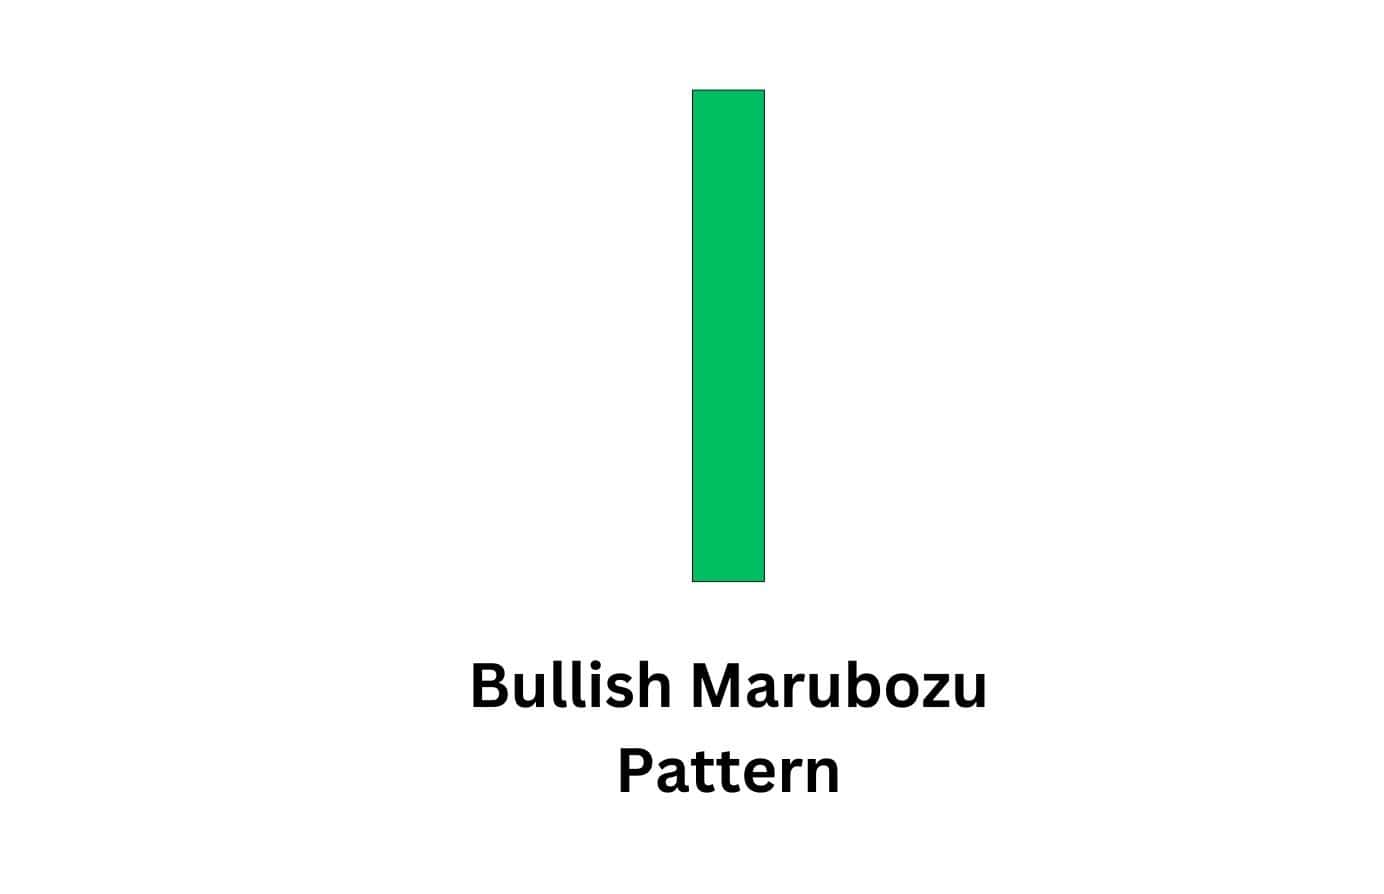
4. Bullish Marubozu
Here’s how to identify this candlestick pattern:
A bullish Marubozu pattern is made up of a single candle with no wicks or very small ones. The candle’s opening is usually the lowest price, while its closing is typically at the highest price. Therefore, this pattern is composed of a long bullish candle.
Why this candlestick pattern matters:
This pattern is crucial because it demonstrates significant bullish momentum. It usually forms after a consolidation period or at the beginning of an uptrend. It indicates that buyers have confidence in the market, pushing prices higher.
5. Bullish Spinning Top
Here’s how to identify this candlestick pattern:
The bullish spinning top candlestick pattern consists of a single candle with a small real body and long shadows at the top and bottom. The pattern indicates a balance between buyers and sellers. However, its bullish close suggests that buyers might be gaining an advantage.
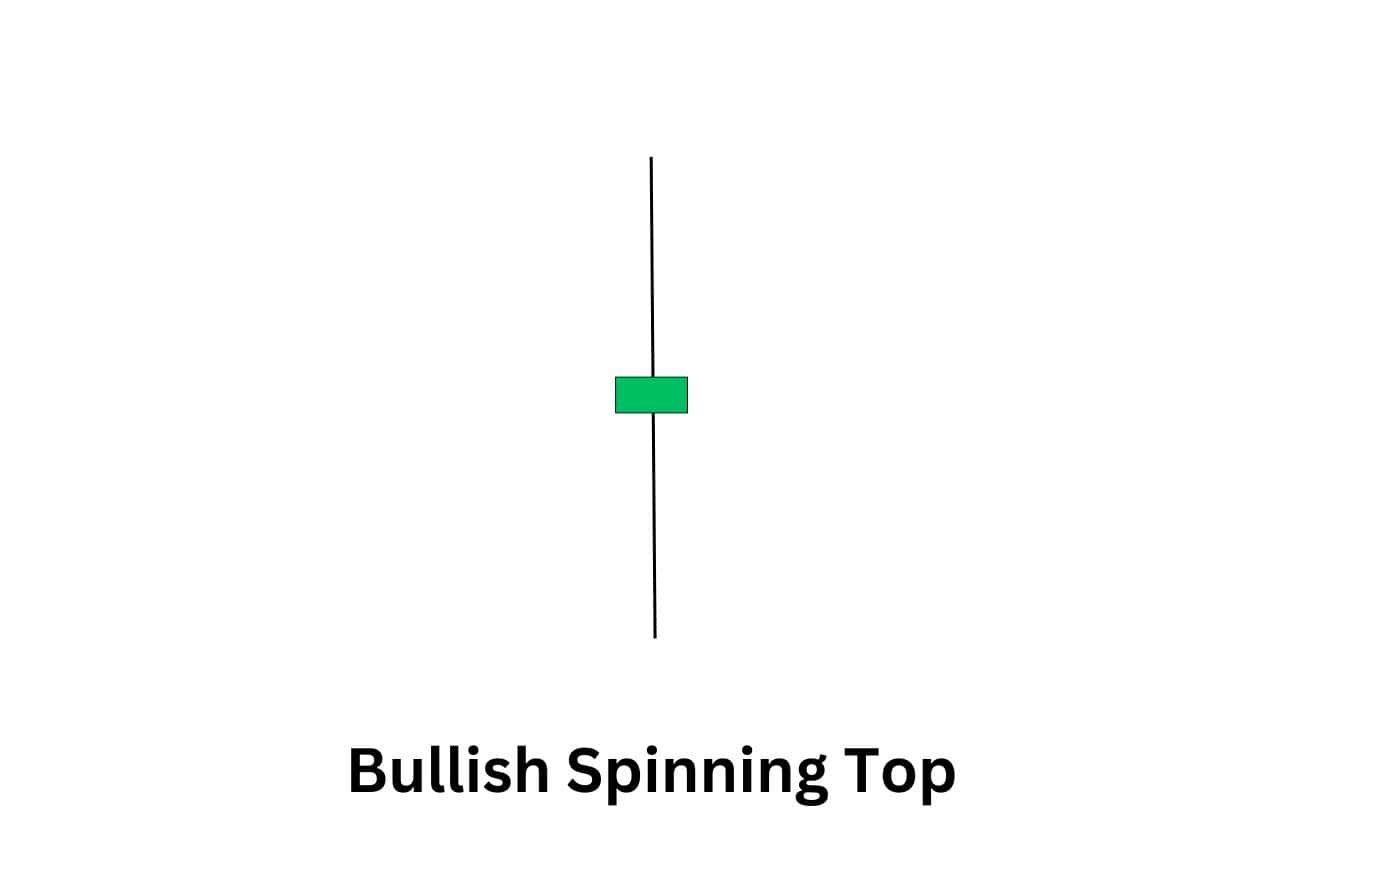
Why this candlestick pattern matters:
The pattern usually indicates a pause in the current downtrend and the potential for a reversal higher. However, it is not the most robust bullish reversal pattern and is considered a subtle clue that an uptrend might begin. This pattern should always be confirmed by the candles that follow it.
6. Dragonfly Doji
Here’s how to identify this candlestick pattern:
The dragonfly doji is a single candlestick pattern with a small body and a long lower shadow. It forms when the opening and closing prices are very close. The doji also shows that prices fell lower during the session before recovering, heading higher to close near the opening price.
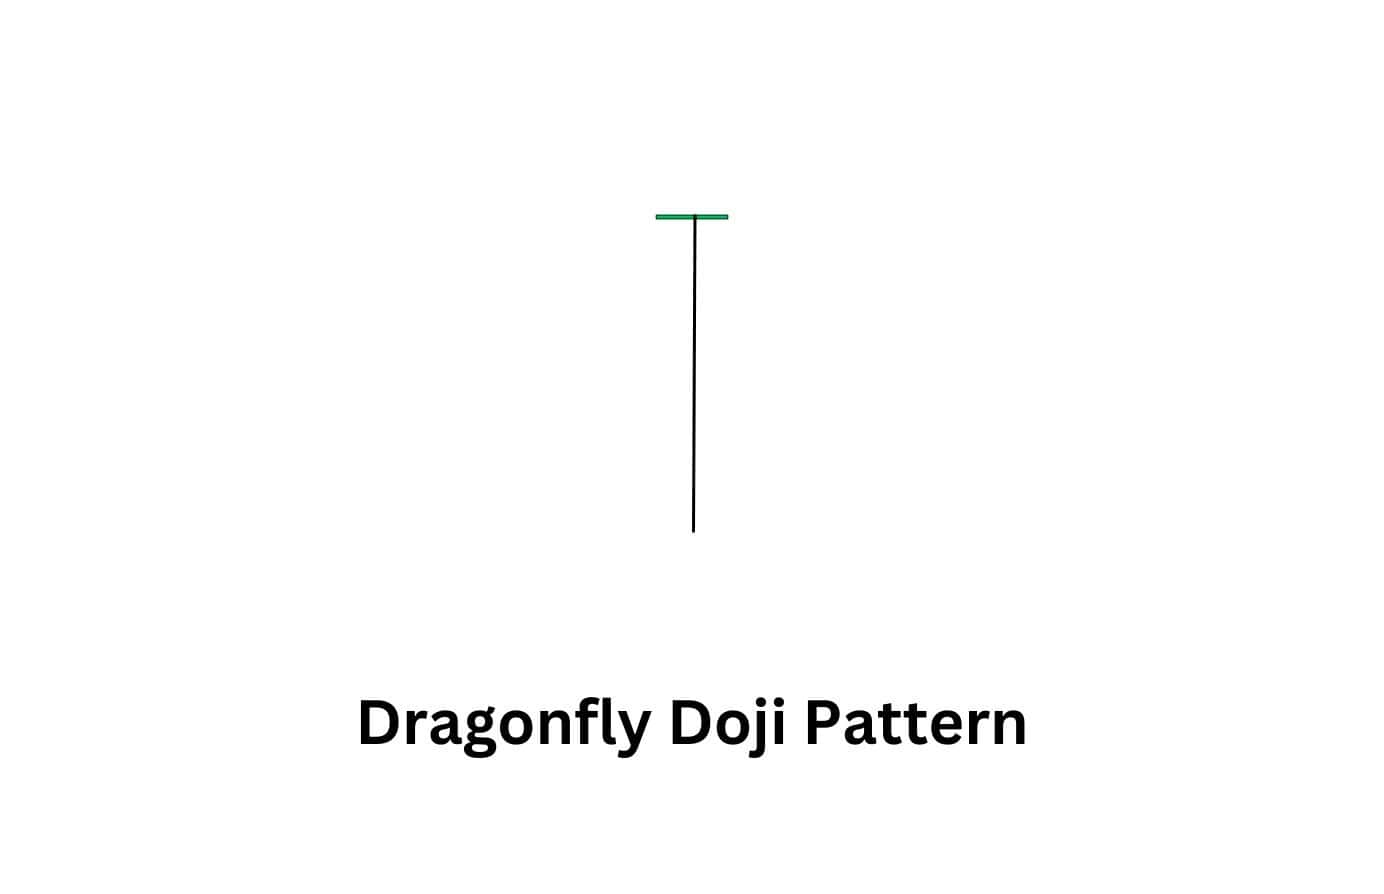
Why this candlestick pattern matters:
The candlestick pattern signals that sellers pushed the price much lower before buyers stepped in and pushed it higher to close near the opening price. When the pattern occurs in a downtrend or near a support level, it usually signals that a bullish trend could be starting.
Bullish Dual Candlestick Patterns
A dual candlestick pattern is like watching two rounds of a market battle back to back, where the second round often flips the script. The first candle sets the stage by showing seller dominance, while the second shows a shift in momentum toward the buyers.
This two-step sequence gives traders a clearer confirmation of potential reversals or continuations compared to single candles alone.
This paired view can boost confidence in trade setups, especially when the pattern appears at key support levels or aligns with indicators such as volume spikes or RSI divergence.
Here are the top double candlestick patterns.
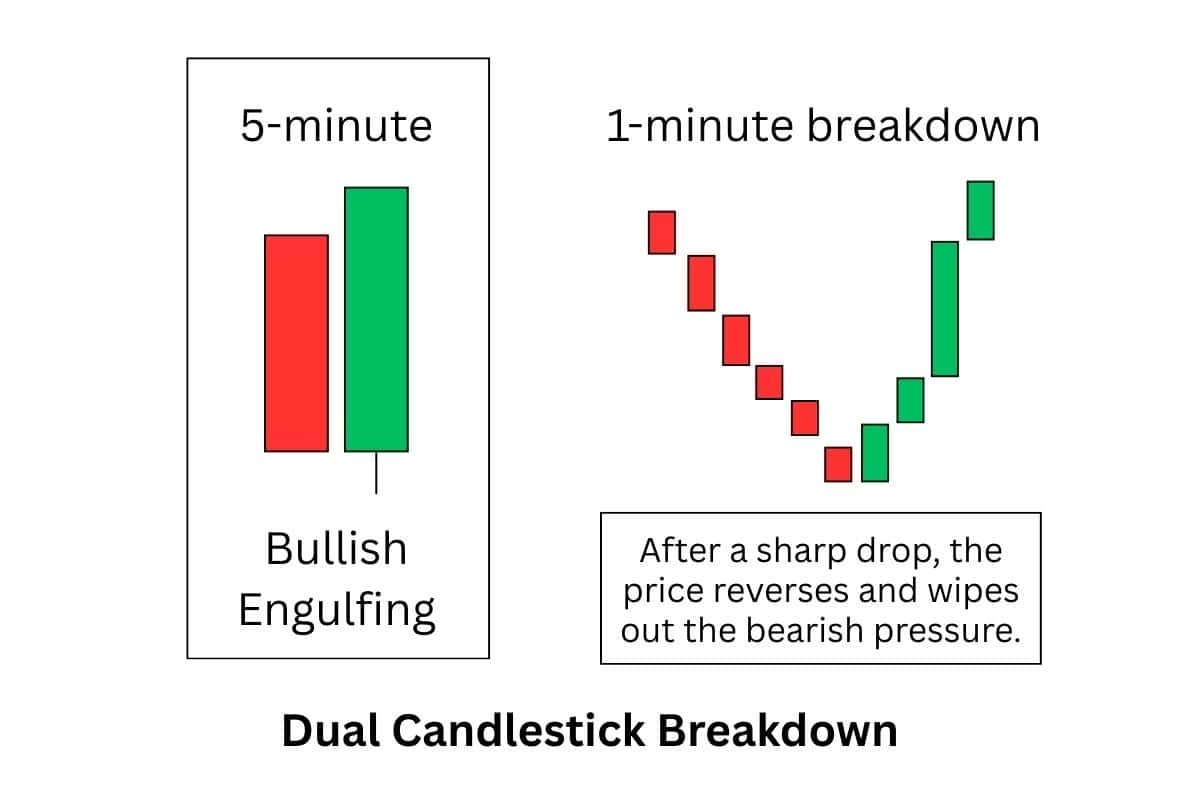
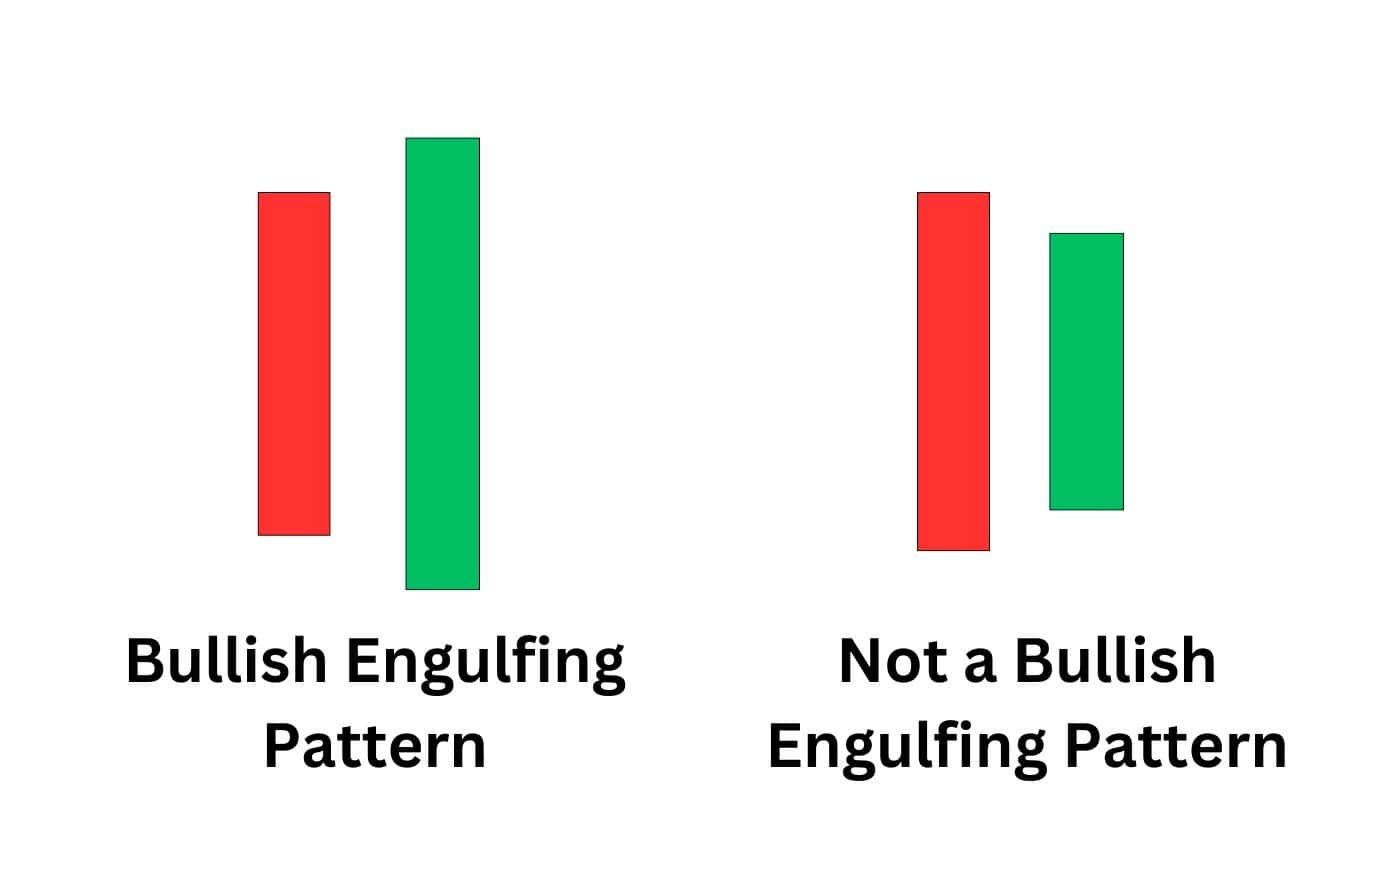
7. Bullish Engulfing Pattern
Here’s how to identify this candlestick pattern:
The bullish engulfing candlestick pattern is a two-candle formation. The first candle is a bearish (red), meaning the price closes lower than it opened. The second candle is bullish (green), with the price closing higher than it opened. This candle should also completely engulf the body of the previous bearish candle.
The pattern bullish engulfing looks like this on a candlestick chart.
Why this candlestick pattern matters:
The bullish engulfing pattern signals a potential reversal from a downtrend to an uptrend. It usually forms after a prolonged downtrend. The sudden and large green candle signals that sellers are losing control and that buyers appear to be taking over.
This pattern is more reliable if it occurs at a significant support level.
8. Piercing Line Pattern
Here’s how to identify this candlestick pattern:
The piercing line pattern is made up of two candles. The first candle is bearish and followed by a bullish candle. For this pattern to be validated, the bullish candle must open below the closing price of the bearish candle and must close above the halfway point of the body of the bearish candle. This pattern usually appears after a downtrend.

Why this candlestick pattern matters:
The second candle gaps lower on the open, only to rebound higher. So, the gap lower and subsequent rally shows the bears getting exhausted on the open thinking that the bear trend will continue only for buyers to rush in and overwhelm the sellers.
The pattern marks the end of a downtrend as it signals a shift from bearish to bullish momentum. Traders consider this pattern as a signal of a potential upward trend.
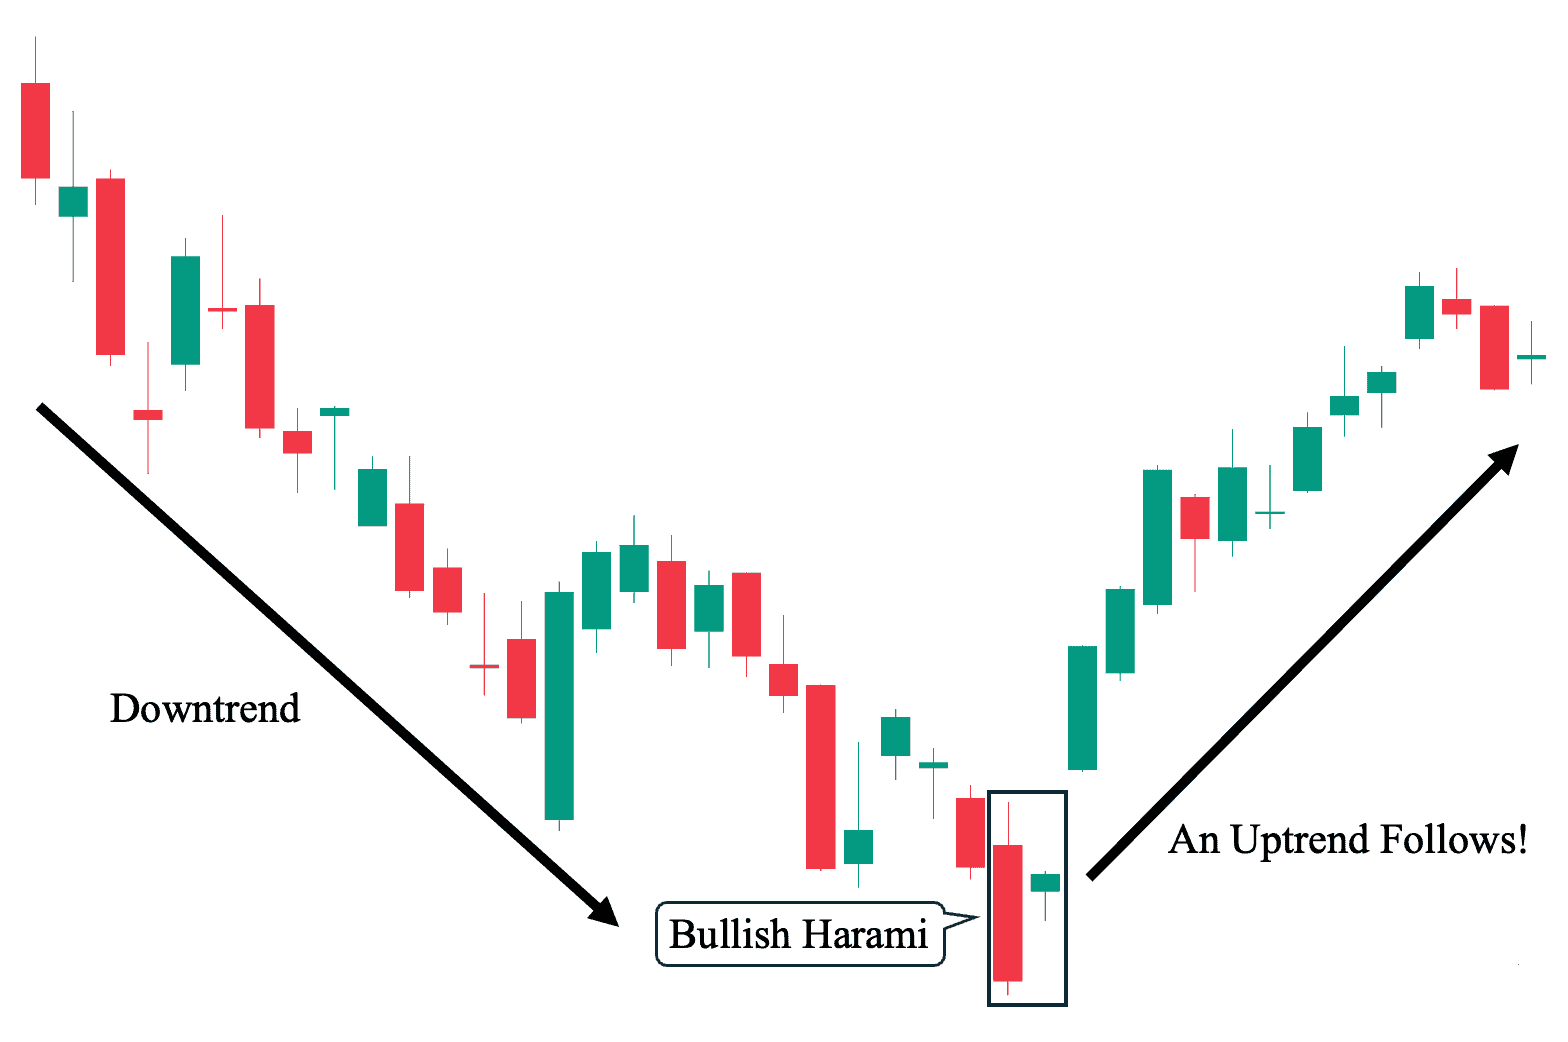
9. Bullish Harami Pattern
Here’s how to identify this candlestick pattern:
The bullish harami pattern typically occurs in a downtrend and consists of two candles. The first candle is a large bearish candle that is followed by a small bullish candle, which forms within the body of the first candle. The second candle forms an inside bar, indicating some hesitancy in the market.
There is a variation of this pattern called the bullish harami cross. This variation includes a doji as the second candle in the formation and can signal a stronger pattern.
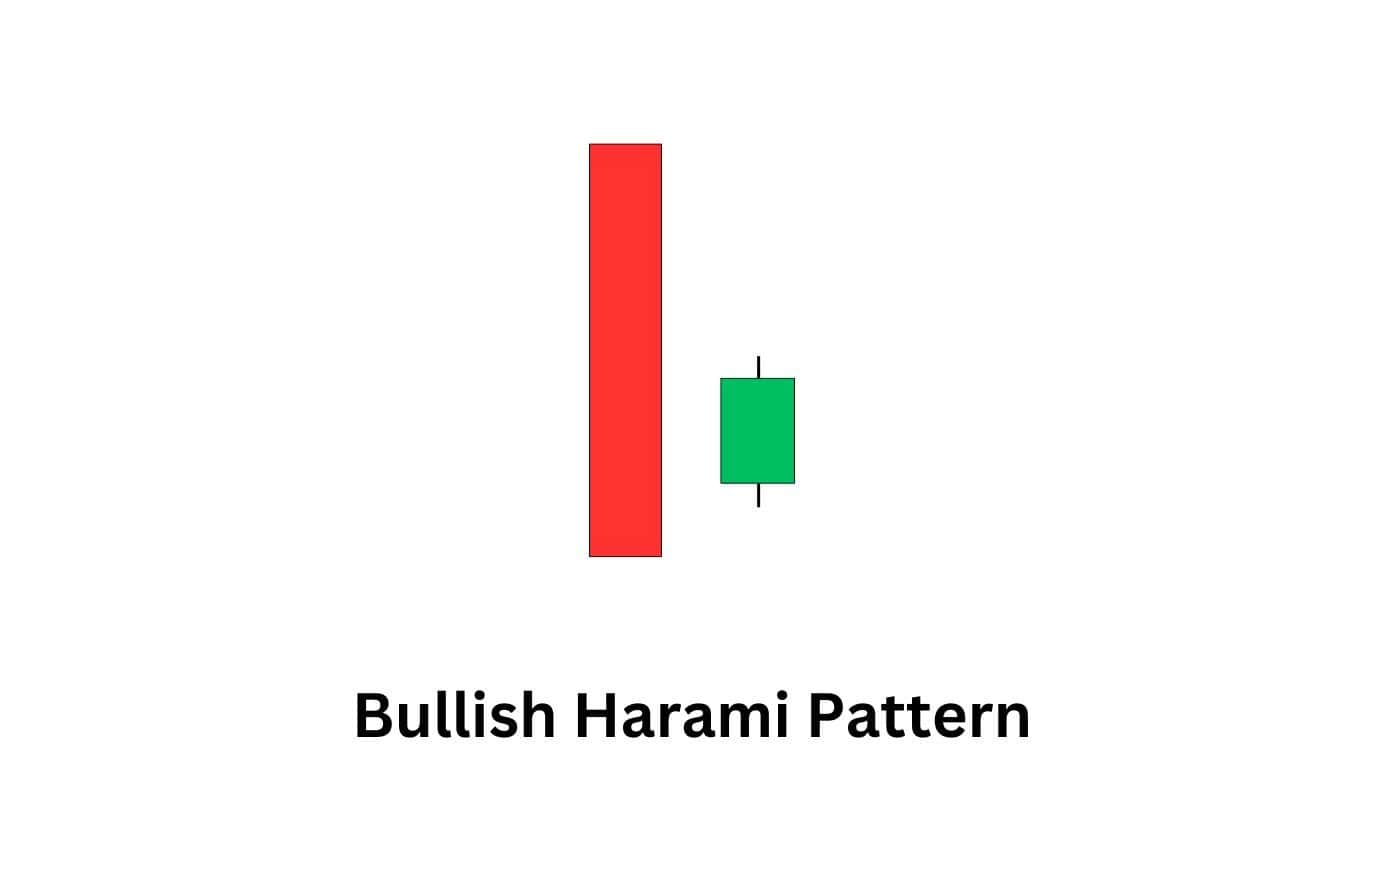
Why this candlestick pattern matters:
The candlestick pattern is crucial because traders use it as an early warning sign that the downtrend could be about to reverse. The green candle gaps higher, but fails to follow through to the upside or downside. In essence, there was strength behind it as it gapped higher, but then both buyers and sellers went absent creating a smaller body. Do not use this pattern in isolation; instead, combine it with other bullish signals, such as a following bullish candle.
10. Tweezer Bottoms Pattern
Here’s how to identify this candlestick pattern:
The tweezer bottom candlestick pattern consists of two candles with similar bottoms. The first candle is usually bearish, while the second is bullish. The first bearish candle shows selling pressure, while the second bullish candle shows buyers have entered the market. The tweezer bottoms pattern typically forms at the end of a downtrend.
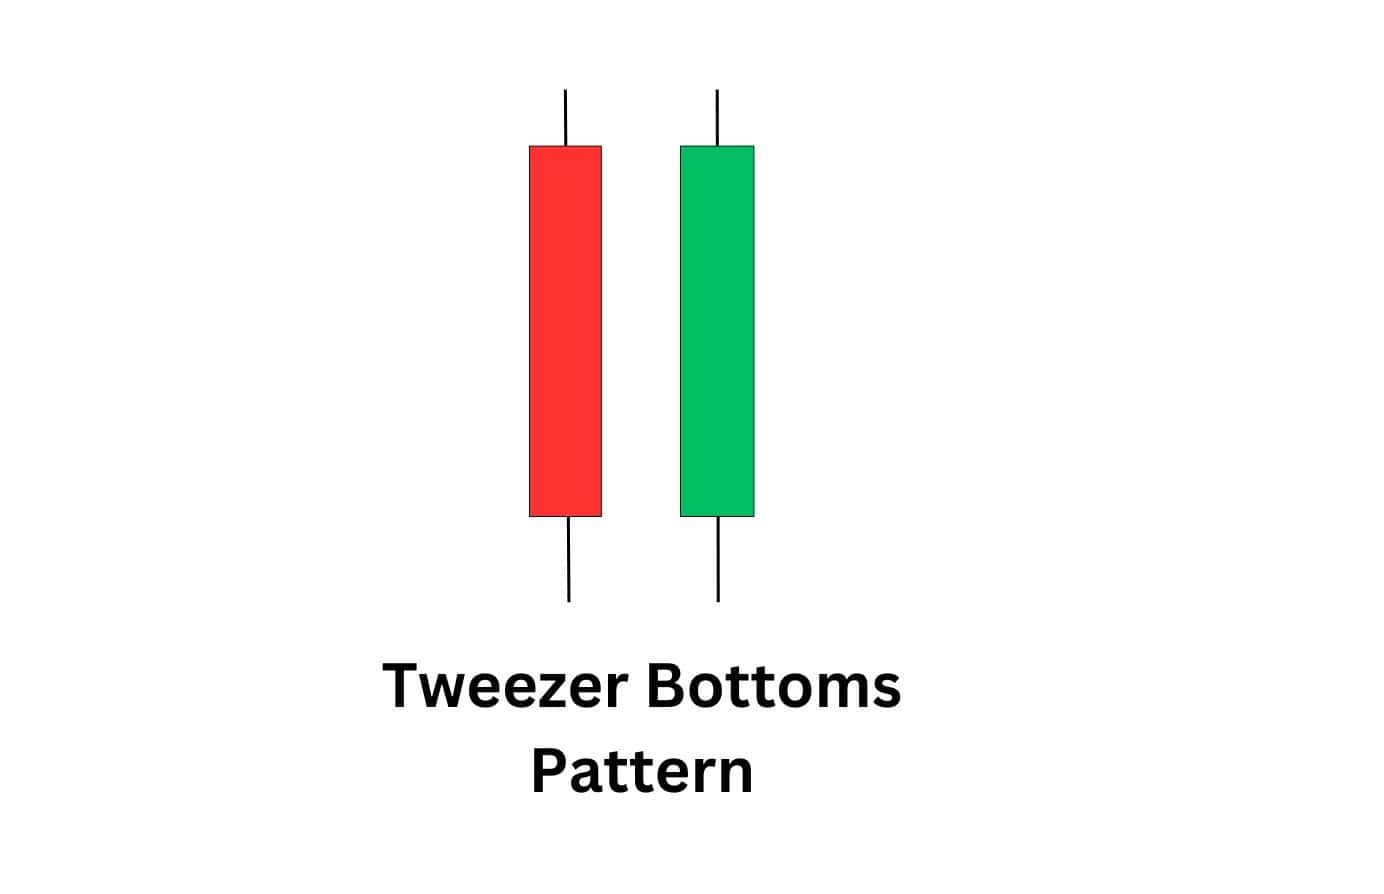
Why this candlestick pattern matters:
If the tweezer bottoms pattern occurs at a crucial support level or at the bottom of a downtrend, it is regarded as a bullish reversal indicator. The pattern shows that buyers and sellers are fighting to control price. Given that both candles rejected the same price at the bottom, this indicates a robust support level. Traders can use this as an entry signal for bullish trades.
11. Bullish Belt Hold Pattern
Here’s how to identify this candlestick pattern:
This pattern consists of one candle that occurs during a downtrend. It is a bullish candle with a long body and little to no lower shadow. The candle typically opens at the session’s low and closes robustly higher. This shows strong bullish momentum.
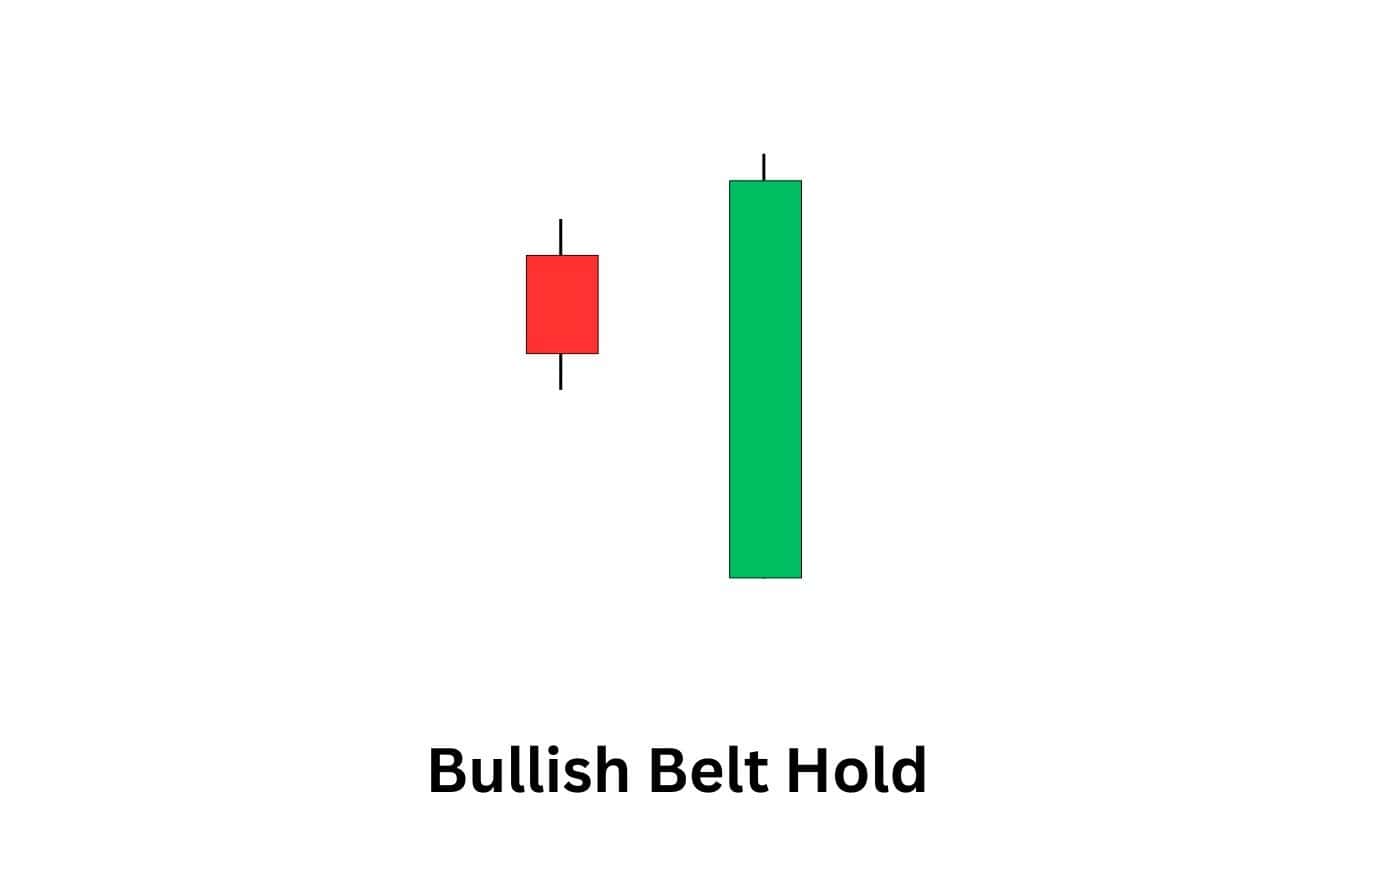
Why this candlestick pattern matters:
The bullish belt hold pattern demonstrates that buyers controlled prices from the beginning to the end of the session, pushing prices higher. It is regarded as an early warning sign that the bearish trend may end and a bullish trend may begin.
12. Bullish Counterattack Line
Here’s how to identify this candlestick pattern:
This pattern comprises two candlesticks. The first candle is bearish and extends the downtrend. The second candle is bullish and opens much lower but closes at or near the closing price of the first candle. This creates a counterattack against the bearish pressure or momentum.
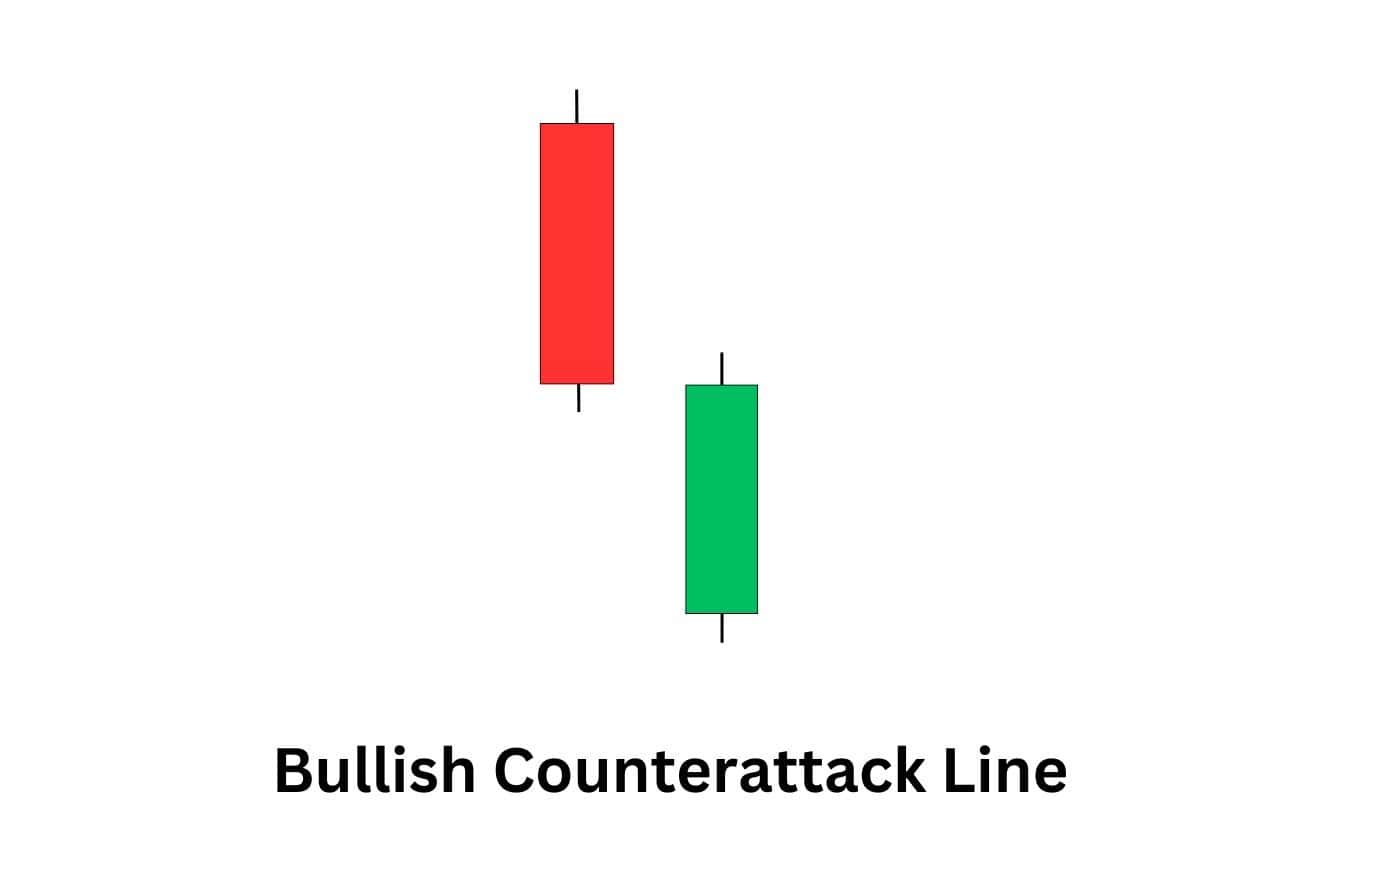
Why this candlestick pattern matters:
The bullish counterattack line pattern matters because it shows that buyers and sellers are fighting to control the price. It also signals that buyers have boldly stepped into the market and are pushing prices higher. The pattern often leads to a price rebound, and traders use it to identify market rebound opportunities.
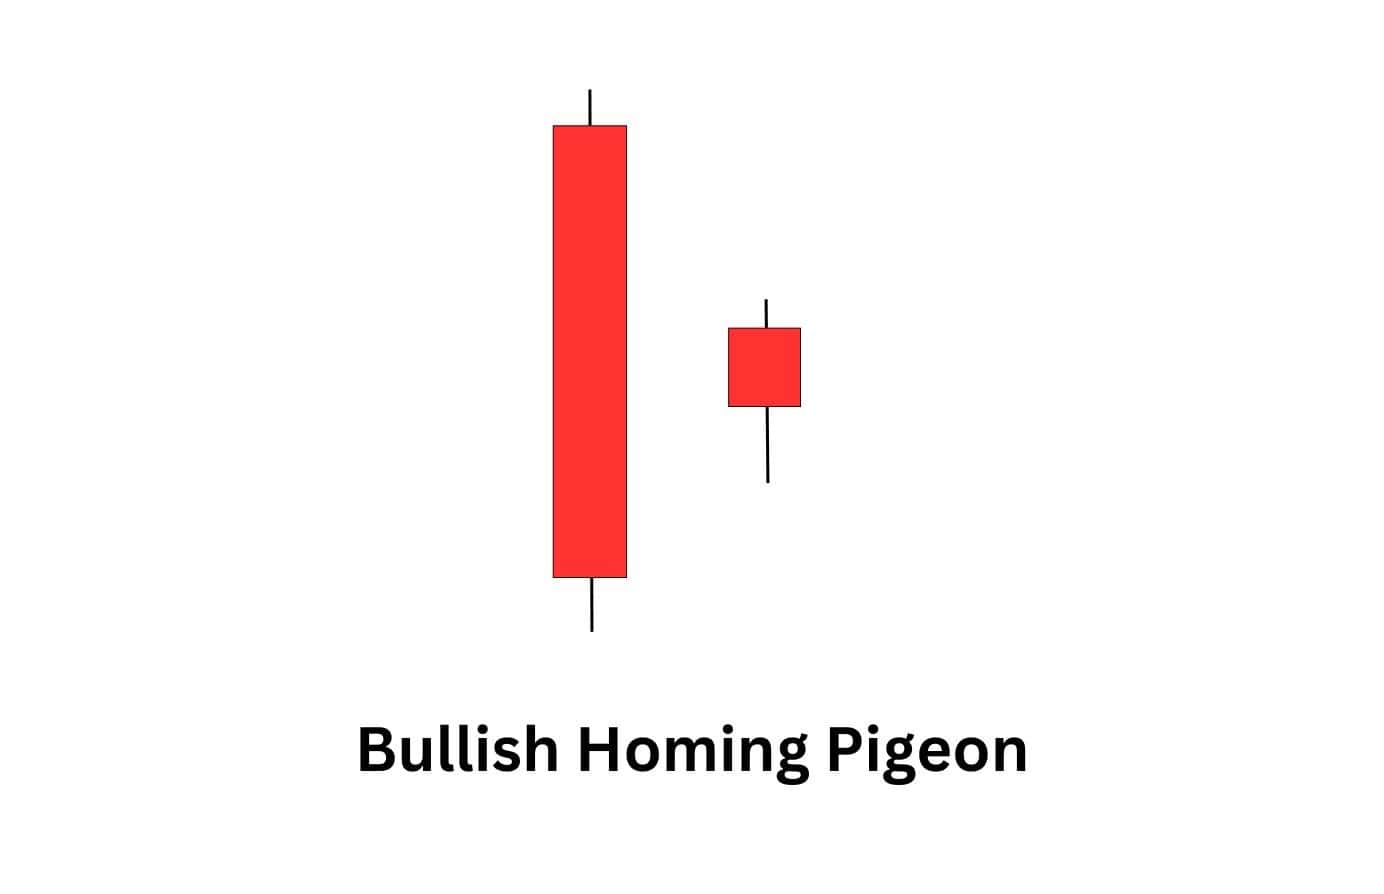
13. Bullish Homing Pigeon
Here’s how to identify this candlestick pattern:
The Bullish Homing Pigeon is a two-candle pattern. The first candle is a larger bearish one, followed by a smaller bearish candle that is entirely inside the range of the first one. The second candle demonstrates market indecision or weakening bearish momentum. As the bearish sentiment reduces, this could signal the beginning of a new uptrend.
Why this candlestick pattern matters:
This candlestick pattern is crucial since it shows that the bearish momentum could dissipate, and an upward reversal could be underway. Traders regard this pattern as an indicator that an upward trend could begin, but it must be confirmed with other indicators, such as volume indicators.
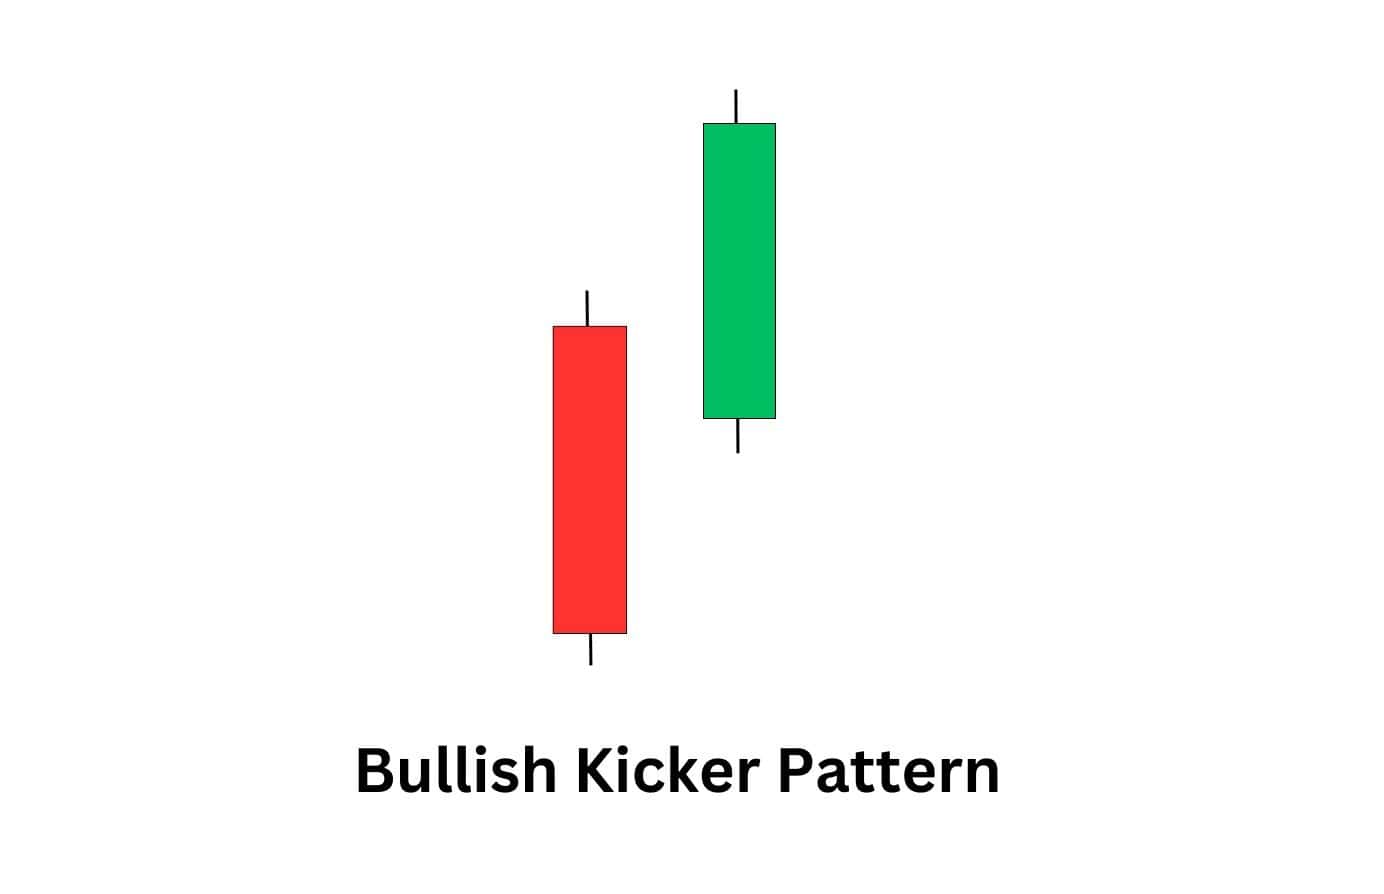
14. Bullish Kicker
Here’s how to identify this candlestick pattern:
The bullish kicker is a two-candle pattern that forms after a downtrend. The first candle is bearish and continues the downward trend. The second candle is bullish and usually gaps above the previous candle’s close, demonstrating a sharp reversal.
Why this candlestick pattern matters:
The pattern demonstrates a sudden shift in the market sentiment from bearish to bullish as buyers forcefully entered the market. It is regarded as a robust bullish signal. Traders often take bullish (long) trades following this pattern as it suggests a new uptrend could be underway.
Bullish Triple Candlestick Patterns
A triple candlestick pattern is like watching a battle unfold over three decisive rounds, where momentum steadily shifts toward the buyers. These formations can signal powerful reversals or trend continuations, especially when they appear at major support zones or align with other bullish indicators.
Here are the top bullish triple candlestick patterns.
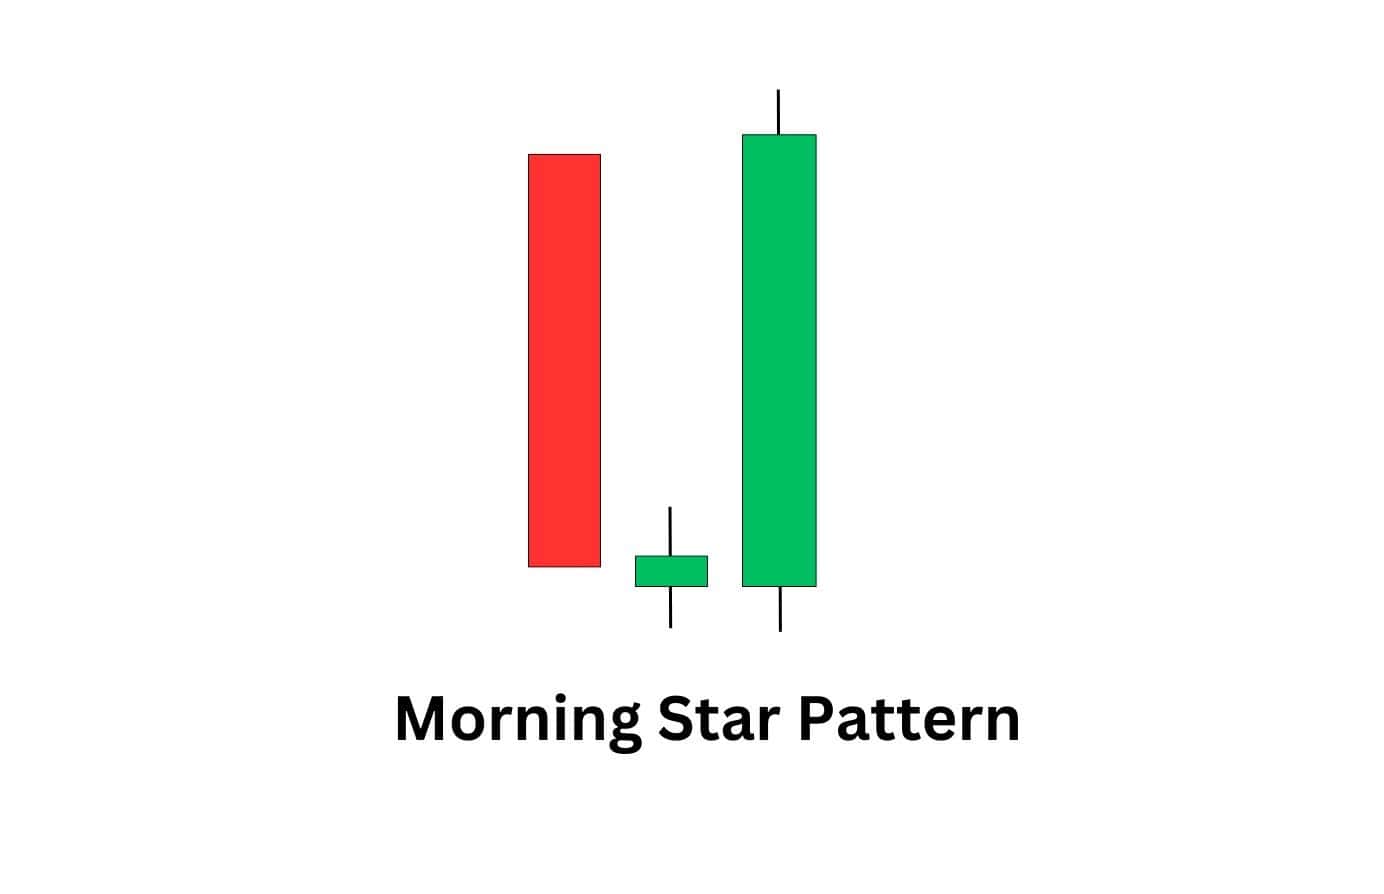
15. Morning Star Pattern
Here’s how to identify this candlestick pattern:
The morning star pattern is made up of three candles. The first candle is bearish and quite long, indicating robust selling pressure. The second candle is indecisive and has a small body, such as a doji or hammer candle. The third candle is bullish and must close at least above the midway point of the first candle’s body.
Why this candlestick pattern matters:
The pattern morning star is regarded as a robust signal of an upward trend, especially if it forms at a key support level. The three candles signal the exhaustion of the previous downtrend, as evidenced by the long bearish candle indicating maximum selling pressure. This pattern is usually regarded as a robust signal of a potential rally.
16. Three White Soldiers Pattern
Here’s how to identify this candlestick pattern:
The three white soldiers candlestick pattern is composed of three consecutive bullish candles. It typically forms after a downtrend. Each bullish candle opens within the previous candle’s body but closes higher, showing consistent upward momentum. The candles should have minimal or no wicks, which signals robust buying pressure.
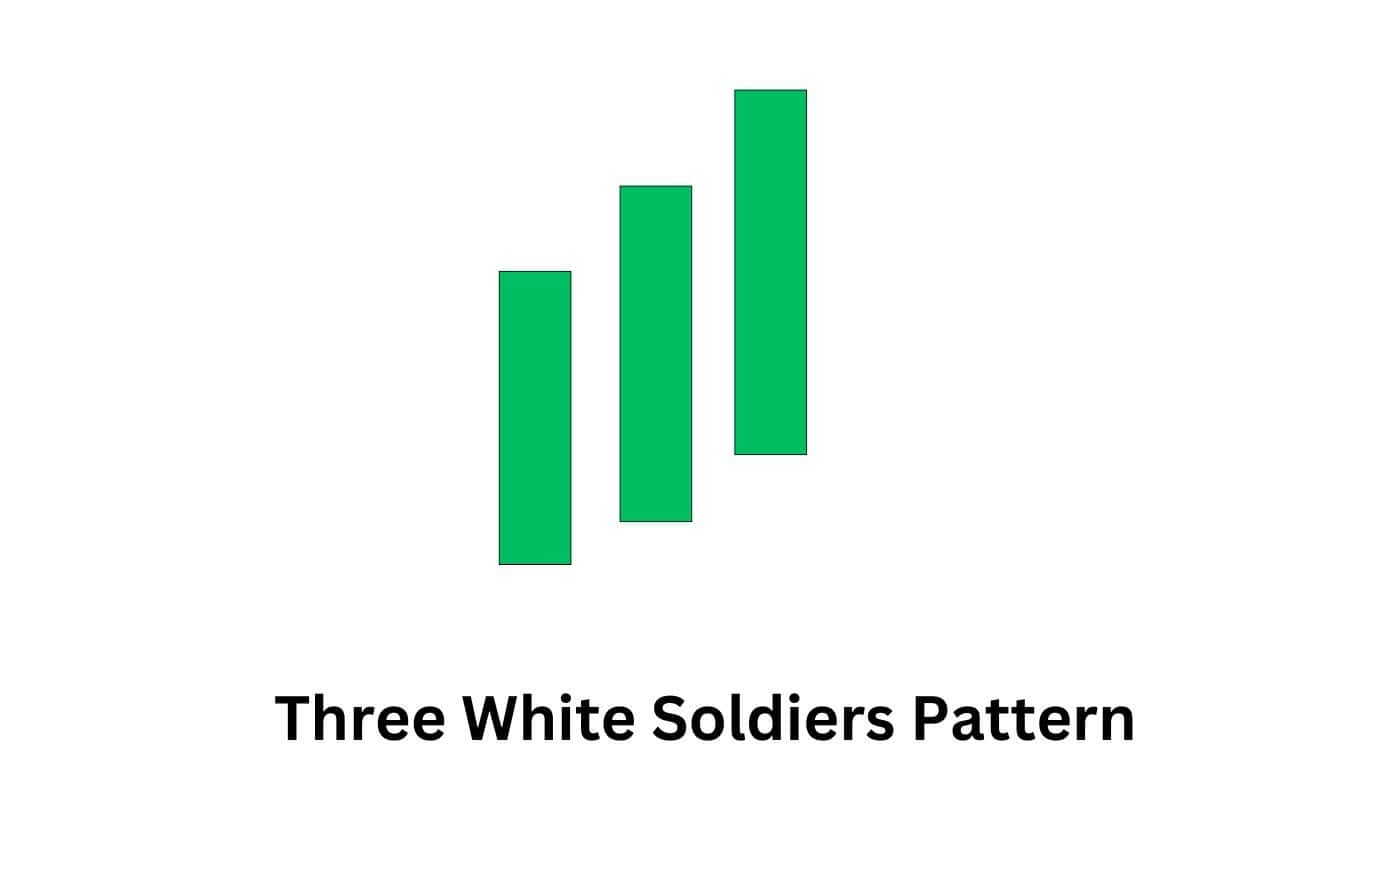
Why this candlestick pattern matters:
The white soldiers pattern is crucial since it indicates a shift in market sentiment from bearish to bullish, primarily if it occurs at the end of a downtrend. The pattern is a reliable indicator of bullish momentum since buyers are gaining momentum. Due to the bullish momentum, traders use this pattern to scout for buying opportunities.
17. Three Inside Up
Here’s how to identify this candlestick pattern:
The Three Inside Up candlestick pattern can be easily identified: It consists of three candles, the first of which is a long, bearish candle. The second candle is a small bullish candle contained within the range of the first candle. Finally, the third candle is a robust bullish candle that closes above the opening price of the first candle.
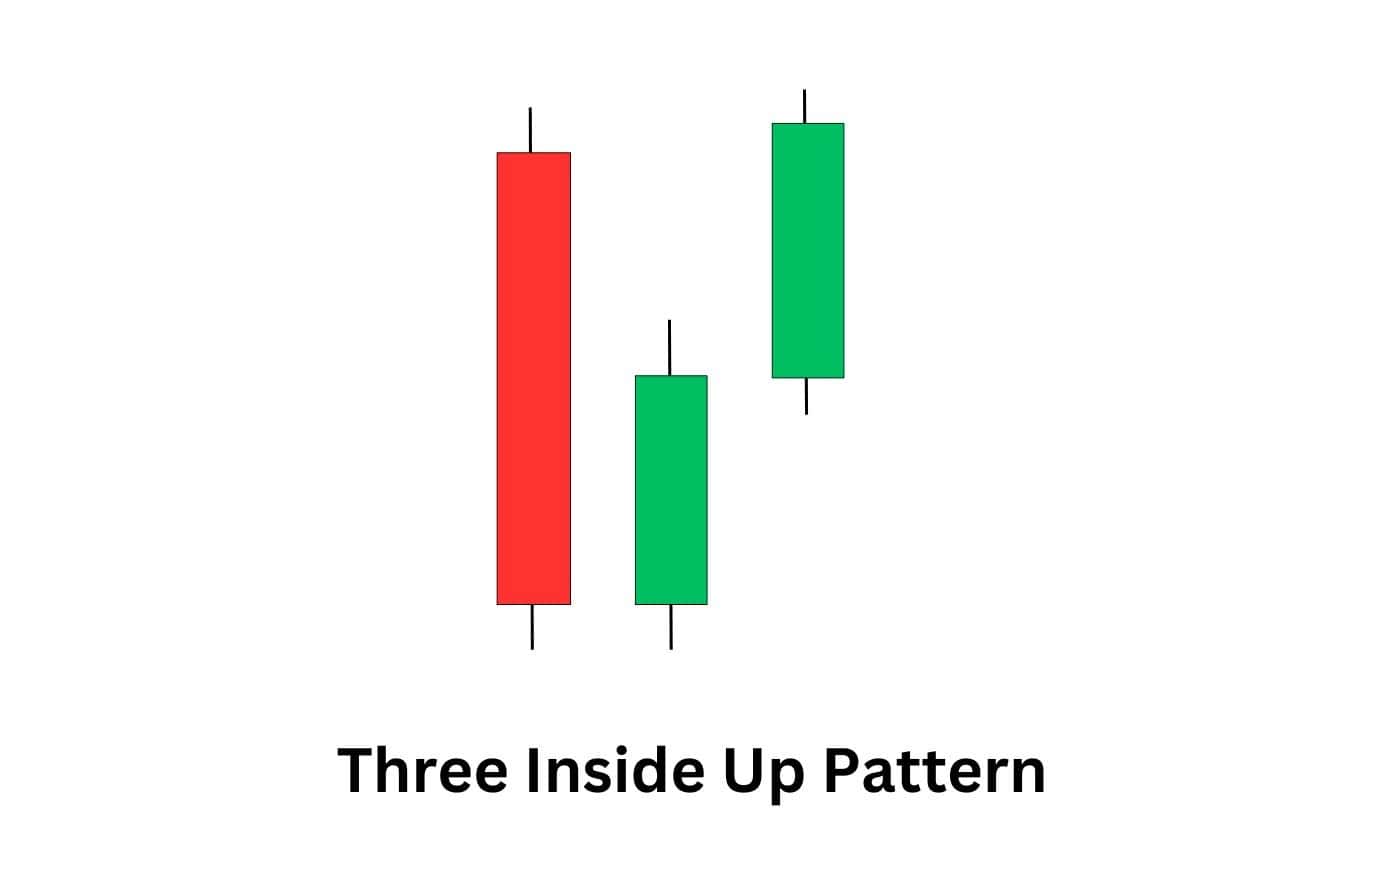
Why this candlestick pattern matters:
This candlestick pattern is crucial because it shows that price control is shifting gradually from sellers to buyers. It is considered a reliable indicator of an upcoming uptrend, but confirming it with other signals, such as the follow-up bullish candles, is always prudent. Traders can use it to time their long trades.
18. Three Outside Up
Here’s how to identify this candlestick pattern:
This pattern comprises three candles and is typically formed during a downtrend. The first candle is usually bearish. The second candle is a long, bullish candle that engulfs the entire body of the first candle. The third candle is bullish and tends to close higher than the second.
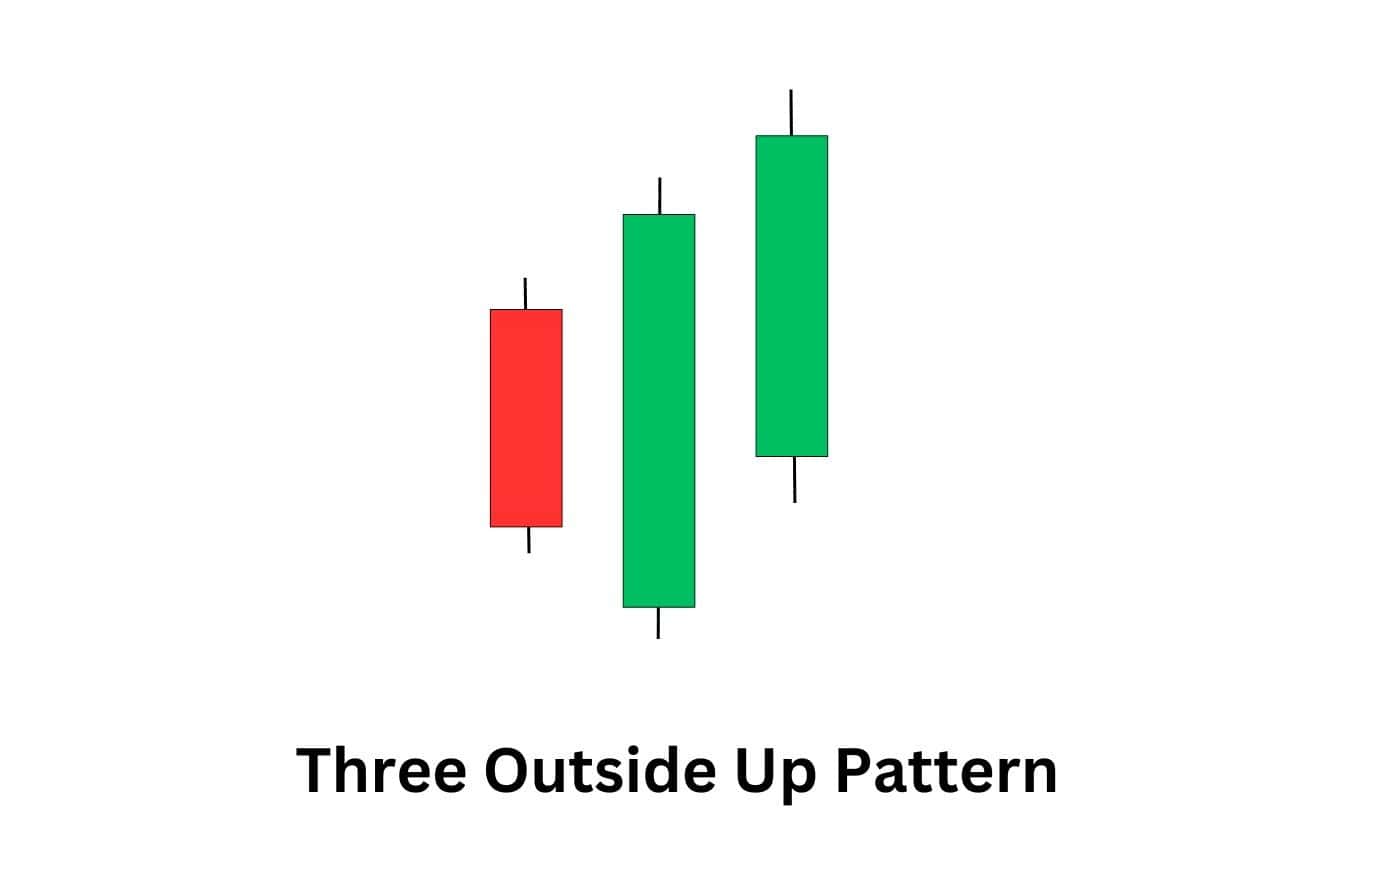
Why this candlestick pattern matters:
The Three Outside Up pattern signals a robust shift from selling to buying pressure. It shows that the momentum has turned bullish, and the downtrend is about to reverse. This pattern is a trusted indicator by traders who use it to open bulling (long) trades.
19. Bullish Abandoned Baby
Here’s how to identify this candlestick pattern:
This is a quite rare candlestick pattern that forms at the end of a downtrend and consists of three candles. The first candle is a long bearish candle followed by a doji candle, which gaps below the first candle’s low. The doji candle has a very small and almost nonexistent body. The third candle is a bullish candle whose opening price is above the doji. The third candle usually closes higher, signalling a sharp reversal.
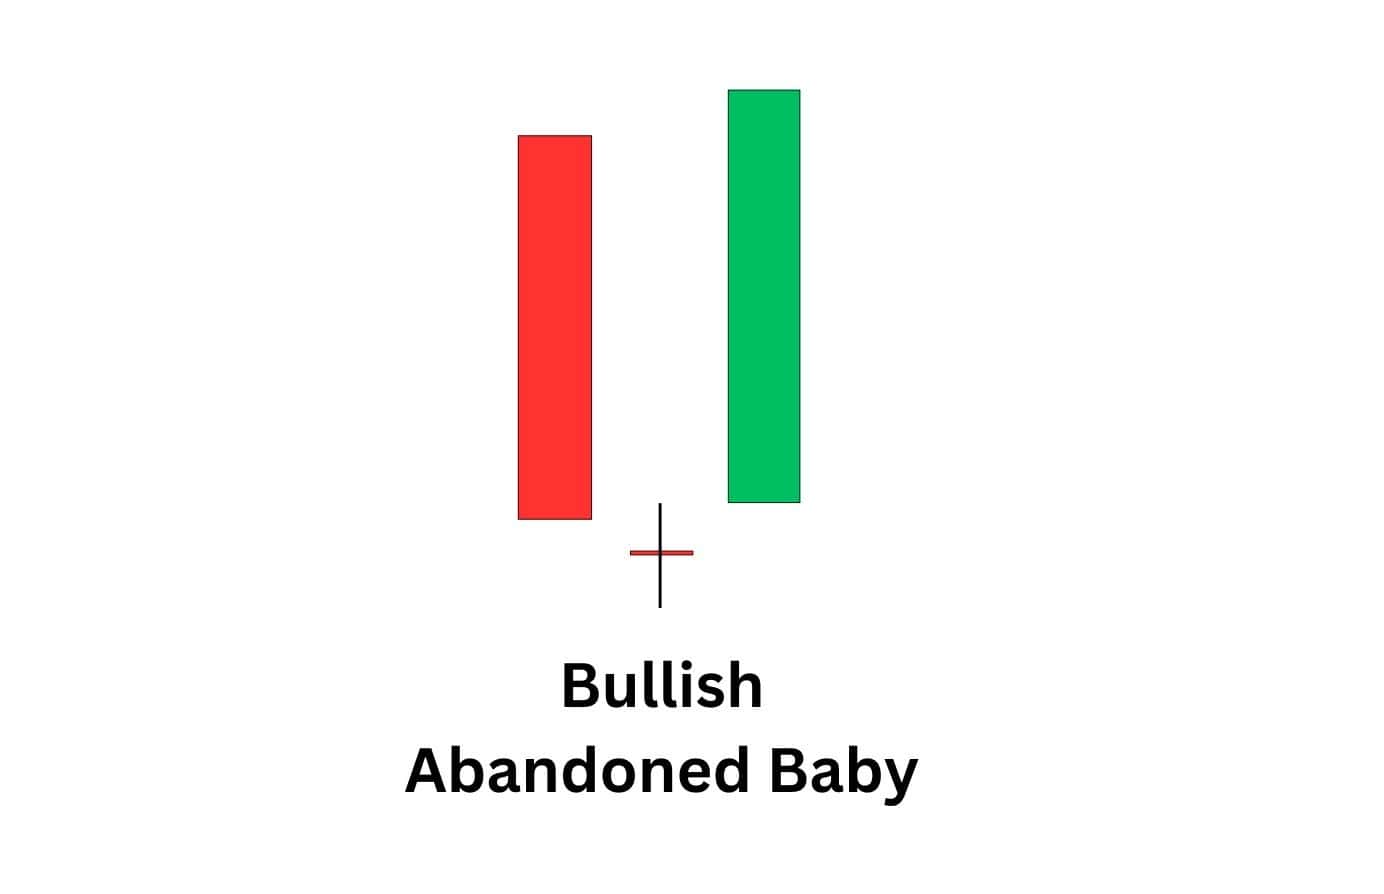
Why this candlestick pattern matters:
The bullish abandoned baby is regarded as a potent bullish reversal indicator. The pattern demonstrates that selling pressure is depleted and that buyers have decisively stepped into the market. The pattern indicates a significant shift in market sentiment, which makes it a robust indicator for a possible upward trend.
20. Bullish Tri-Star
Here’s how to identify this candlestick pattern:
The bullish tri-star is a candlestick pattern composed of three dojis with petite bodies and long shadows. It typically forms during a downtrend and signals a potential reversal higher. The middle candle is usually higher or lower than the other two candles, indicating a transition period.
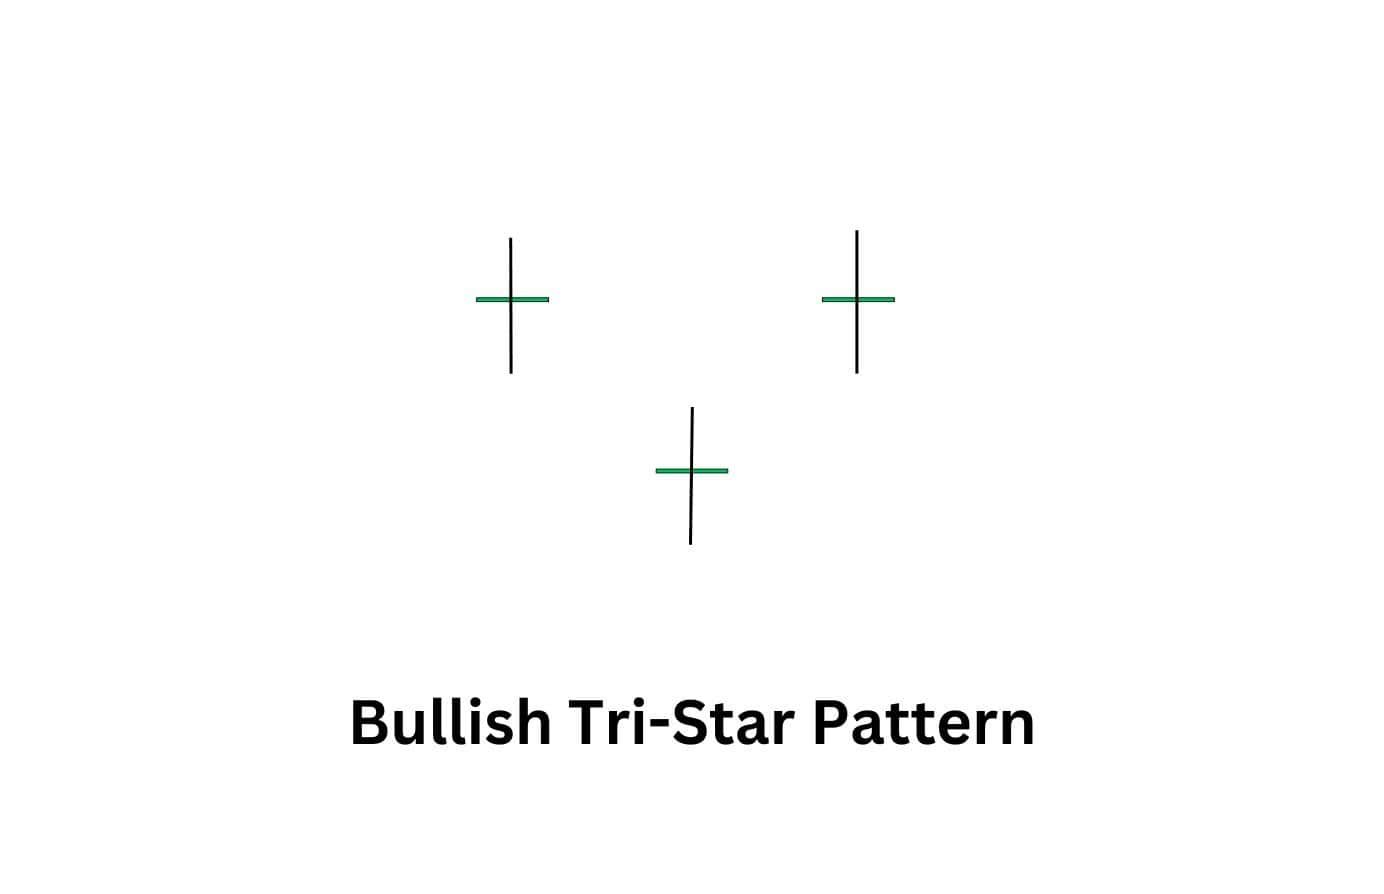
Why this candlestick pattern matters:
This pattern is crucial since it shows extreme indecision in the market as buyers and sellers fight for control. If it appears at the bottom of a downtrend, a bullish reversal could be underway. However, the pattern should always be confirmed by follow-up bullish candles that indicate buyers are in control.
21. Stick Sandwich
Here’s how to identify this candlestick pattern:
The stick sandwich pattern consists of three candles. The first candle is bearish, followed by a bullish candle that opens and closes higher. The pattern concludes with another bearish candle that closes at the same price as the first.
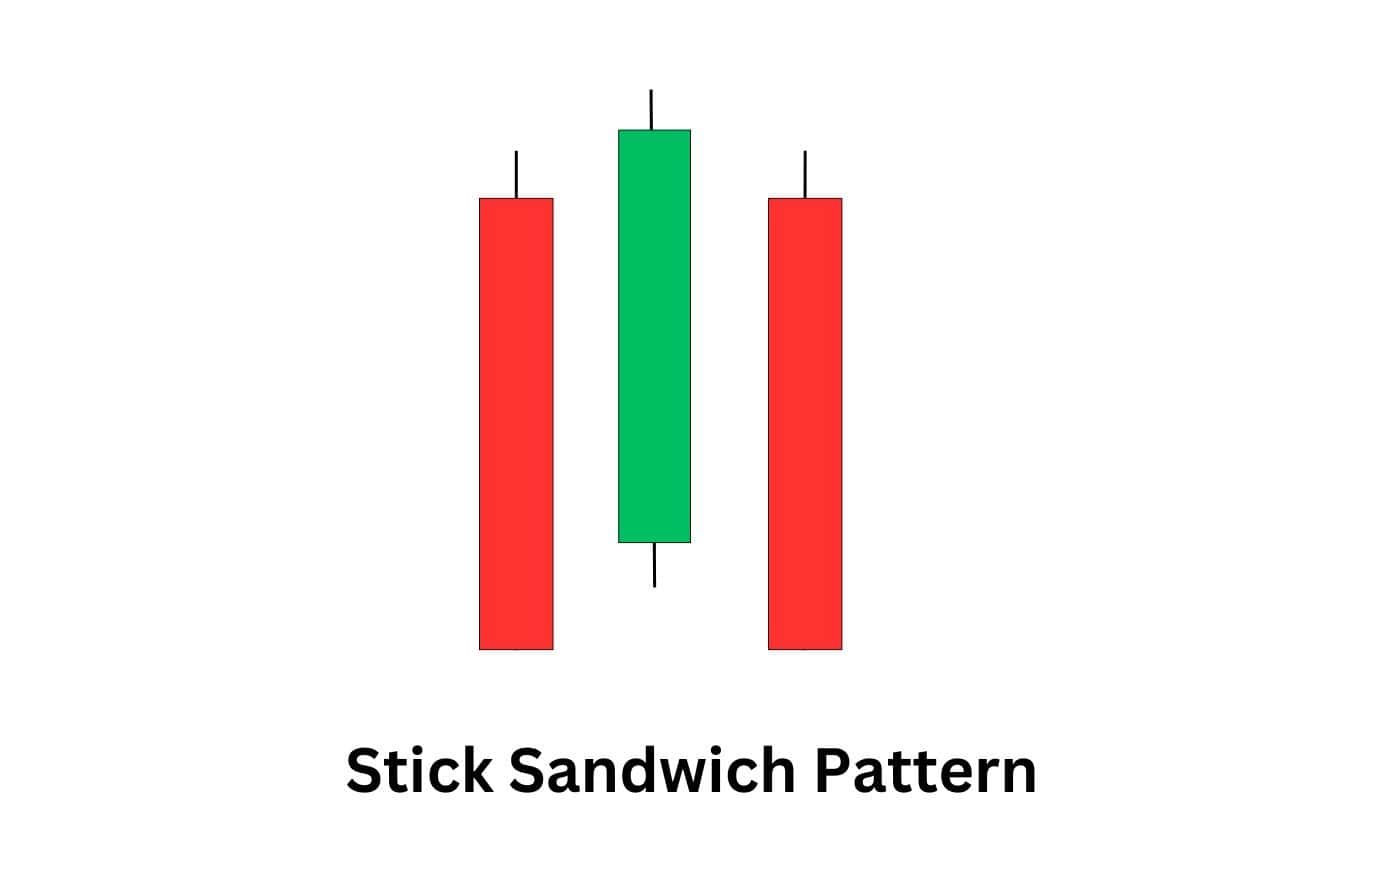
Why this candlestick pattern matters:
The stick sandwich candlestick indicates indecision in the market sentiment. The similarity in closing prices between the first and third bearish candles signals buyers are stepping in at a crucial support level and defending it. This pattern signals bullish momentum if the following candles are bullish and the support level is not broken.
22. Morning Star Doji
Here’s how to identify this candlestick pattern:
The Morning Star Doji pattern is made up of three candles. The first candle is a long bearish candle, showing strong selling pressure. The second candle is a doji, which signals indecision as the market pauses. The third candle is bullish and should close at least above the midpoint of the first candle’s body, confirming a potential reversal.
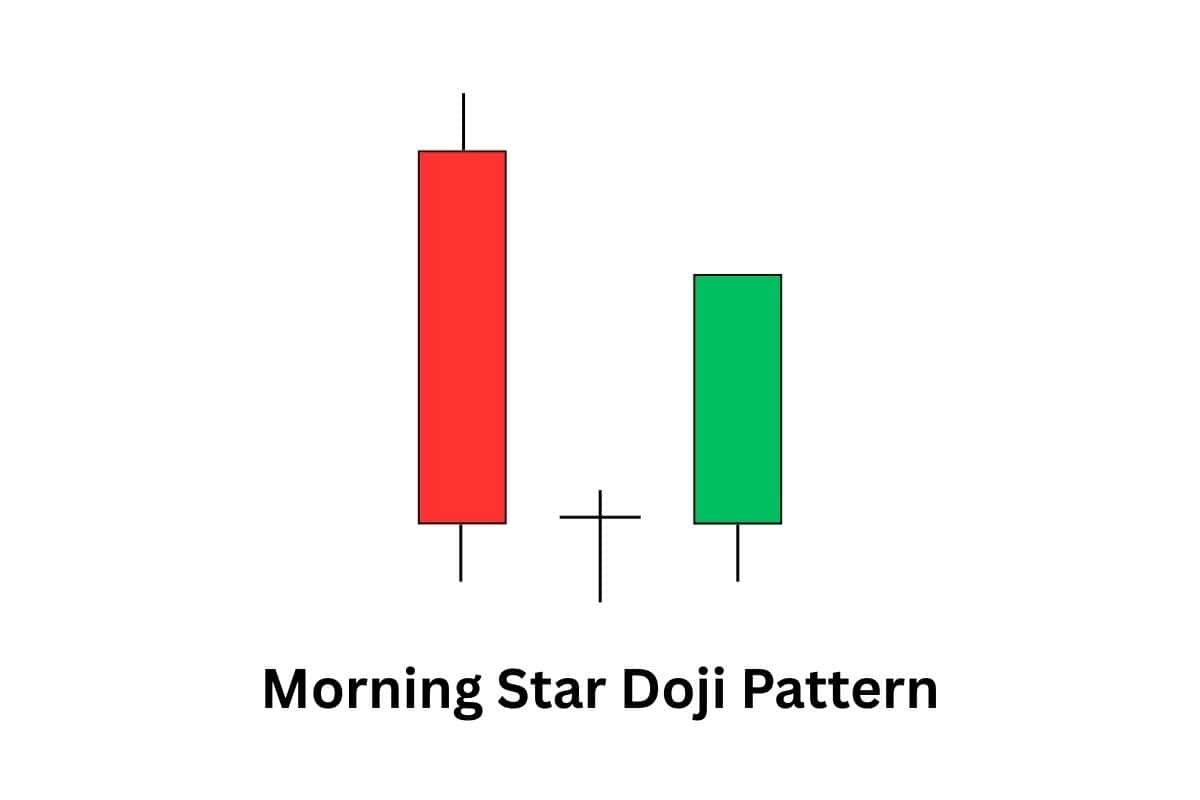
Why this candlestick pattern matters:
The Morning Star Doji is a strong bullish reversal signal, especially when it appears after a prolonged downtrend or at a key support level. The doji in the middle reflects market uncertainty, but the strong bullish close on the third candle shows buyers taking control. This pattern often marks the transition from selling pressure to buying momentum.
Bullish Multi-Candlestick Patterns
Multi-candlestick patterns capture a longer battle between buyers and sellers, revealing shifts in momentum that shorter patterns might miss. Traders often use them to confirm market direction before committing to larger or longer-term positions.
By spanning more sessions, they can highlight stronger, more reliable reversals or continuation signals — these are also known as Chart Patterns in trading.
Here are the top bullish Multi-Candlestick Patterns
23. Double Bottom
Here’s how to identify this candlestick pattern:
The double bottom pattern is typically formed when the price drops to a low and bounces higher. The price then falls again to the same low and rebounds to form the second low, leading to a “W”-shaped pattern. A bullish breakout is confirmed once the price surpasses the top formed from the first bounce.
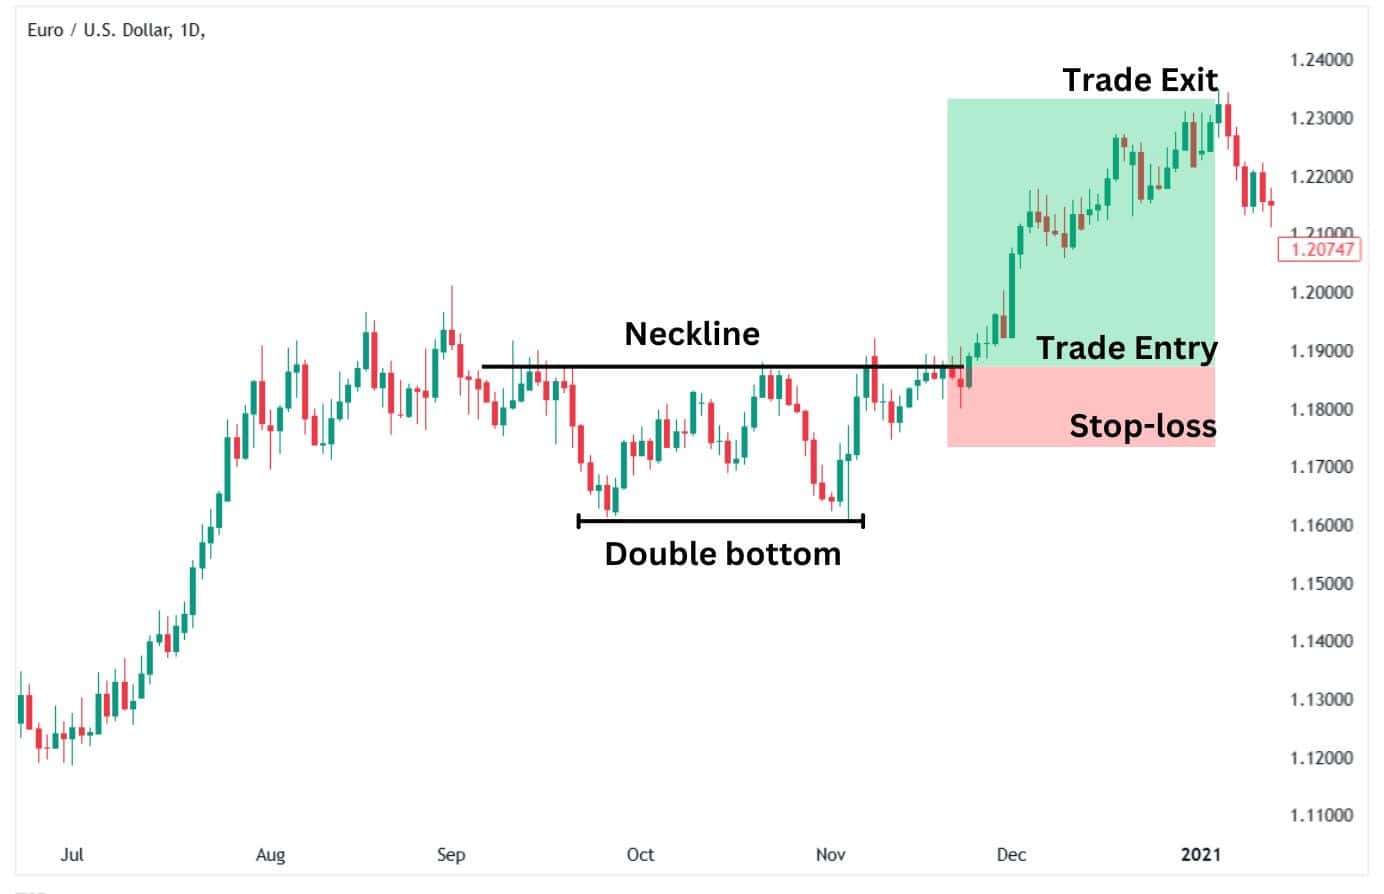
Why this candlestick pattern matters:
This candlestick pattern matters because it is a reversal pattern that indicates buyers are entering the markets and defending a particular price level. The breakout higher also signals that buyers have overpowered sellers and are now controlling the price. Hence, traders use the pattern to enter long (buy) positions.
24. Triple Bottom Pattern
Here’s how to identify this candlestick pattern:
The triple bottom pattern is formed by three equal or almost equal lows that form on a price chart. The three lows are usually accompanied by rebounds that end at the same price high. After the third bottom, the price usually strengthens and breaks above the tops of the previous two rebounds. This signals the beginning of a new uptrend.
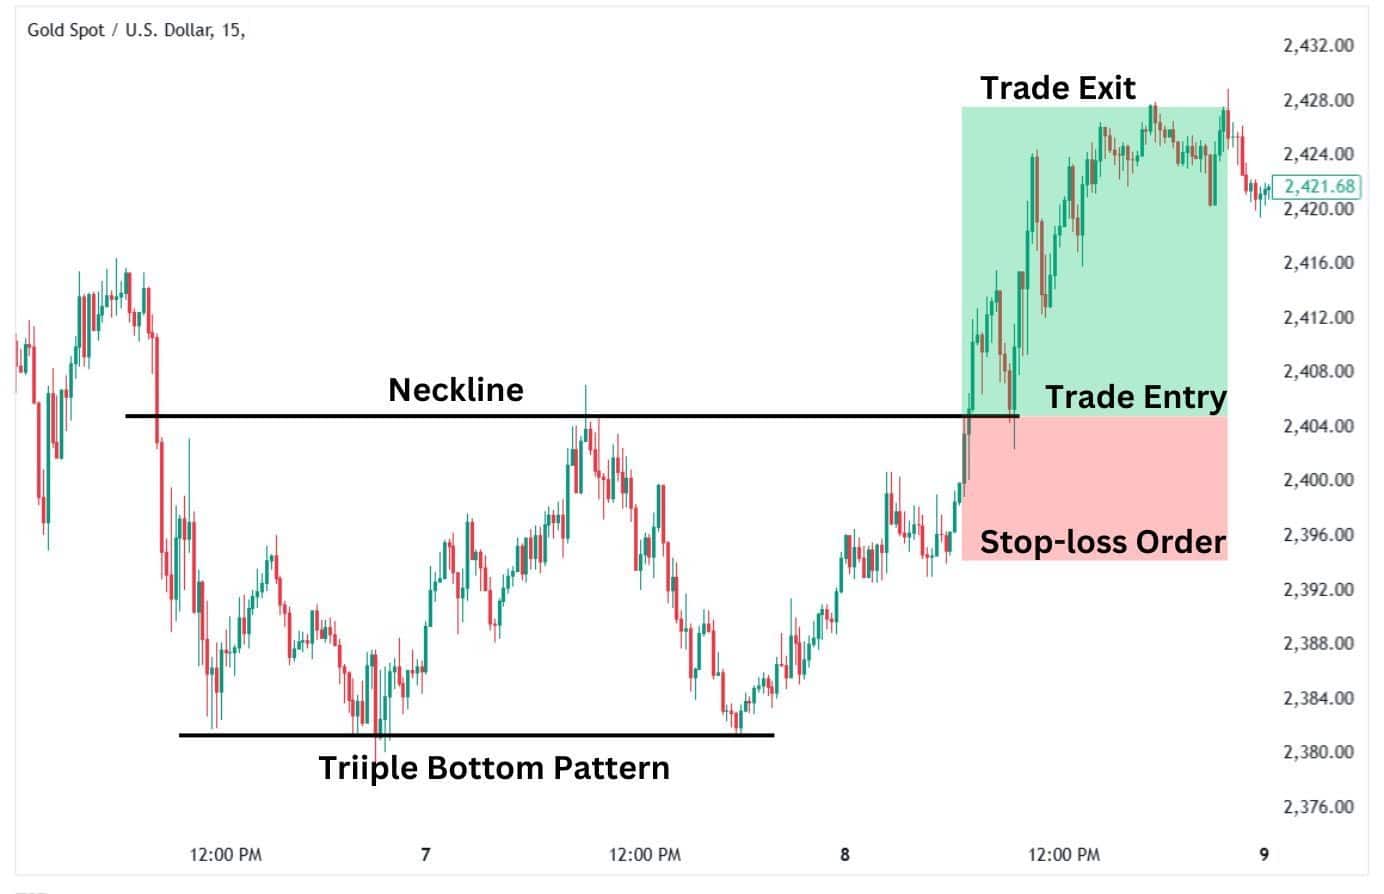
Why this candlestick pattern matters:
This candlestick pattern is crucial since it demonstrates that sellers cannot push prices below a specific low. Buyers defended the level at which the triple bottoms formed as they entered the market and pushed prices higher. This is one of the more reliable bullish candlestick patterns and is frequently used by traders to enter buy trades.
25. Cup and Handle
Here’s how to identify this candlestick pattern:
The cup and handle pattern is a pattern that plays out over a longer timeframe and looks like a teacup.
The cup part of the pattern is formed by a rounded shape where the price declines and then recovers. The handle portion of the pattern is a minor pullback that forms a rounded shape after the cup’s formation. The pattern is completed when the price breaks above the handle.
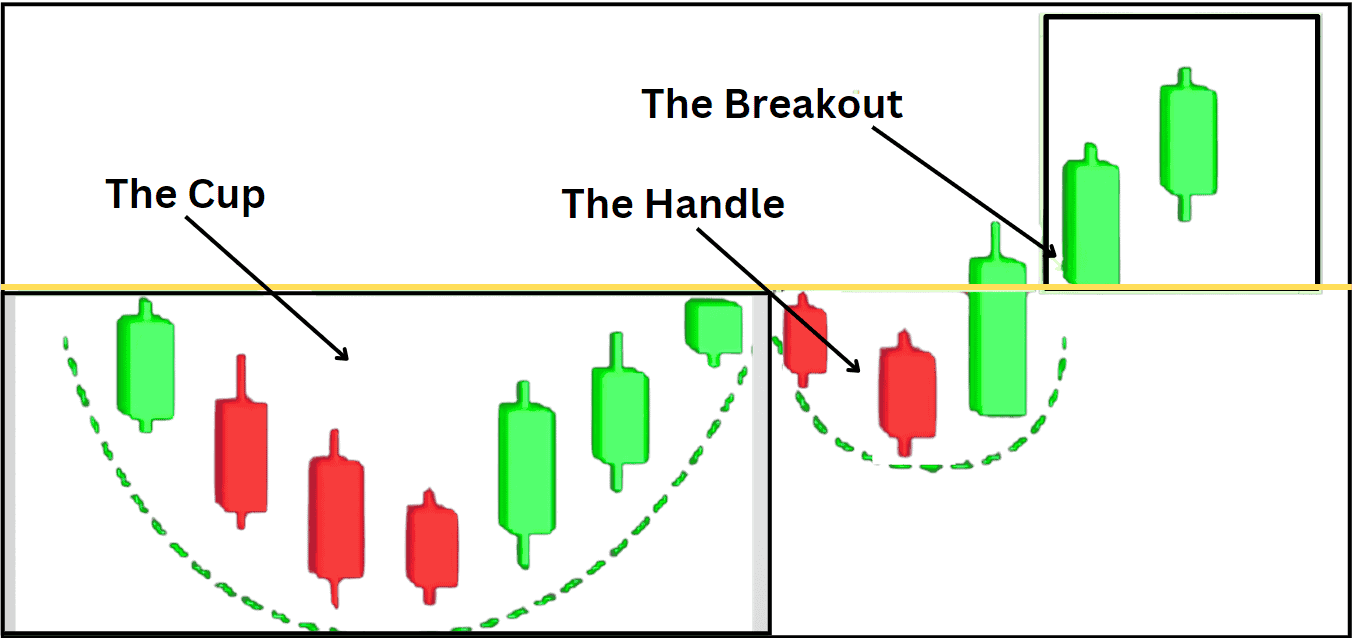
Why this candlestick pattern matters:
The cup and handle pattern often forms and is regarded as a bullish continuation pattern after a pause in the upward trend. The pattern signals increasing buying pressure after a sideways trading pattern, often resulting in a higher breakout.
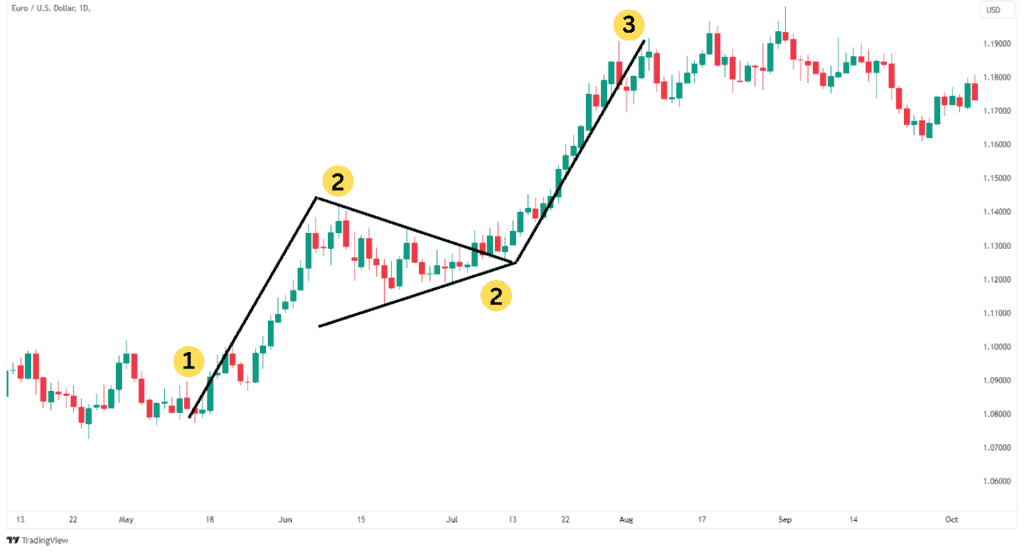
26. Bull Flag
Here’s how to identify this candlestick pattern:
The bull flag pattern typically occurs during an uptrend. It comprises a sharp upward price move (the flagpole) followed by a consolidation period (the flag) during which the price trades sideways or dips lower. A breakout above the flag usually confirms the pattern.
Why this candlestick pattern matters:
The bull flag pattern is important because it usually represents a brief pause in an uptrend. The price then builds up potential energy for the next move higher. It is regarded as a classic continuation pattern that allows traders to enter new bullish positions in an uptrend.
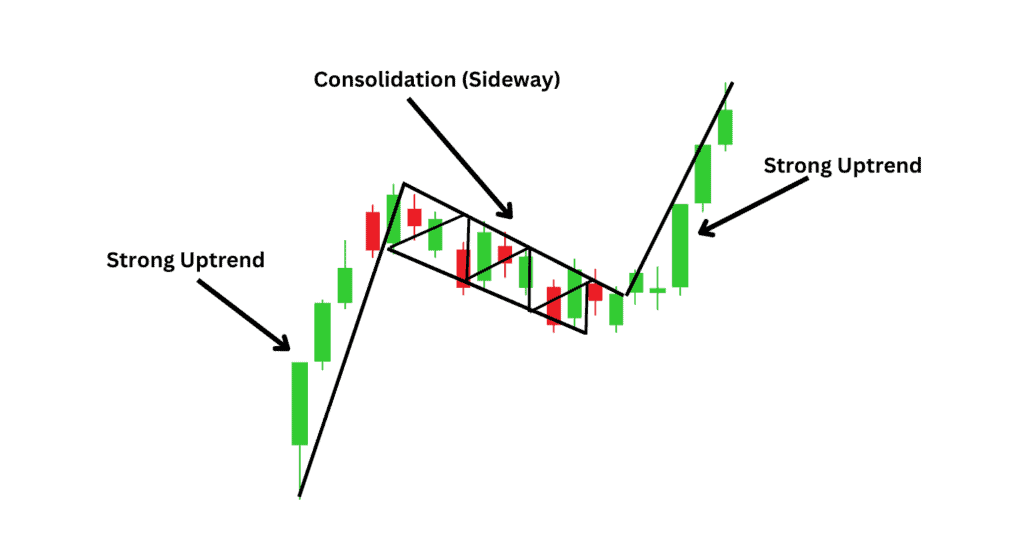
27. Bull Pennant
Here’s how to identify this candlestick pattern:
A Bull Pennant forms after a sharp upward trend, resulting in a “flagpole.” After this, the price enters a consolidation phase, forming a small triangle. The triangle formation consists of higher lows and lower highs. After the triangle’s formation, the price breaks out in the same direction as the initial upward trend that formed the flagpole.
Why this candlestick pattern matters:
This candlestick pattern is important because it represents a pause in an uptrend, after which the trend usually resumes. It allows traders and investors to enter a bullish trade at a strategic point where they can limit their risk exposure and take advantage of the bullish trend.
28. Inverse Head & Shoulders
Here’s how to identify this candlestick pattern:
The inverse head-and-shoulders candlestick pattern consists of three lows. The first and third lows appear around the same level and are known as shoulders. The middle low is lower than the other two and is the head. The three lows have a neckline that acts as a resistance level where buyers cannot push prices higher. The neckline connects the entire pattern, and a break above it signals the potential beginning of a new uptrend.
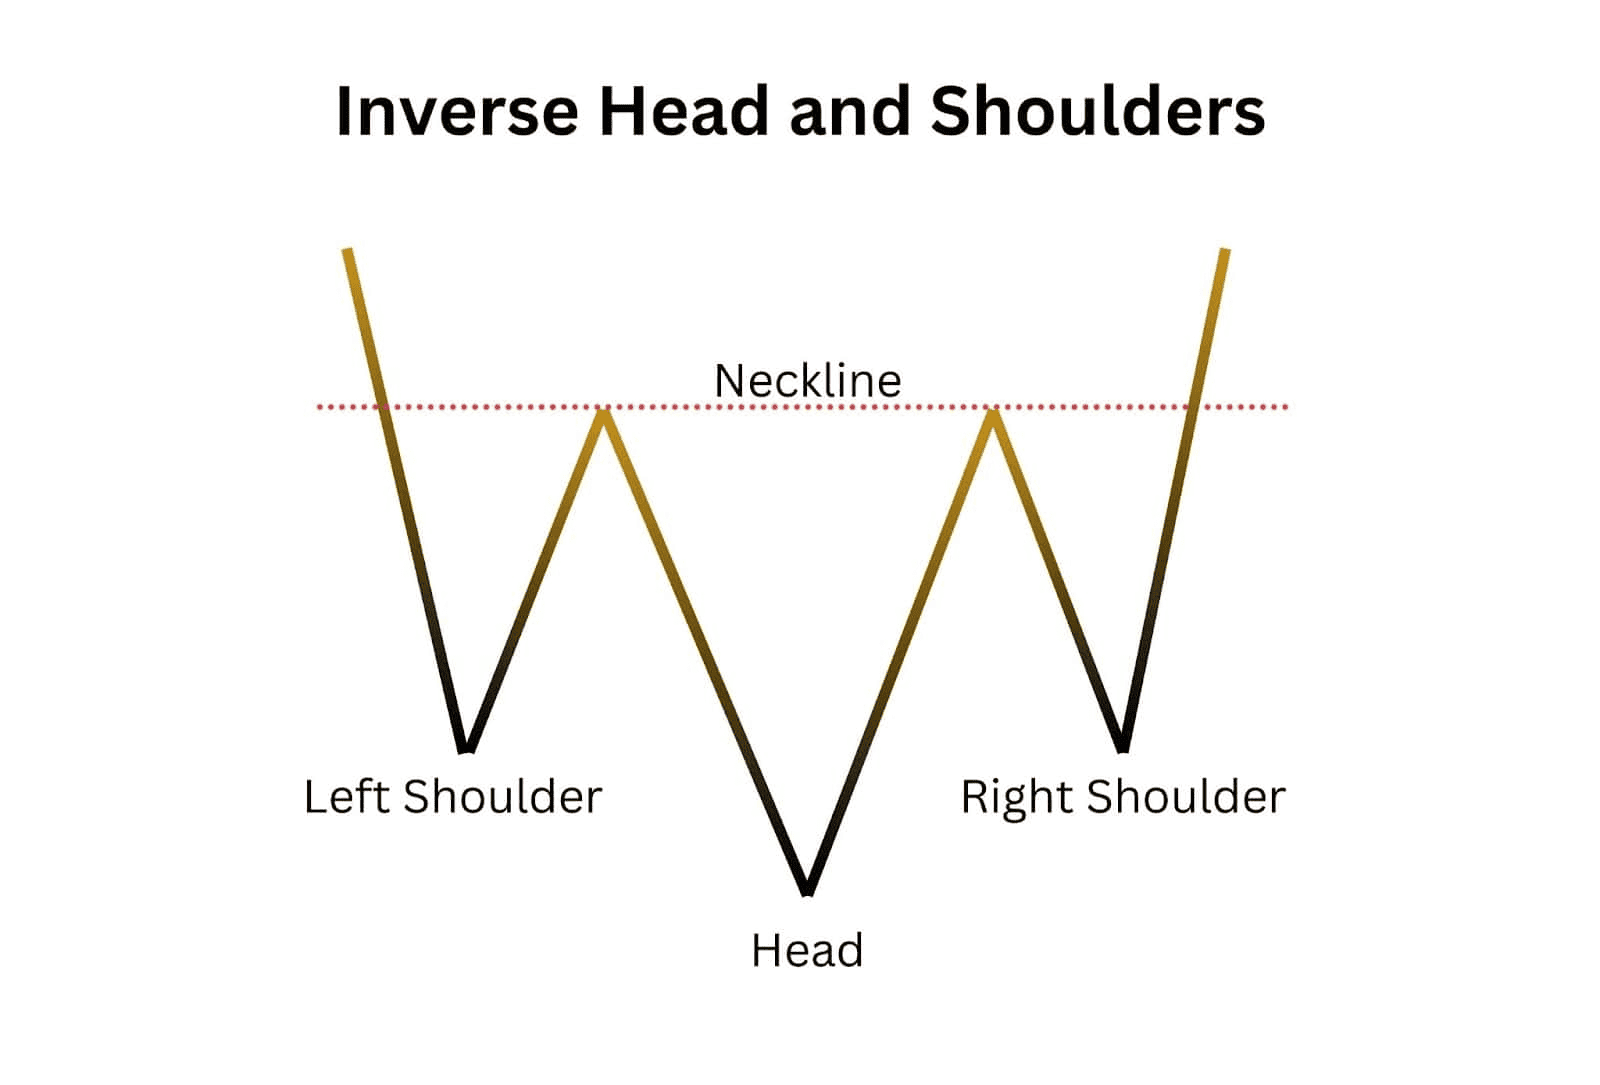
Why this candlestick pattern matters:
This powerful reversal pattern typically occurs at the end of a downtrend. It signals the beginning of an uptrend once it is completed and gives traders a chance to enter into bullish trades at the beginning of an uptrend.
29. Ascending Triangle Pattern
Here’s how to identify this candlestick pattern:
The ascending triangle pattern is formed when traders and investors push prices higher, resulting in higher lows. However, due to a resistance level, the highs remain the same. As the price rises, it forms a triangle and bounces between the higher lows and the flat top. The pattern is regarded as a bullish continuation signal.
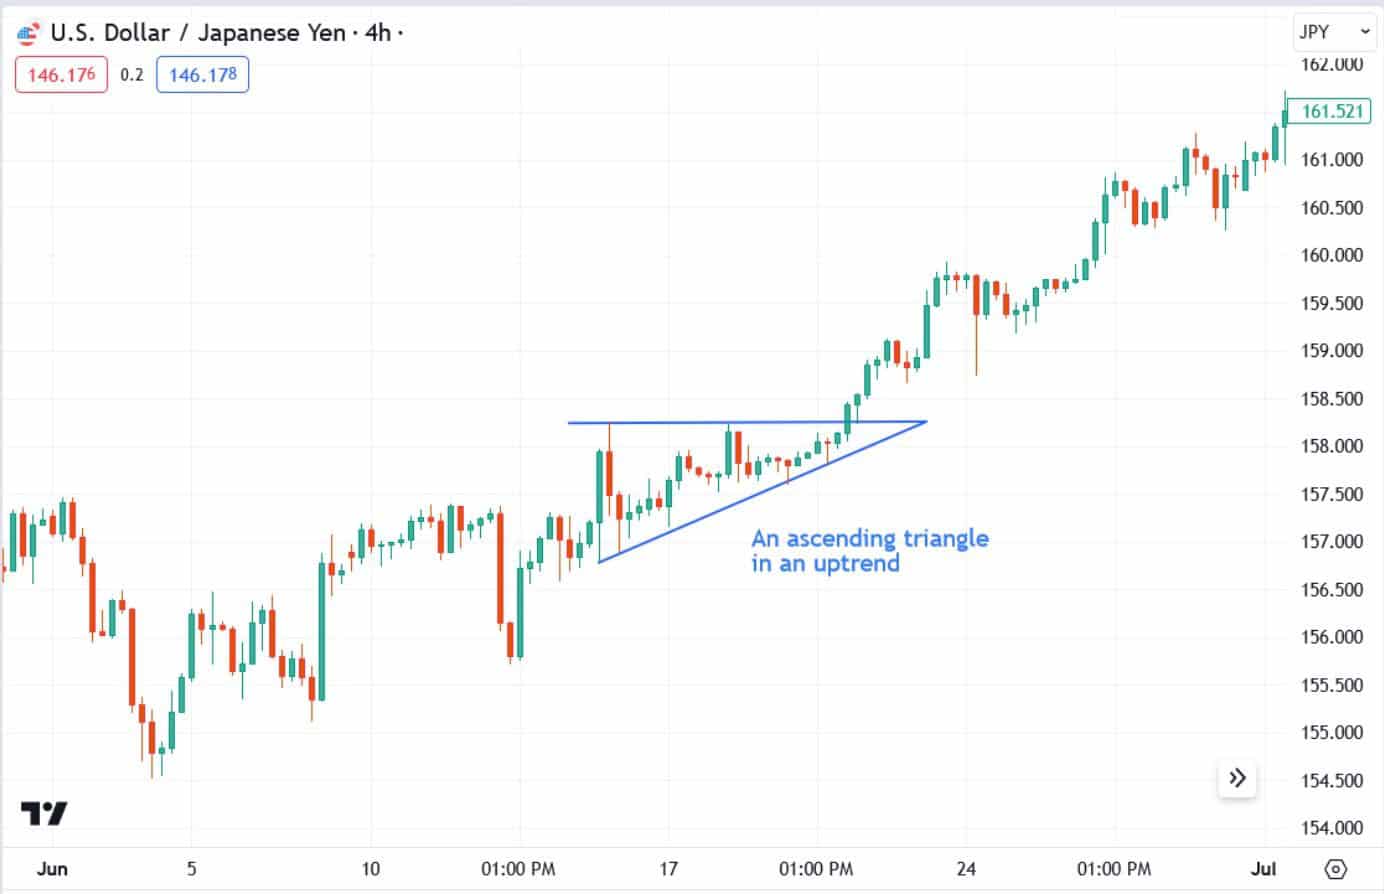
Why this candlestick pattern matters:
This pattern shows buyers gaining momentum as they keep pushing prices higher towards the resistance level. It is regarded as a bullish continuation signal, as traders expect prices to continue rising after a break above the resistance level.
30. Falling Wedge
Here’s how to identify this candlestick pattern:
The falling wedge pattern comprises two descending trend lines created as the price forms lower highs and lower lows. The slope of the lower highs is usually steeper than the lower lows, which results in the wedge pattern observed on a price chart.
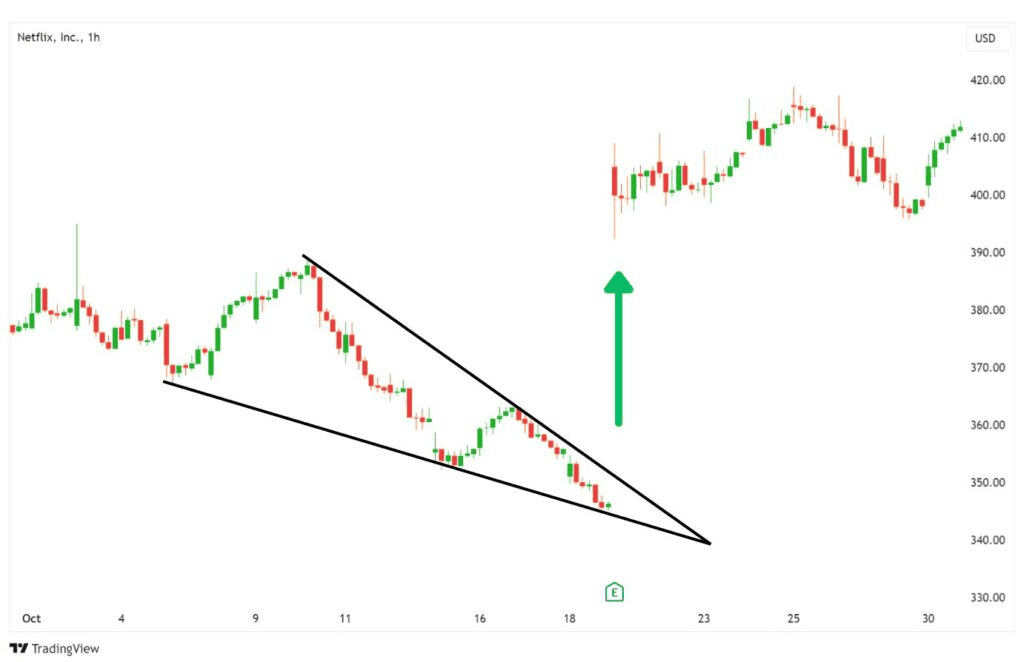
Why this candlestick pattern matters:
The falling wedge signals a possible bullish reversal. It shows sellers are losing momentum as buyers enter the market and gradually stop the downtrend. A bullish reversal usually occurs when the price breaks above the wedge’s resistance line.
Therefore, traders who are looking for a bullish reversal favour this pattern.
Advantages of Using Bullish Candlestick Patterns
Early Clues for Market Reversals
Bullish candlestick patterns are like a trader’s radar, identifying momentum shifts that suggest a price rebound may be on the horizon. They can often tip you to potential opportunities before other indicators catch up.
Effortless Recognition
These patterns don’t require a Ph.D. in charting. With their distinct shapes—like the Hammer or Bullish Engulfing—they’re easy to spot, even for beginners. Their simplicity makes them a go-to tool for traders seeking signals without wading through endless data.
Sharper Entry Timing
Bullish patterns excel at timing. They often form near the end of a downward move, signalling a potential entry point with less downside risk. This allows traders to catch trends at more advantageous levels, improving overall trade efficiency.
Adaptable Across Markets and Strategies
These patterns apply to any market, whether forex, stocks, or commodities. They also work across timeframes, fitting seamlessly into short-term day trading or longer-term swing trading strategies.
Streamlines Strategy Building
Bullish candlestick patterns add structure to a trader’s approach without overcomplicating things. When paired with tools like moving averages or volume indicators, they become a straightforward yet powerful method for spotting trades and confirming market sentiment.
Disadvantages of using Bullish Candlestick Patterns
Unreliable in Isolation
A bullish pattern isn’t always what it seems. In a choppy market or weak trend, it might appear significant but lead to a false breakout, which can catch traders off guard and trigger losses if other factors aren’t considered.
Context is Everything
These patterns perform best when supported by market context. A Bullish Harami that appears at a key support level carries weight, but the same pattern in a neutral zone might not mean much. Ignoring this context can result in missteps.
Short-Term Nature
Many bullish candlestick patterns are designed to spot immediate moves, making them less useful for traders with a more extended outlook. Without a broader perspective, relying solely on these patterns might cause traders to miss the bigger picture.
Subject to Interpretation
Chart reading isn’t a one-size-fits-all activity. What one trader views as a textbook Bullish Engulfing pattern, another might dismiss as noise. This variability can lead to inconsistent results and differing conclusions between traders.
Can’t Predict the Unexpected
External factors, like surprise economic announcements or geopolitical events, can render bullish patterns ineffective. Traders relying too heavily on these signals may overlook the broader influences driving the market, leading to misinformed decisions.
Identifying Bullish Candlestick Patterns
Candlestick charts are essential tools for identifying bullish candlestick patterns as they visually represent price movements and market sentiment. Bullish candlestick patterns can be easily identified since they occur towards the end of a downtrend or during a pause in an uptrend.
To identify them, look for any patterns discussed in this article, such as the morning star candlestick pattern, which signals a shift in market momentum, and the bullish engulfing pattern.
These patterns typically form at the bottom of a downtrend or a crucial support zone as buyers start overpowering sellers and pushing prices higher. As outlined above, the key to identifying bullish candlestick patterns is to familiarise yourself with them.
Putting Bullish Candlestick Patterns into Practice
Recognising a bullish candlestick pattern forming is just the tip of the iceberg; the real value lies in using it effectively. Before diving into a trade, confirm the pattern’s validity with tools like volume spikes or trendline bounces. For instance, if a morning star forms and coincides with an uptick in buying volume, it’s a green light to plan your entry. Set your buy order slightly above the high of the confirmation candle, tuck your stop-loss below the recent low, and identify your profit target at the next resistance level. Practising on historical charts or via a demo account sharpens your skills without risking real money.
Bullish Candlestick Patterns – Continuations vs. Reversals
Grasping the distinction between continuation and reversal patterns is essential for remaining aligned with the trend. Reversal formations such as the Hammer or Morning Star appear when a downtrend weakens, signalling a potential reversal. In the meantime, continuation patterns like the Rising Three Methods indicate that the market pauses before continuing its ascent. By accurately interpreting these patterns, you can determine if you should get ready for a new trend or continue with an ongoing one.
FAQs
What is the most bullish candlestick pattern?
One of the strongest bullish candlestick patterns is the Bullish Engulfing. It depicts a small red candle entirely overshadowed by a larger green one following it. This visual shows sellers trying to lower the price, but buyers surged in with overwhelming strength. It’s significant when it shows up near key support zones or after a prolonged downtrend.
What Is a Bullish Belt Hold candlestick pattern?
The Bullish Belt Hold is a bold single-candle formation that shouts buyer dominance. By the end of the session, it opens near its lowest point and closes near its high, leaving little or no lower shadow. This pattern signifies that buyers jumped in early and kept control throughout, often marking the start of upward momentum.
What is the best timeframe for using bullish candlestick patterns?
Your timeframe choice depends on how you trade. If you’re aiming for fast moves, like a day trader, look at 5- or 15-minute charts. Swing traders prefer catching bigger waves and might lean toward daily or 4-hour charts for clarity. Beginners often find daily charts the most reliable since they reduce market noise and show cleaner trends.
What is the 3 candle rule?
The Three-Candle Rule is a technique for avoiding jumping into trades too quickly. After spotting a pattern like a bullish engulfing, wait for three consecutive green candles to confirm the upward momentum. This technique is a patience tool, helping traders filter out false signals and act only when the market shows consistent direction.
Do professional traders use candlestick patterns?
Absolutely, but they don’t rely on candlestick patterns in isolation. Pros treat candlestick patterns as part of a more extensive toolkit. They combine these patterns with indicators, support/resistance zones, and a broader market context. A pattern might catch their eye, but its value is only unlocked when it aligns with their strategy.


