Written by:

Reviewed by:


- March 5, 2025
- 21 min read
The RSI Divergence Explained
The Relative Strength Index indicator, or the RSI, is a momentum oscillator that tracks the speed of price changes, creating wave-like movements as markets rise or fall. When price and RSI move in sync, the trend is intact—but when they diverge, it signals a potential shift in momentum.
In this article, you’ll learn how to use the RSI indicator to trade divergences, an incredible tool for capturing the beginning of trend reversals or continuations.
What is RSI Divergence?
RSI divergence helps traders spot early signs of trend reversals or continuations by comparing price action against RSI line movements. Normally, price and RSI value rise and fall together, but when this correlation breaks—such as price making a higher high while RSI line prints a lower high—it suggests a momentum shift that could lead to a market turn.
Divergence is considered a leading indicator, as it provides early signals of potential price movements before they occur. However, it isn’t foolproof—just because divergence appears doesn’t mean price will immediately reverse. Traders often use it alongside confirmation tools like trendlines, moving averages, or volume indicators to improve accuracy and avoid false signals.
What is Bullish RSI divergence?
A bullish RSI divergence forms when price trends lower. There are two types: regular and hidden.
What is Bullish Regular RSI Divergence?
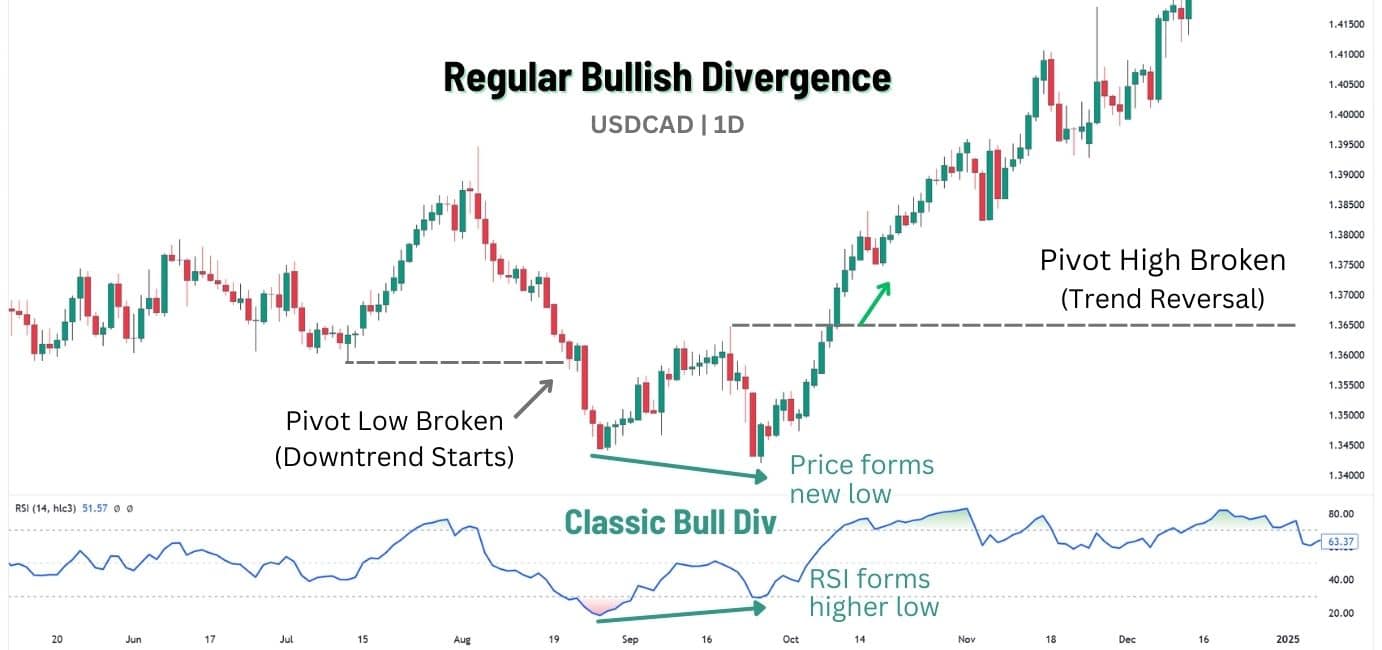
A regular bullish RSI divergence, also called classic bullish divergence, is a reversal pattern observed during a downtrend hinting at a potential trend reversal to the upside. It occurs when price makes a lower low, but the RSI line forms a higher low, suggesting bearish momentum is weakening.
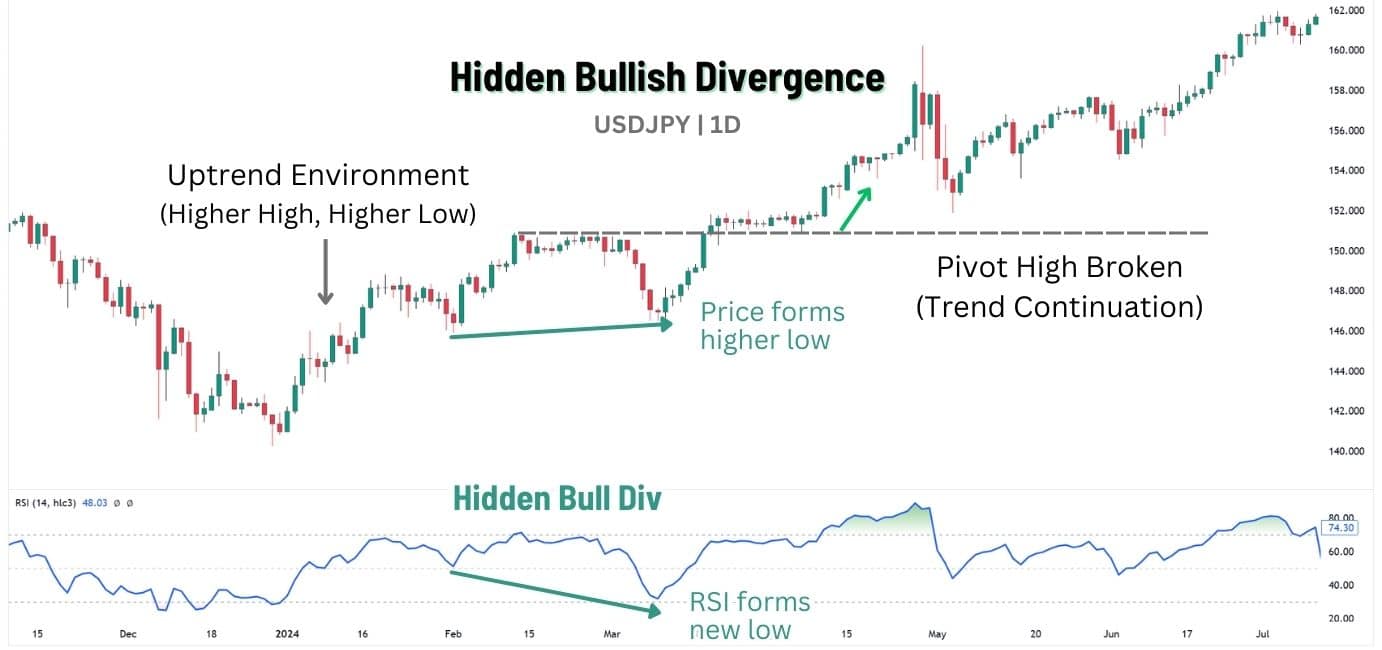
What is Bullish Hidden RSI Divergence?
A hidden bullish RSI divergence is a continuation pattern that occurs during an uptrend, suggesting the trend is likely to continue. It happens when price forms a higher low, but the RSI line makes a lower low, indicating price sellers failed to break the trend, reinforcing underlying buying strength.
What is Bearish RSI divergence?
A bearish RSI divergence forms when price trends higher. Like bullish divergence, it comes in two types: regular and hidden.
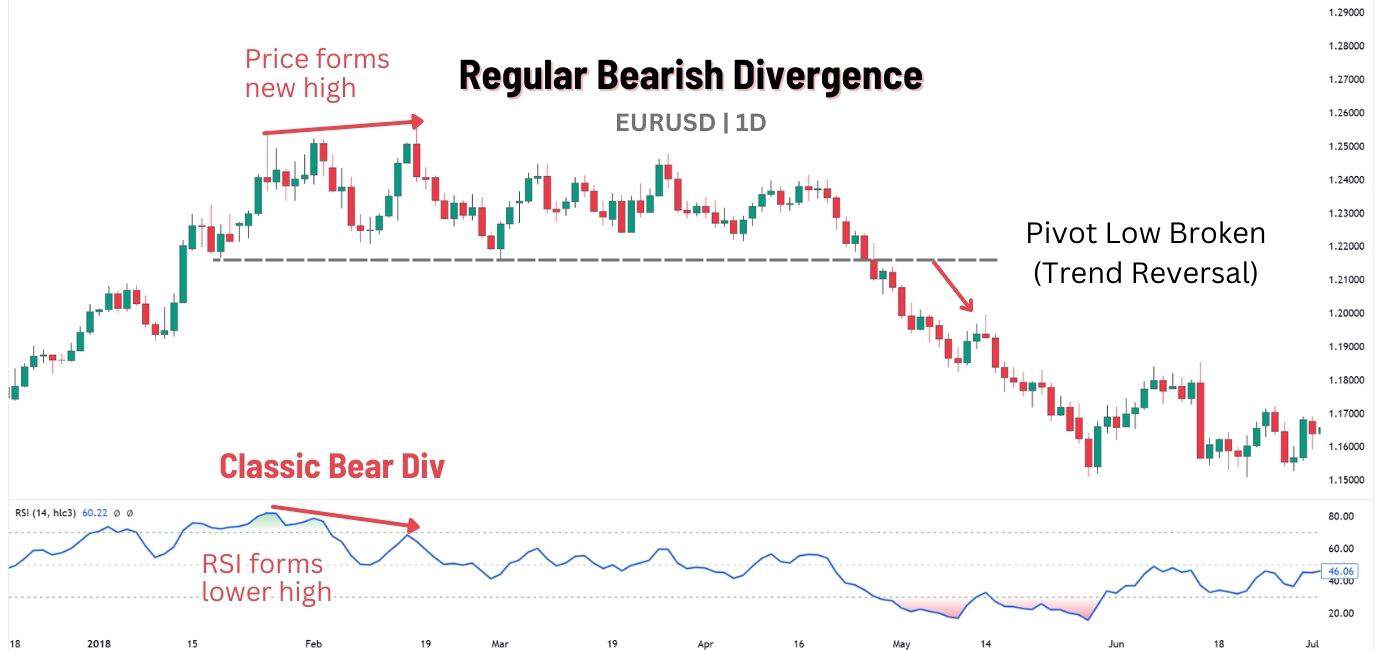
What is Bearish Regular RSI Divergence?
A regular bearish RSI divergence, or classic bearish divergence, is a reversal pattern seen during an uptrend, signalling a potential trend reversal to the downside. It appears when price makes a higher high, but RSI values prints a lower high, signalling that bullish momentum is fading.
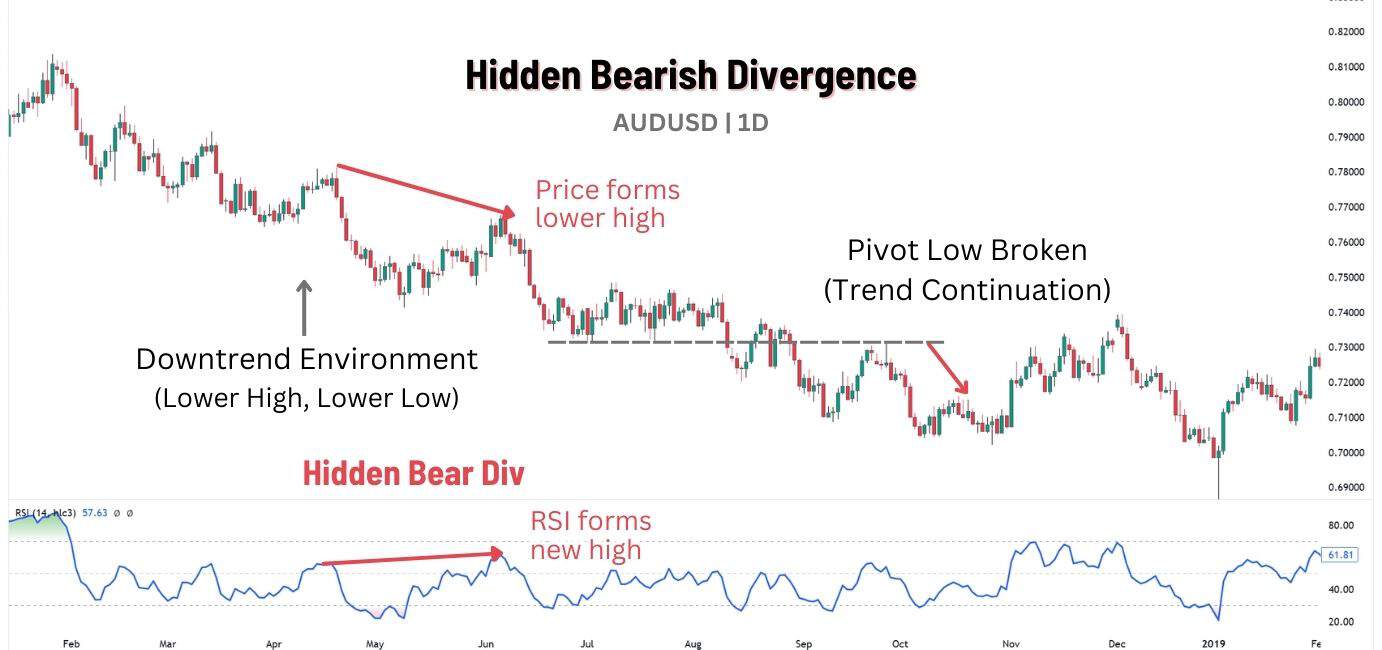
What is Bearish Hidden RSI Divergence?
A hidden bearish RSI divergence is a continuation pattern observed during a downtrend, suggesting the trend is unlikely to reverse. It occurs when price makes a lower high, but the RSI line forms a higher high, showing that bullish momentum wasn’t strong enough to break the downtrend.
What Does an RSI Divergence Tell Us?
An RSI divergence highlights a disconnect between price action and momentum, signalling that something is “off” in the market. For instance, if the price is falling sharply, it might seem like a further downtrend is all but guaranteed.
However, a bullish divergence—where the price forms a lower low while the RSI forms a higher low—indicates weakening bearish momentum. This suggests the price drop could be nearing its end, and a reversal to the upside may be on the horizon.
How to Find Bullish RSI Divergences
Bullish RSI divergences occur when price is declining. It can be spotted at pivot lows on the price chart and RSI indicator.
- Classic Bullish Divergence – RSI forms a higher low, while price forms a lower low, indicating a potential trend reversal to the upside.
- Hidden Bullish Divergence – RSI forms a lower low, while price forms a higher low, reinforcing a continuation of the uptrend.
How to Find Bearish RSI Divergences
Bearish RSI divergences occur when price is rising and can be identified at pivot highs on the price chart and RSI indicator.
- Classic Bearish Divergence – RSI forms a lower high, while price makes a higher high, signalling a potential trend reversal downward.
- Hidden Bearish Divergence – RSI forms a higher high, while price makes a lower high, reinforcing a continuation of the downtrend.
These trading signals are more powerful when they appear near key levels like support and resistance zones, Fibonacci retracements, vWAP, or Exponential Moving Averages (EMAs). Spotting these divergences early can help traders capitalise on shifts in market momentum before major price moves unfold.
How to Identify RSI Divergence
RSI divergence occurs when price and the RSI indicator move in an opposite direction, breaking their usual correlation. Adept traders will be able to spot regular divergences easily, but hidden ones take longer to form and are often overlooked. This is where using a tool like the RSI Divergence Indicator on Trading View can help detect both divergences faster, providing a clearer view of market conditions.
Traders can add the RSI divergence indicator to their charts to more easily identify hidden divergence, classic divergence, or both. The RSI divergence indicator can further be refined into just looking for bullish divergences or bearish divergences.
Just because the indicator generates a signal does not mean that you have to trade it. You can filter out those signals the RSI divergence indicator generates to take just those that align with your broader trend analysis.
RSI Divergence Example
Identifying divergences in real time allows traders to anticipate shifts in market momentum and refine their strategies. Classic divergences often point to potential trend reversals, while hidden divergences confirm the continuation of a prevailing trend.
This S&P 500 weekly chart (Q4 2021–Q3 2022) provides a clear example of how RSI divergences can offer actionable insights:
Bearish Divergences
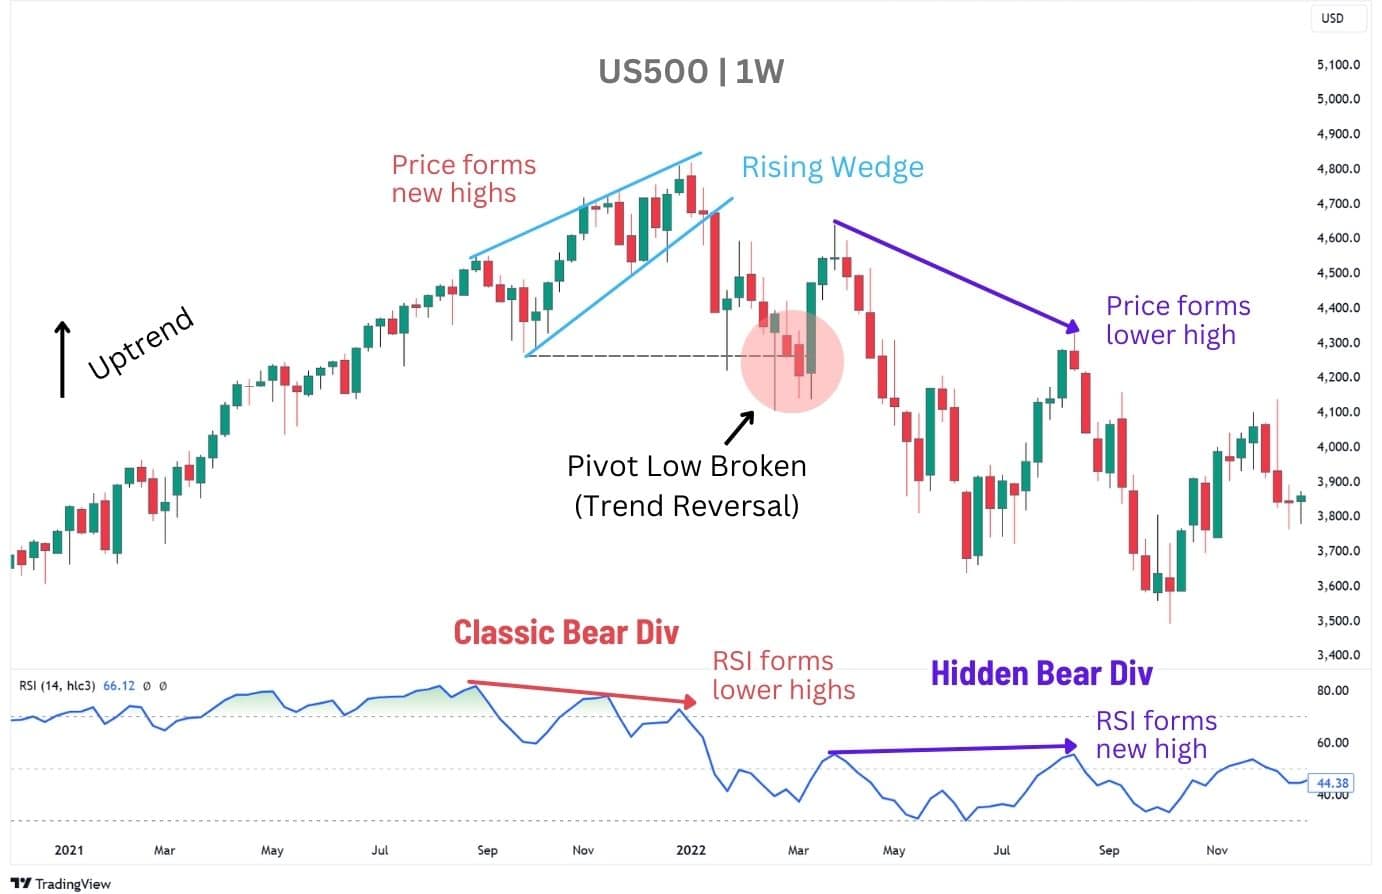
In this chart, notice how the uptrend in 2021 lost steam as momentum weakened, leading to a classic bearish divergence by Q4. Price pushed to new highs, but RSI failed to confirm the move, forming lower highs instead—an early warning of exhaustion.
The rising wedge pattern further signalled a shift, and once the price broke below its pivot low, the trend reversed. As the downtrend developed into mid-2022, a hidden bearish divergence emerged. Here, the price formed a lower high while RSI climbed to a new high, reinforcing that bearish momentum remained intact despite a temporary rebound.
What’s interesting about this chart is that right after this occurrence, a bullish pair of divergences emerges, granting us another stab at trading a similar move.
Bullish Divergences
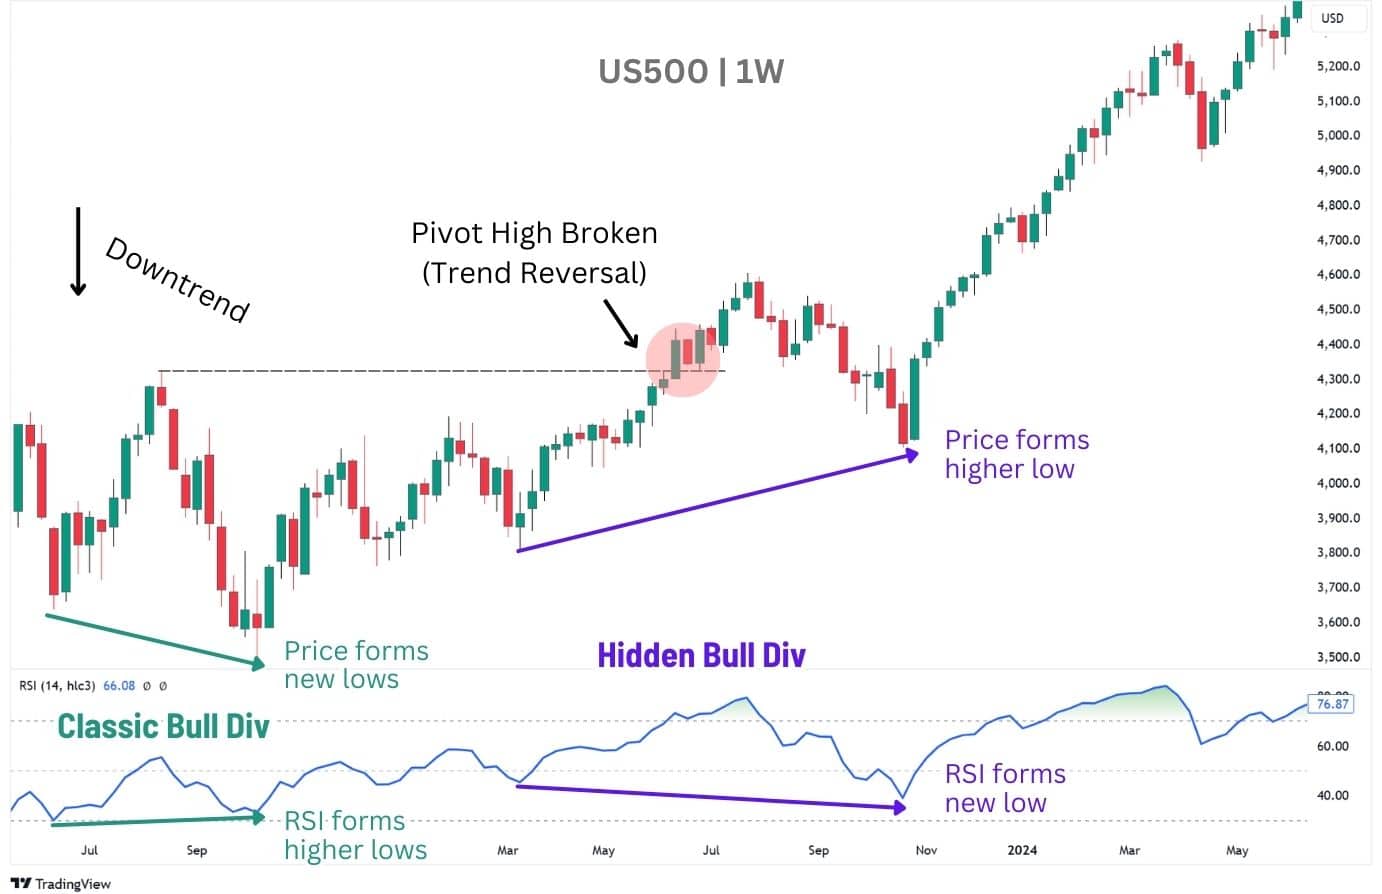
Right after the regular and hidden bearish divergences, the S&P 500 throws in a classic bullish divergence followed by a hidden one. It’s a perfect showcase of how the two divergences can play together—regular ones hint at reversals, while hidden ones keep the trend alive, doubling up on trade opportunities!
RSI Divergence Trading Strategies
To trade RSI divergence effectively, it’s best to combine it with support and resistance levels, trend lines, or chart patterns to refine your entry. While RSI divergence is a strong signal for trend reversals or continuations, using it in isolation can be risky—it doesn’t provide exact entry timing, and multiple divergences can appear before a valid trade materialises. A trader can use the RSI divergence indicator to help highlight when a divergence has developed and take action as needed.
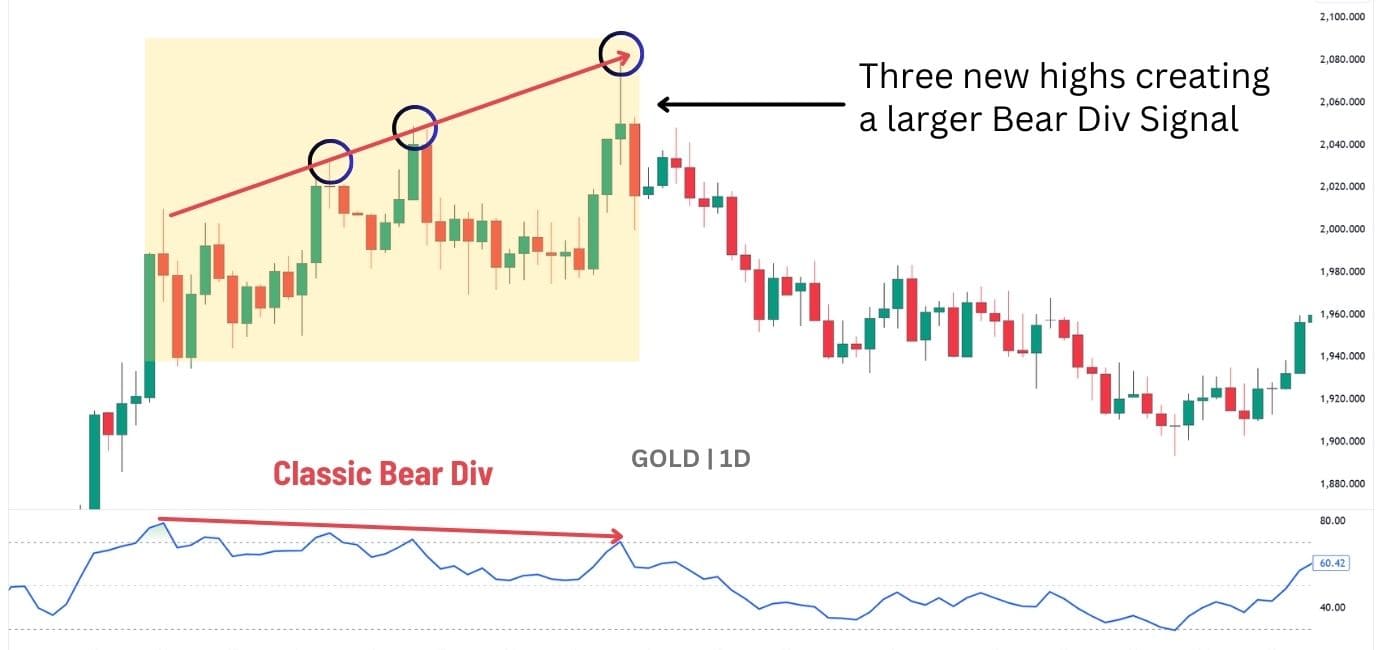
All of these factors combined highlight the importance of having a well-planned trading strategy when trading the RSI divergence signal.
Notice how three divergence signals formed in this Gold (XAU/USD) daily chart. If you had traded immediately on the formation of each divergence, it would have resulted in two out of three losing trades:
Trading RSI Divergence with Support and Resistance Levels
The key to this approach is simple: buy at support, sell at resistance—but defining these levels correctly is crucial.
- Support levels: Areas below the current price where buying pressure tends to emerge, acting as a floor for price rebounds.
- Resistance levels: Areas above the current price where selling pressure is likely, forming a ceiling that limits further gains.
The beauty of RSI divergences is that they naturally form pivot points in the price chart, which can be used as the support & resistance in this strategy.
Trading Regular Divergences
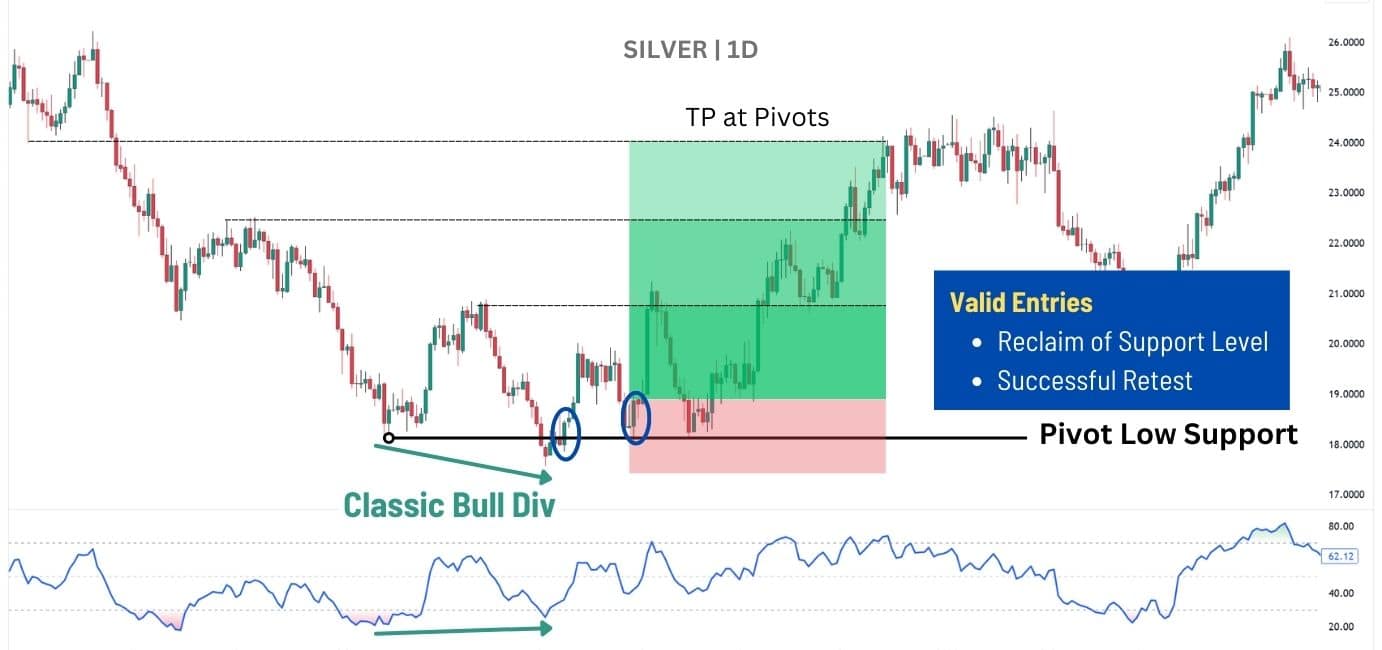
In a downtrend, price forms multiple pivot lows, but not all indicate a reversal. A classic bullish divergence occurs when price makes a lower low, while RSI prints a higher low, signalling weakening bearish momentum. However, the real confirmation comes when price reclaims the pivot low—showing buyers have stepped in with strength.
A stronger shift happens when price breaks above the pivot high, confirming a market structure reversal from bearish to bullish. This transition turns previous resistance into support, reinforcing the uptrend.
For trade execution:
📌 Entry – After price reclaims the pivot low with a strong close.
🎯 Targets – Prior pivot highs, ensuring a favourable risk-to-reward ratio.
🔻 Stop Loss – Below the pivot low, keeping risk contained.
By waiting for a reclaim and structure shift, traders avoid premature entries and instead focus on high-probability reversals, aligning with price momentum. For bearish setups, look for a pivot high instead, and for the price to close below the resistance.
Trading Hidden Divergences
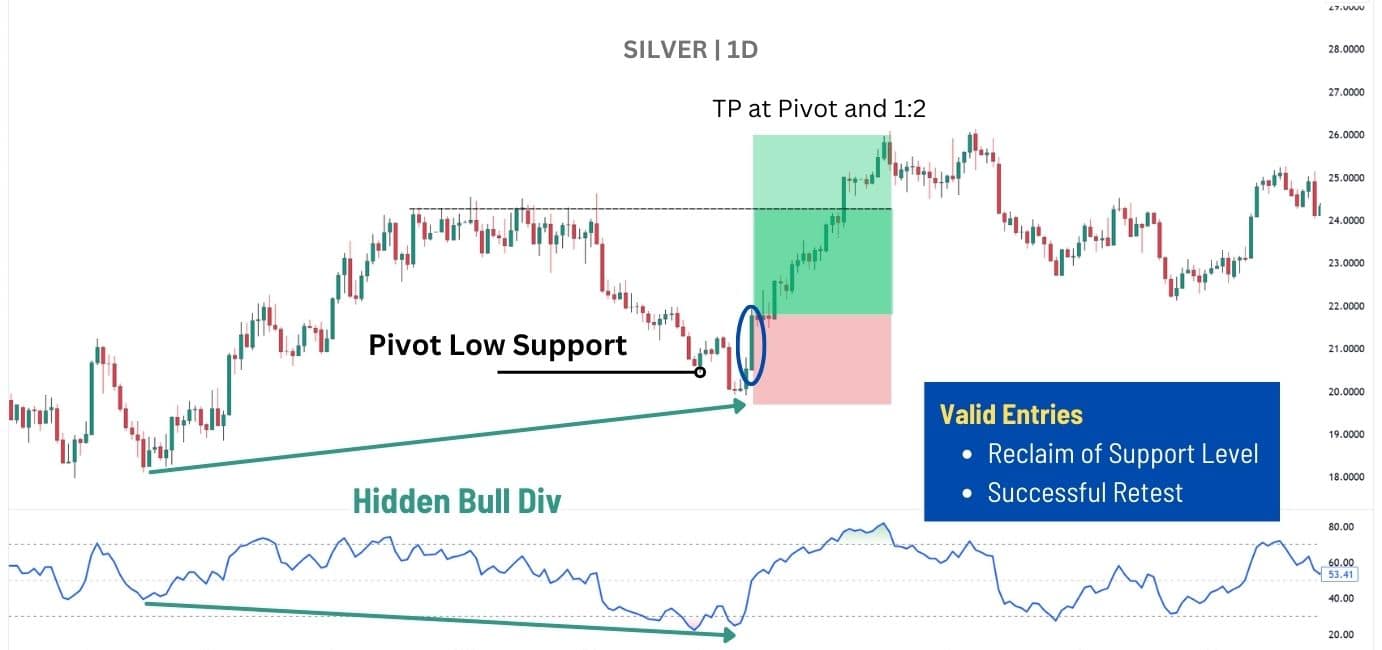
During an uptrend, price often pulls back, forming higher lows as the market continues higher. A hidden bullish divergence occurs when price makes a higher low, but RSI forms a lower low, indicating that bearish momentum wasn’t strong enough to break the trend.
The key confirmation comes when price reclaims the pivot low, showing that buyers have defended the trend. An even stronger trading signal is when price breaks above the pivot high, confirming that bullish momentum is still intact and that the trend will likely continue.
For trade execution:
📌 Entry – After price reclaims the pivot low with a strong close.
🎯 Targets – Prior pivot highs, with a minimum 1:2 risk-to-reward ratio.
🔻 Stop Loss – Below the pivot low, minimizing downside risk.
This approach ensures traders stay aligned with the prevailing trend, focusing on continuation setups rather than premature reversals. For bearish setups, look for a pivot high instead, and for the price to close below the resistance.
| Key Considerations📌 Best Timeframes: This strategy is most effective on the Daily Chart or at least the 4H timeframe, where pivots hold more weight due to higher trading volumes and clearer market trends.📌 Extra Confirmation: For a more conservative approach, wait for a retest of support or resistance before committing to a trade. This helps filter out false breakouts and provides stronger confirmation. |
Trading the RSI Divergence Strategy After Pullback
The next strategy focuses solely on hidden divergences, which occur during a pullback in a broader trend. Hidden divergences suggest that momentum remains strong in the trend’s direction, offering an opportunity to enter before the trend resumes.
The Fibonnaci Retracement Tool is perfect for this strategy, as it helps identify “Secret” support and resistances within a trend. By marking the recent pivot low and pivot high, traders can identify key retracement levels, and only trade the pullback if it is supported by a Fib Level, for a high probability approach.
In the chart below, the S&P 500 (US500) was in an uptrend before forming a major pullback. As the pullback approaches the 78.60%, a hidden RSI Divergence is spotted, signalling a potential trade opportunity.
Then, when the price pushes back above the Fib Level with increased volume, we have our entry signal — giving us a clear timing to enter a long position on this pullback.
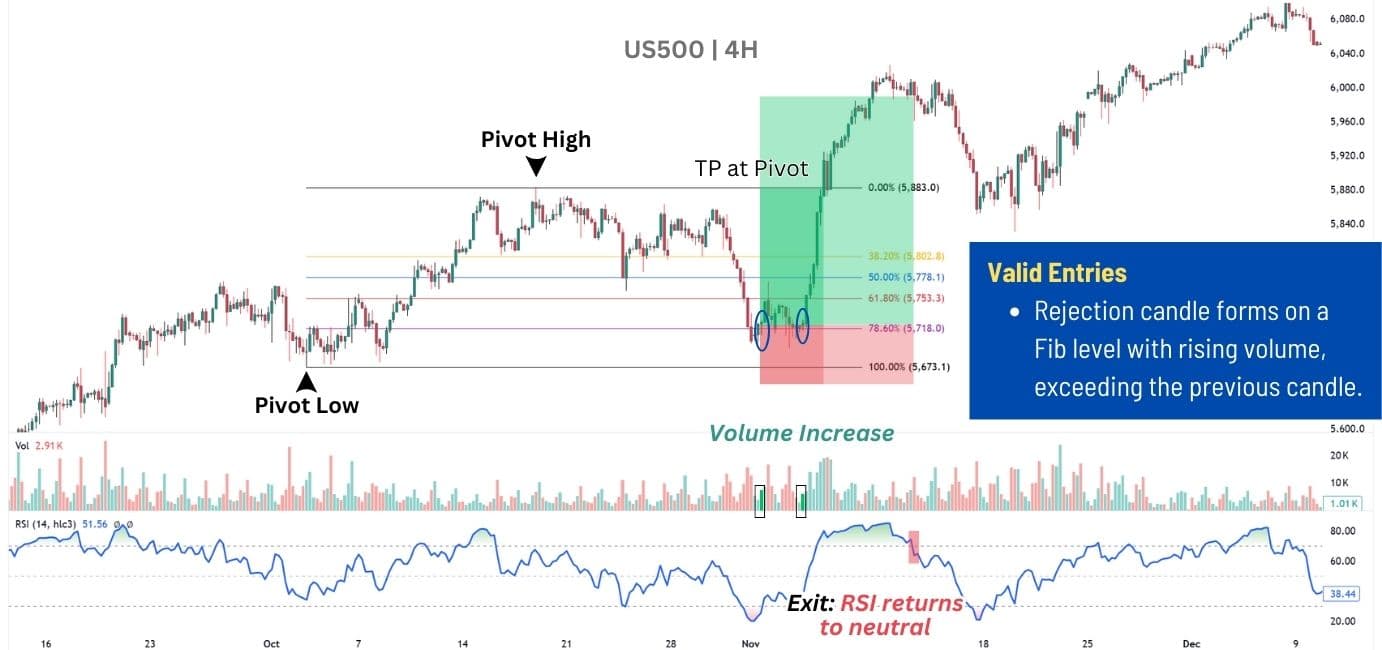
Trade Execution:
📌 Entry – Enter after price pulls back to a Fibonacci retracement level (38.2%, 50%, 61.8%, or 78.6%) and confirms a hidden RSI divergence in the direction of the trend.
🎯 Targets – Prior pivot highs/lows, as continuation moves often exceed these levels. However, since there’s a slight chance of failure, it’s wise to take partial profits here, letting the remaining trade run. Move stop loss to entry to secure gains.
📈 Trailing Target – After reaching the initial target, keep part of the trade open and wait for the RSI to reach extreme levels (above 70 or below 30), then fall back into neutral range— exit here. This is a sign that the continuation move may be coming to an end.
🔻 Stop Loss – Place the stop behind the nearest pivot relative to the entry point:
- For longs → Below the retracement low.
- For shorts → Above the retracement high.
The beauty of this approach is that it defines quality price levels for a pullback to end. When further combined with a volume increase, the probability of the pullback being over increases dramatically, giving us a quality entry point to trade.
Trading the RSI Divergence Strategy With the Moving Average Break
Moving Averages (MA) track an asset’s average price over a set number of candles, helping traders gauge whether price is above, below, or near the average. While primarily a trend-following tool, MA’s also offer insights into momentum: a break above or below a moving average could indicate a potential trend shift.
By pairing a divergence signal with an MA break, traders can better time entries into long or short positions that align with the divergence’s direction.
- The divergence provides our directional bias.
- The MA break helps with timing, signalling the potential start of a major move.
- The additional use of volume can add confirmation to our setup.
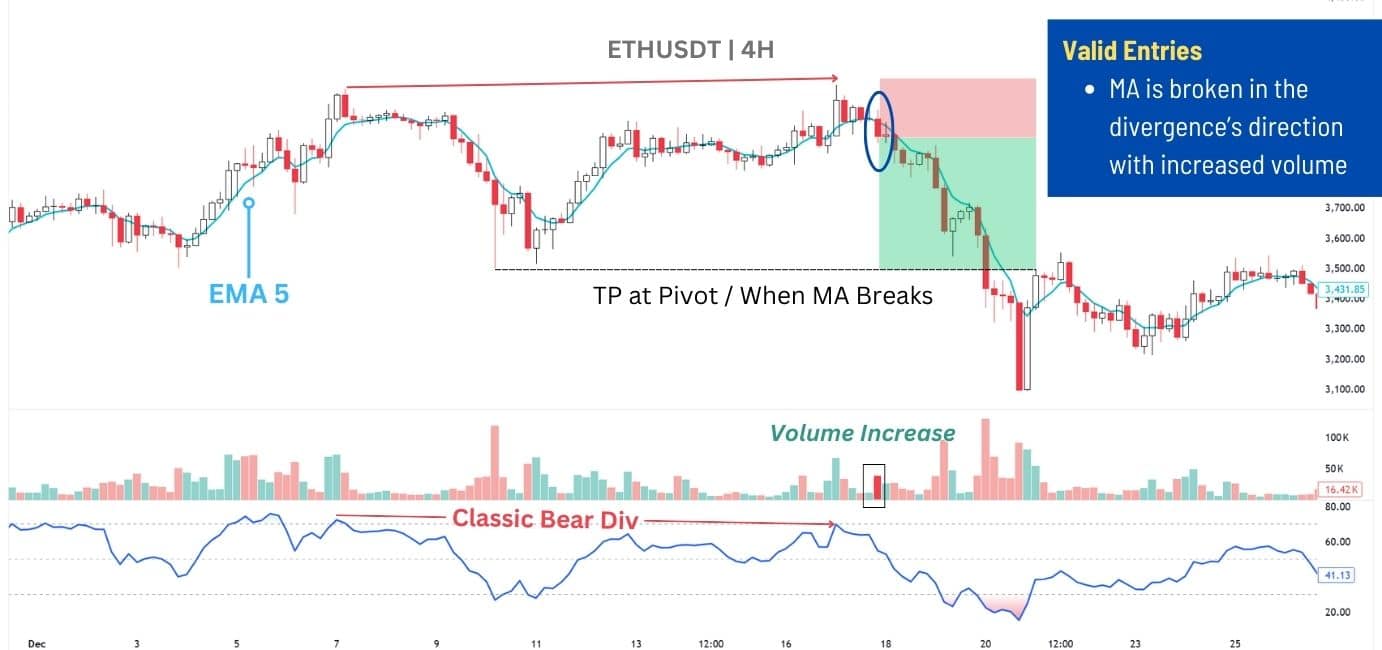
For this strategy, we recommend using a shorter moving average, like the 5 EMA (Exponential Moving Average), to track short-term trends. Since shorter MA’s closely follow price movements, a break in the direction of the divergence with strong volume can act as a logical confirmation that the divergence signal is likely playing out.
For Trade Execution:
📌 Entry – Enter after price breaks the 5 EMA with a significant volume increase, in the direction of the divergence.
🎯 Targets – Prior pivot levels, or use a 1:2 risk-to-reward ratio if the nearest pivot is too close.
🎢 Trailing Target – Once the initial target(s) are reached, leave a portion of the trade open and take profit when price breaks back through the 5 EMA. Then, set the stop loss to your entry.
🔻 Stop Loss – Place the stop behind the nearest pivot relative to the entry point:
- For longs → Below the nearest pivot low.
- For shorts → Above the nearest pivot high.
This approach allows traders to secure profits early while letting the trade run, adjusting risk dynamically as price action unfolds.
Trading RSI Divergence Strategy With the Moving Average Trend
Beyond being a trend filter, moving averages also act as secret dynamic supports and resistances. When price is above the MA, it acts as support, and when price is below, it acts as resistance.
The idea here is to trade a hidden RSI divergence when the price pulls back into an Exponential Moving Average, then clearly is rejected by the EMA – halting the pullback and signalling the start of a reversal.
For this strategy, we will use a Moving Average Ribbon, which is simply a combination of 4 different MA’s set at different lengths. The setting used here is the EMA 20/50/100/200, popular moving averages which tend to provide a reaction across many asset classes.
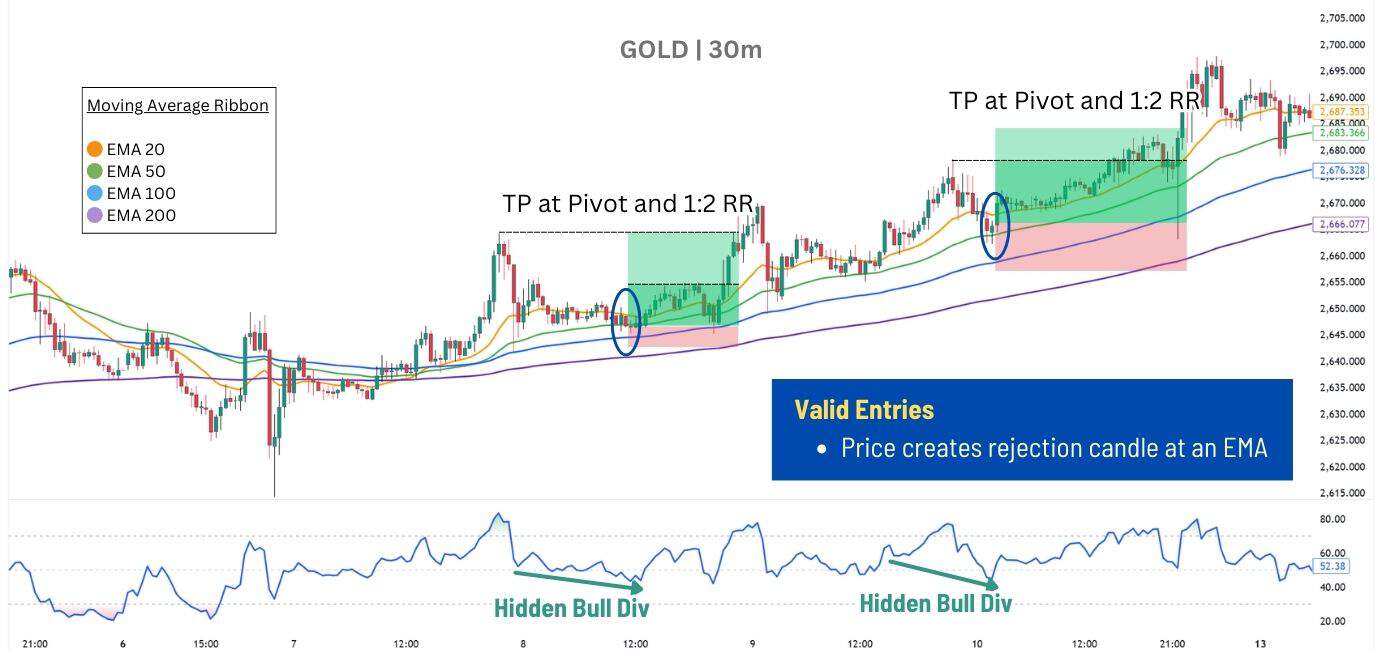
For Trade Execution:
📌 Entry – After a hidden RSI divergence forms, enter only if price creates a rejection candle at one of the EMA’s without breaking it. A rejection candle in a bullish trend would be a bullish candle, in a bearish trend, it’s a bearish candle.
🎯 Targets – Prior pivot highs/lows, or a 1:2 risk-to-reward ratio if the pivot is too close. You may also take profit at the first target, then move your stop loss to entry to secure profits.
🔻 Stop Loss – Place the stop behind the nearest pivot relative to the entry point:
- For longs → Below the next EMA. This means if price bounces at EMA 50, place stop below EMA 100.
- For shorts → Above the next EMA. This means if price rejects at EMA 50, place stops above EMA 100.
| Note: This strategy can be adapted with Simple Moving Averages, Volume-Weighted Moving Averages, or any other MA and lengths which may better fit your asset’s behaviour. |
RSI Divergence for Swing Traders
One of the biggest challenges with RSI divergence is its lack of precise entry signals—it signals a potential shift but doesn’t pinpoint the exact moment to jump in. This is where swing trading excels. Rather than chasing perfect entries, swing traders focus on riding the broader trend without stressing over exact timing.
Many swing traders stick with the default RSI-14 settings, but those looking for a longer-term perspective often use RSI settings between 21 and 30 to smooth out price fluctuations and get a clearer read on momentum.
Swing traders aim to capture big moves that can last days or even weeks, allowing for significant returns on a single trade—even if it means enduring some losses along the way.
Here is an example of the Moving Average Trend Strategy with RSI-21 settings, on the XAU/USD weekly chart:
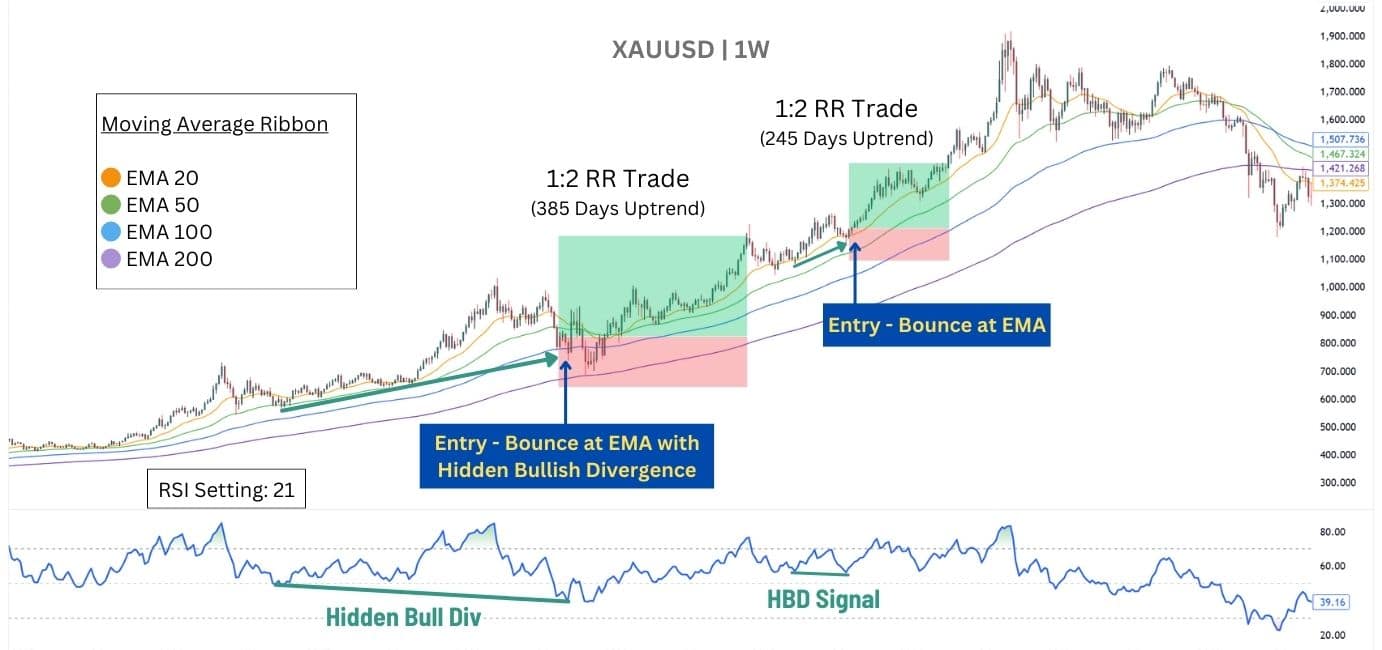
With a longer RSI setting such as 21-30, the divergence signal – especially if it’s a hidden one, can produce long lasting trends suitable for swing-trading. Notice how both trades in our example lasted for more than 200 days with a 1:2 RR.
RSI Failure Swing Trade
The RSI Failure Swing is the original method of trading the Regular RSI divergence, as designed by J. Welles Wilder. A bullish divergence is traded with a Failure Swing Top setup, while a bearish divergence is traded with a Failure Swing Bottom.
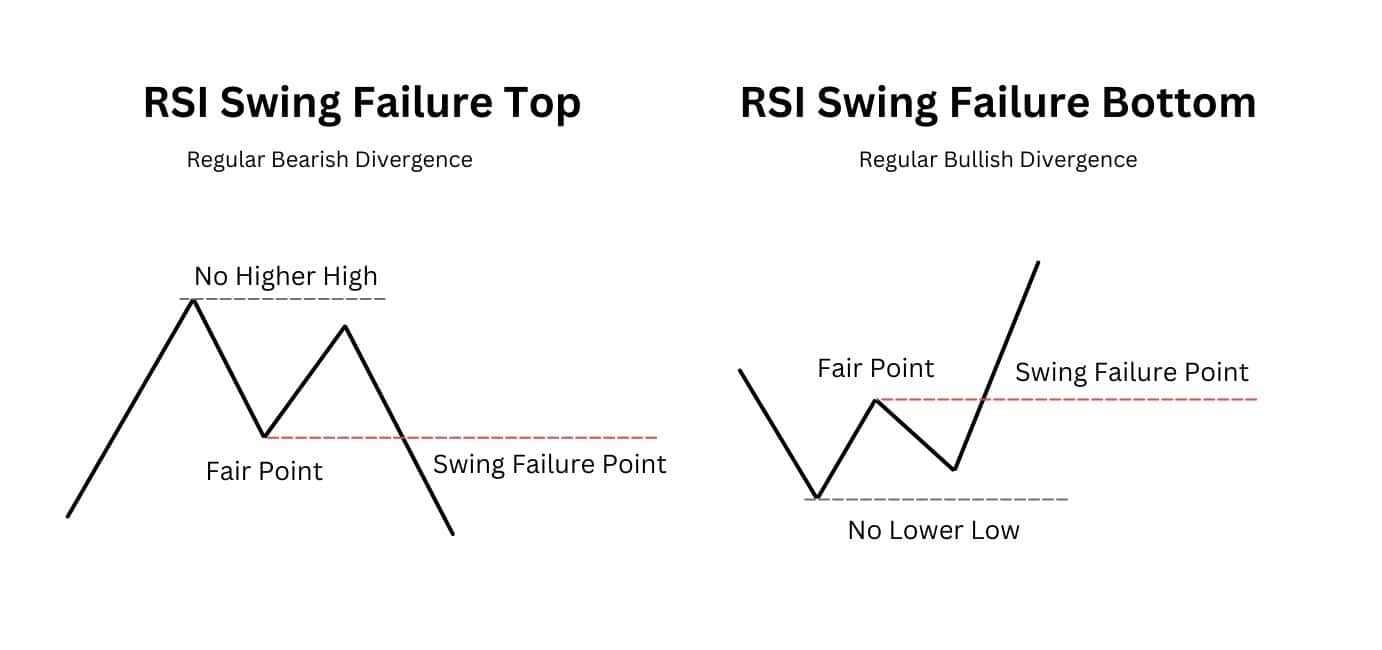
Instead of entering when RSI divergence appears, this strategy waits for confirmation by identifying a key RSI level—known as the “Fair Point”—and entering only when it breaks. When RSI fails to hold this midpoint level, the Failure Swing Point is triggered, confirming a strong momentum shift and a valid trade entry.
All in all, the setup can be broken down into three key elements:
- Highs/Lows: Focus on RSI highs for bearish divergence and lows for bullish divergence.
- Fair Point: The midpoint of the RSI divergence, acting as a temporary support or resistance.
- Failure Swing Point: The moment RSI breaks through the Fair Point, confirming a trend reversal.
Then, there are specific considerations for the RSI Fair Point (FP):
- Failure Swing Top: FP should not be below 50.
- Failure Swing Bottom: FP should not be above 50.
On an actual price chart, a failure swing setup would operate as such:
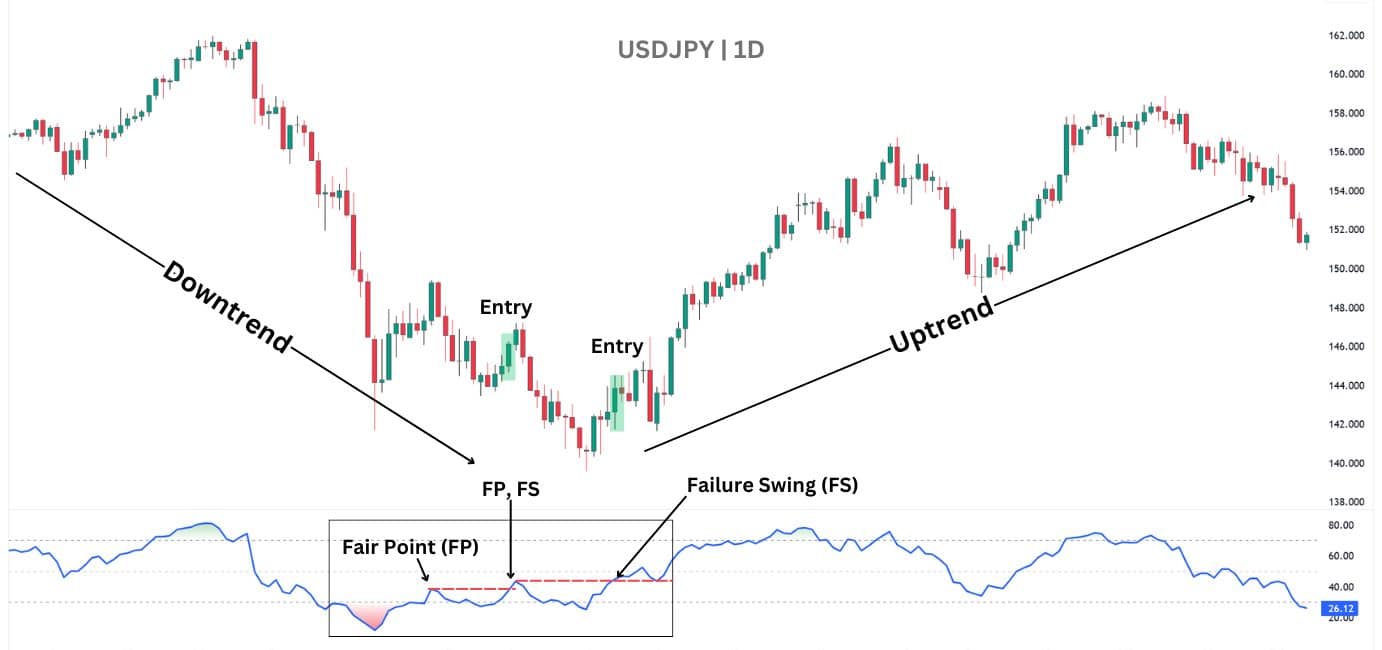
Notice how there are two entry signals in the example above, resulting in an overall 50% success rate. This highlights the potential for a RSI Failure Swing signal to result in an early entry.
However, with proper risk management, the RSI Failure Swing strategy can be a great addition to your trading — as it can lead to significant reversals with the regular RSI divergence.
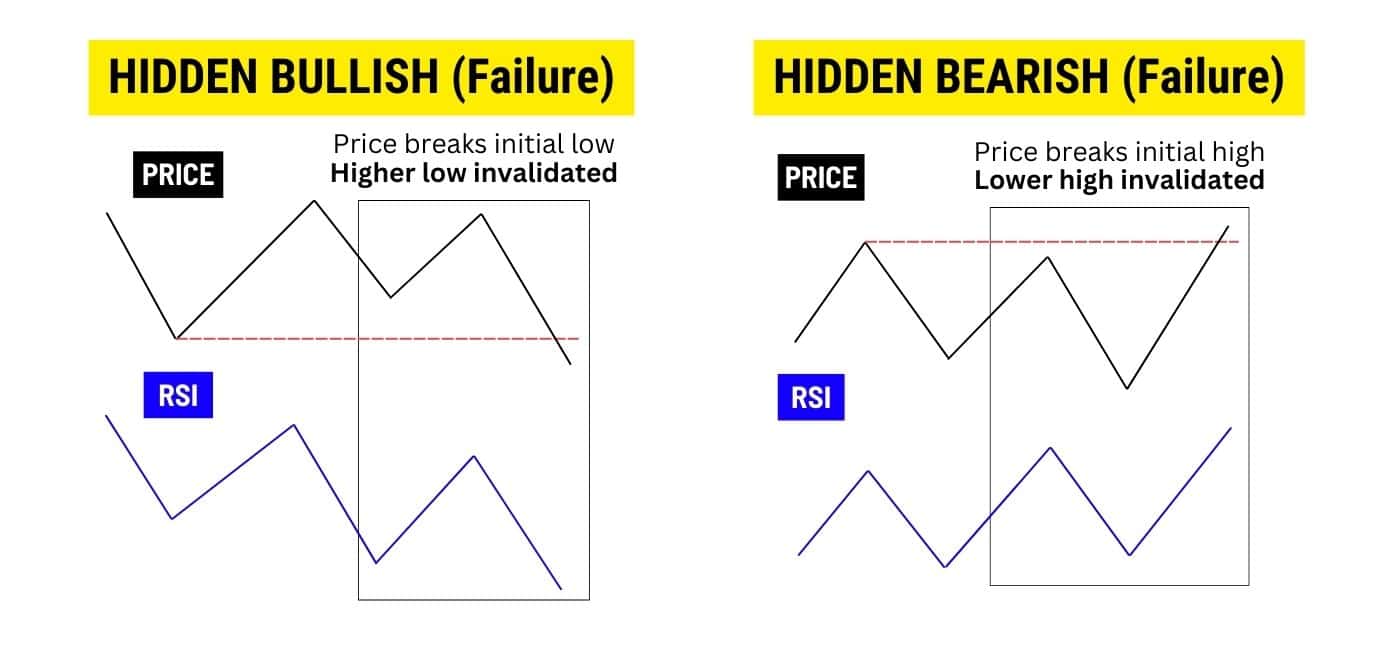
When Does RSI Divergence Fail?
Remember, each divergence has its own defined structure. If these structures are broken, then the RSI divergence has failed. To spot this easily, pay attention to the location of the initial low/high – whether it’s the price or RSI.
For regular divergences, pay attention to whether the initial low/high is broken on the RSI. If this happens, the divergence is invalidated:
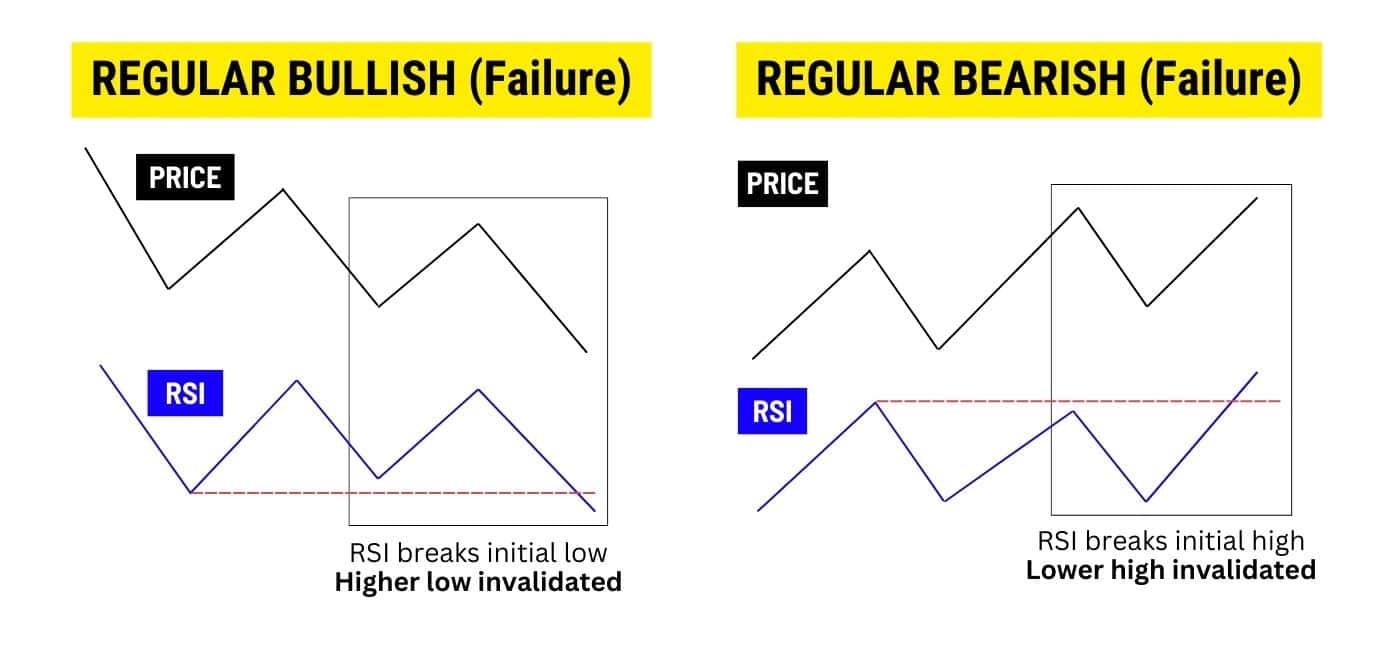
For hidden divergences, pay attention to where the closing price is instead:
RSI divergence fails most often in strong trending markets, where momentum keeps pushing price in the dominant direction. It also struggles when price action is choppy or range-bound, as frequent minor divergences can generate false signals.
Advantages of The RSI Divergence
Knowing how to identify RSI divergences can provide traders with many advantages:
- Early Warning Signal: The presence of an RSI divergence often signals a major price change in the short term. Traders can use this signal to either look for a trade position, or get out of an existing trade.
- Versatile: RSI Divergences can be spotted on any timeframe, making it suitable for all kinds of trading: scalping, day trading, and swing trading.
- Improves Probability: A divergence signals improving conditions for a major price move – therefore trading a divergence signal can improve your consistency in trading.
Disadvantages of The RSI Divergence
Despite clear advantages, using the RSI divergence comes with a suite of unique challenges:
- Confusing Signals (Hidden): Hidden RSI divergences can be difficult to spot initially, making it a challenge to trade. Additionally, they can appear alongside regular divergences, adding to the confusion.
- Uncertain Timing: RSI Divergences do not provide an exact timing into a reversal or continuation trade — wait for structure breaks, candlestick signals, volume spikes or more, before entering a trade..
- Less reliable in strong trends: In high-momentum markets, price can keep moving in the same direction despite divergence signals.
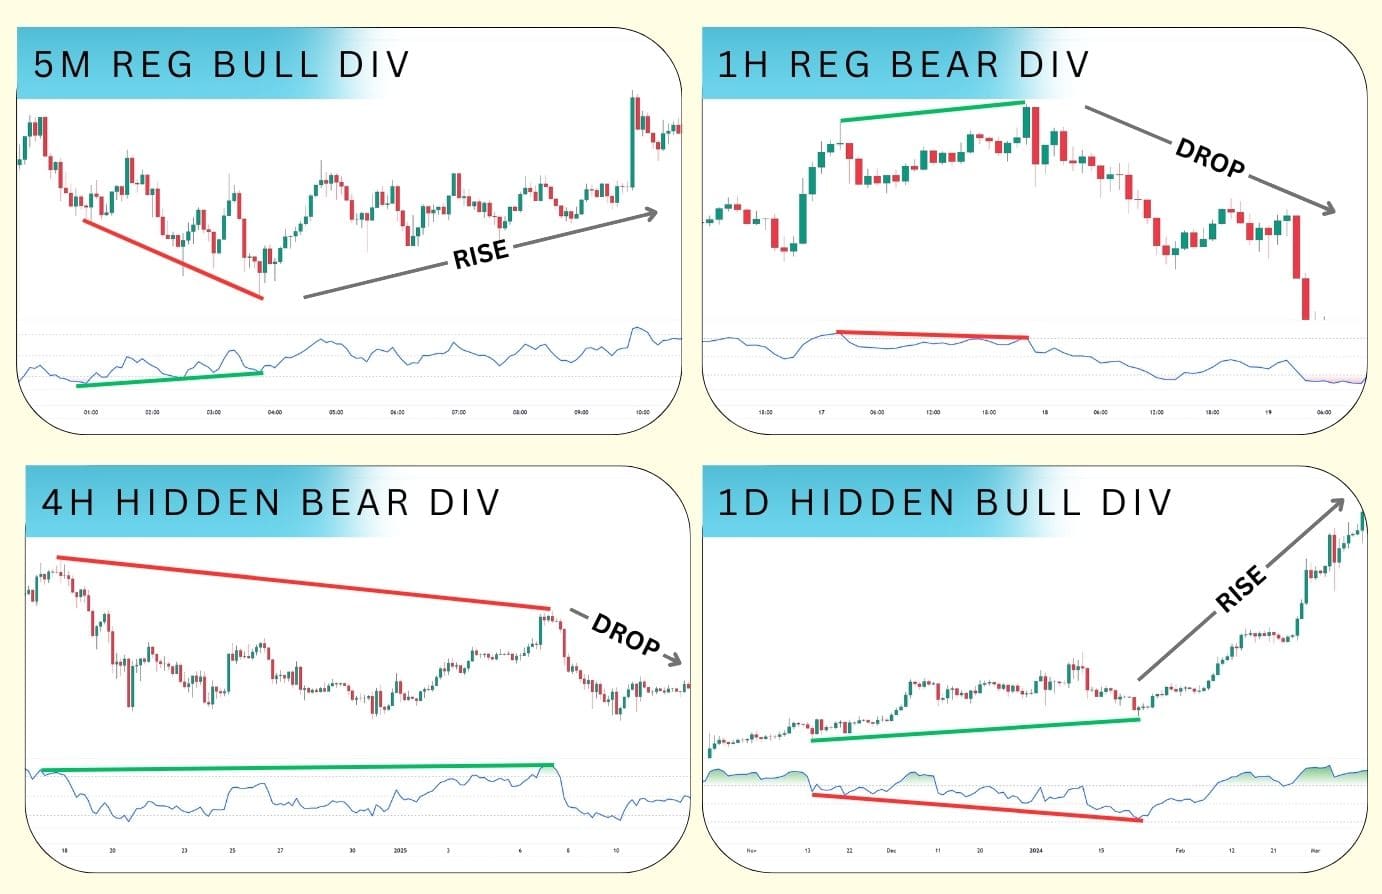
RSI Divergence in Forex Trading
RSI divergence is a popular tool in forex trading due to its simplicity, frequency, and versatility across any asset or timeframe. Divergences can appear anywhere from the 5 minute, 1-hour, or on the daily timeframe — and even on the seconds chart.
This makes it suitable for scalping, day trading, and swing trading in the forex, commodities, stocks, indices, and any other market.
However, keep in mind that RSI divergence should not be traded as a standalone signal. An RSI divergence does not signal an immediate major move, but rather, that the conditions for a major rally or decline are improving.
Using other technical factors such as a trendline, moving averages, or support and resistance, to confirm the RSI divergence’s reversal or continuation signal will be key to your ability to trading with consistency.
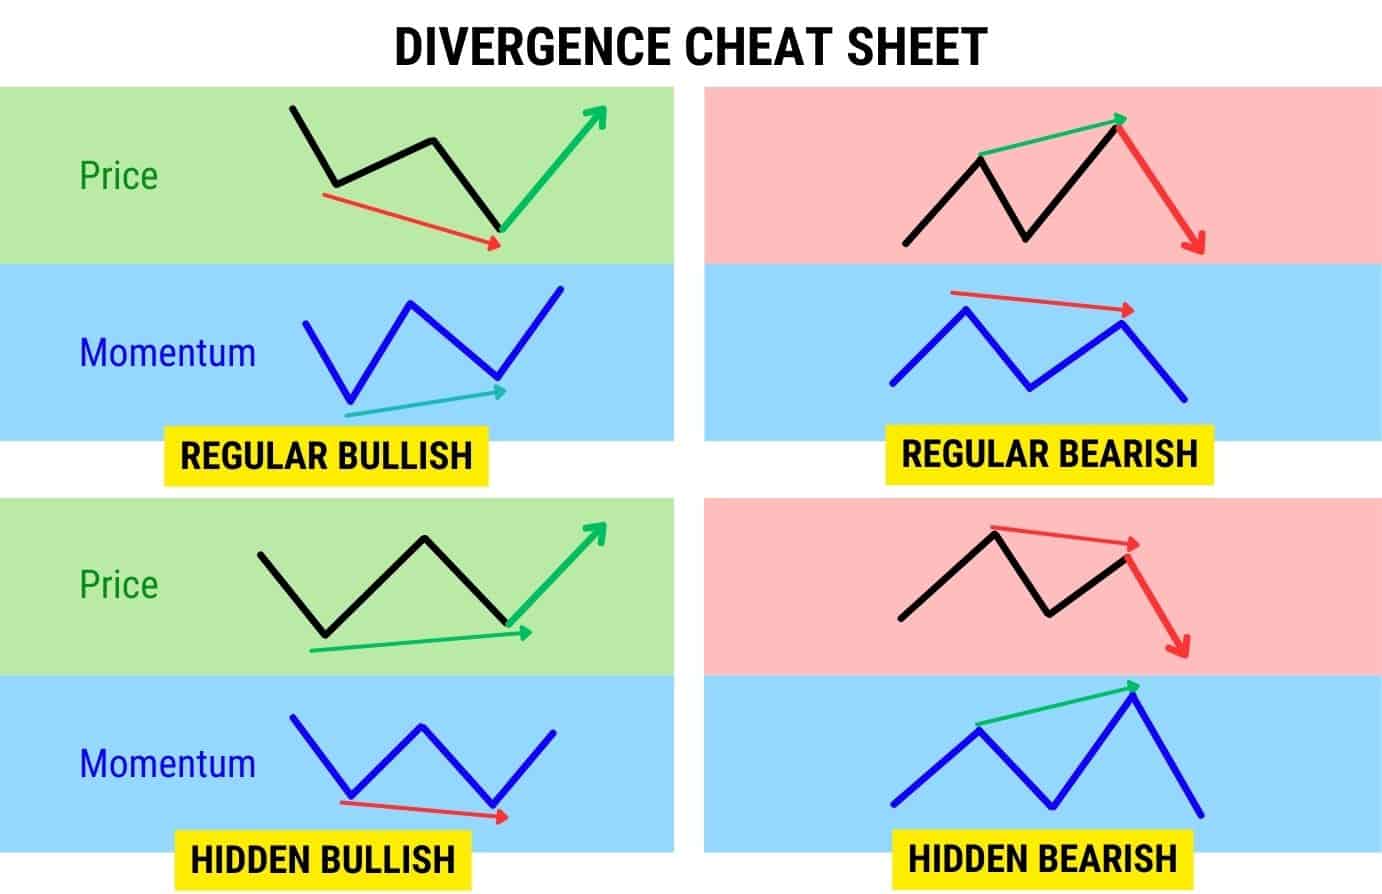
Divergence Cheat Sheet
Use this divergence cheat sheet to identify the different divergences immediately.
FAQs
Is RSI or MACD better for divergence?
It depends on your trading style and timeframe. RSI divergence reacts faster, making it better for short-term momentum shifts and reversals. It helps traders spot exhaustion points before price reverses. MACD divergence offers both fast and slow signals, but is in general a little slower than RSI divergence as it is based on moving averages.
What is the best RSI Divergence settings?
The default 14-period RSI works well for most setups, but adjustments can improve accuracy based on your trading style:
7-10 RSI: More responsive, good for scalping and intraday trading, but produces more false signals.
14 RSI: The standard setting as intended by J. Welles Wilder (the creator), offering a balance between speed and reliability.
21-30 RSI: Smoother signals, reducing false divergences, ideal for higher timeframes and swing trading.
Is RSI Divergence a Leading or Lagging Indicator?
RSI divergence doesn’t fit neatly into the category of leading or lagging—instead, it’s best described as a coincident indicator. It often appears before a price reversal, making it seem like a leading signal, but price doesn’t always react immediately. This lack of precise timing is why many traders hesitate to rely on divergence alone.
At its core, RSI divergence signals weakening momentum in the overarching trend or in the pullback. It does not predict a reversal or continuation with certainty, but rather tell us which scenario the market conditions are favouring.
Is RSI Divergence Profitable?
RSI divergence can be profitable, but only when used with the right confirmation tools. Many traders lose money by jumping into trades as soon as they spot divergence, only to watch price continue moving against them. The key to profitability is context—divergence must align with technical factors that support a reversal or continuation trade.
Is RSI Divergence Reliable?
While RSI divergence alone isn’t enough to consistently predict market movements, when used in the right market context, it becomes a powerful tool for spotting momentum exhaustion and potential reversals.
For example, divergence at a major support or resistance level has a much higher probability of success than divergence appearing randomly in the middle of a trend. Pairing RSI divergence with trendline breaks, volume spikes, or Fibonacci retracements dramatically improves its reliability.
What is the origins of RSI Divergence indicator
The Relative Strength Index (RSI) was developed by J. Welles Wilder Jr. in 1978, introduced in his book “New Concepts in Technical Trading Systems.” Originally, RSI was meant to identify overbought and oversold conditions. However, traders later discovered that divergences between RSI and price often signaled momentum shifts—leading to the RSI divergence strategy widely used today. Over time, RSI divergence became one of the most popular reversal indicators, as it helps traders spot weakening momentum.