


Written by:

Reviewed by:

- August 23, 2024
- 23 min read
Bollinger Bands® Explained
Bollinger Bands® are one of the best volatility indicators out there. Read on to find out how you can use it to improve trading decisions.
- Bollinger Bands are a volatility indicator represented by three lines plotted on the price chart.
- The upper and lower band levels widen during increasing volatility and contract during calm markets.
- The indicator provides a wide range of signals suitable for various trading strategies.
What Is the Bollinger Bands Indicator?
Bollinger Bands are a technical analysis tool used to determine an asset’s volatility level and other key aspects of price action. The indicator is quite popular among traders, who use it to assess the strength of an existing trend, anticipate a trend reversal, and find entry and exit points. It is the preferred tool among volatility indicators.
Bollinger Bands are plotted on the price action and represent three distinct lines, which we’ll discuss below.
The indicator has been around for about four decades and is the brainchild of John Bollinger, a US investor and analyst. At the time, Bollinger traded options, and he created the indicator to analyze financial markets, particularly equities. Still, many traders successfully implement it for other assets, including Forex pairs and commodities.
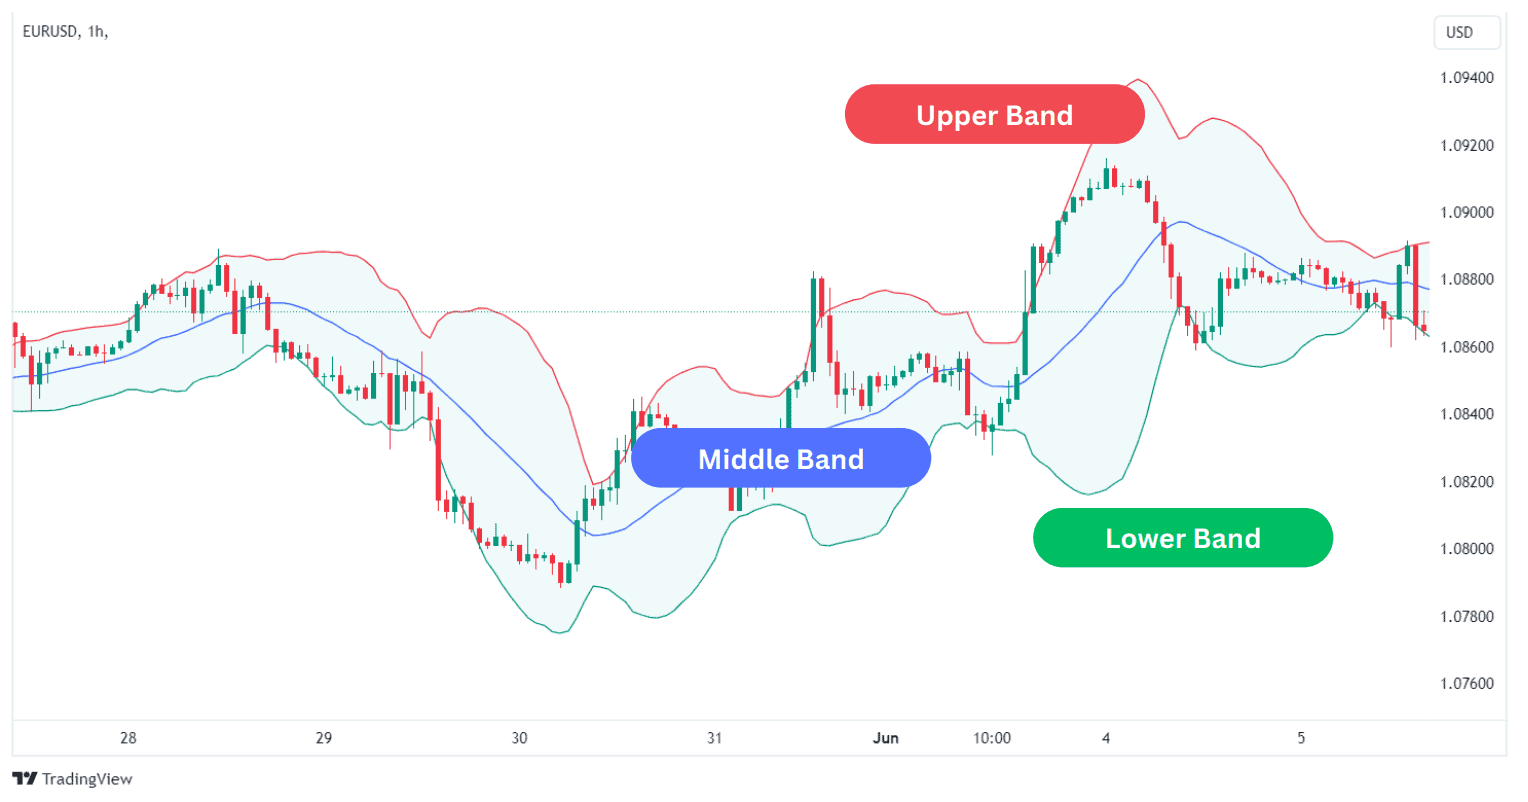
What Are the Three Lines of Bollinger Bands?
The Bollinger Bands consist of three lines: the upper, middle, and lower bands. When setting it up on the chart, traders usually specify the parameters of the middle line, which represents a simple moving average (SMA).
Let’s quickly explore the logic behind each line:
Upper Bollinger Band
The upper bollinger band line is calculated by adding two standard deviations (which can be adjusted) to the middle line. It can be treated as a dynamic resistance level.
Middle Bollinger Band
As mentioned, the middle band represents a simple moving average of the close prices over a certain number of periods. By default, the simple moving average is set at 20 periods. This means that on the daily chart, each point of the middle line represents the average price during the previous 20 days.
Lower Bollinger Band
The lower Bollinger band is calculated by subtracting two standard deviations from the simple moving average line. Traders may use it as a potential support level.

What Do Bollinger Bands Tell You?
The three lines of the Bollinger Bands form an envelope that encompasses the price action. Typically, the price tends to pull back to the middle line each time it touches one of the extreme bands.
Here are the main scenarios when you can use Bollinger Bands:
The Squeeze
A squeeze occurs when the bands contract, suggesting lower volatility.
A Bollinger Squeeze is generally not an ideal time for active trading. It suggests that the market is in a wait-and-see mode, getting ready for the next big move.
As a rule, low volatility markets precede major moves or breakouts, which is why traders watch squeezes very carefully to identify the best entry points for upcoming volatility bursts. The longer the squeeze, the greater the potential for a substantial breakout.
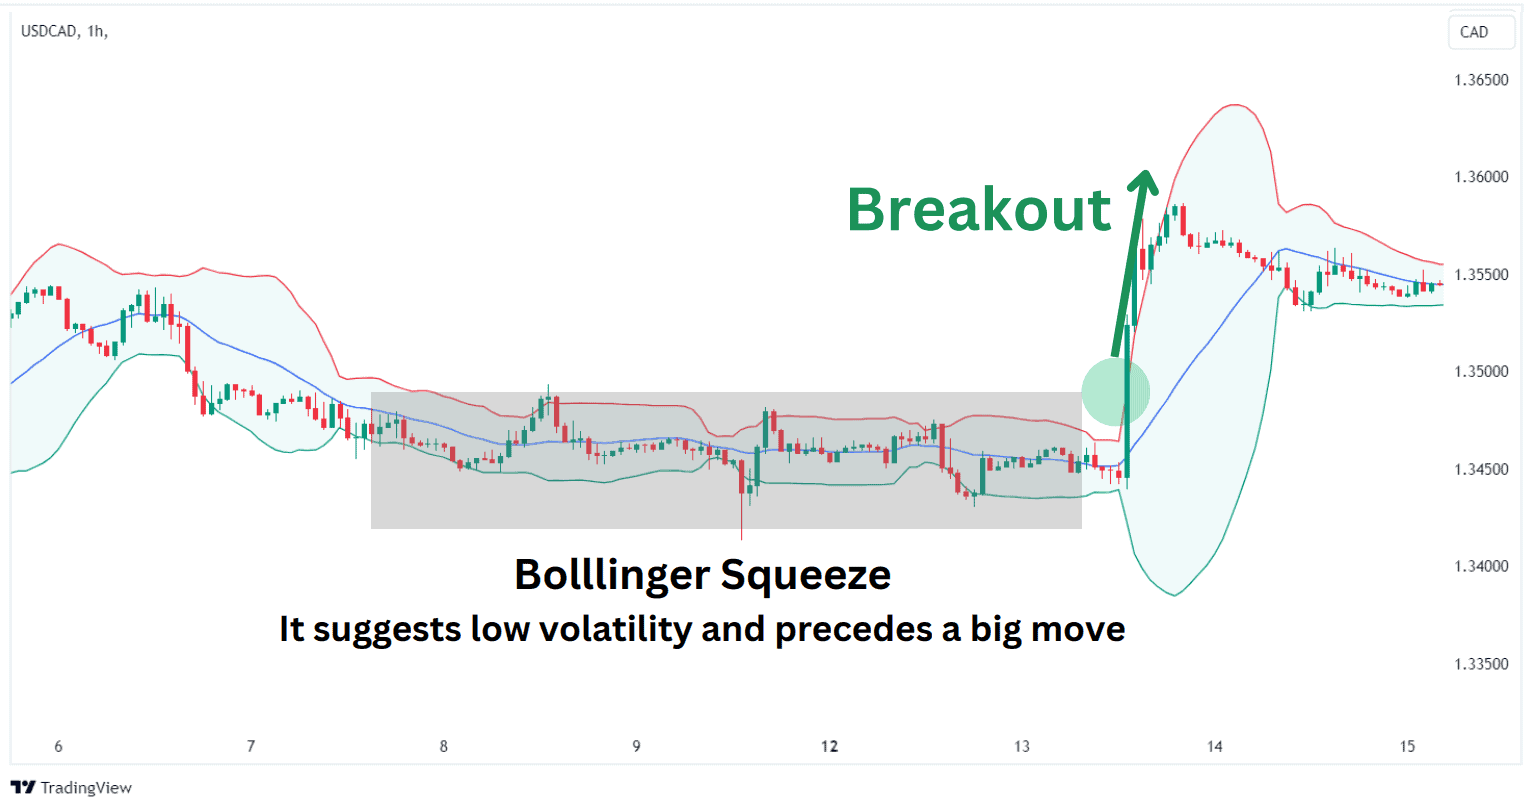
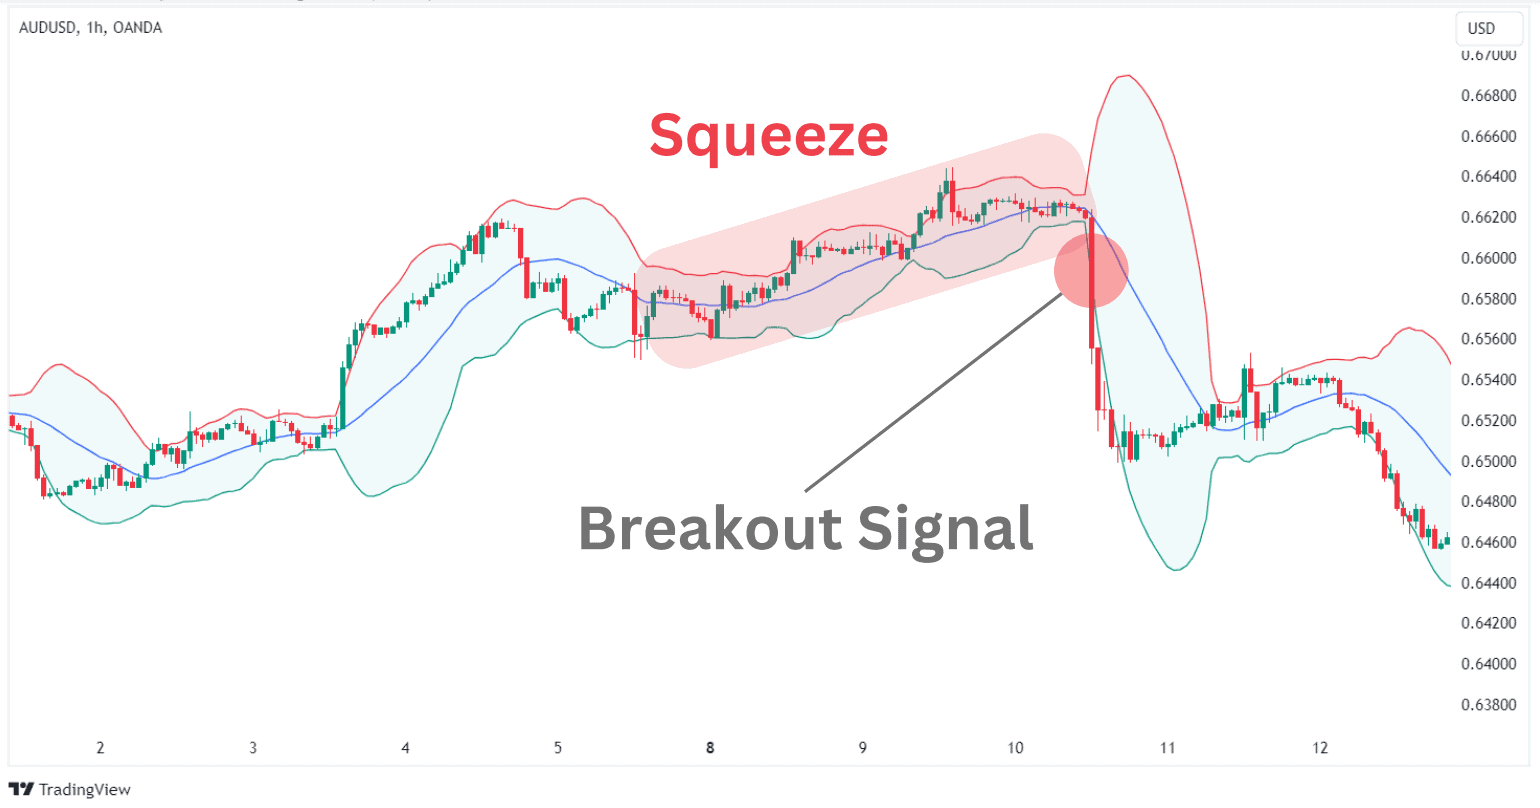
Breakouts
When the price breaks above the indicator’s upper band or below the lower band, it serves as a good signal to open positions in the direction of the breakout.
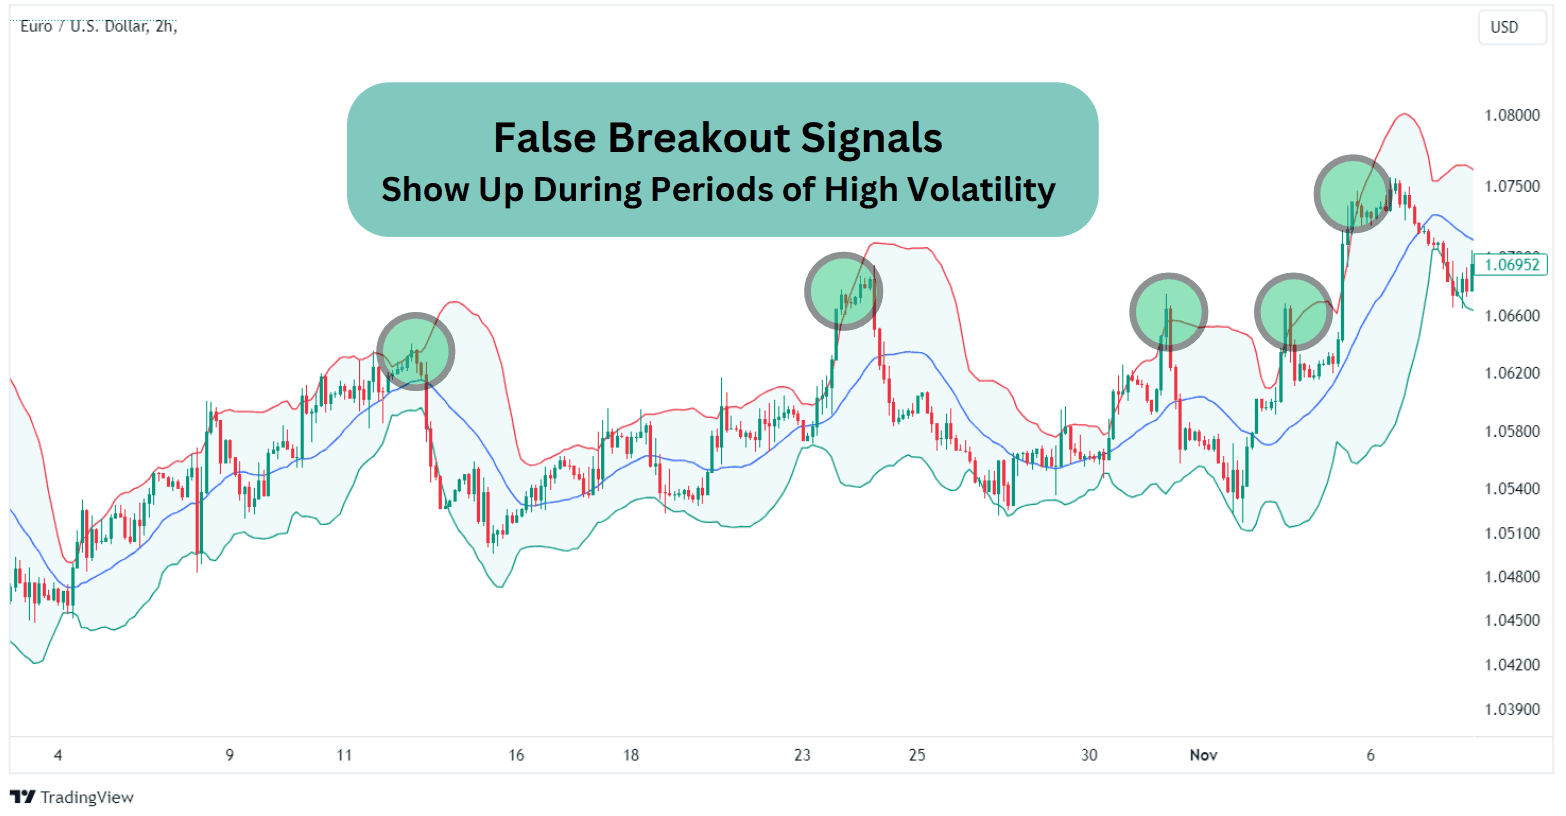
As mentioned, breakouts usually come after squeeze periods. They may also happen during periods of higher volatility when the price trades within a wide horizontal channel, but they shouldn’t be treated as reliable entry points as they often end up being false signals.
Other than that, breakouts occurring during widening bands following squeezes indicate more reliable entry signals, especially when accompanied by increasing volume.
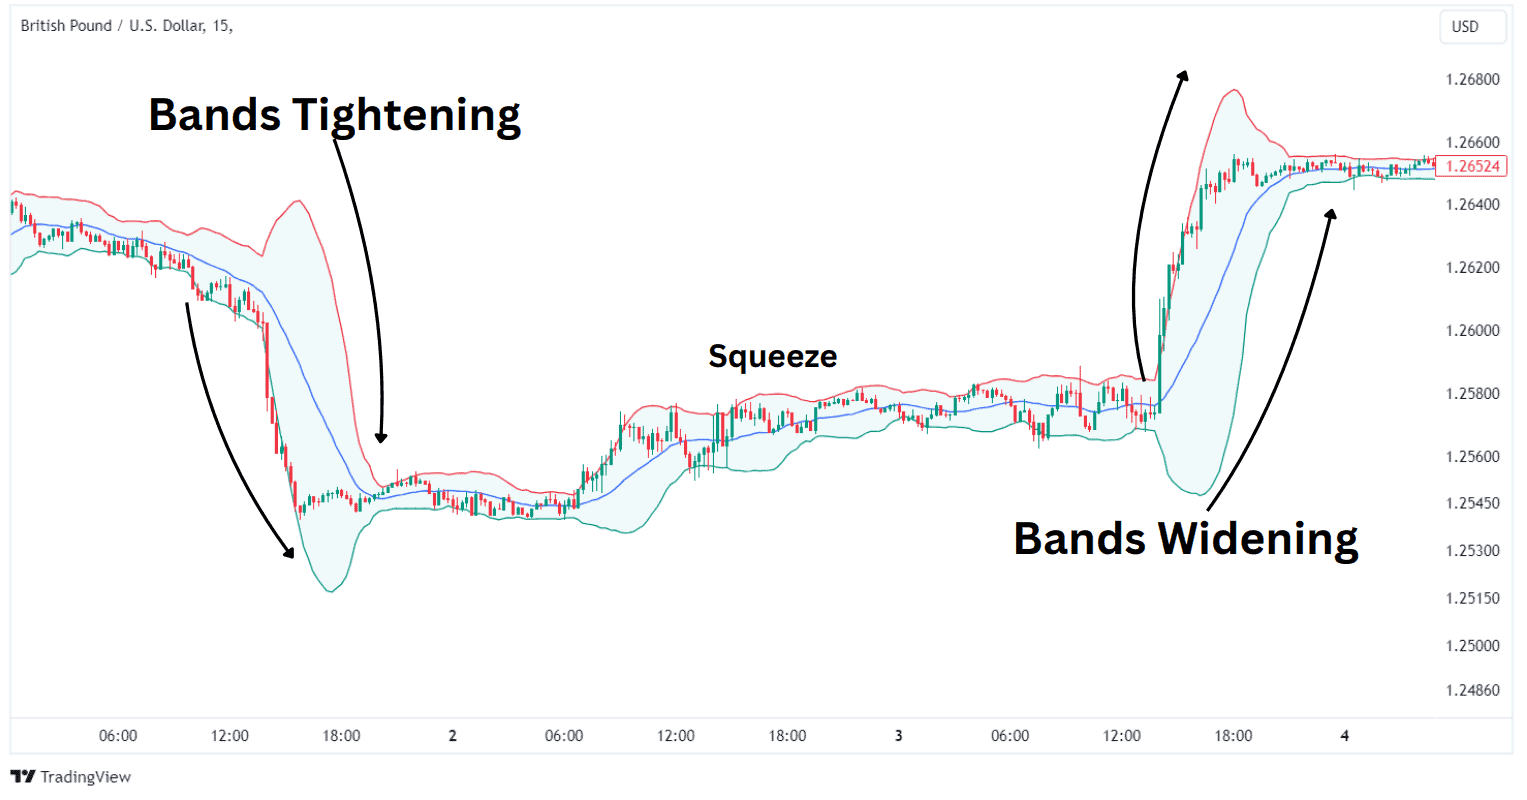
Bands Widening
Widening bands indicate an increase in price volatility, which often signals the start of a strong trend.
Given that the simple moving average is a lagging indicator, don’t expect widening bands as a precursor of a strong trend but rather as an indication of increasing volatility while the trend is already gaining traction.
Bands Tightening
Narrowing bands indicate a decrease in volatility, which usually happens during consolidation periods when bulls or bears are taking a pause to catch their breath.
Traders usually stay away from opening position during tightening bands, adjusting their risk management strategies. The resulting squeeze is marked by a state of ambiguity, when bulls and bears are reassessing market sentiment to prepare for the next big move. The price is usually quite unpredictable during contracting bands, as either side can emerge as a winner.
Bullish Bollinger Band Crossover
The bullish Bollinger Band crossover is confirmed when the price crosses the indicator’s upper band. It indicates that bulls have been able to push the price above local resistance, suggesting that they control the market. As mentioned, bullish crossovers are relevant after a Bollinger Band squeeze.
In the chart below, the share price of Chevron (NYSE: CVX) started to move sideways following a pronounced bearish trend, with the indicator forming a squeeze. Subsequently, the price started to cross the upper band on several occasions, providing robust signals of the formation of an uptrend.
Bearish Bollinger Band Crossover
In a similar fashion, a bearish Bollinger Band crossover happens when the price breaks the lower band of the indicator. While Bollinger Bands are not a momentum indicator, this occurrence may suggest that the asset is potentially oversold, with bears becoming the dominant force and pushing the price below the local support.
Again, this signal is especially relevant after periods of market consolidation and lower volatility. When the price breaks below the lower band after the squeeze, it can be used as a signal to open short positions.
In the chart below, the AUD/USD pair displays several bearish Bollinger Band crossover signals. You can see how the long red candle crosses below the lower band after a squeeze. In fact, prior to this, the chart also shows an example of a bullish crossover, so it captures both signals.
Importance of Bollinger Bands in Technical Analysis
The popularity of John Bollinger reflects the importance of the indicator in technical analysis. Here are a few reasons why it has caught the attention of traders:
- Bollinger Bands® offer a clear and intuitive way to visualize volatility.
- It provides entry points for opening positions as well as profit targets.
- It displays dynamic support and resistance levels.
- It can be treated as a momentum indicator, hinting at overbought and oversold levels when the price moves closer to the extreme bands.
- The indicator can be used to predict trend reversals.
- It works well with all types of asset classes, including equities, forex pairs, commodities, and even cryptocurrencies.
How to Calculate Bollinger Bands
To calculate Bollinger Bands, we have to understand two key elements:
- The SMA – it represents the average price over a number of periods. We calculate it by summing up the price closes over the last N periods and then dividing the result by the number of periods. Typically, the Bollinger Bands’ SMA is set at 20 periods by default.
- Standard deviation – the standard deviation of each band is calculated over the same number of periods and derives from the SMA.
What Are Standard Deviations?
For the uninitiated, standard deviations refer to a statistical concept used to show how dispersed numbers are relative to a given value, as shown in the image below.
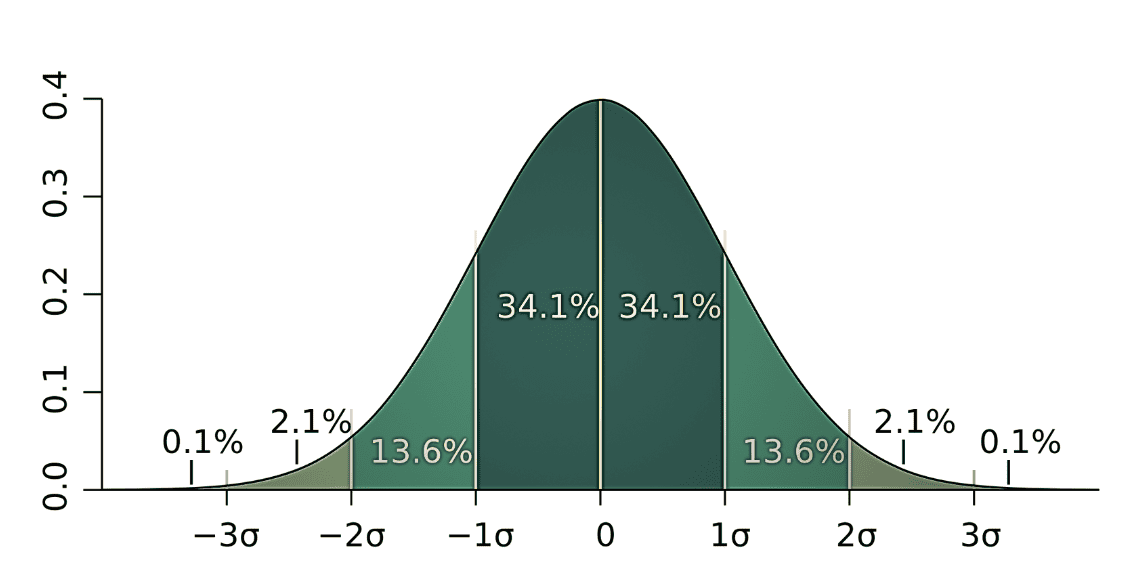
For example, if the indicator’s upper band is set at one standard deviation, this means that about 34% of recent price moves above the SMA are contained within the range between the SMA, which is used as a reference, and the upper band. Respectively, 68% of price closes are found between the two extreme bands.
The Bollinger Bands’ standard settings suggest that 95% of price moves are contained within the two extreme bands.
Bollinger Bands Formula
As noted, Bollinger Bands involve three components: the simple moving average and the upper and lower bands representing standard deviations.
Here is the default formula for each of these elements:
- Middle Band = N-period simple moving average (SMA)
- Upper Band = Middle Band + (the standard deviation of N-period prices * 2)
- Lower Band = Middle Band – (the standard deviation of N-period prices * 2)
In these simple formulas, N is the number of periods used for the SMA.
Experienced traders can also customize the indicator based on their needs. For example, short-term traders or scalpers may prefer to use the simple moving average for 10 periods with 1.5 standard deviations. On the other side, position traders may set the standard deviation at 2.5 instead of 2.0.
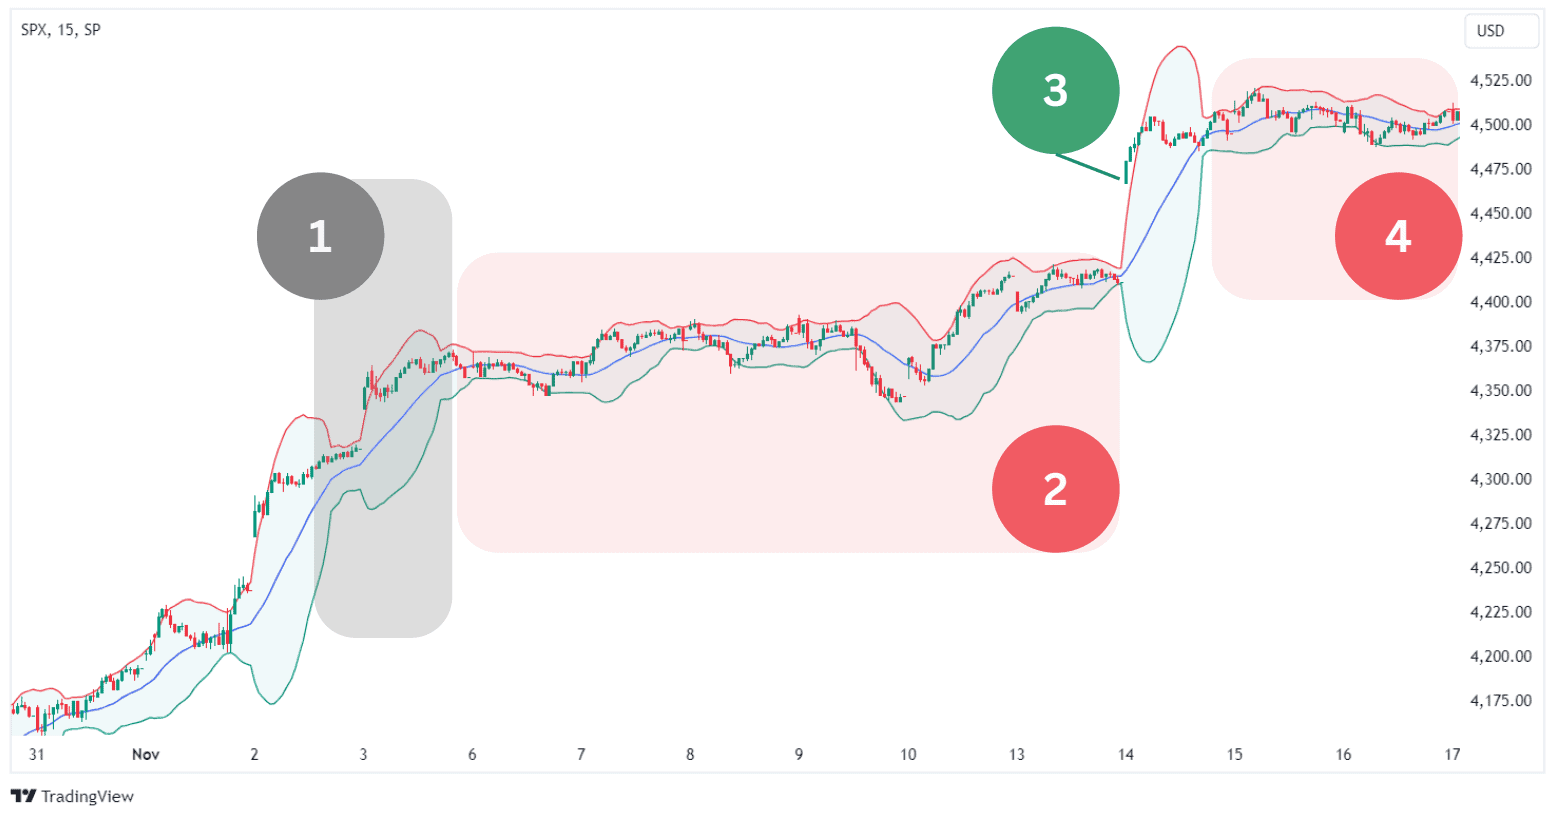
Bollinger Bands Example
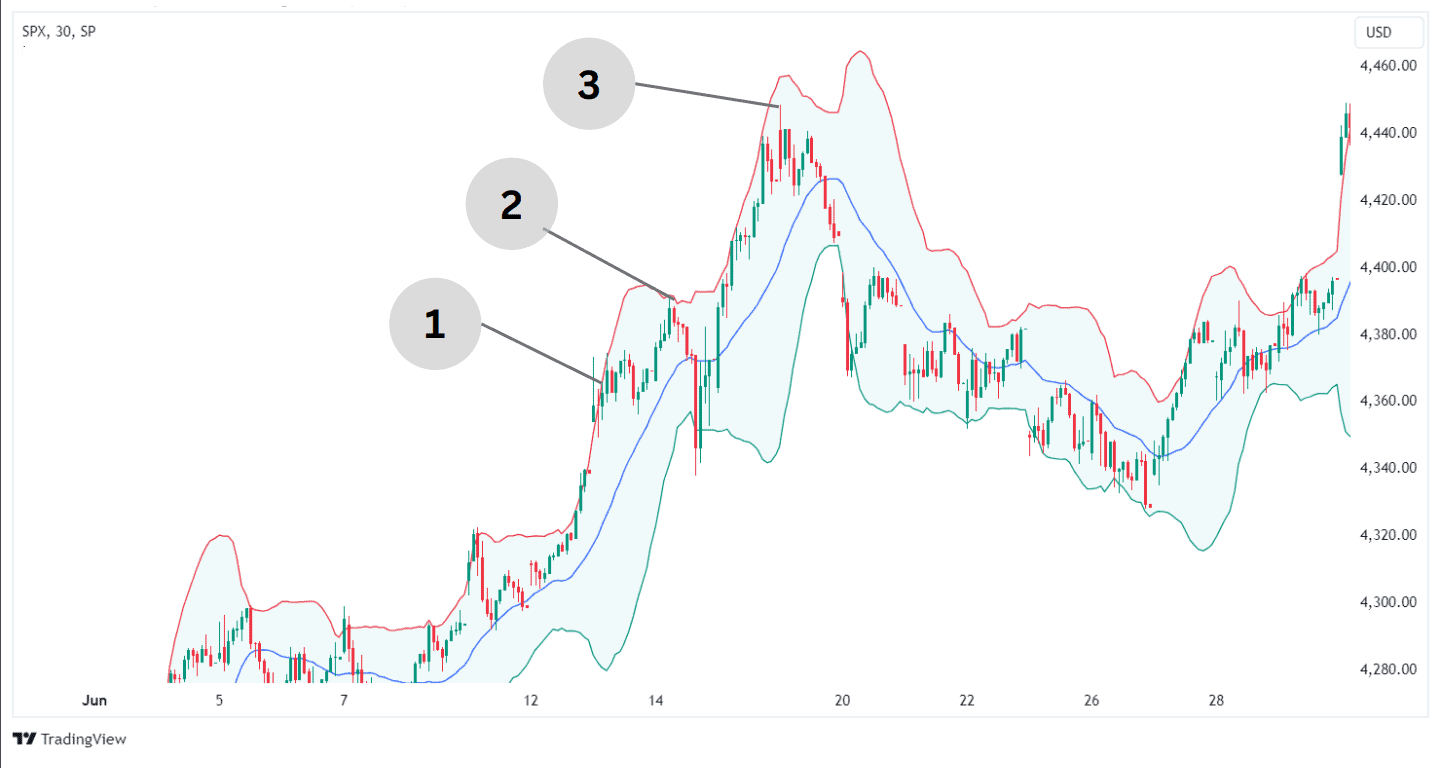
Let’s take a look at a Bollinger Band example displaying all the main scenarios, including contraction, squeeze, and widening.
The S&P 500 Index chart below shows how the extreme bands initially contract (1), followed by a period of consolidation (2). Subsequently, the index breaks above the upper band (3), although the trend continuation’s momentum decelerates, forming another squeeze (4).
Volatility and Bollinger Bands
Bollinger Bands are part of volatility indicators, which is a distinct category of technical analysis tools separate from trend-following, momentum, and volume indicators.
Visualizing volatility with Bollinger Bands is super easy:
- When the bands widen, this suggests increasing volatility.
- Narrowing bands point to declining volatility.
Types of Bollinger Bands Strategies
To get an idea of the versatility of the Bollinger Bands, consider the variety of strategies that it can be implemented with. Let’s briefly explore the main strategies powered by the indicator:
Bollinger Bands Mean Reversion Strategy
Previously, we described that when the Bollinger Bands are set at two standard deviations, then it is expected that 95% of the price action would be contained within the bands. Therefore, if the price is pressing outside of the bands, then there is a reasonable expectation that prices would press back towards the average.
This makes the Bollinger Bands a very useful tool when trading a mean reversion strategy. A mean reversion strategy simply means that when prices are too expensive, they’ll decline back towards an average level. The same is true if the price of an asset becomes too cheap, then value buyers will push the price back up to an average value.
The outer bands are seen as “too expensive” or “too cheap” levels and the middle line is the average (or mean).
More specifically, the Bollinger Bands Reversal strategy involves looking for the price action to touch either the upper or lower band and find resistance or support, respectively.
When the price touches one of the extreme bands, traders wait for a confirmation signal, like a candlestick pulling back towards the middle line.
Here are the main rules for the bullish reversal:
- Wait for the price to touch or break the lower band following a downtrend.
- Wait for a confirmation signal, e.g., the candle starts moving upward.
- Open a long position.
- Set a stop loss right below the lower band and be ready to take profits when the price touches the upper band.
Double Bollinger Bands Strategy
The double bollinger bands strategy is as the name suggests. Two sets of Bollinger Bands with different standard deviation settings are added to the chart to help the trader visualize strong trends that develop.
During strong trends, the bands may widen and remain wide, often hugging the upper band or lower band. Therefore, this strategy will use a smaller standard deviation that will cause the outer bands to get broken, indicating a strong trend. Then, if the price breaks the outer band of the larger standard deviation, then the trend may be close to consolidating or reversing.
Here’s how the strategy works.
Tools Needed:
- Add Bollinger Bands with 34 period simple moving average and 1 standard deviation
- Add a second Bollinger Bands with 34 period simple moving average and 2 standard deviations (make the color of the 2nd bands different from the color of the first bands)
Long Entry Rules:
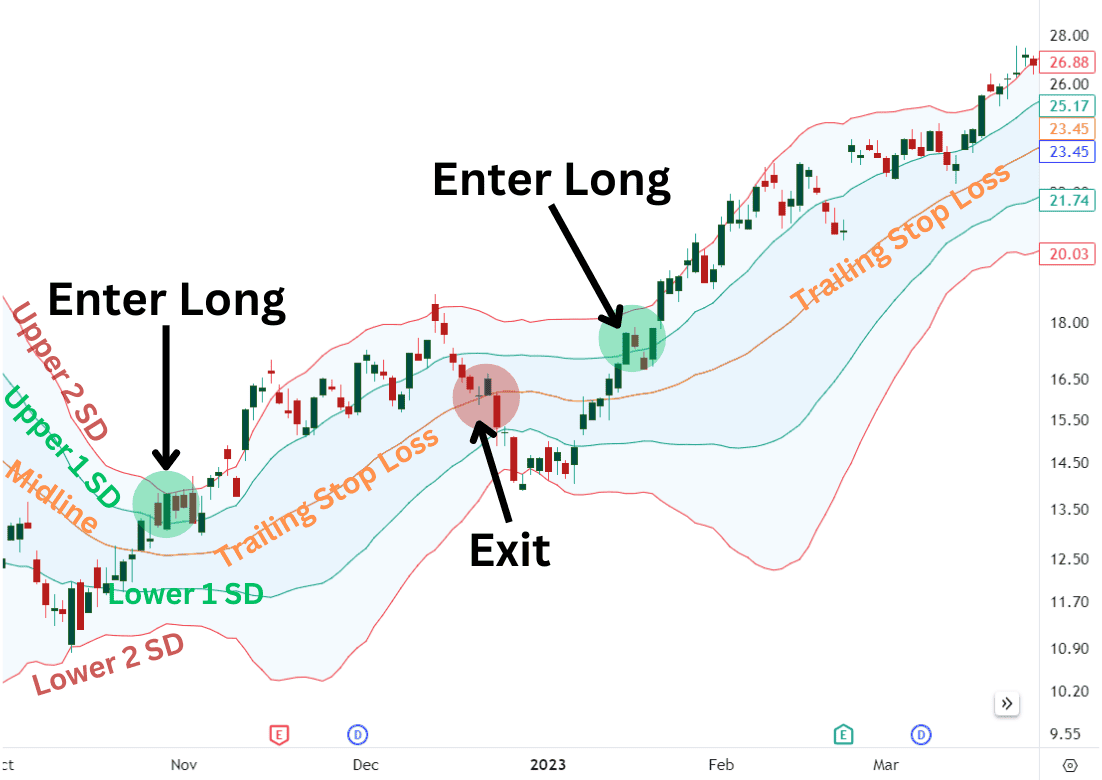
The chart above is Nvidia. A trader using this strategy would buy when the price closes above the 1-standard deviation band but below the 2-standard deviation band. This indicates a breakout and bullish momentum.
Risk can be set just below the moving average and use the moving average (middle band) as a trailing stop loss. The trade will end when the price returns to hit the moving average.
Short Entry Rules:
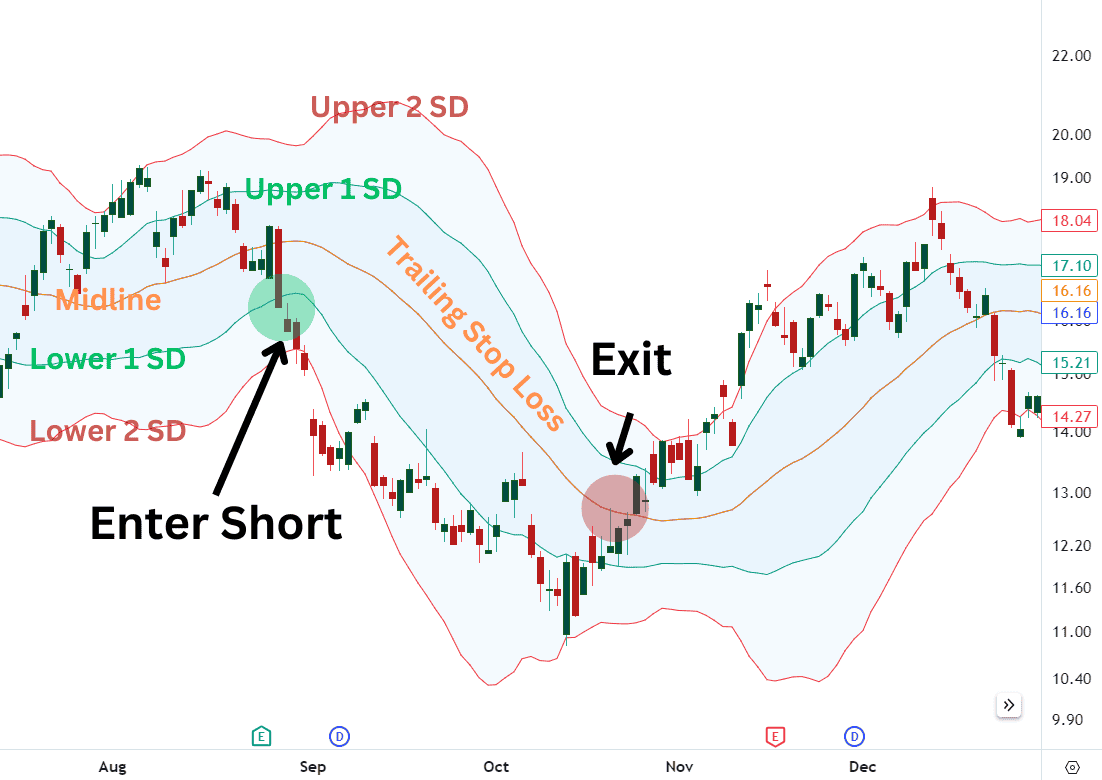
Staying with the same Nvidia chart, place a short entry when the price closes below the 1-standard deviation lower band but above the 2-standard deviation band. This indicates a bearish breakout.
Risk can be set just above the moving average (middle band) as a trailing stop loss.
Day Trading Uptrends with Bollinger Bands
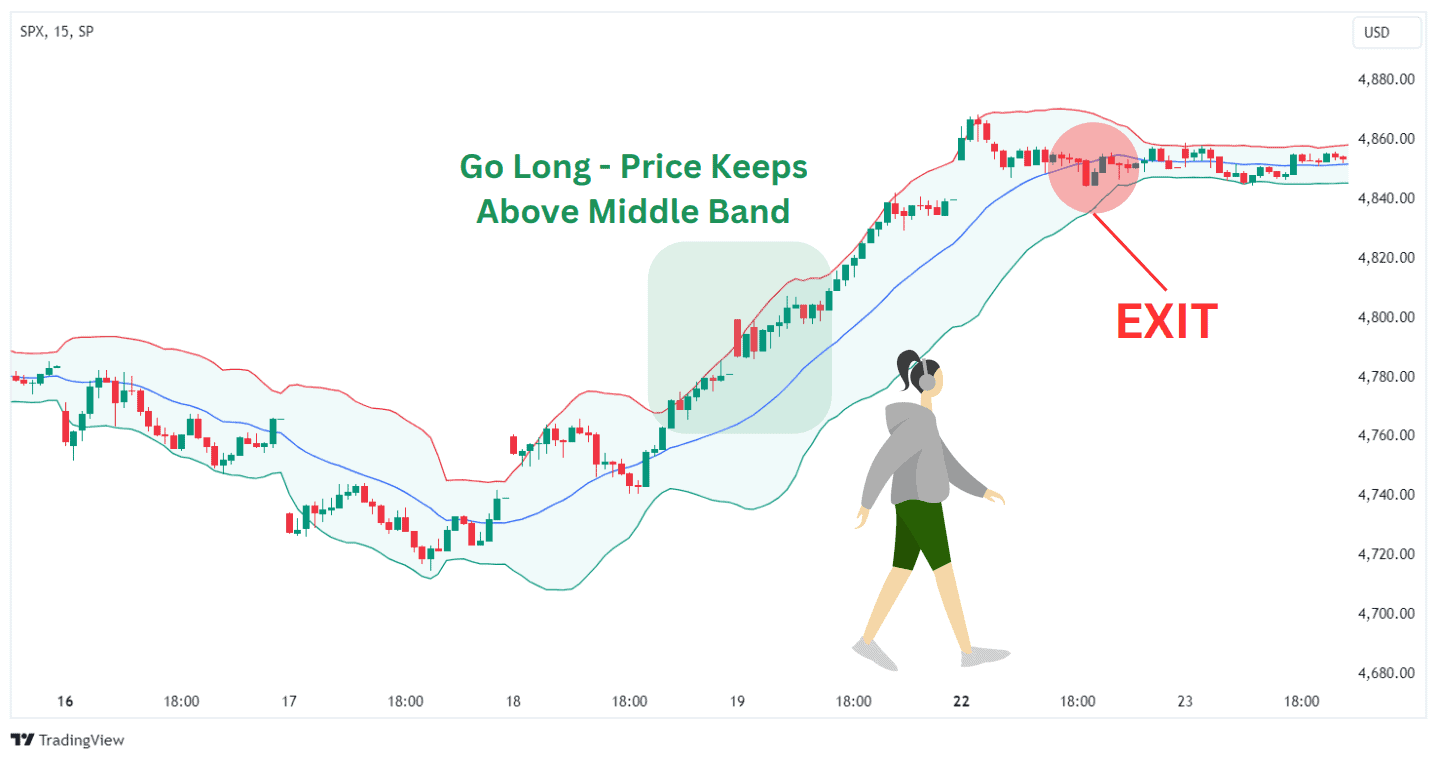
The indicator can be used to determine how strong an existing uptrend is. For example, when the price keeps moving above the middle line, it suggests that the uptrend doesn’t lose strength. If the uptrend is strong, the price will touch the upper band on multiple occasions.
A strong uptrend confirmed by Bollinger Bands can be a good occasion to open long positions. Day traders can use hourly, 15-minute, or even 1-minute charts to open short-term trades and close them within the same day.
Entry points can be considered when the price pulls back to the middle band and then resumes its upward movement. Keeping an eye on volume is essential to validate the strength of the trend.
It is recommended to close positions when the price breaks below the middle line.
Day Trading Downtrends With Bollinger Bands
Conversely, day trading downtrends with Bollinger Bands suggests opening intraday short positions when the price moves closer to the lower band, touching it on multiple occasions to form new lows. Given that many stock traders don’t prefer short trading, this strategy may be more popular with forex pairs.
If the price moves along the lower bands, it is a strong indication that the downtrend gains momentum. There are several scenarios pointing to a potential reversal calling for market exits:
- The price fails to touch the lower band for a significant period.
- The price touches the lower band and a newly formed green candle becomes longer than the previous two ones.
- The price crosses above the middle band.
Range Trading Using Bollinger Bands
Besides trend-following strategies, Bollinger Bands® can be used for range trading, i.e., trading when the price moves within a channel.
The basic rules are to buy when the price pulls back from the lower band and sell when the price retraces from the upper band.
The best scenario is when the price range is evident, with the highs and lows forming a horizontal channel. In this case, the resistance and support lines become more relevant as the market tests them multiple times.

When the price action breaks from the channel and forms a new trend, range trading should be abandoned.
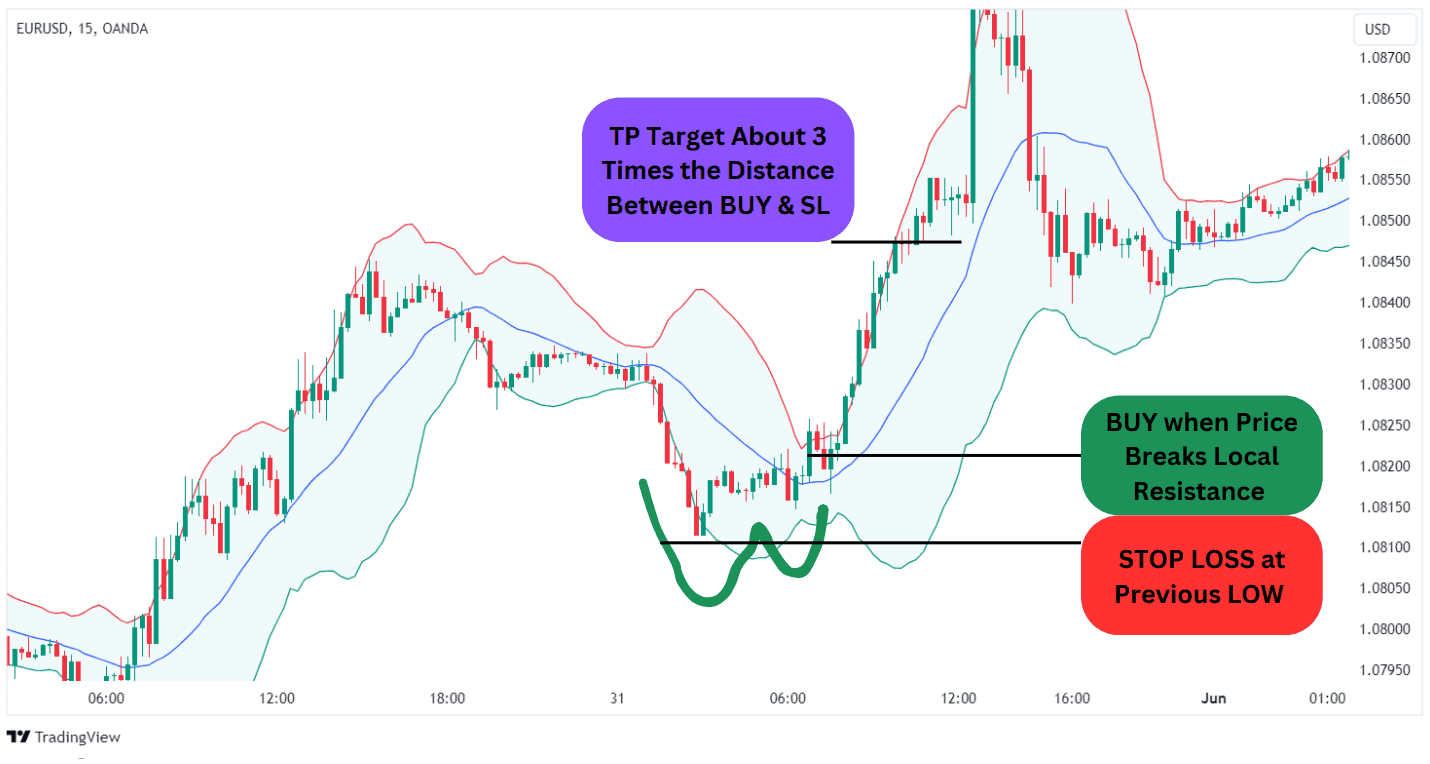
Trading W-Bottoms
W-bottoms are chart patterns that resemble the popular double bottoms, but they apply the Bollinger Bands indicator.
According to this trend reversal pattern, a W-bottom is confirmed when we observe two lows:
- The first bottom is slightly beneath the lower band.
- The second bottom is a bit higher compared to the previous one, and it must be inside the bands.
If you notice this scenario, you can go long when the price rebounds from the second low. Trading double bottoms is similar. In this case, you should take action when the price breaks above the pattern’s neckline.
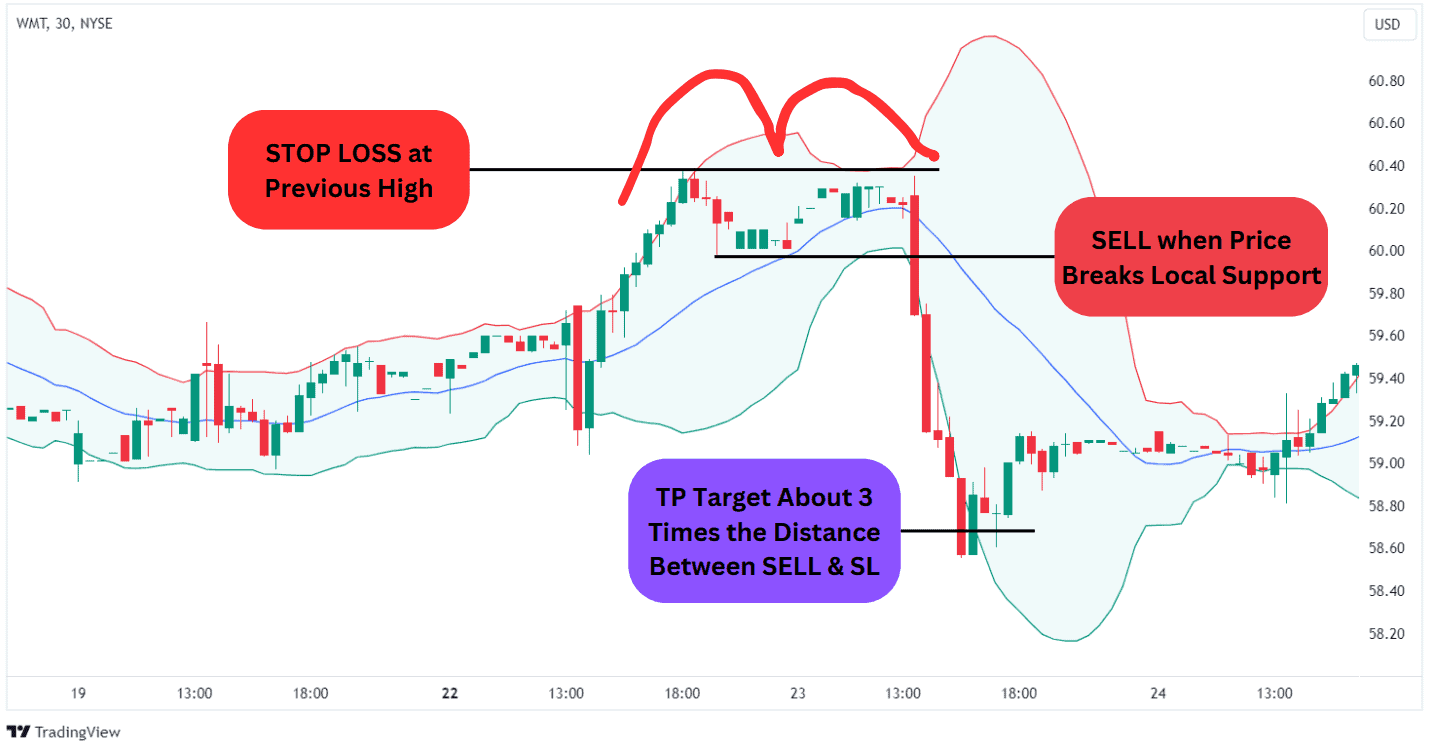
Trading M-Tops
M-tops are chart patterns that anticipate bearish moves, calling for short selling. Again, M-tops are very similar to double tops. If you weren’t using Bollinger Bands, you might probably treat them as such.
When the indicator is plotted on the price action, M-tops are confirmed when the following conditions are met:
- The price initially breaks above the upper band.
- It then pulls back towards the middle line.
- Eventually, it makes another attempt to test the previous resistance.
- The second top should remain inside the bands.
Short positions can be opened during the second pullback. When trading both double tops and M-tops, you can set the stop loss at the high.
Three Pushes to High
A “three pushes to high” pattern suggests that an existing uptrend is losing strength, and traders prepare to leverage the subsequent bearish move. Here is what it looks like on the chart:
- The price forms a local peak that breaks the indicator’s upper band.
- The second push forms a new high that touches the upper band without breaking it.
- Finally, a third push forms a higher high but within the upper band.
If this scenario is accompanied by decreasing volumes, it provides an even stronger bearish signal.
You can go short when the price touches the middle line and set the stop loss at the last high.
Signaling the Start or the End of Trends
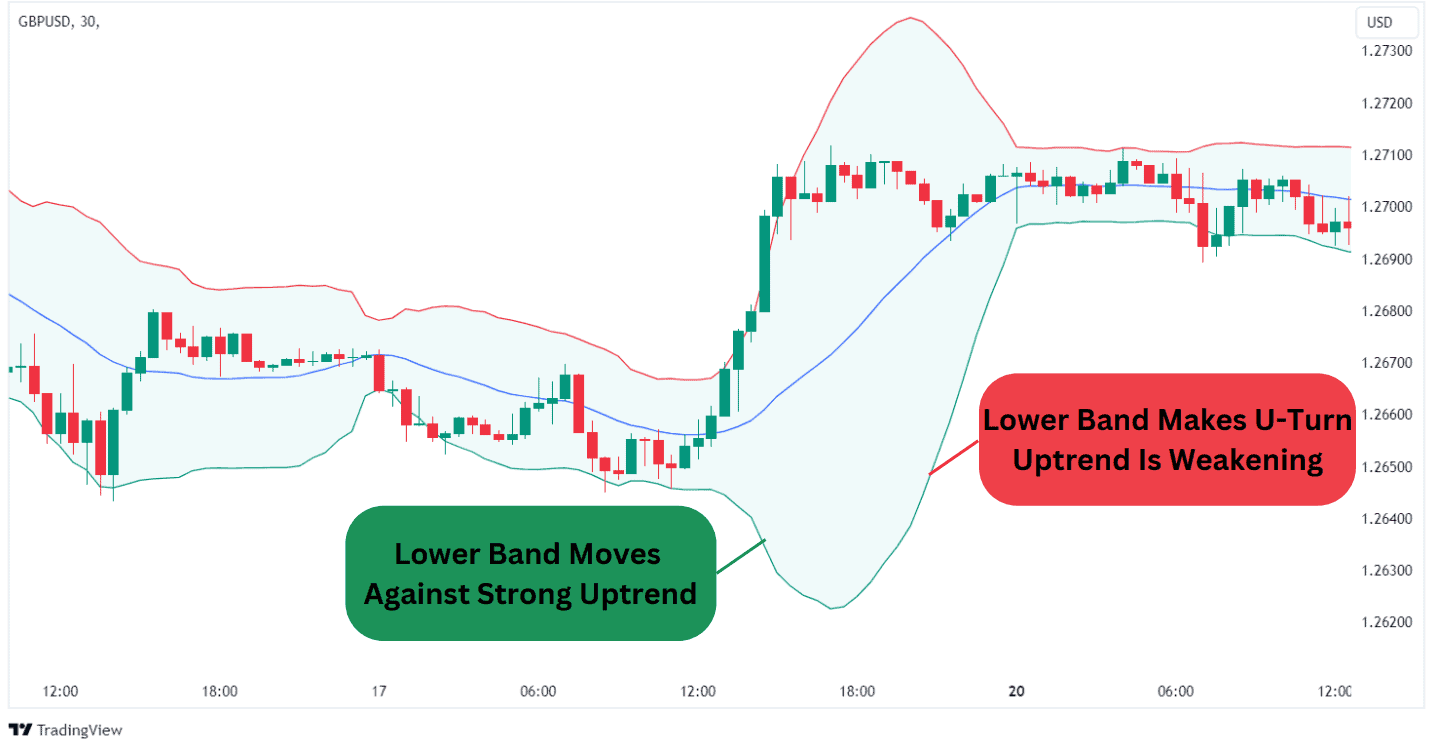
The Bollinger Bands can point to the start or the end of an existing trend.
Strong trends that form after a breakout of a resistance or support level lead to a sudden expansion in volatility, causing the extreme bands to move apart. In this case, if we have a strong uptrend, the lower band will move against it for a while. When the lower band turns upward, it suggests that the uptrend is losing strength.
You may use the indicator to observe the start and end of trends, but opening positions would require additional confirmations from other indicators or patterns.
Bollinger Bands Squeeze Strategy
As mentioned earlier, the Bollinger squeeze forms during periods of low volatility, when the market consolidates after a strong trend and is exploring opportunities for trend continuation or reversal.
When the extreme bands get close to one another, the squeeze is confirmed. So how should we trade in this case? No action is required during the squeeze, but when the price breaks through the upper or lower band, we should open positions in the direction of the breakout. Increasing volume during the breakout adds more credibility to the signal.
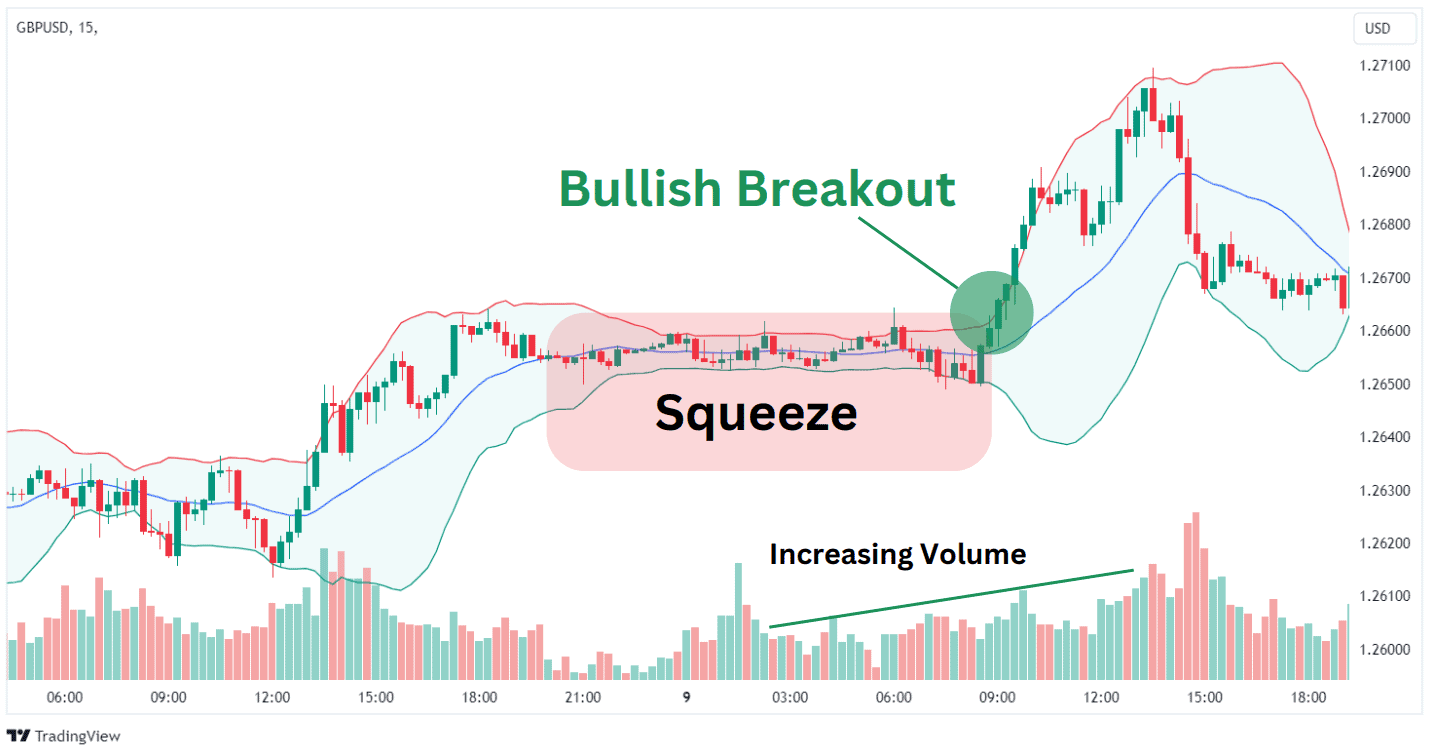
You can set the stop loss outside the squeeze on the opposite side of the breakout.
Walking the Bands
What’s interesting about Bollinger Bands is that it can be used in any situation. Besides range trading, you can consider it for trend-following strategies by ‘walking the bands,’ also referred to as ‘riding the bands.’
When the price ‘walks’ along the upper or lower band by touching it multiple times, it points to a strong uptrend or downtrend, respectively.
In an uptrend, you can go long between the upper and middle band and exit when the price breaks below the middle band.
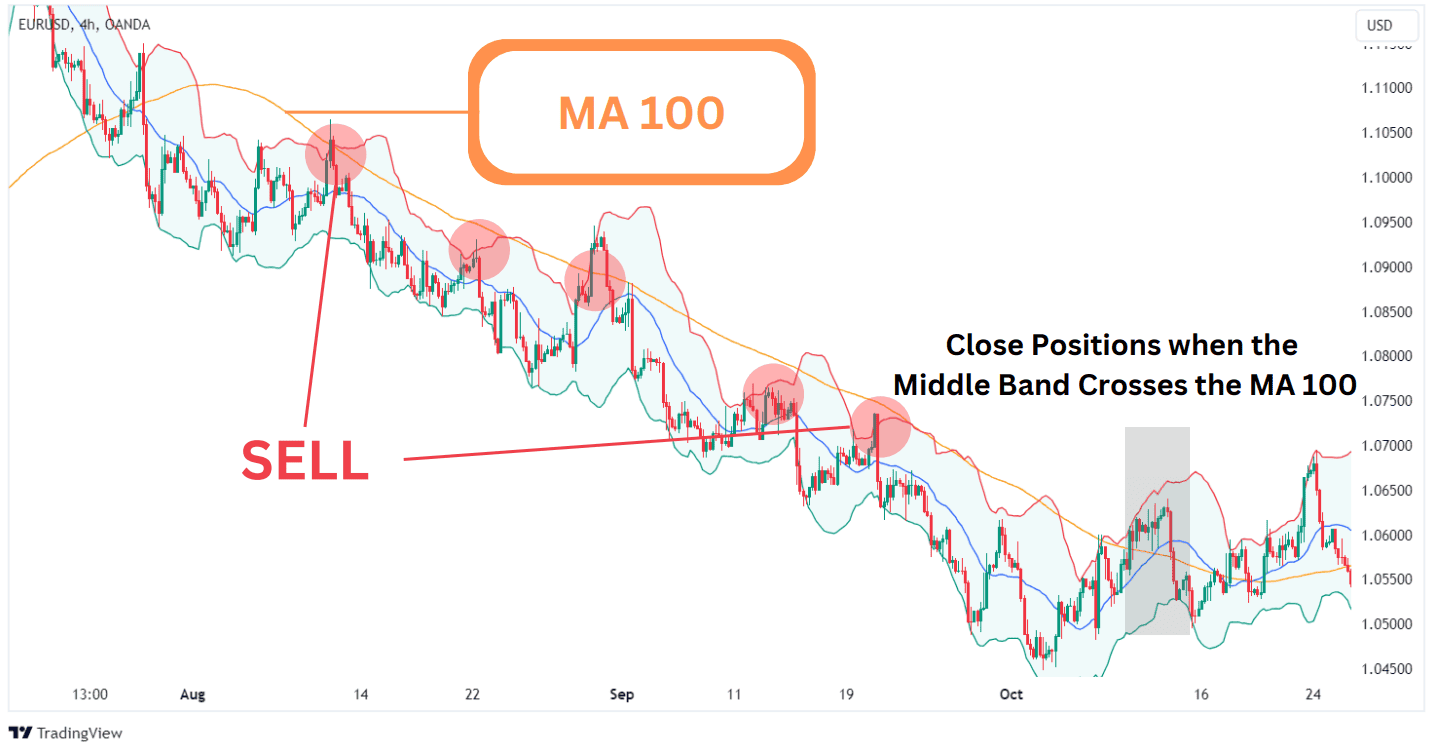
Moving Average Strategy
While Bollinger Bands depend on a short simple moving average, you can use a moving average (MA) with a much larger period, such as 100, as a trend filter to figure out the larger price movement.
You can treat the larger moving average as a support or resistance line for the existing general trend.
For example, if the price keeps trading below the moving average, you can open short positions every time it meets the upper band close to the moving average. You should close positions when the middle band breaks above the MA 100.
MACD Trading Strategy
The Moving Average Convergence Divergence (MACD) indicator can be used to confirm the signals provided by the Bollinger Bands.
MACD is a multifunctional momentum indicator. Here is how to use thing MACD and Bollinger Bands combo:
- Open long positions when the MACD line (it’s colored blue on TradingView) crosses the signal line (colored red) from bottom to top, while the price action crosses the Bollinger Bands’ middle line.
- You should go short when the MACD line crosses below the signal line while the price breaks below Bollinger’s middle band.
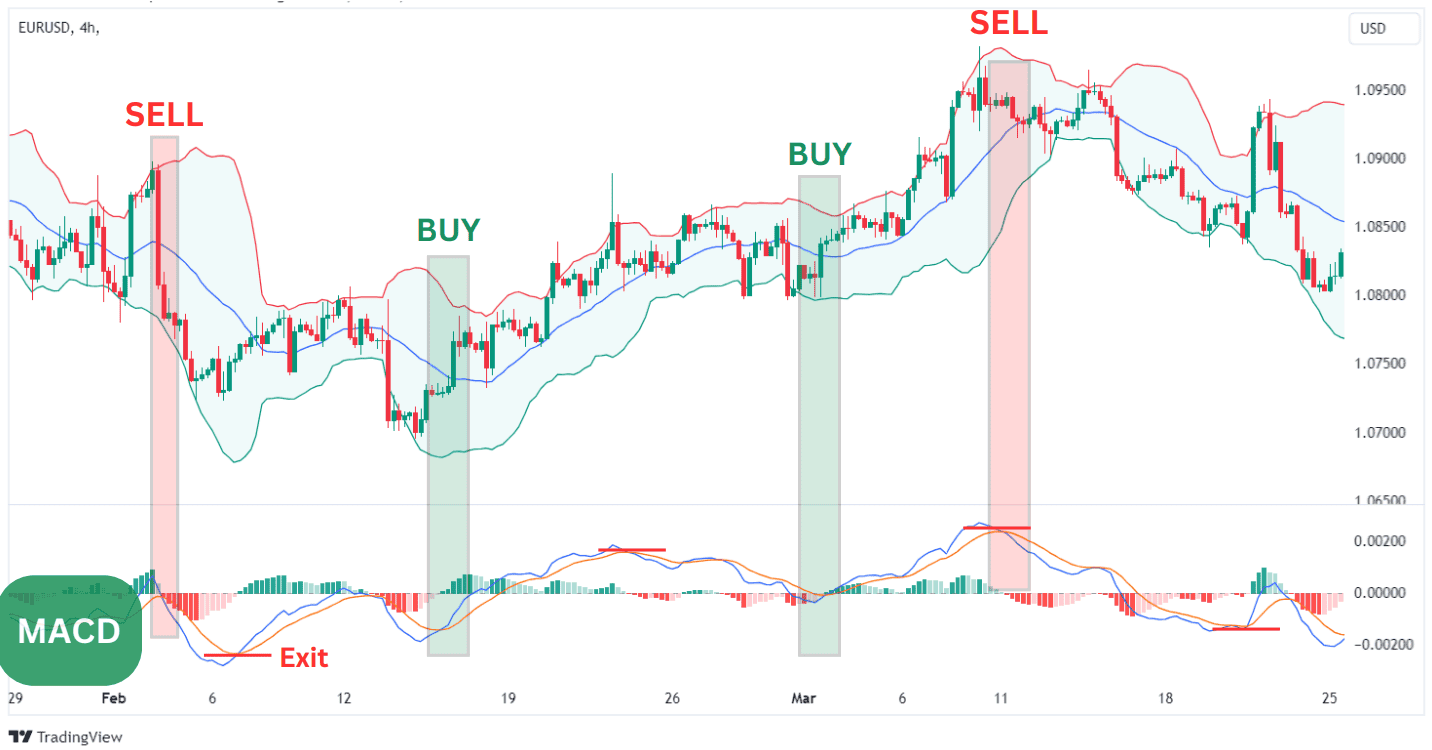
You can exit positions when the MACD line crosses the signal line again in the opposite direction.
Price Action Strategies
Another way to boost the relevance of the signals provided by Bollinger Bands® is to look for candlestick patterns.
For example, the morning star is a well-known bullish chart pattern. If it shows up at the lower band of the indicator, it is a robust buy signal. The morning star is a three-candle pattern where the middle one has a small body and is encompassed by a long bearish candle and long bullish candle.
You can look for single candle patterns, such as the hanging man, shooting star, or hammer and incorporate trades based those patterns. You’ll find the details of strategies and how to trade the Japanese candlestick patterns inside their individual posts.
Middle Bands
The middle band of the indicator is a simple moving average with the period 20. By simply looking at it, you can assess the existing trend. For example, if the middle line is ascending and the price is moving above it, that means that bulls are in control.
The middle line can also be used as the resistance or support level, depending on the general trend. Therefore, you can use it to find entry points or set stop-loss orders. For example, when walking the upper band, you can exit long positions if the price breaks below the middle line.
The Options Trading Strategy
You can use Bollinger Bands in options trading, given their ability to show price volatility. As mentioned, the bands expand amid increasing volatility and tighten during calm markets.
During long squeeze periods, the Bollinger Bands offer clear visual signals pointing to breakouts, enabling options traders to open positions according to market conditions and take control over risks. For example, traders can apply long straddles and strangles amid high volatility in the market or short straddles and strangles when they expect low volatility.
Bollinger Bands with RSI
The Relative Strength Index (RSI) is a great momentum indicator that can hint at the health of a trend.
For example, if the price breaks above Bollinger Bands’ upper band to form higher highs, you may be tempted to believe that the existing uptrend is sustainable. However, if the RSI forms a divergence with the price and the upper band, i.e., its highs move in the opposite direction, then you should stay away from opening long positions because this suggests a weakening uptrend.
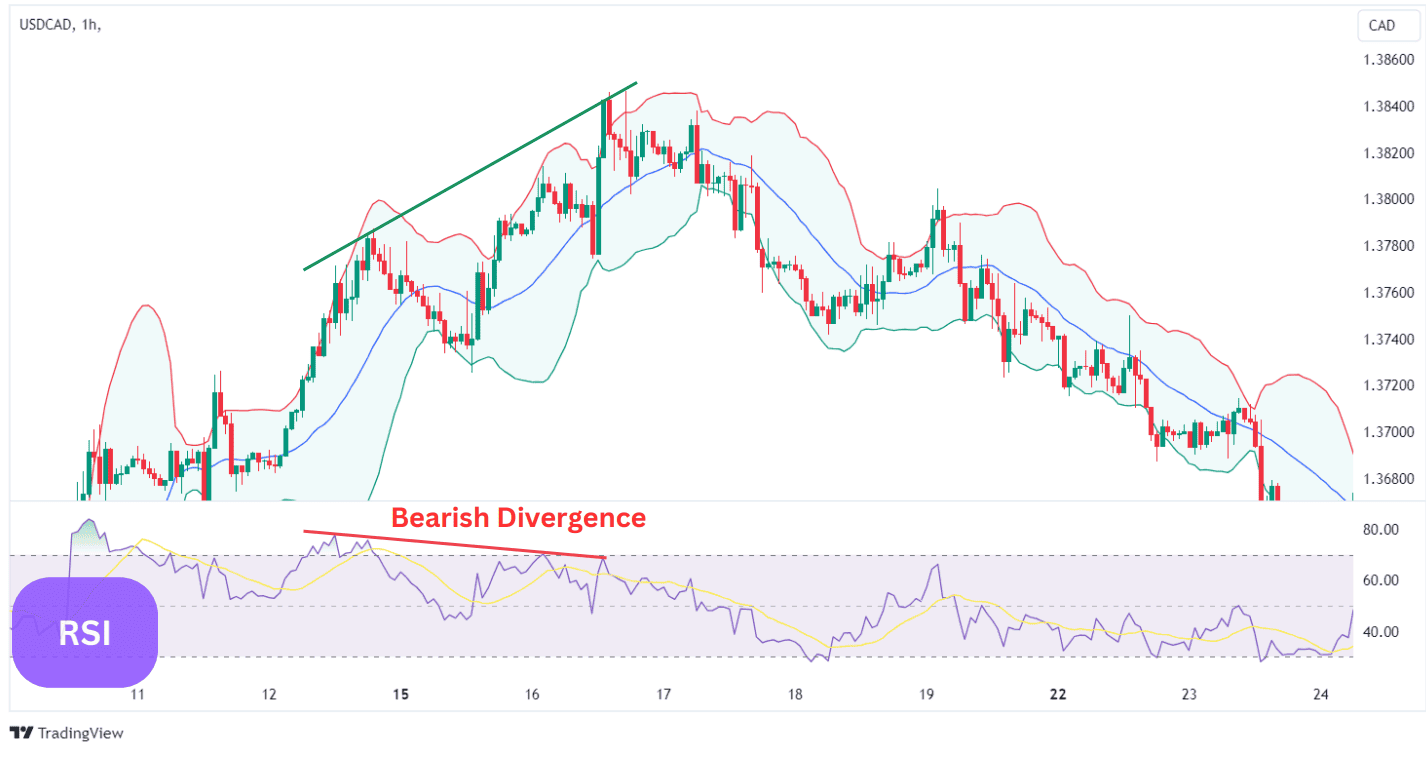
During downtrends, a bullish divergence between the price and the RSI suggests that an uptrend is just around the corner, which means short positions must be closed.
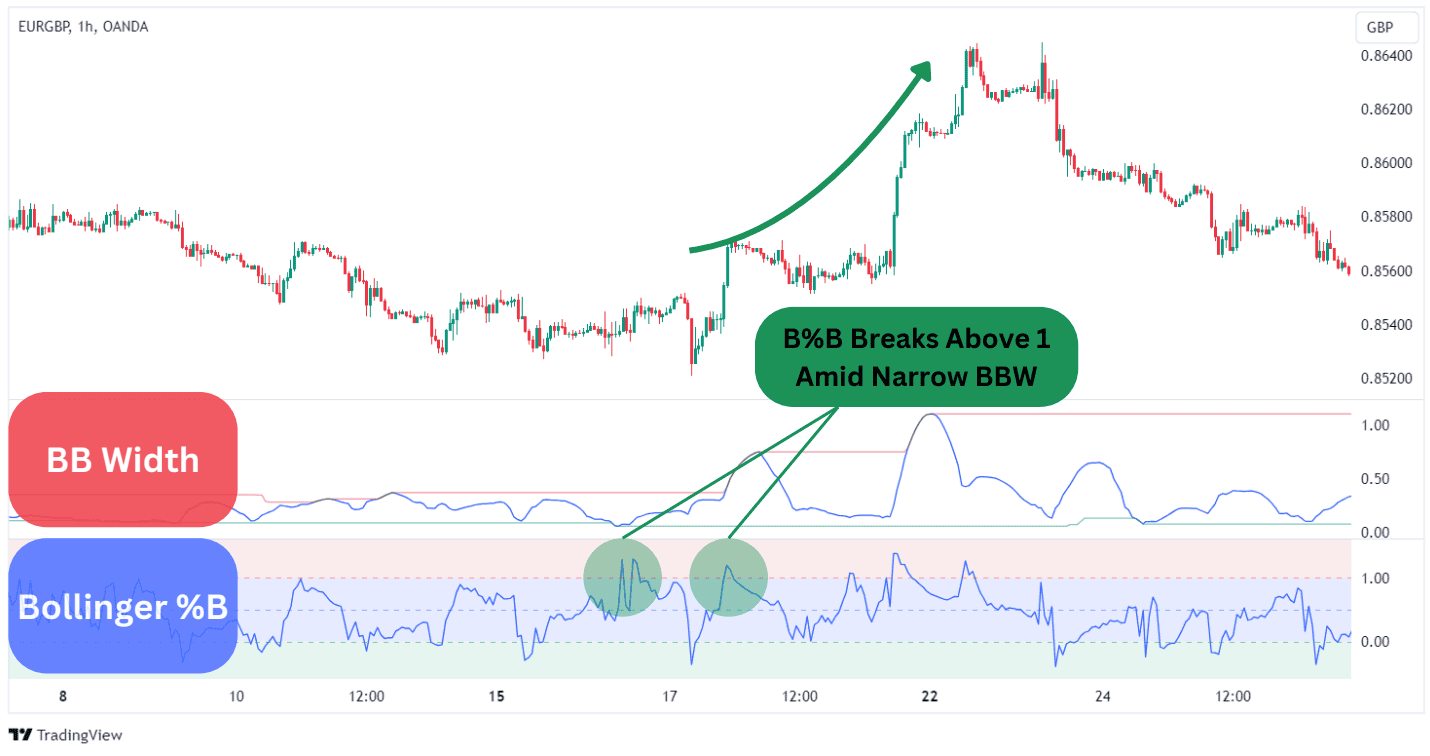
Bollinger Band Width and Bollinger %B
Bollinger Bands have several related indicators that can be used together with the standard version. The variations mentioned by John Bollinger himself include the Bollinger Band Width and the Bollinger %B.
The former measures the width of the bands as a percentage of the middle band, while the latter measures the price position relative to the Bollinger Bands, showing how close the price is to the upper or lower band.
The two variations can be used to refine trading strategies. For example, narrowing Bollinger Band Width (suggesting a squeeze cycle) followed by the %B breaking above 1 or below 0 anticipates a strong price movement.
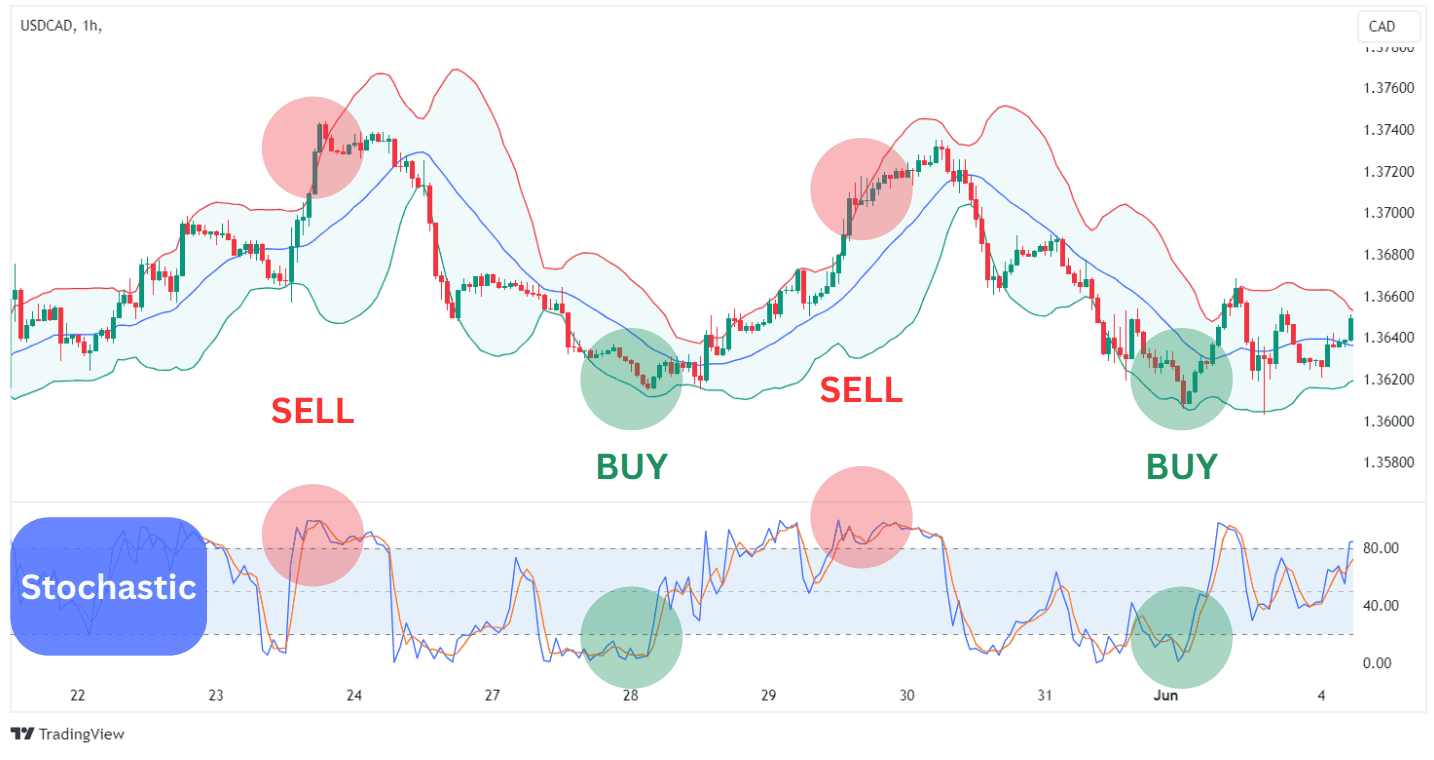
Bollinger Bands with Stochastic Oscillator
Stochastic is another popular momentum oscillator besides the RSI, and it can be used in combination with Bollinger Bands.
Instead of looking for divergences, the stochastic oscillator should be applied to confirm overbought and oversold levels. Here is how you can combine the two:
- Buy when the price is close to the lower band while the stochastic is in the oversold zone.
- Sell when the price is close to the upper band while the stochastic is in the overbought zone.
- Try to consider these trading signals during periods of higher volatility.
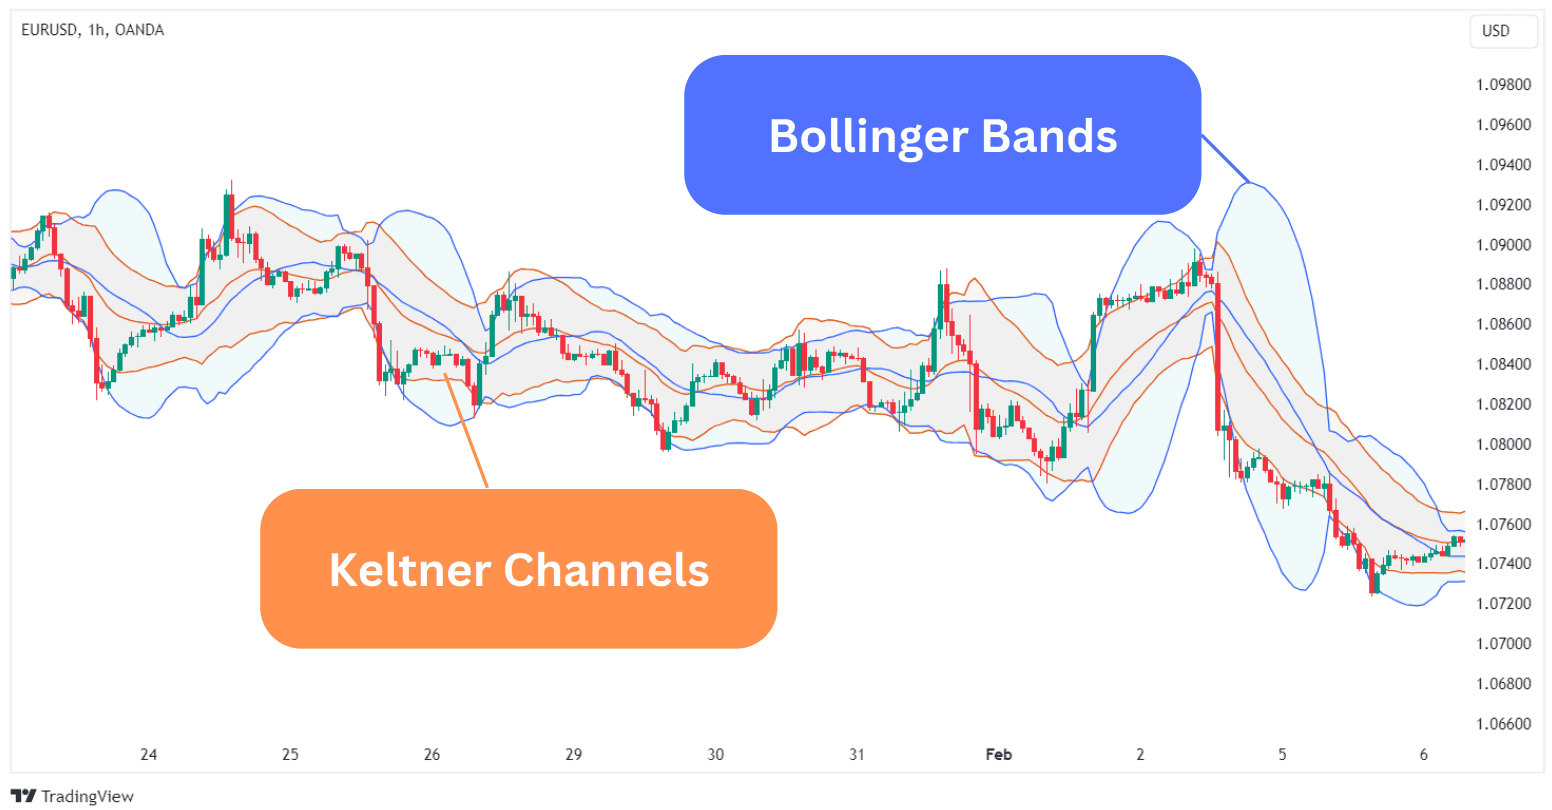
Bollinger Bands vs. Keltner Channels
Bollinger Bands looks quite similar to keltner channels, which also uses three bands plotted on the price action.
Keltner’s middle line represents an exponential moving average (EMA) with the period 20. Instead of using standard deviations, keltner channels use the average true range (ATR), which is a measure of volatility. By default, it applies two times the ATR above and below the middle line.
The interpretations of Bollinger Bands and keltner channels are usually the same, although Bollinger Bands offer fewer and more reliable signals.
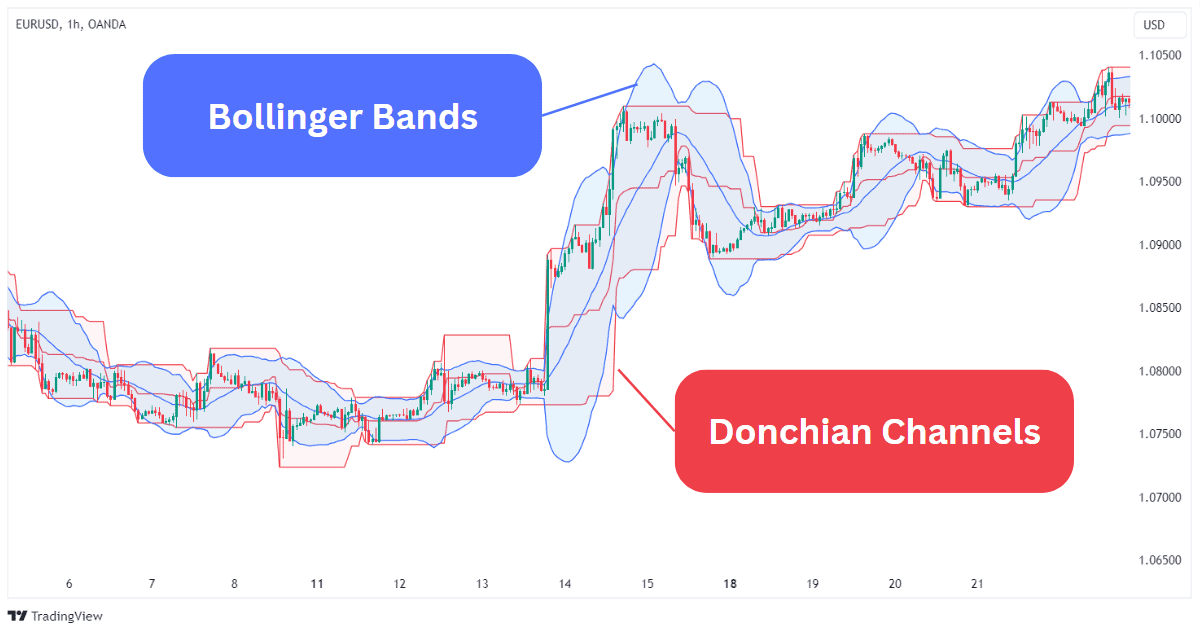
Bollinger Bands vs. Donchian Channels
Like Bollinger Bands, donchian channels is a technical indicator consisting of three lines.
Donchian’s upper and lower bands reflect the highest and lowest values over a given period. The middle line is then calculated by dividing the sum of the upper and lower values by 2. By default, the indicator is also set to 20 periods.
Like Bollinger Bands, donchian channels can be used to track volatility as well as identify trends, breakouts, and reversals. However, they are calculated differently and can provide different signals. The great thing about donchian is that resistance and support levels are more evident.
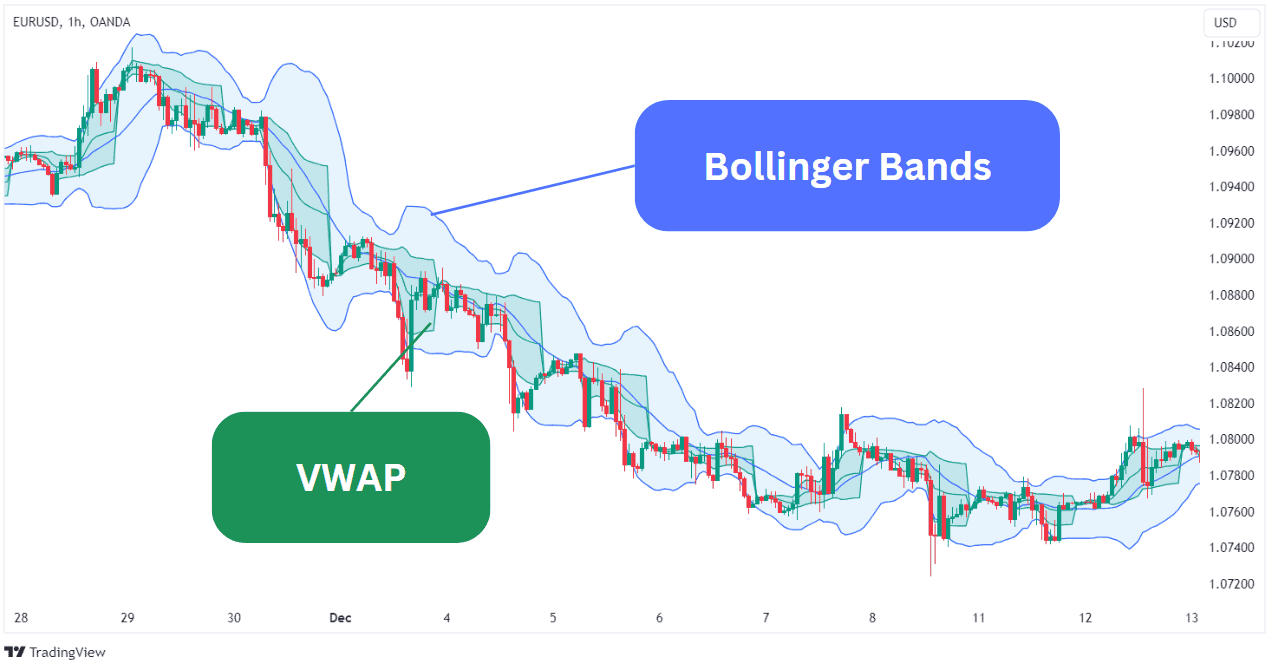
Bollinger Bands vs. VWAP
The Volume Weighted Average Price (VWAP) is another technical analysis tool plotted on the price action. It is used to spot trends and assess momentum.
While both technical indicators use the average price, the latter also reflects the volume of transactions at any given period. This makes VWAP a more reliable indicator to assess market sentiment, offering a volume-adjusted price average.
Advantages of Bollinger Bands
- Bollinger Bands® is the best indicator to visualize volatility.
- While being a volatility indicator, it can be used to assess overbought and oversold levels.
- Bollinger Bands can be used in any market condition, as they provide a wide range of signals for different types of strategies, including trend-following, range, and reversal strategies.
- The indicator can provide clear entry and exit points for many strategies. For example, the middle band often acts as a support level in uptrends and a resistance level in downtrends.
- Bollinger Bands work well in combination with other indicators, such as the RSI and MACD.
Disadvantages of Bollinger Bands
- Given that Bollinger Bands rely on moving averages, they are a lagging indicator and may provide many false signals.
- The indicator is less effective during consolidation periods and choppy markets.
- Bollinger Bands are less effective when used as a standalone indicator.
- The effectiveness of Bollinger Bands depends significantly on the correct setting of its parameters, which may be too complicated for beginners.
FAQ
What Bollinger Bands Settings Should Traders Use?
With default parameters, the indicator uses an SMA for 20 periods, with the standard deviation multiplier being set at 2. This is a great setting for day trading. Scalpers may consider a 10-period SMA with a standard deviation between 1.5 and 1.9, while position traders should set the standard multiplier at 2.1 for a 50-period SMA.
What Are the Origins of the Bollinger Bands?
Bollinger Bands have been developed by US investor John Bollinger in the 1980s. The name of the indicator came out during a live TV show on Financial News Network. The host took John Bollinger by surprise by asking him what the bands were called, to which he replied, “Let’s call them Bollinger Bands.”
What Timeframes Works Best with the Bollinger bands?
Bollinger Bands can be effectively used across all timeframes, but its parameters have to be adjusted accordingly.
Is Bollinger Bands accurate?
Yes, they can be if you use Bollinger Bands in the correct market environment. During ranging environments, the upper and lower bands are likely to contain prices. In trending markets, the volatility bands will expand suggesting that you follow the direction of trend.
Is Bollinger Bands a leading indicator or a lagging indicator?
Bollinger Bands are a lagging indicator as a moving average is the central component of the calculation. Even though the standard deviation bands will react quickly to price, the lagging moving average will cause the Bollinger Bands to react more slowly behind prices.


