


Written by:

Reviewed by:

- May 7, 2026
- 30 min read
Hull Moving Average (HMA) Explained With Examples
If traditional moving averages can sometimes feel like steering a car a second too late, the Hull Moving Average is built to tighten that response. It aims to stay smooth while reacting faster to recent price changes, which is why many traders use it when they want a clearer read on shifting momentum.
In this guide, we will explain what the Hull Moving Average is, how its formula works, what WMA1 and WMA2 are doing behind the calculation, and how traders use it in different market conditions.
What is a Hull Moving Average?
The Hull Moving Average, or HMA, is a technical indicator designed to reduce some of the lag found in traditional moving averages. Traders use it to follow trend direction more closely while keeping the line relatively smooth.
Traditional moving averages are widely used to track market direction and can also act as dynamic support or resistance. Their main weakness is that they often react slowly when price begins moving quickly, especially in more volatile conditions.
To address this, Alan Hull developed the HMA using weighted moving averages and a final smoothing step based on the square root of the selected period. The goal was to create an average that responds faster to recent price action without becoming overly noisy.
Because of this, the HMA is often used to help traders read trend direction, spot momentum shifts, and assess possible turning points across markets such as forex, stocks, commodities, and crypto.
How Does the Hull Moving Average Indicator Work?
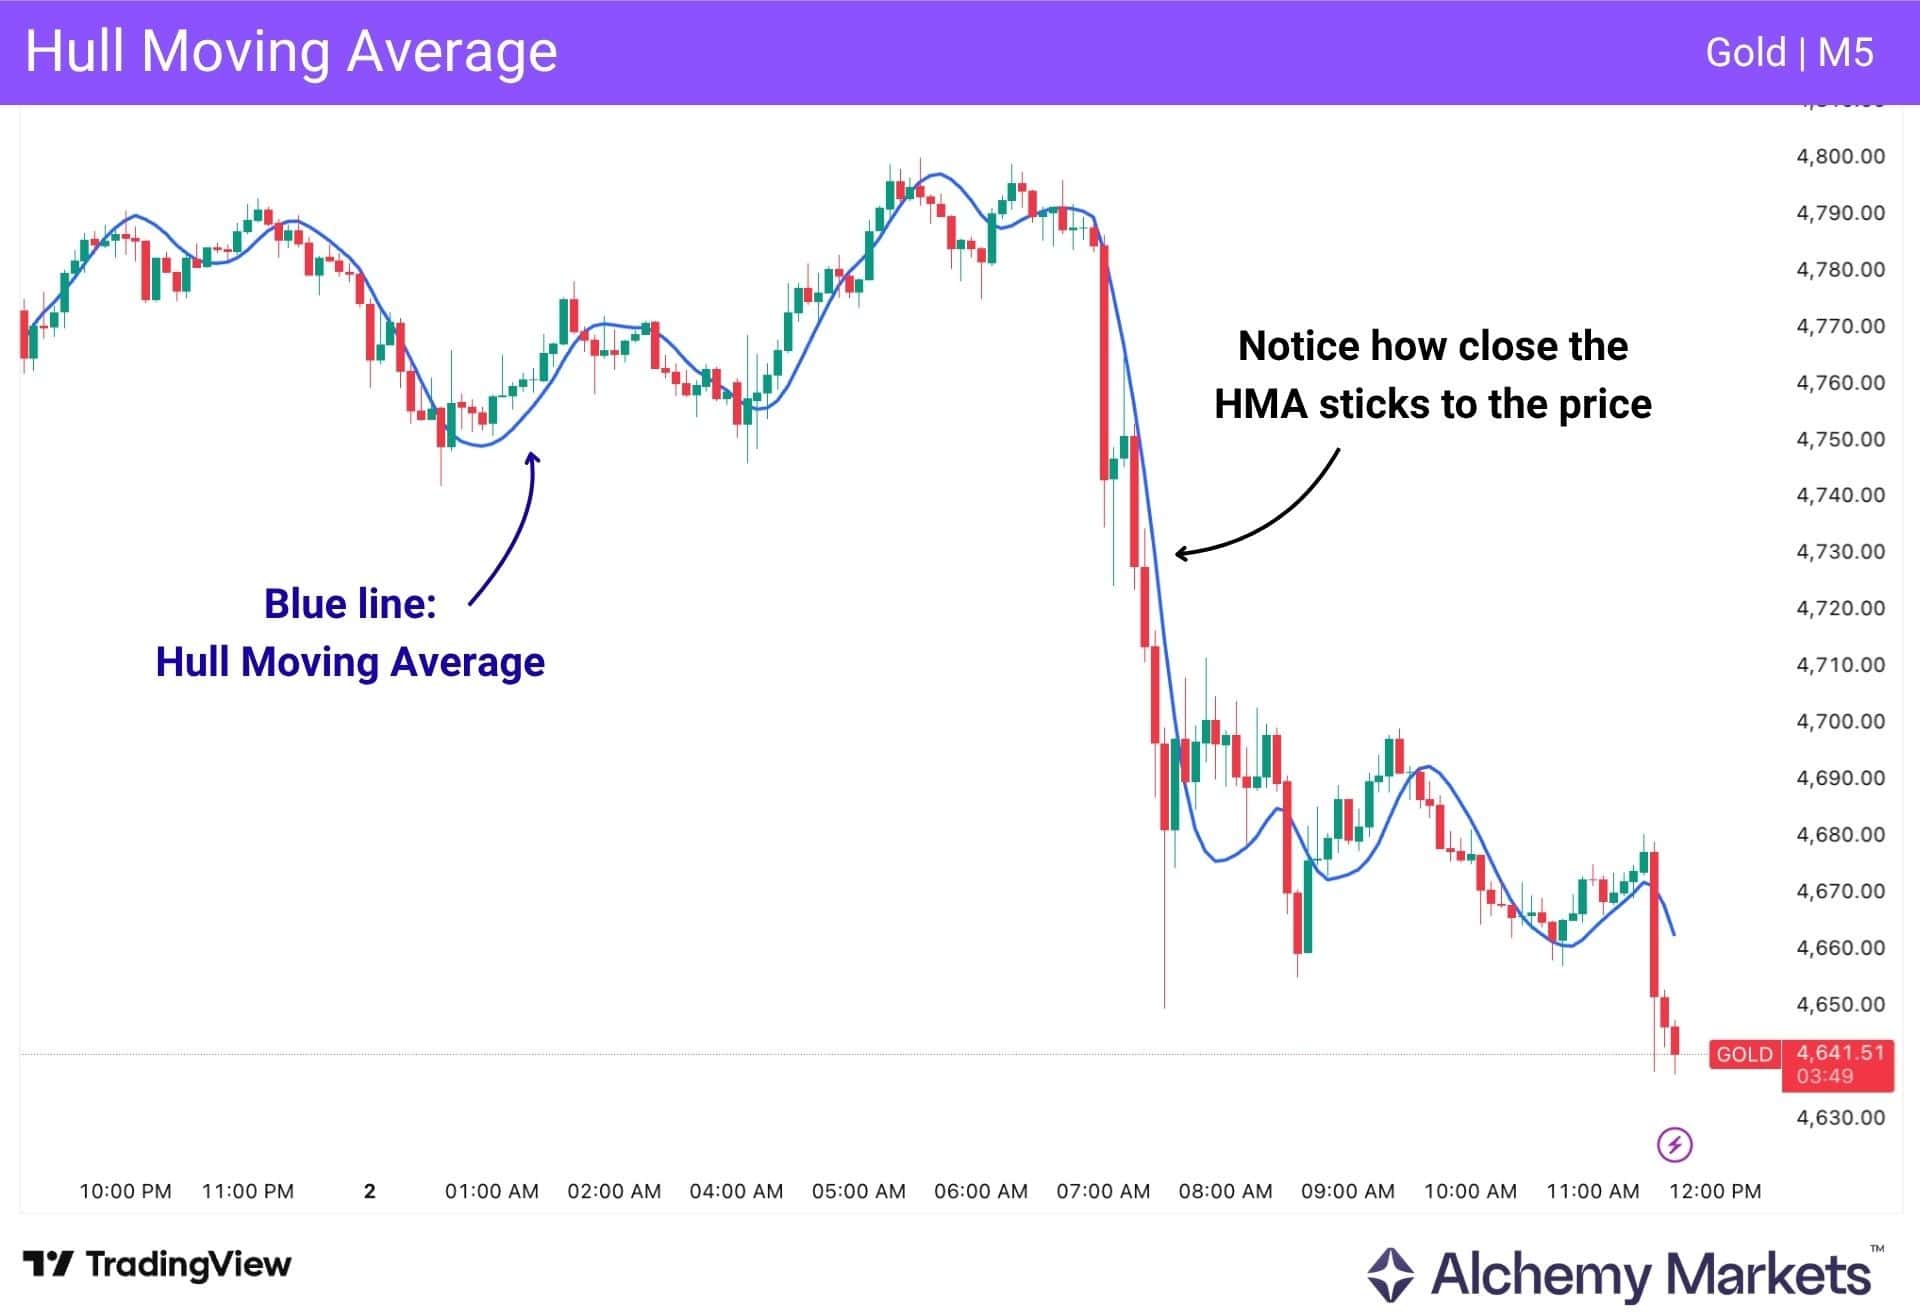
The Hull Moving Average is designed to follow price more closely than many traditional moving averages while remaining relatively smooth. That makes it useful for traders who want a trend tool that can react faster when momentum starts to shift.
It does this by combining weighted moving averages and then applying a final smoothing step. The goal is not to remove lag entirely, but to reduce some of the delay that often comes with traditional moving averages.
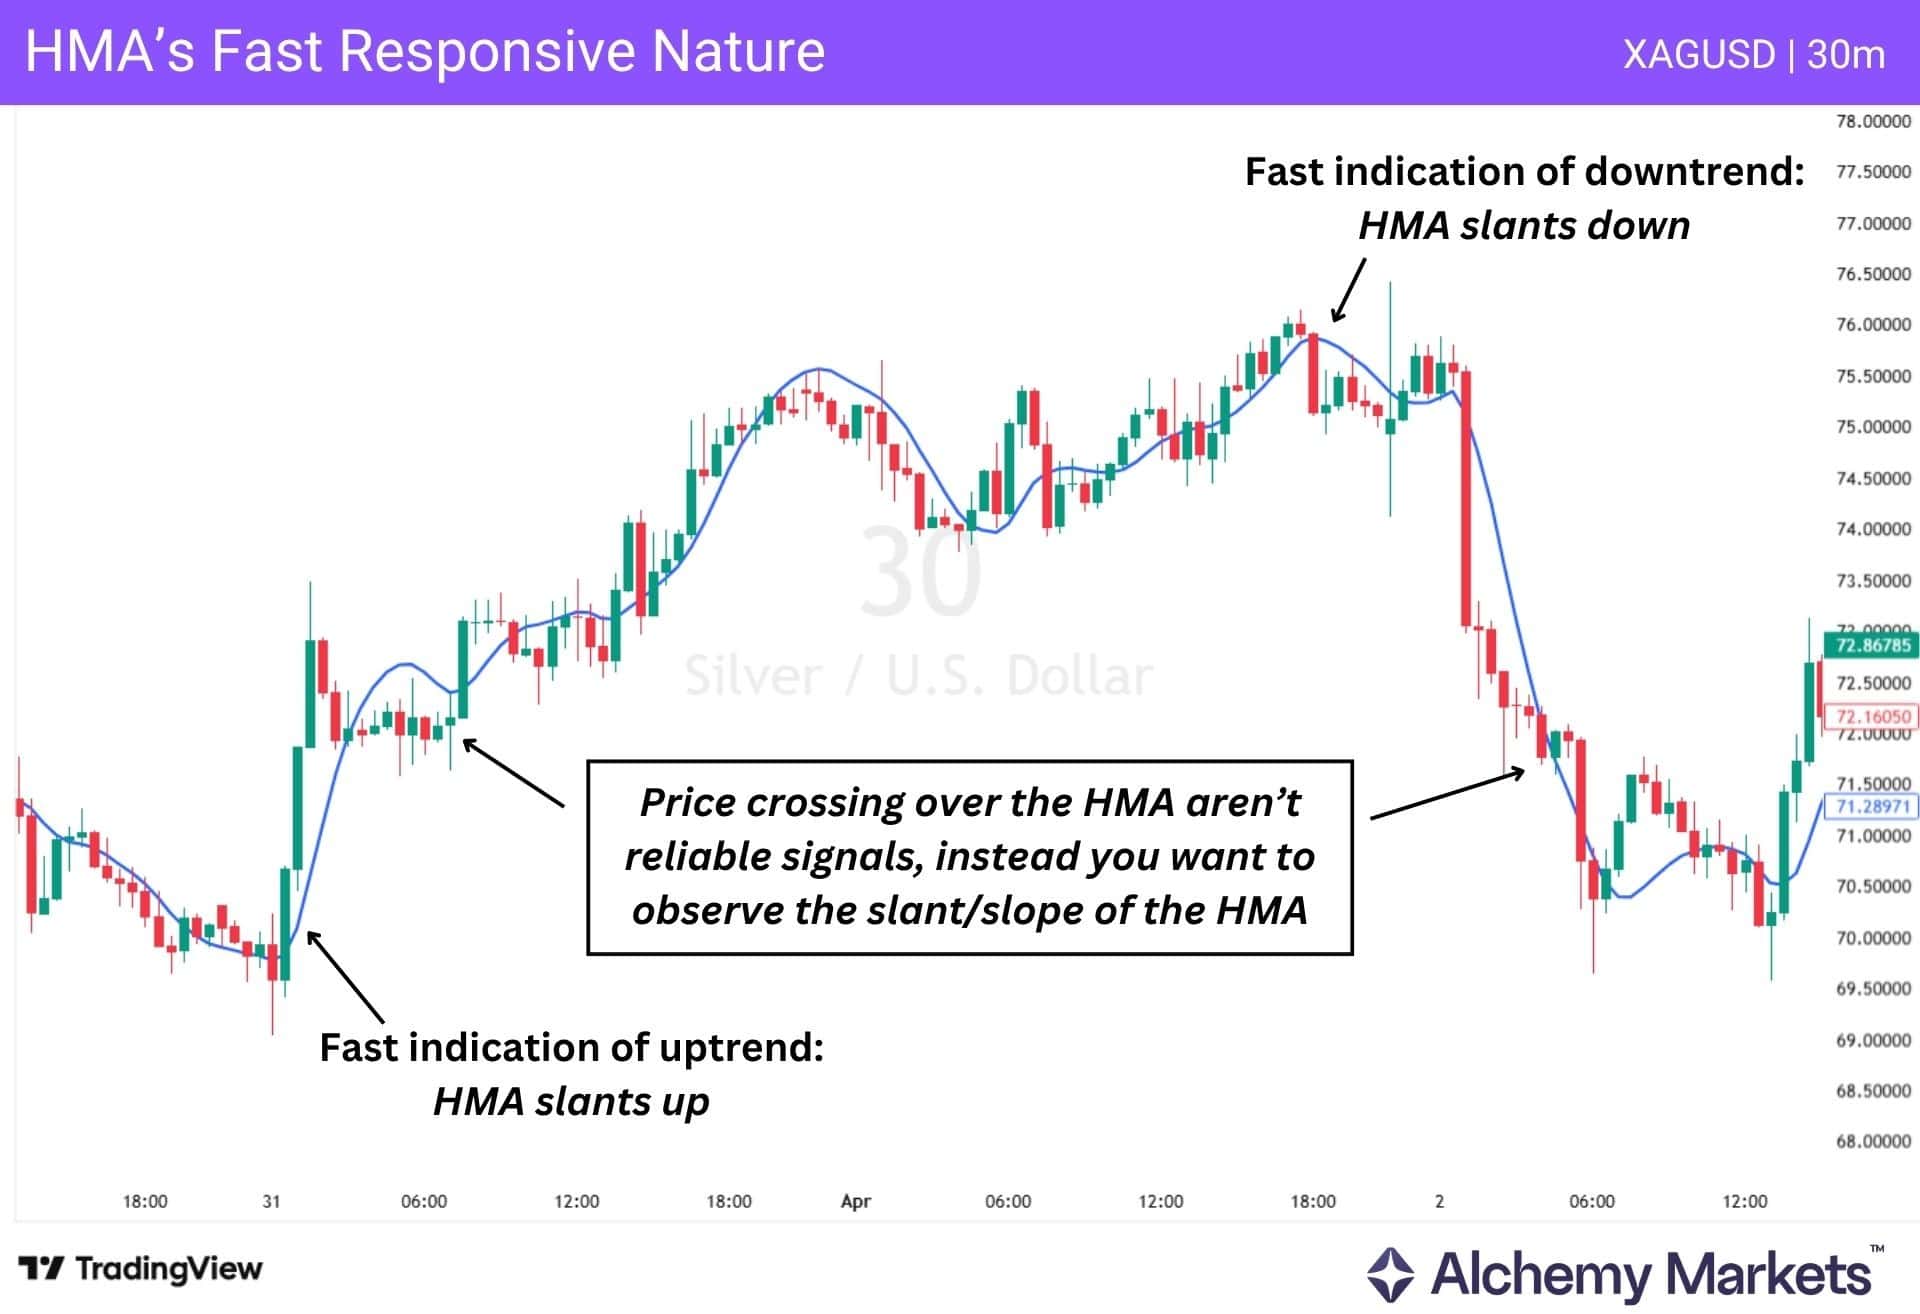
On the chart, traders usually focus less on the calculation and more on the shape of the line. When the HMA is rising, it can point to strengthening bullish momentum. When it is falling, it can suggest that bearish momentum is building.
Because the HMA often stays close to price, some traders use it to help read trend direction and spot possible turning points earlier than they might with slower moving averages.
The HMA is often more useful as a confirmation tool than a standalone signal. Traders may pair it with indicators such as RSI, MACD, or Bollinger Bands® to get a clearer read on trend direction and potential setups across markets like forex, stocks, commodities, and crypto.
Because it stays close to price, the HMA can react quickly, but that also means it may require extra confirmation when used for support and resistance reactions or crossover-based entries.
How HMA Reduces Lag And Improves Responsiveness
The HMA aims to reduce lag by blending two weighted moving averages and then smoothing the result. Since weighted moving averages give more importance to recent prices, the HMA can react faster to fresh market moves than many traditional moving averages.
It starts with a shorter-period WMA and a longer-period WMA. The shorter one responds more quickly to recent price action, while the longer one reflects the broader trend. The formula then places greater emphasis on the shorter average before applying a final smoothing step based on the square root of the selected period.
This helps the HMA stay relatively close to price while remaining smoother than many fast-moving averages. That balance between responsiveness and smoothing is one of the main reasons traders use it to assess trend direction and momentum.
Importance of Hull Moving Average indicator
One of the main reasons traders use the Hull Moving Average is because it tries to solve one of the biggest weaknesses of traditional moving averages: lag.
Standard moving averages often react slowly to changing conditions, which can lead to late entries or missed moves.
Alan Hull designed the HMA to reduce that delay by combining multiple Weighted Moving Averages to smooth price data while still staying highly responsive. This approach aims to create a line that eliminates lag altogether in theory, or at least comes as close as possible in practice without making the indicator unusably erratic.
That makes the HMA appealing in markets with sharp price movements, where trend shifts happen quickly and faster detection matters. At the same time, lag is not always a flaw. Slower moving averages can help filter out market noise and stop traders from reacting to every small fluctuation.
Since the HMA is more sensitive, it can sometimes respond too quickly and become more exposed to market noise, especially when price action is choppy or lacks conviction. That trade-off is what defines the indicator. The Hull Moving Average solves much of the lag seen in traditional moving averages, but that added speed can also bring more sensitivity. Even so, its ability to smooth price data and respond quickly makes it a useful tool across different timeframes and instruments.
How to Calculate Hull Moving Average
The Hull Moving Average calculation uses weighted moving averages to respond more quickly to recent price changes.
In a weighted moving average, more recent prices are given greater importance than older ones. This is done simply by assigning a multiplication value to more recent prices.
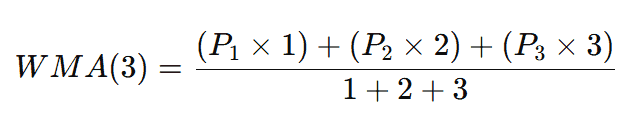
To illustrate, let’s take a WMA(3) which is the average price of 3 values:
The oldest price is multiplied by 1, the next by 2, and the most recent by 3. These weighted values are then added together and divided by the total of the weights.
This is the secret behind the HMA. It combines multiple WMAs in a way that helps the average react faster to price while keeping the line smoother than many traditional moving averages.
Hull Moving Average Formula
The Hull Moving Average is a rolling indicator, which means the calculation updates continuously as new price data comes in. Rather than

relying on a single average, the HMA combines shorter- and longer-period weighted moving averages, then smooths the result to create a line that stays responsive to recent price action.
The formula is as follows:
| To make that easier to follow, it helps to break the formula into smaller parts: WMA1 = WMA(n/2) This is the weighted moving average based on half the selected period. WMA2 = WMA(n) This is the weighted moving average based on the full selected period. Raw HMA = 2 × WMA1 − WMA2 This step gives more emphasis to the shorter-period average, helping the indicator react faster to recent price changes. Final HMA = WMA(Raw HMA, sqrt(n)) This final smoothing step helps keep the indicator responsive without making it too noisy. | |||||||||
| Where: n = number of periods sqrt(n) = the square root of the selected period, used for the final smoothing length |
For example, if the closing prices for 7 days of Asset X are $10, $11, $13, $12, $14, $16, $17, with $17 as the most recent value, the HMA calculation is built from those prices using the steps above.
Step 1: Calculate WMA1 using n/2
Start by calculating the weighted moving average using half of the selected period.
Since n = 6, half of the period is 3, so WMA1 is based on the most recent 3 closing prices: $14, $16, $17
| Preview calculation: WMA1 = (14×1)+(16×2)+(17×3)(14 × 1) + (16 × 2) + (17 × 3)(14×1)+(16×2)+(17×3) ÷ (1 + 2 + 3) WMA1 = (14 + 32 + 51) ÷ 6 = 97 ÷ 6= 16.17 |
WMAs place more weight on recent prices, this shorter average reacts faster to current price changes.
Step 2: Calculate WMA2 using n
Next, calculate the weighted moving average using the full period.
Since n = 6, WMA2 is based on the most recent 6 closing prices: $11, $13, $12, $14, $16, $17
| Preview calculation: WMA2 = (11×1)+(13×2)+(12×3)+(14×4)+(16×5)+(17×6)(11 × 1) + (13 × 2) + (12 × 3) + (14 × 4) + (16 × 5) + (17 × 6)(11×1)+(13×2)+(12×3)+(14×4)+(16×5)+(17×6) ÷ (1 + 2 + 3 + 4 + 5 + 6) WMA2 = (11 + 26 + 36 + 56 + 80 + 102) ÷ 21 = 311 ÷ 21 = 14.81 |
Since it uses more data, this average moves more slowly than WMA1 and reflects the broader trend more steadily.
Step 3: Build the raw HMA value (Subtract WMA2 from WMA1)
Once both weighted moving averages are calculated, double WMA1 and subtract WMA2:
Raw HMA = 2 × WMA1 − WMA2
| Preview calculation: Raw HMA = (2 × 16.17) − 14.81 Raw HMA = 32.34 − 14.81 = 17.53 |
This step increases the influence of the shorter-period average, which helps the HMA respond faster to recent price movement than a traditional moving average.
Step Four: Apply a WMA using sqrt(n) period
The final step is to smooth the raw HMA value using a weighted moving average based on the square root of the original period.
Since sqrt(6) ≈ 2.45, the smoothing length is usually rounded depending on the platform. For simplicity, this example uses 2 periods.
To apply that final smoothing, you would take the most recent raw HMA values and calculate a 2-period WMA on them.
| Preview calculation: If the previous raw HMA value is 15.76 and the current raw HMA value is 17.53, then: Final HMA = (15.76×1)+(17.53×2)(15.76 × 1) + (17.53 × 2)(15.76×1)+(17.53×2) ÷ (1 + 2) Final HMA = (15.76 + 35.06) ÷ 3 = 50.82 ÷ 3 = 16.94 |
This final smoothing step helps keep the HMA responsive while reducing some of the noise created in the earlier calculation.
The Significance Of The Square Root Period
The square root period is one of the key features of the HMA formula. It helps smooth the raw calculation without adding as much delay as a longer moving average would.
This is part of what makes the HMA different from many traditional moving averages. It aims to stay close to price while remaining smoother and easier to read during changing market conditions.
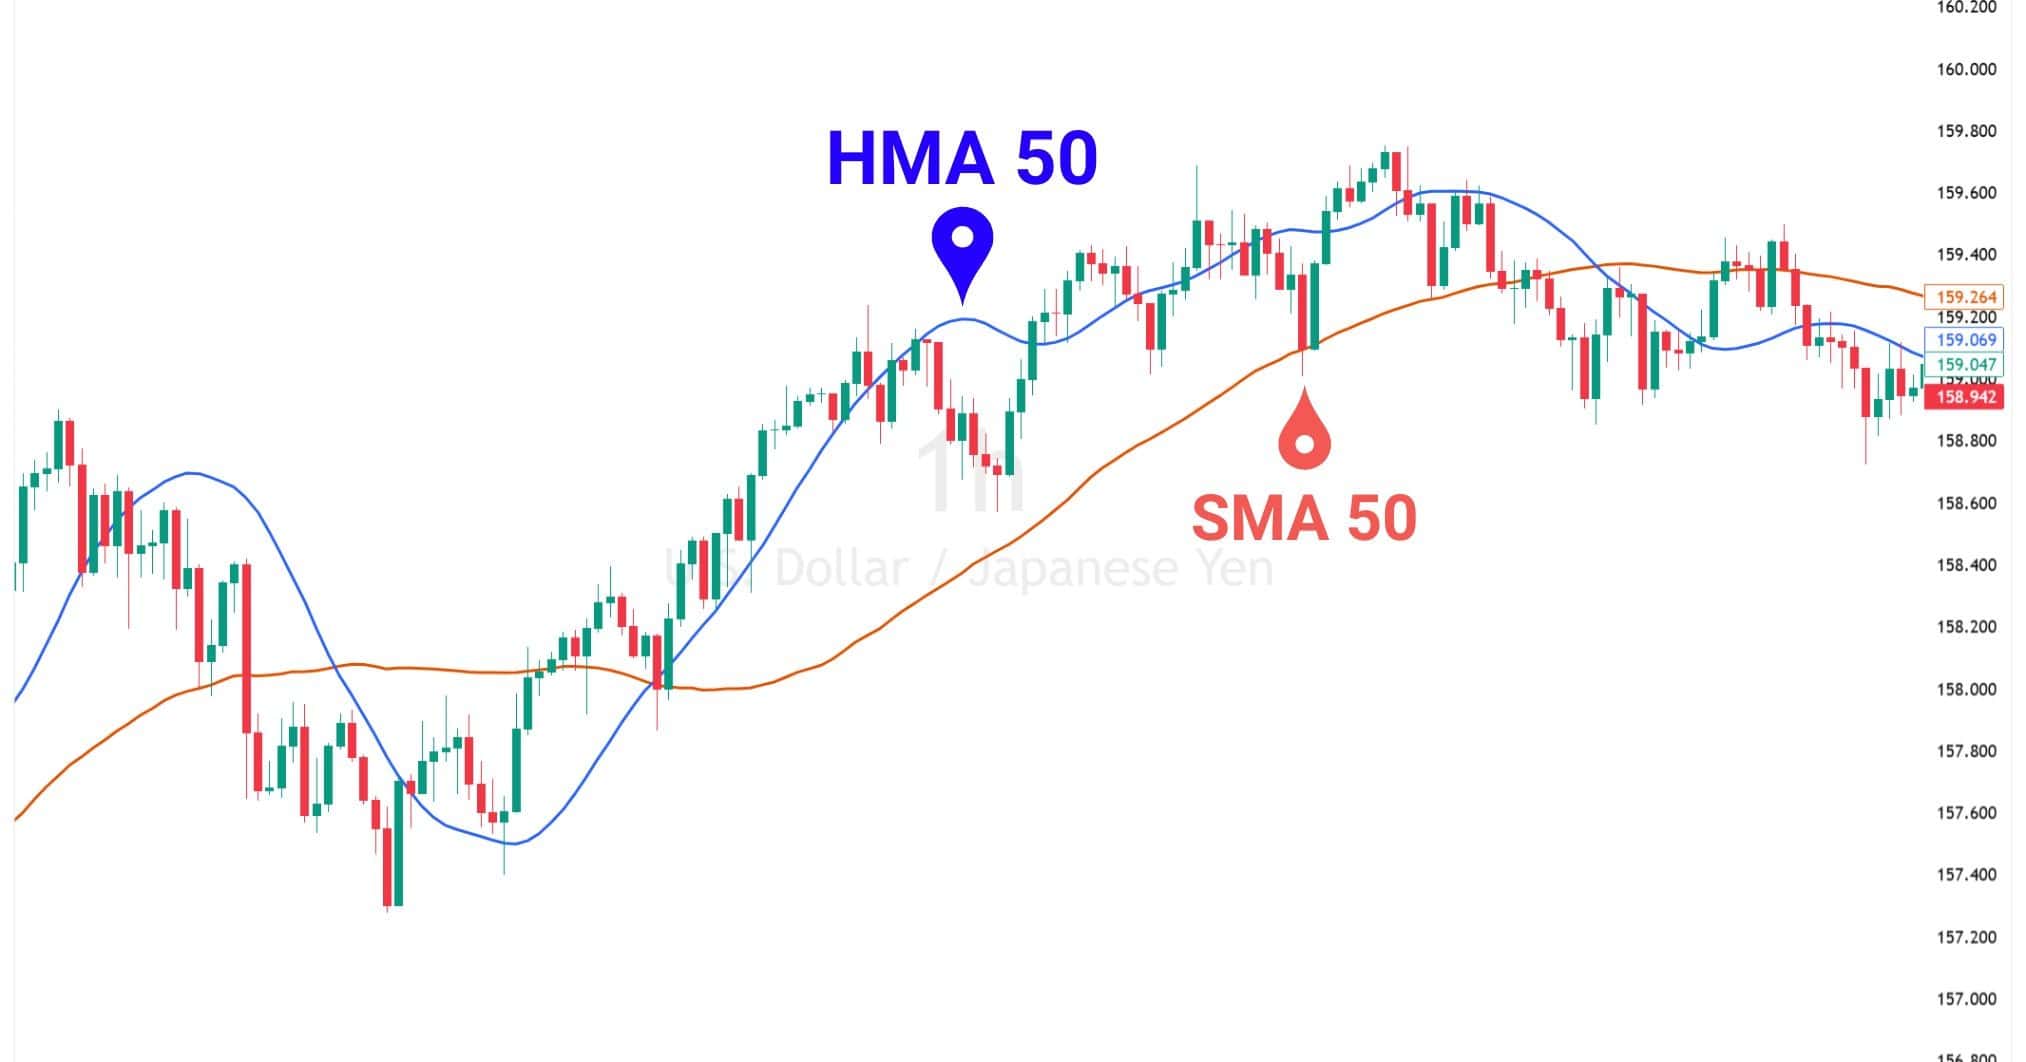
Hull Moving Average Example
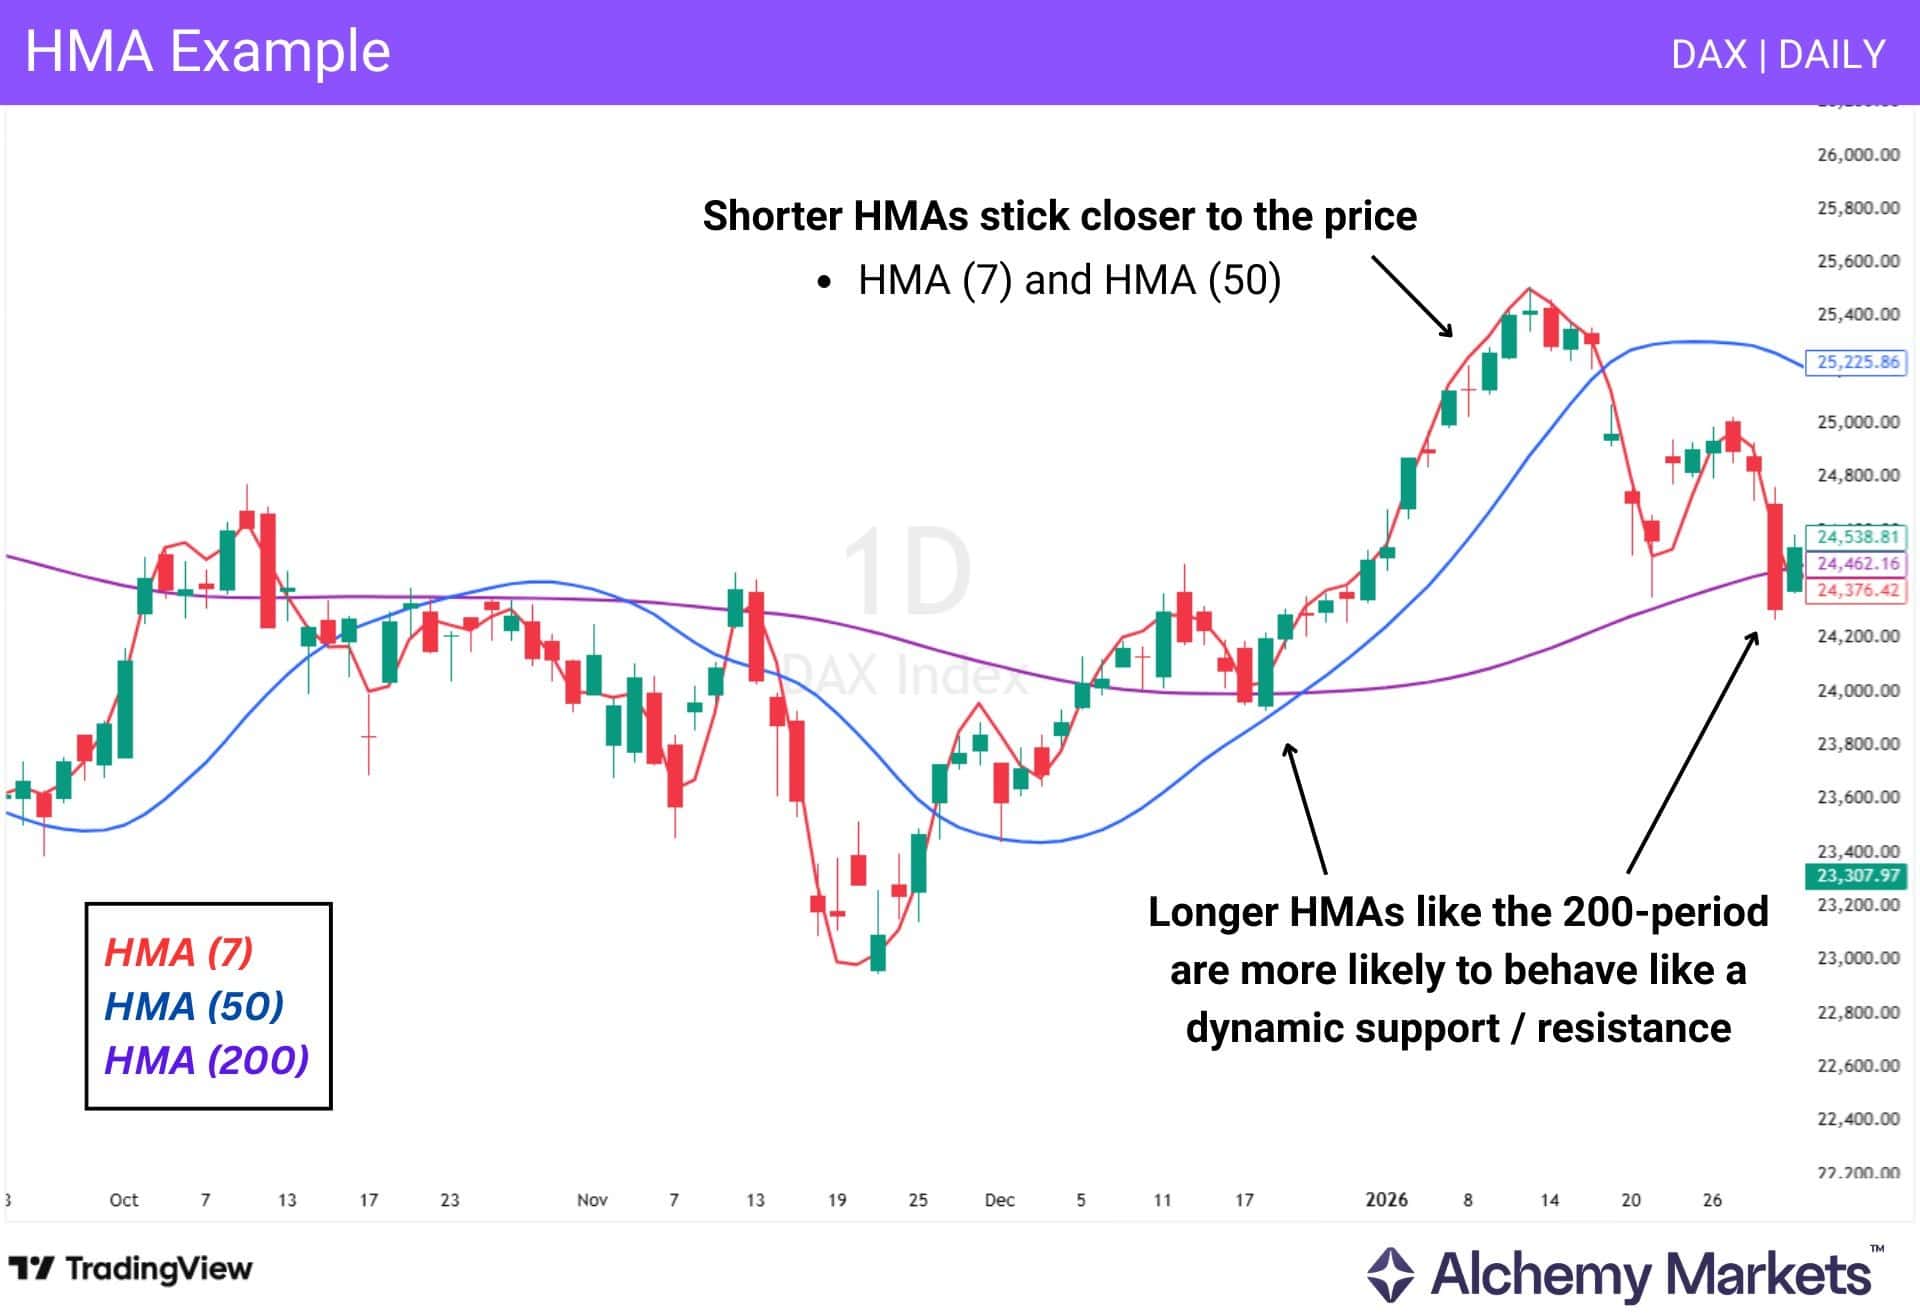
Below is a DAX daily chart showing how the Hull Moving Average changes as the period length increases.
- HMA-7 tracks price very tightly
- HMA-50 is still fairly responsive, but smoother
- HMA-200 sits much farther away and behaves more like a long-term trend reference
This is why shorter HMAs are often used for short-term trend reading, while longer HMAs are more useful for broader trend context and can sometimes behave like dynamic support or resistance.
Hull Moving Average Trading Strategies
In the following section, we will describe various trading strategies using Hull Moving Average (HMA), combining with different technical tools and indicators to generate the best trading ideas. You can adopt any of these strategies, or multiple of them, to generate efficient trading ideas.
Crossover Strategy Using HMA
A Hull Moving Average crossover strategy compares a faster HMA with a slower one to track shifts in short-term versus broader trend direction. In this NZDUSD daily chart example, the faster line (red) reacts more quickly to recent price changes, while the slower line (blue) smooths out more of the noise.
When the shorter HMA crosses above the longer HMA, it can signal that short-term momentum is starting to strengthen relative to the broader trend.
- Potential buy signal: The shorter HMA (red) crosses above the longer HMA (blue).
- Potential sell signal: The shorter HMA (red crosses below the longer HMA (blue).
Traders often treat that as a bullish shift and then look for added confirmation from price structure, support and resistance, or momentum indicators before entering a long position.
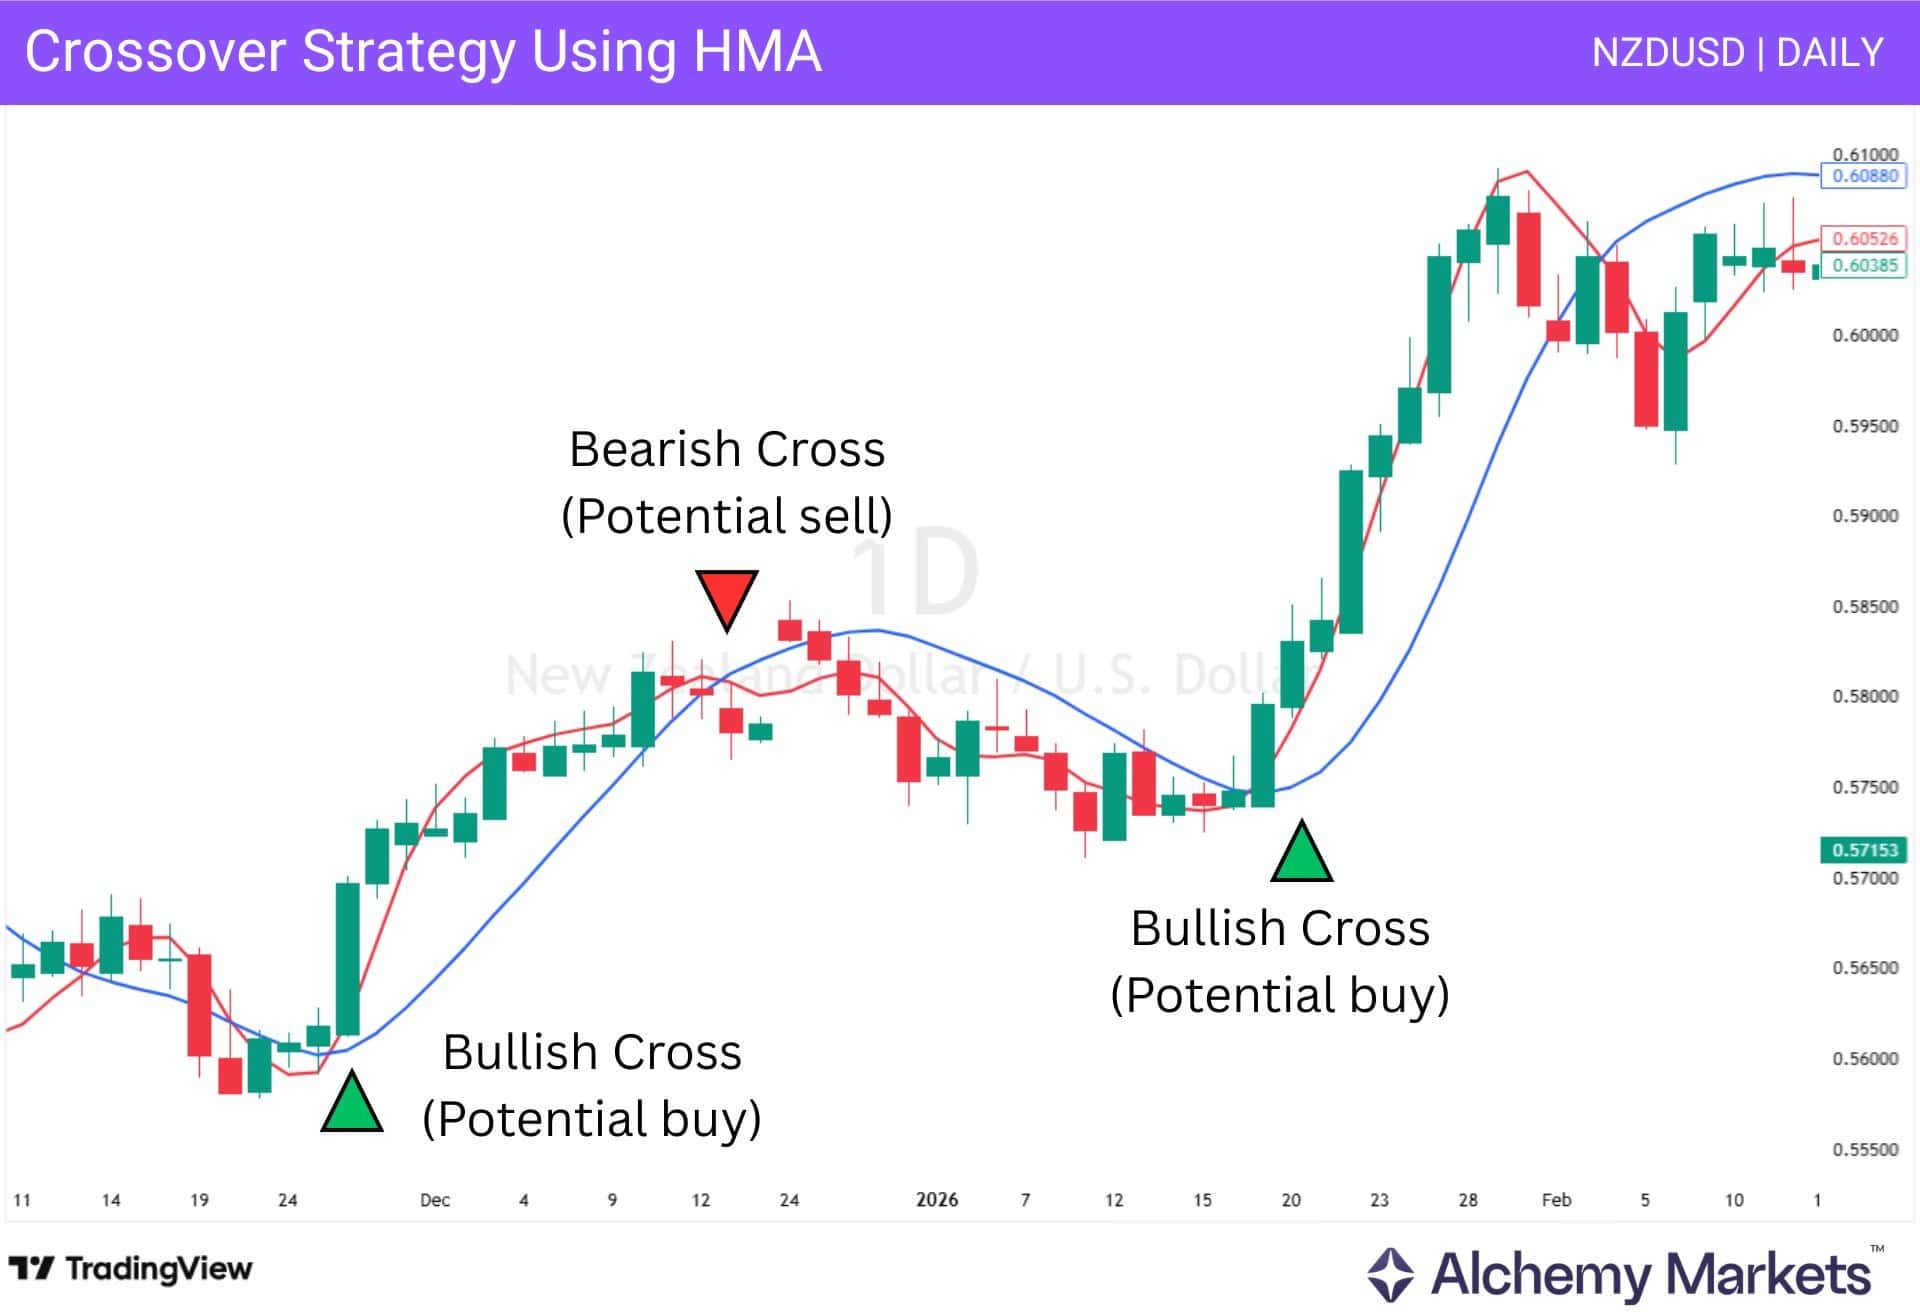
For example, a trader might pair HMA(10) with HMA(30), as shown on the NZDUSD chart.
The main value of this approach is not that it predicts every reversal, but that it helps simplify trend transitions. The trade-off is that crossover signals can arrive late in choppy conditions, which is why many traders use them as a confirmation tool rather than a standalone trigger.
Bottom line — Use this to filter out trade conditions, then find trend-aligned trade setups.
Trend Identification With Hull Moving Average
The Hull Moving Average can be used as a trend filter because it responds relatively quickly to changing price conditions while still remaining smooth enough to read clearly on the chart.
Rather than focusing only on whether price is above or below the line, traders usually pay attention to three things at once: the slope of the HMA line, how price behaves around it, and whether the line is beginning to flatten.
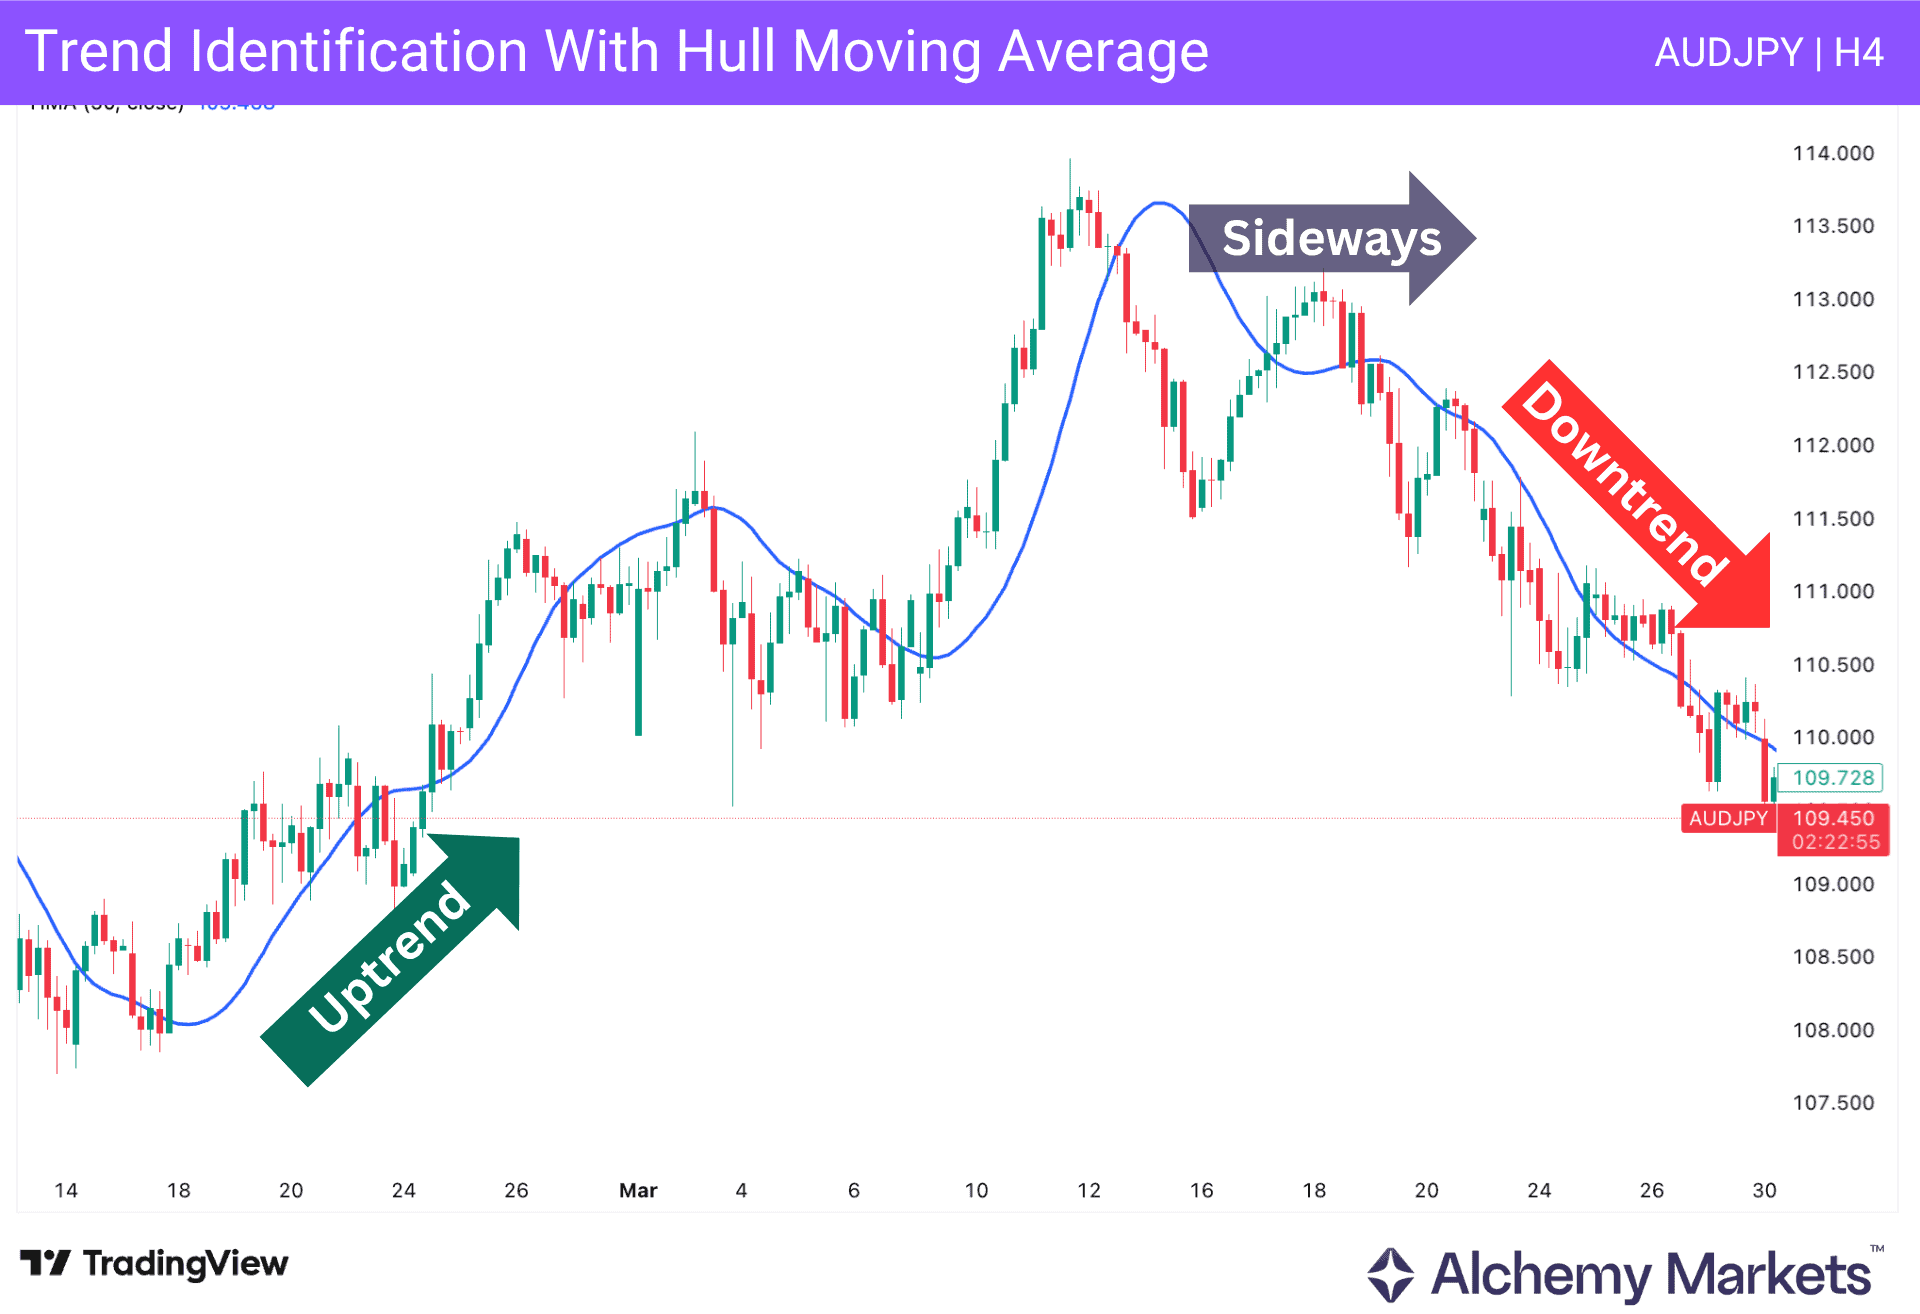
In the AUDJPY H4 example, a rising HMA(50) with price holding above it points to bullish conditions. That does not mean price will move up in a straight line, but it does suggest that buyers remain in control while pullbacks stay supported. When the HMA starts to flatten and price begins crossing it more frequently, trend strength is usually weakening and the market may be shifting into a sideways phase.
Once the HMA begins sloping lower and price starts trading below it more consistently, the read changes. If rallies then struggle around the HMA and the line starts acting as dynamic resistance, that can point to a developing downtrend.
In simple terms, a rising HMA supports a bullish trend bias, a flattening HMA can signal consolidation, and a falling HMA can point to a bearish trend bias. The indicator becomes more useful when traders combine slope with price structure instead of treating the line as a standalone signal.
HMA Breakout Strategy
The Hull Moving Average can help traders read whether a breakout is gaining real momentum or simply poking through a level without follow-through.
The key is not to treat the HMA as the breakout signal itself, but as a confirmation tool alongside price structure. If a support or resistance is being broken, and the HMA supports the breakout momentum, it confirms that the breakout is likely “real” and filters out false breakouts.
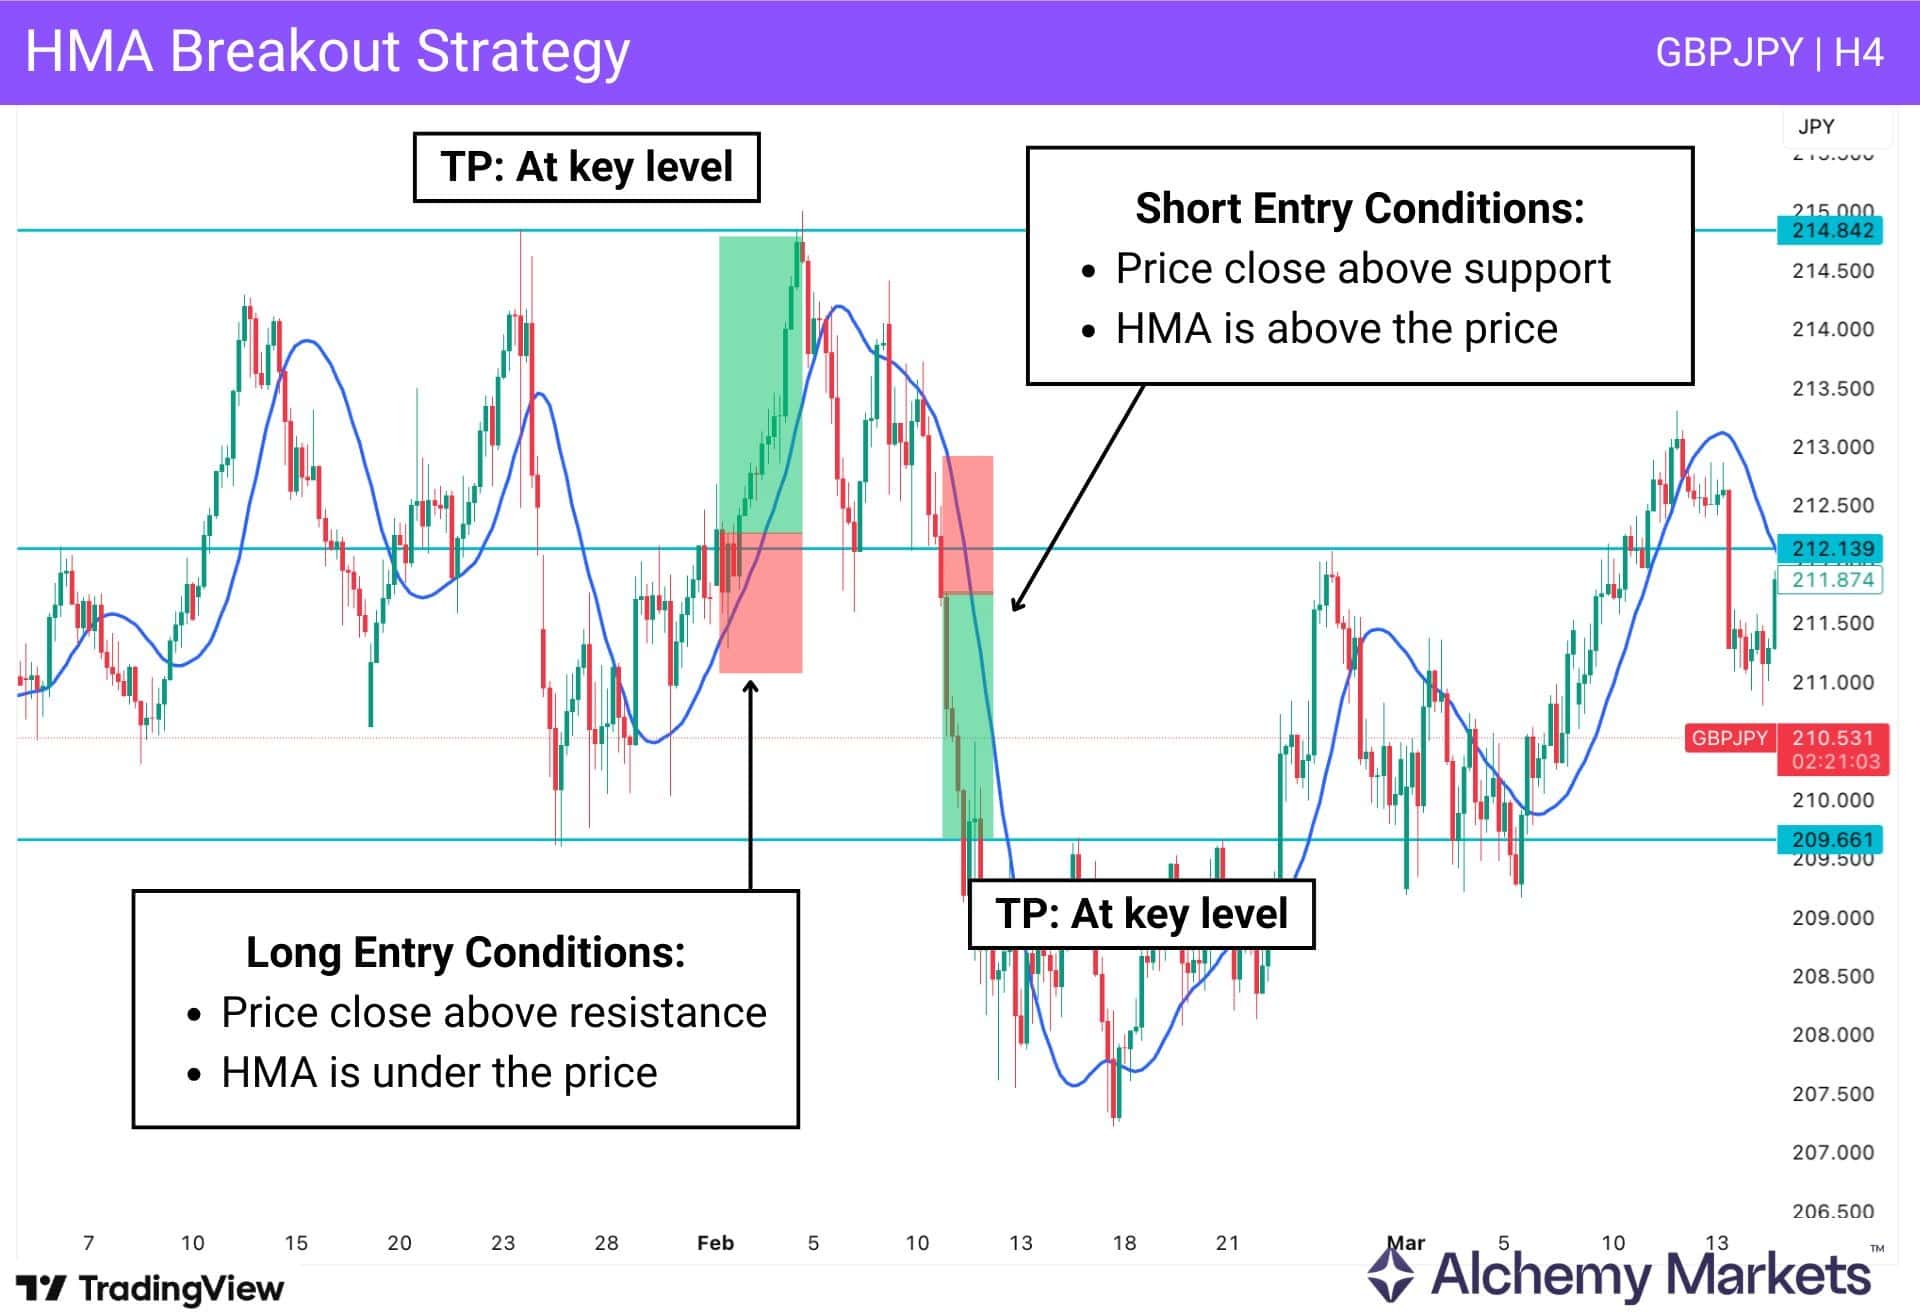
A common approach is to mark major support and resistance levels on a higher timeframe such as the daily or weekly chart, then drop to a lower timeframe to watch how price behaves as it reaches those zones.
For example, in the GBPJPY H4 chart above, the HMA(50) helps show whether momentum is strengthening into the break or fading near the level which is premarked from the daily/weekly timeframe.
This is where the HMA adds value. It can help filter weaker breakouts, especially when price briefly moves through a level but the moving average remains flat or price quickly falls back across it.
A clean breakout is usually more convincing when the HMA slope is already turning in the direction of the move:
- If the price breaks a support by moving lower, and it is supported by the HMA above it — this is a sell signal.
- Vice versa, if the price breaks a resistance by moving higher, and the HMA is below it — this is a buy signal.
In practice, traders often place profit targets near the next major support or resistance zone rather than expecting the move to run indefinitely. The main idea is simple: use higher-timeframe levels to define the breakout area, then use the HMA to judge whether momentum is actually supporting the move.
Scalping With HMA
One of the biggest mistakes in scalping is thinking you need to take every setup you can see. That is where many traders get into trouble. There is a common illusion that scalpers need to behave like high-frequency traders, firing off trades all day just because they are on the 1-minute or 5-minute chart.
To resolve that, this hull moving average strategy uses 3 HMAs in conjunction, and aims to find trend alignment as an entry signal.
Only when all trends are aligned in the same direction, do you fire off a trade:
- HMA (20) > HMA (50) > HMA (200) suggests an uptrend with momentum
- HMA (20) < HMA (50) < HMA (200) suggests a downtrend with momentum
Note that this is not a crossover strategy. Not a price crossing over HMA, or HMA crossing over HMA strategy. This is because it would either simply produce too little signals, or produce a lot of false signals in choppy, sideways markets.
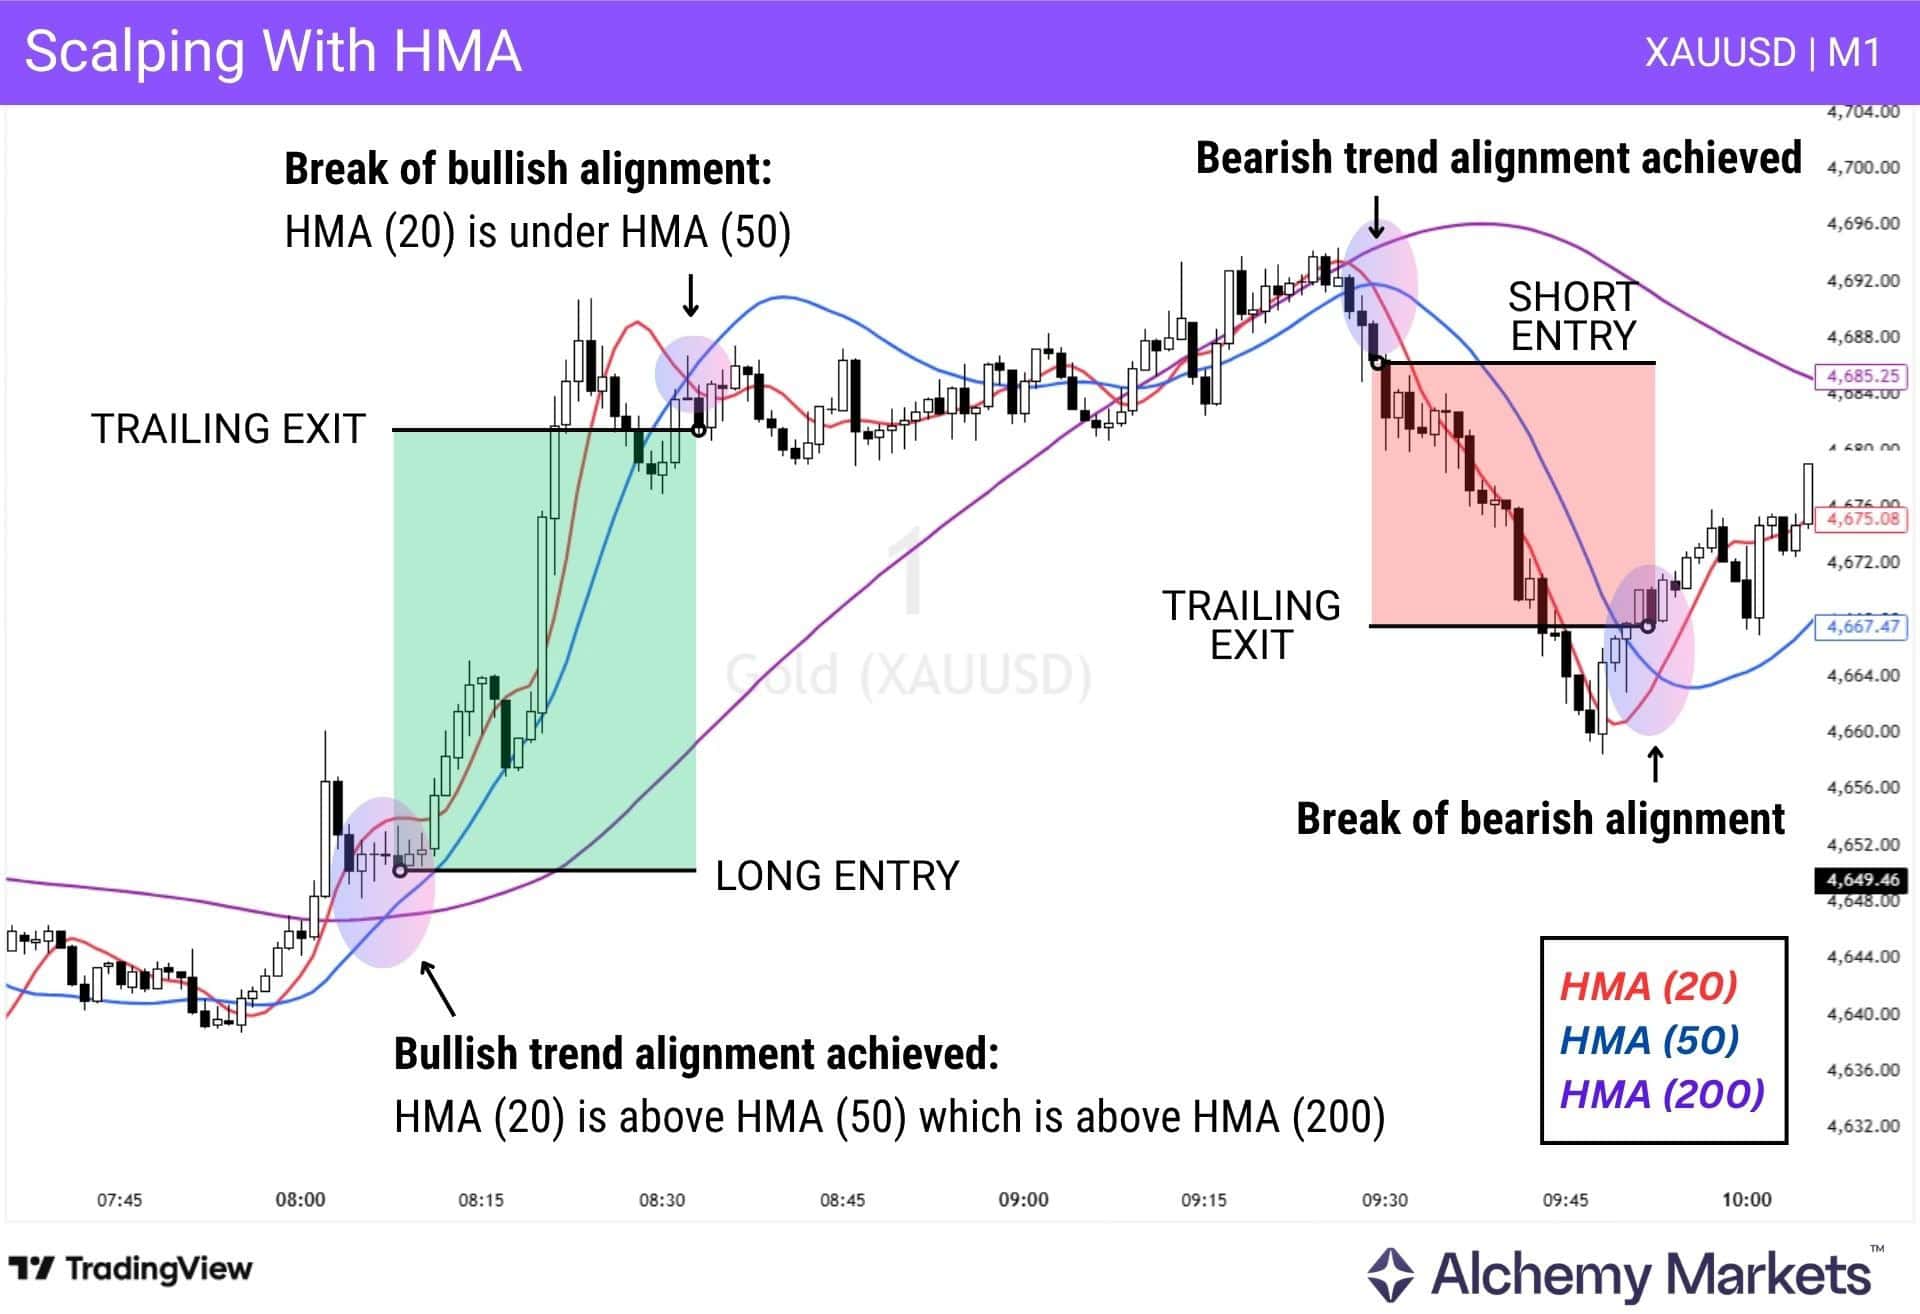
In the XAUUSD 1-minute example, the bullish move begins when the faster HMA rises above the medium HMA, while both stay above the slower HMA. That creates bullish alignment.
Later, once that structure breaks and the HMA stack flips lower, the bias shifts and the bearish move becomes the cleaner opportunity.
The main value of this approach is selectivity. It does not tell traders to trade more. It helps them trade less, but with better filtering. On very low timeframes, that can make a major difference.
HMA With RSI
The Relative Strength Index (RSI) can work well with the Hull Moving Average when the goal is to filter reversal setups instead of reacting to every price crossover on its own.
In this example, we use HMA (20) together with the RSI. The RSI helps flag whether the market is stretched into an overbought or oversold condition first, while the HMA helps confirm whether price is starting to turn with enough momentum to matter.
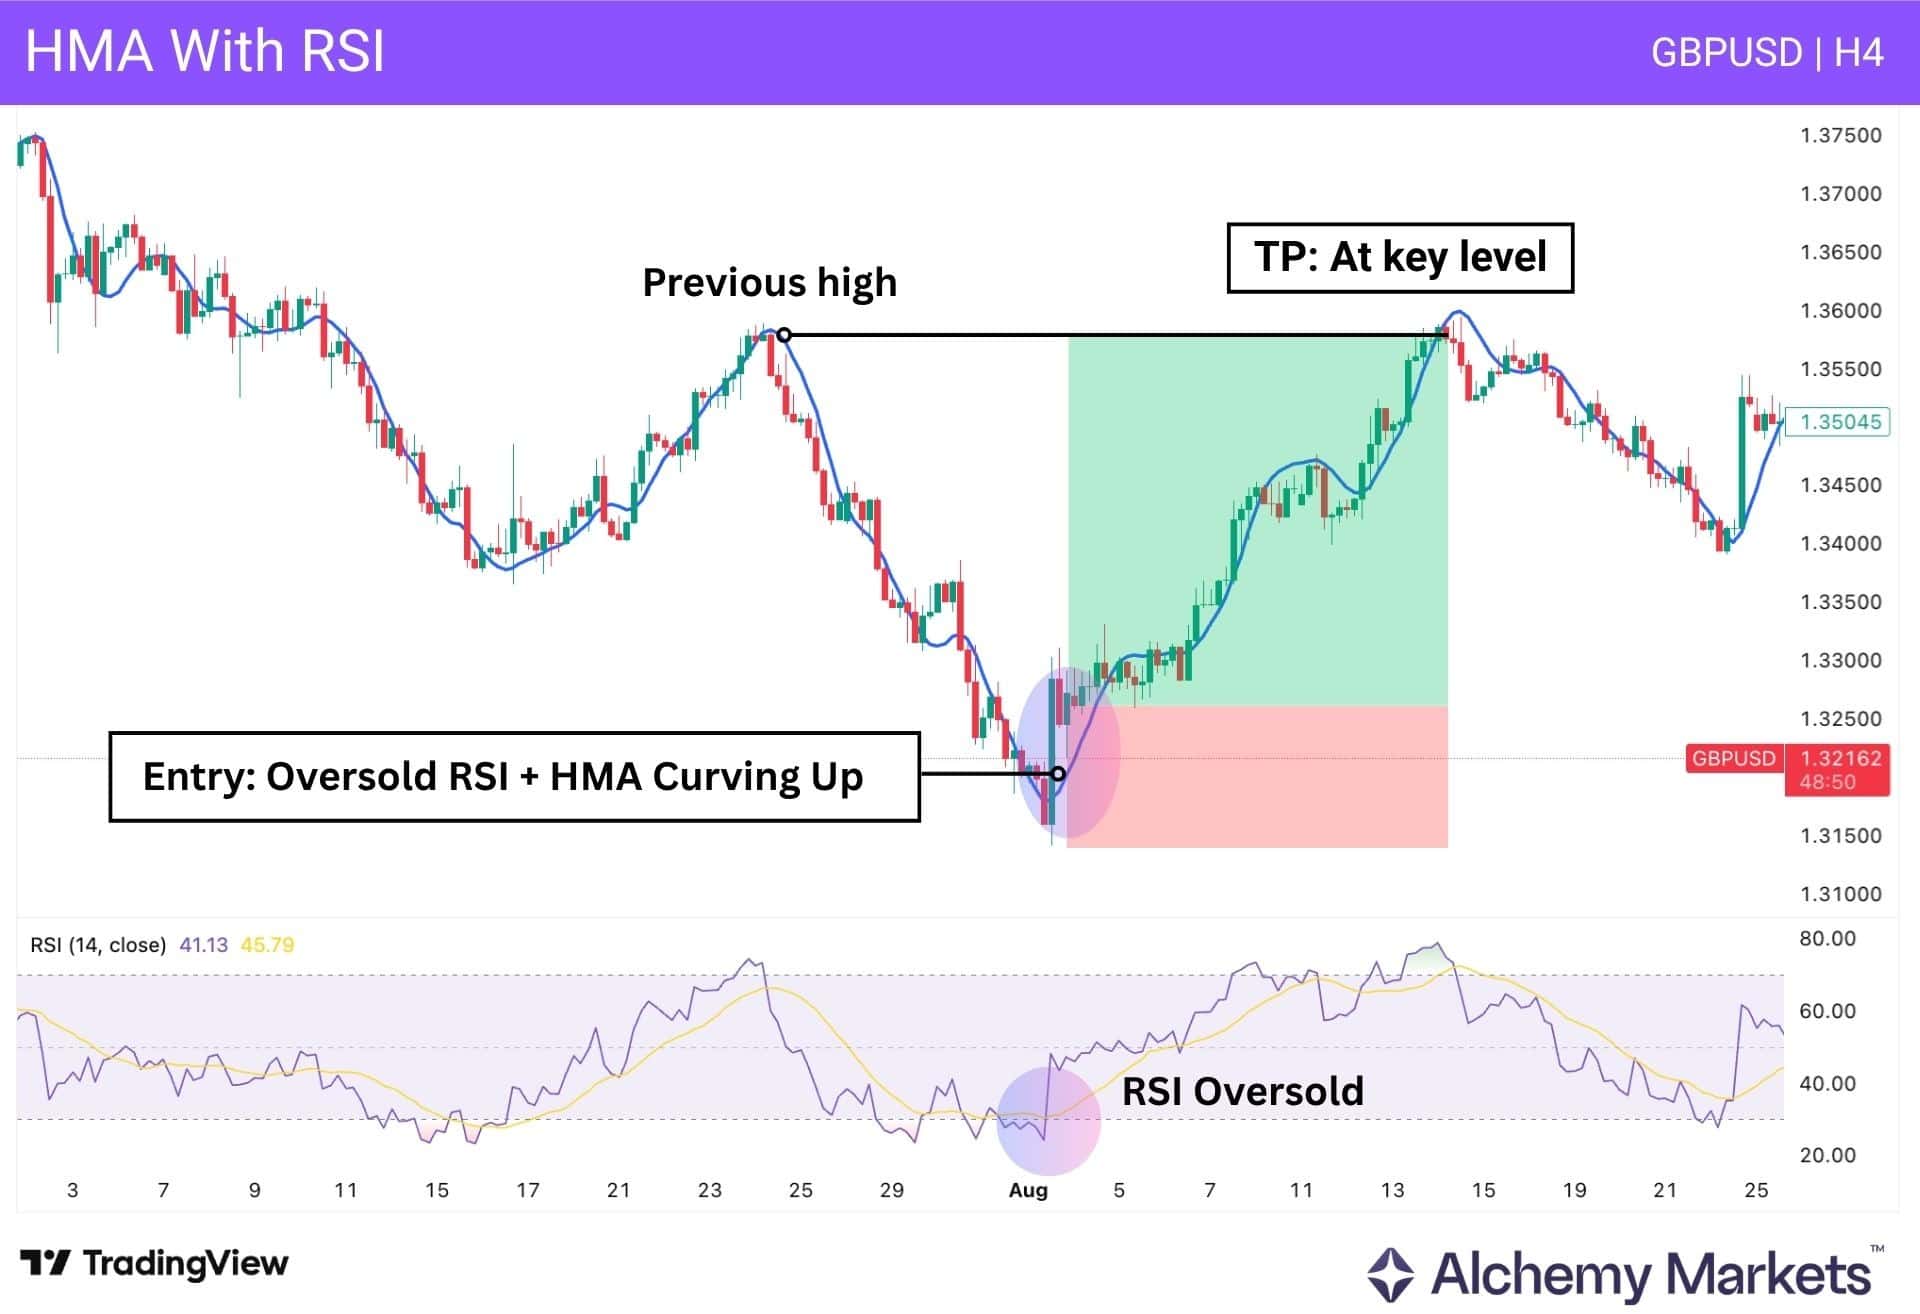
For a bullish setup, traders can first look for the RSI to reach or dip below the oversold zone.
After that, a price crossover back above the HMA (20) becomes more useful because the move is already being pre-filtered by the RSI signal. Rather than entering on the first touch, waiting for the HMA to start curving upward and for one or two candles to close after the crossover can help confirm that momentum is actually building in the reversal direction.
The same logic works in reverse for bearish setups. If the RSI reaches or pushes near the overbought zone, traders can watch for price to cross below the HMA (20) and for the line itself to start curving lower.
In this way, the RSI identifies exhaustion, while the HMA helps confirm momentum; whether price is beginning to reverse with enough follow-through to justify the trade.
HMA with MACD
The MACD can pair well with the Hull Moving Average when the goal is to trade with trend and momentum rather than take every reversal on sight.
In this example, we use HMA (20) together with the MACD. The HMA helps show whether price is holding directional strength, while the MACD adds another layer of confirmation through its crossover and histogram shift.
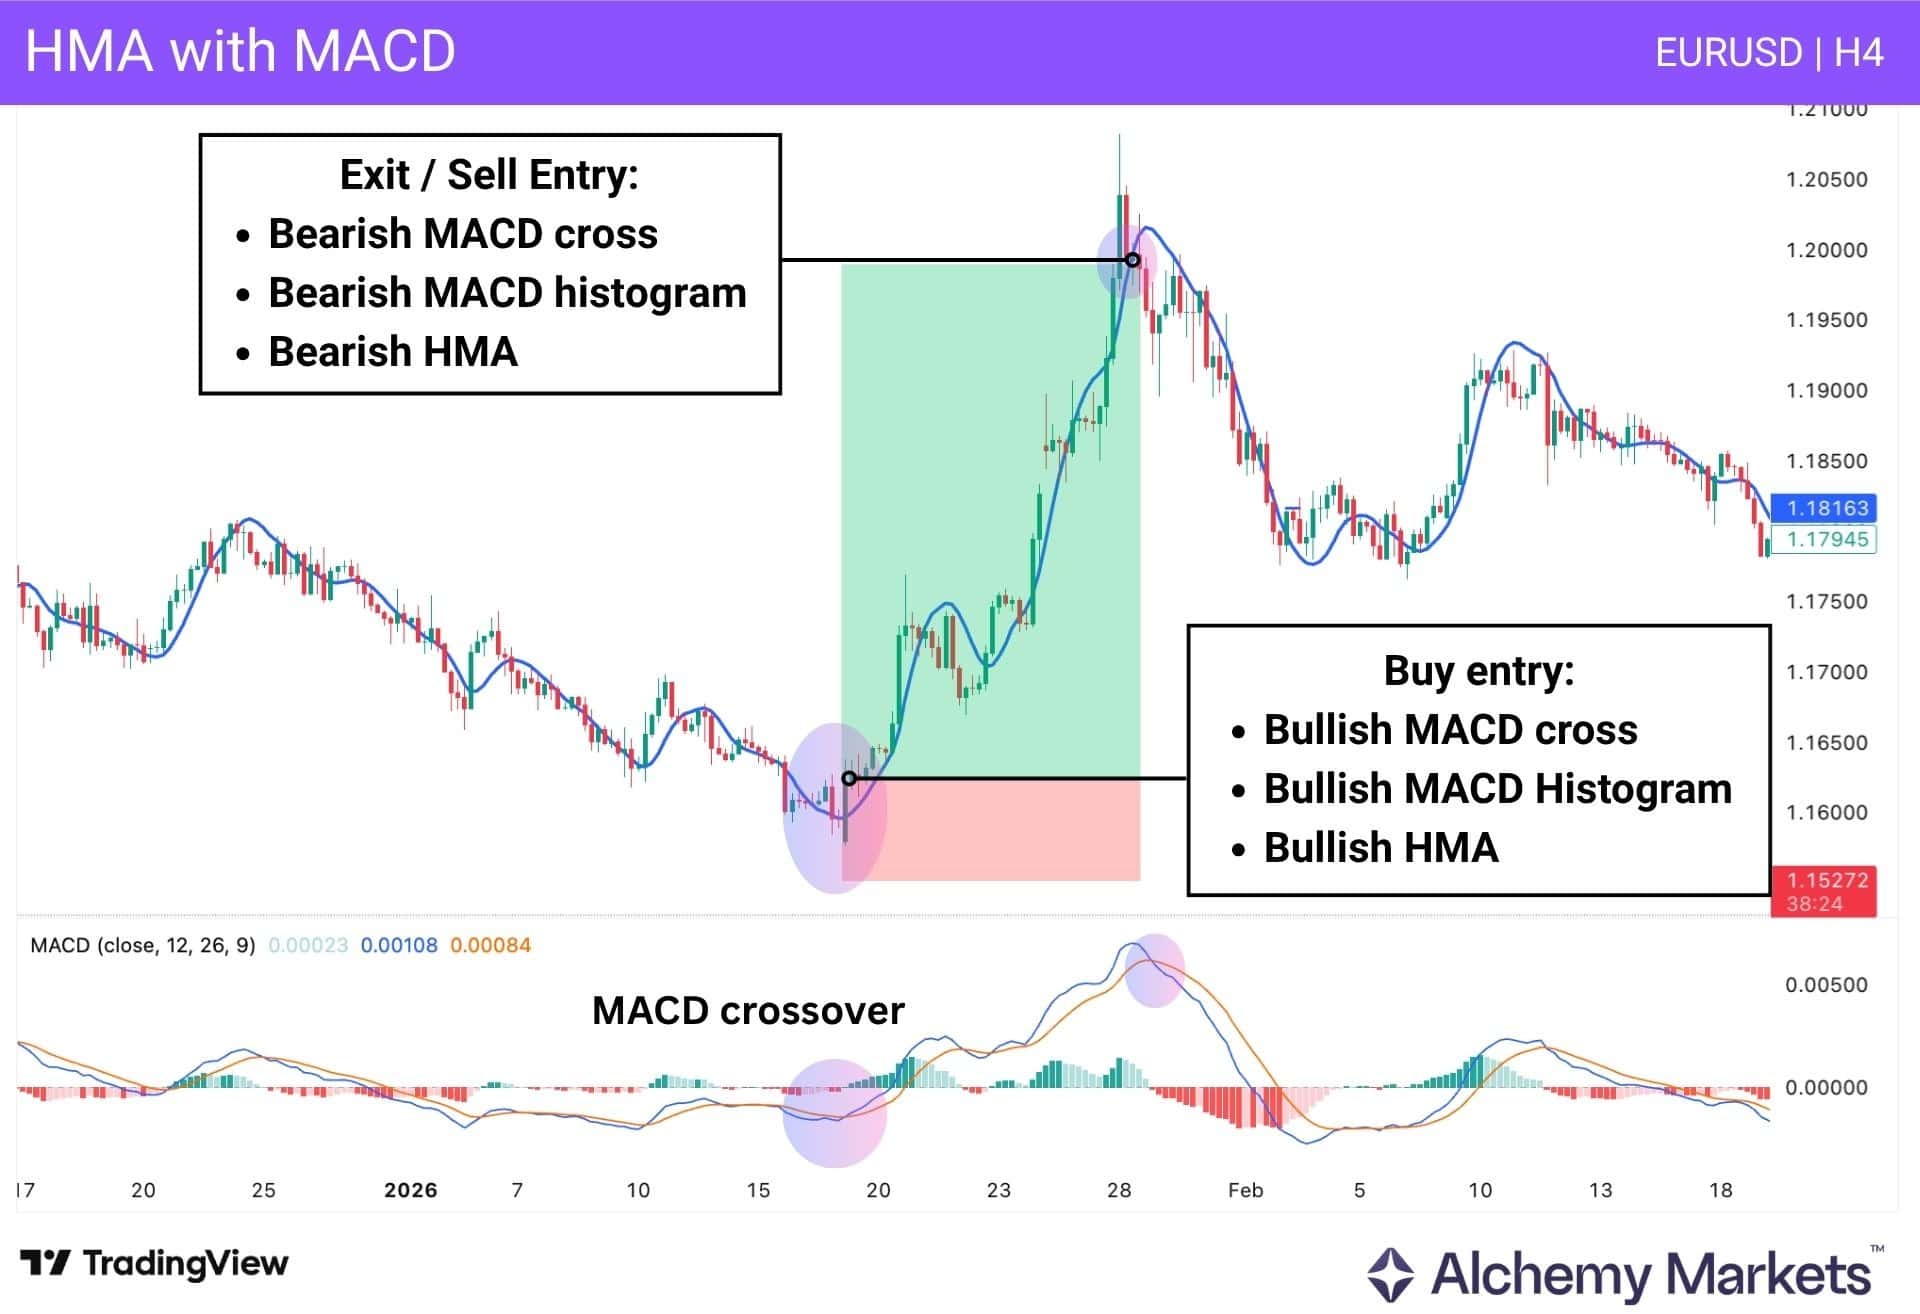
For a bullish setup, traders can look for prices to move above the HMA (20), with the HMA starting to slope upward.
At the same time, the MACD line should cross above the signal line, with the histogram turning positive.
That creates a triple-layer filter: price is reclaiming the HMA, the HMA itself is turning higher, and MACD momentum is confirming the move. The same logic works in reverse for bearish setups, with price below the HMA, the HMA curving lower, a bearish MACD cross, and a negative histogram.
This approach can sometimes resemble a stop-and-reverse style signal, which on its own can be risky and often leads to poor entries in choppy conditions. The difference here is that the setup is more selective because it requires alignment across price, HMA slope, and MACD momentum before the trade is considered.
Traders can then either manage the position until the opposite signal appears or choose to take profit at a key chart level instead.
HMA With Volume
Volume can be more useful with the Hull Moving Average when it is used as a confirmation layer, not just as a standalone burst in activity. In this example, we use HMA (30) to define the directional bias, then wait for a volume breakout to confirm that price is moving with enough participation to matter.
The idea is simple: the HMA tells you the likely path of least resistance, while volume helps confirm whether momentum is actually expanding in that direction.
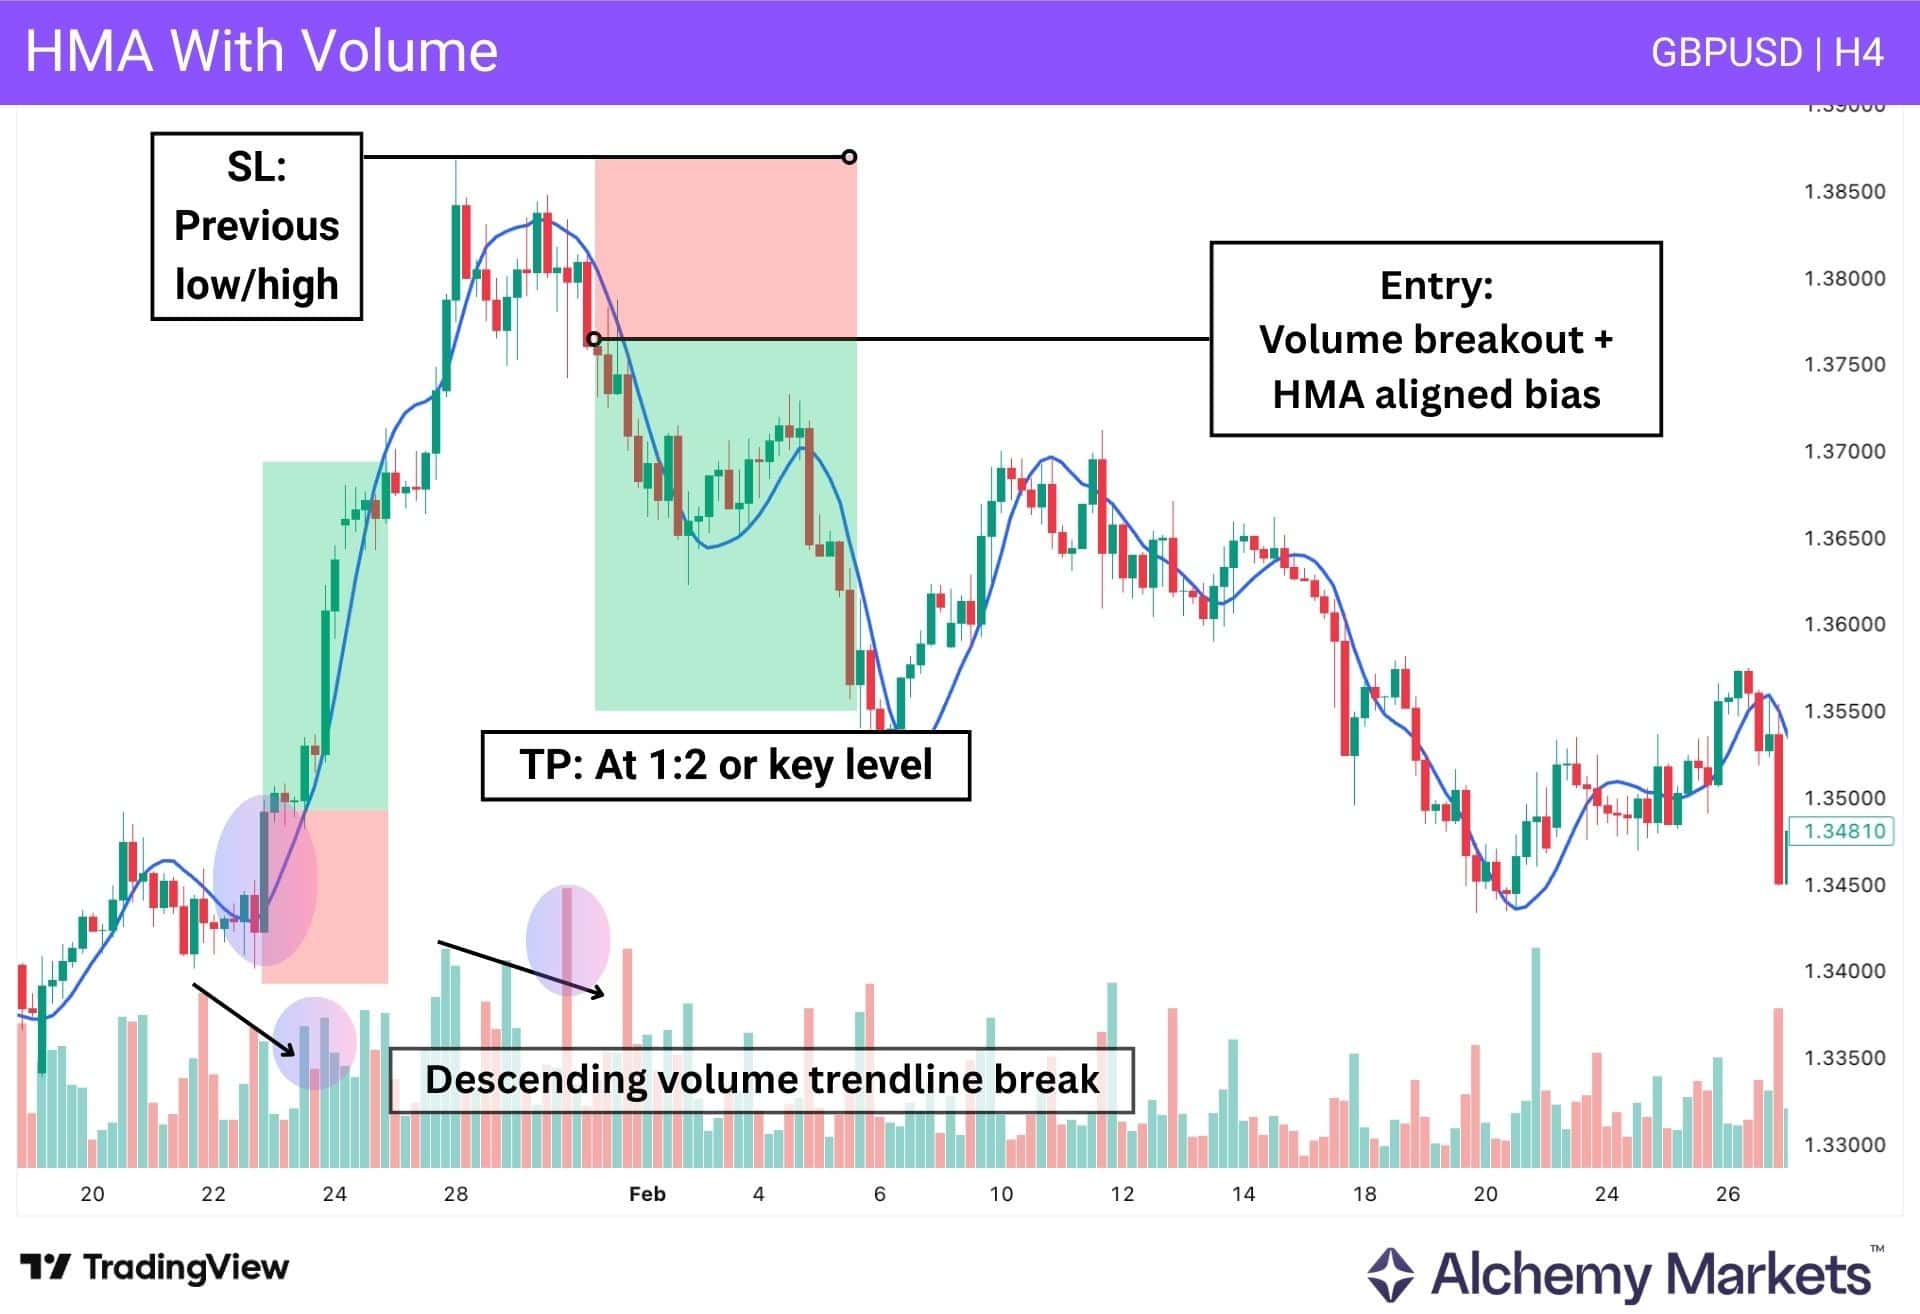
For a bullish setup, traders can look for price to hold above a rising HMA (30), then wait for a clear expansion in volume, such as a break above recent volume compression or a breakout through a descending volume trendline.
That combination suggests the move has both directional bias and participation behind it. The same logic applies in reverse for bearish setups, with price below a falling HMA and volume expanding as sellers take control.
In this method, the stop loss can be placed beyond the previous swing low or high, while profit targets can be taken at a 1:2 risk-reward ratio or into the next key chart level. Used this way, volume does not replace the HMA. It helps confirm whether the HMA-aligned move has enough conviction to trade.
HMA With Bollinger Bands
A more structured way to combine the Hull Moving Average with Bollinger Bands® is to use the HMA (50) as the broader trend filter and the Bollinger Bands (SMA 25, 1 SD) as the momentum trigger.
A simple rule of thumb is to set the Bollinger period at roughly half of the HMA period, which helps separate the slower trend bias from the faster short-term expansion.
In this setup, traders first look for alignment between the HMA and the Bollinger midline. If both are curving lower, the bias is bearish. The next step is to confirm that price has indeed pushed outside the 1 standard deviation (sd) of the Bollinger Band in the same direction.
That 1sd is significant, because it implies that price has moved beyond its regular deviation. It suggests momentum is expanding beyond the usual short-term range, rather than staying within an expected range.
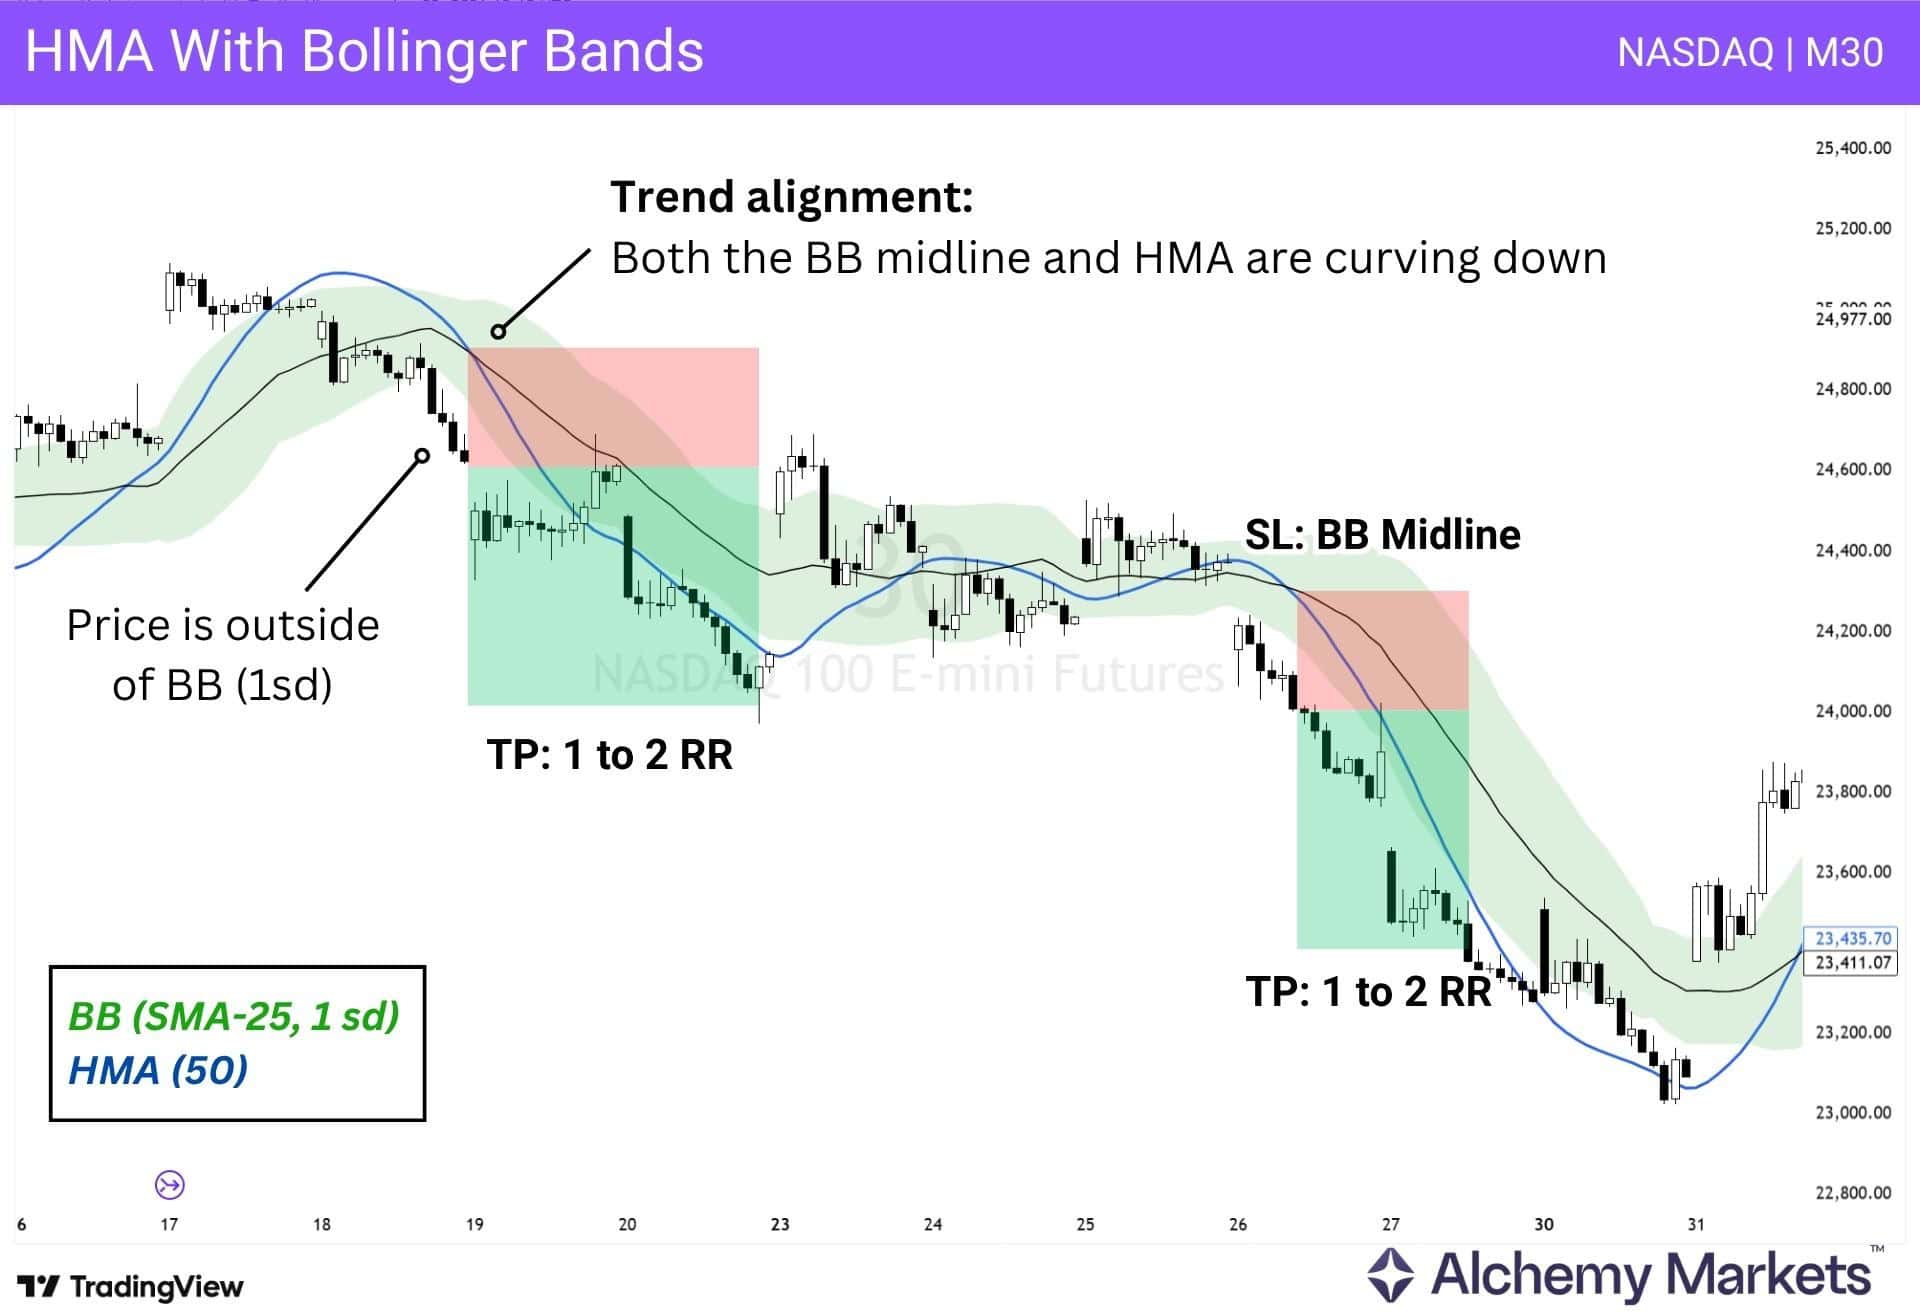
In the NASDAQ M30 example, both the HMA and the Bollinger midline slope downward, then price breaks outside the lower 1 SD band, creating a cleaner continuation short.
Risk can then be framed around the structure of the setup. A stop loss can be placed back at or just beyond the Bollinger midline, while profit can be taken at around 1:2 risk-reward or into the next key level. The same logic applies in reverse for bullish setups: both lines curve higher, and price expands through the upper 1 SD band in the direction of the trend.
One key aspect of this strategy is that Bollinger Bands generally work better with shorter periods, such as <25, and rarely need to go much beyond 50. Shorter settings respond faster to current volatility, making them more useful for spotting momentum expansion, which is what this setup is built to trade. Larger periods are slower to adjust and can end up producing fewer or later signals.
HMA with Support and Resistance
Support and resistance become more useful when they are combined with a momentum filter rather than traded on their own. In this setup, the key horizontal levels define where price is likely to react, while the HMA (20) helps confirm whether momentum is actually shifting away from that zone.
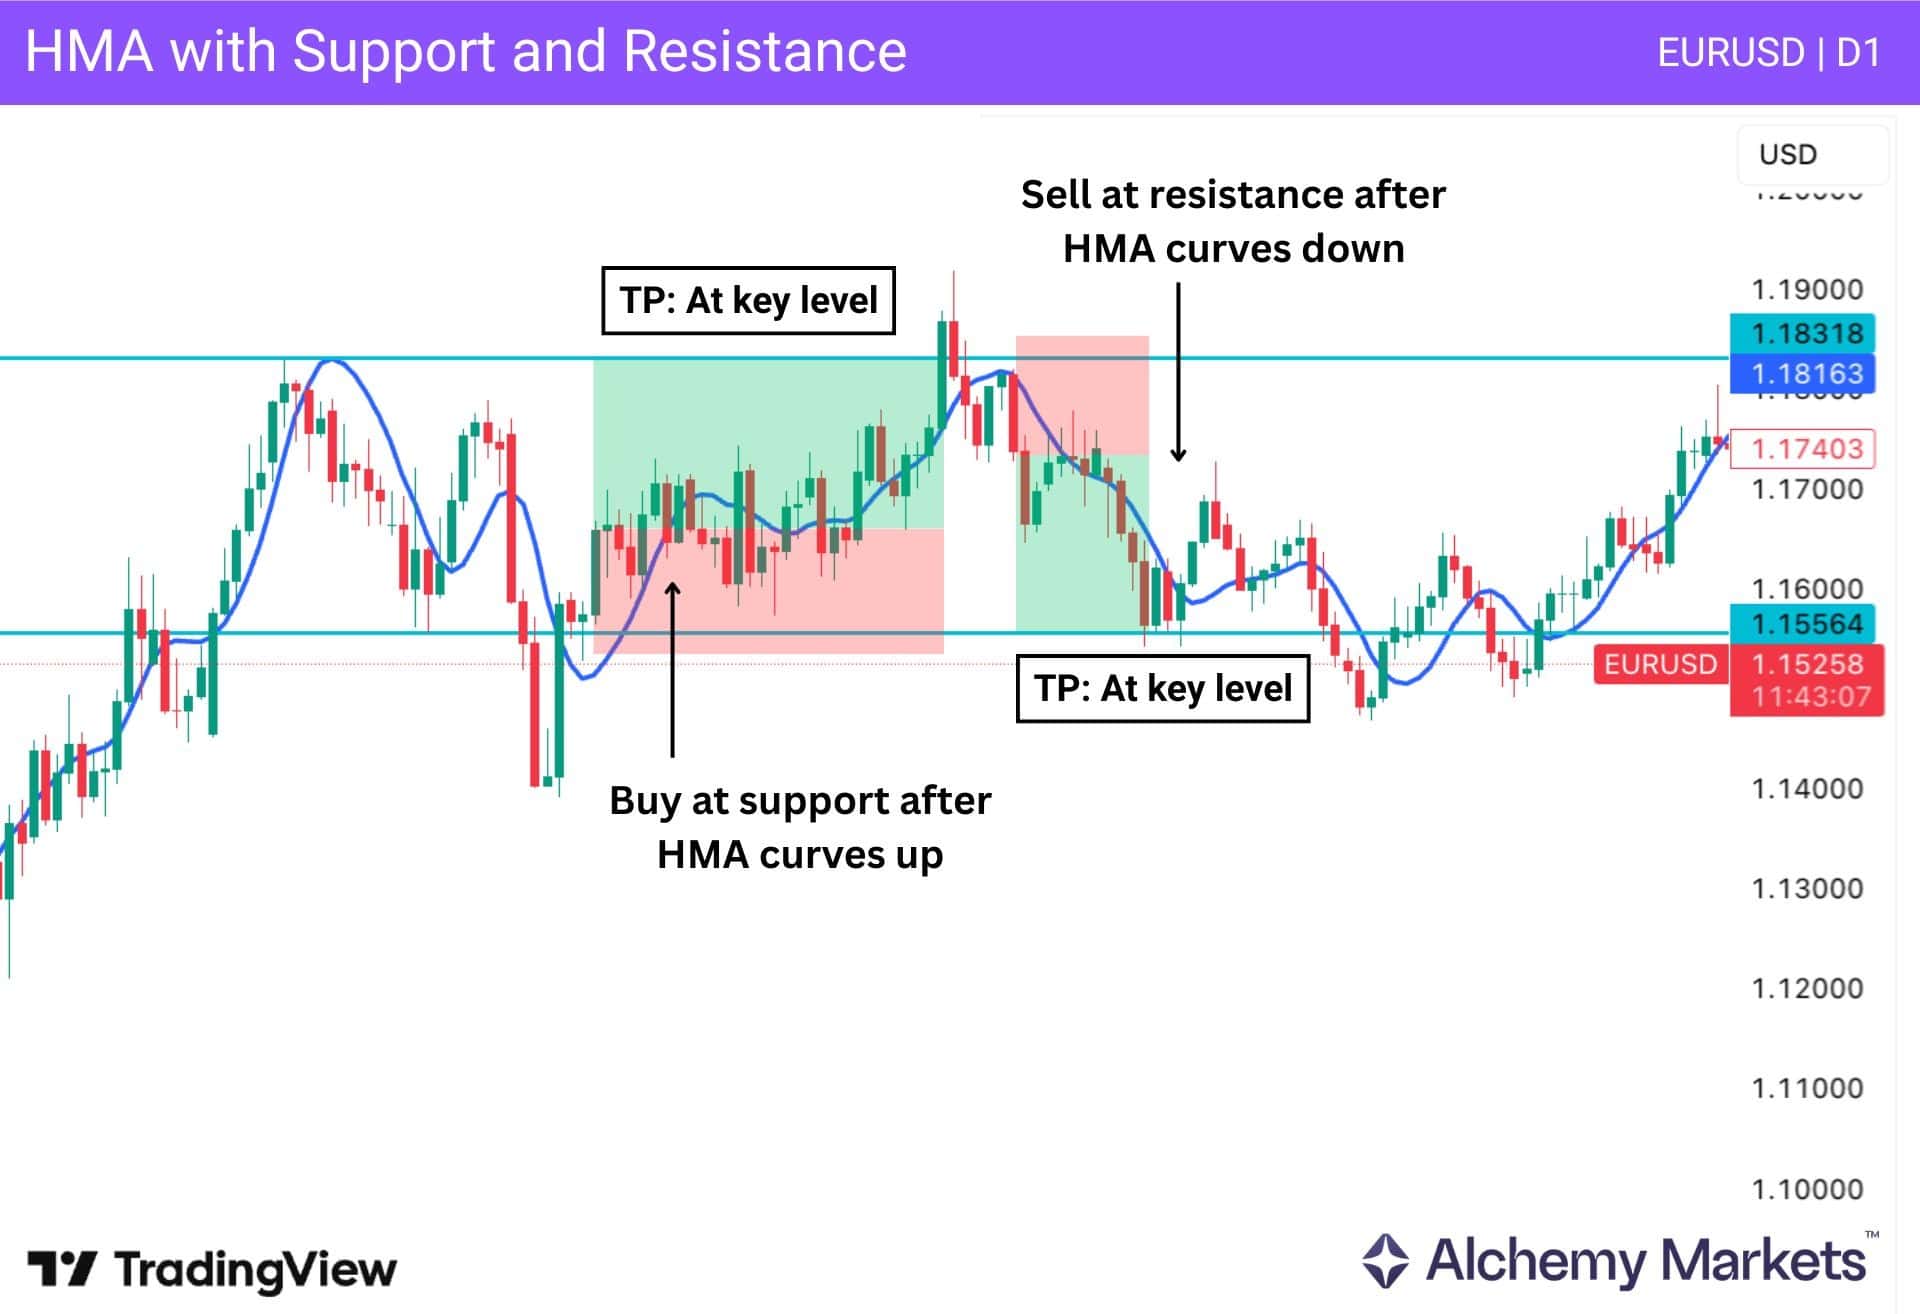
In the EURUSD daily example, the bullish setup appears when price reacts from support and then crosses back above the HMA (20). That suggests buyers are regaining control after the level holds.
The bearish setup works the same way in reverse: price reacts from resistance, crosses below the HMA (20), and starts moving away from the level with bearish momentum. In both cases, the next key support or resistance zone can be used as the take-profit area.
The strength of this approach is that it gives each tool a clear role. Support and resistance provide the structure, while the HMA (20) helps confirm whether price is simply touching the level or actually moving away from it with intent.
HMA with Stochastic Oscillator
The Stochastic Oscillator can work well with the HMA (20) when the goal is to filter reversal setups rather than trade every overbought or oversold reading on its own. In this setup, the Stochastic highlights when price is becoming stretched, while the HMA helps confirm whether momentum is actually starting to turn.
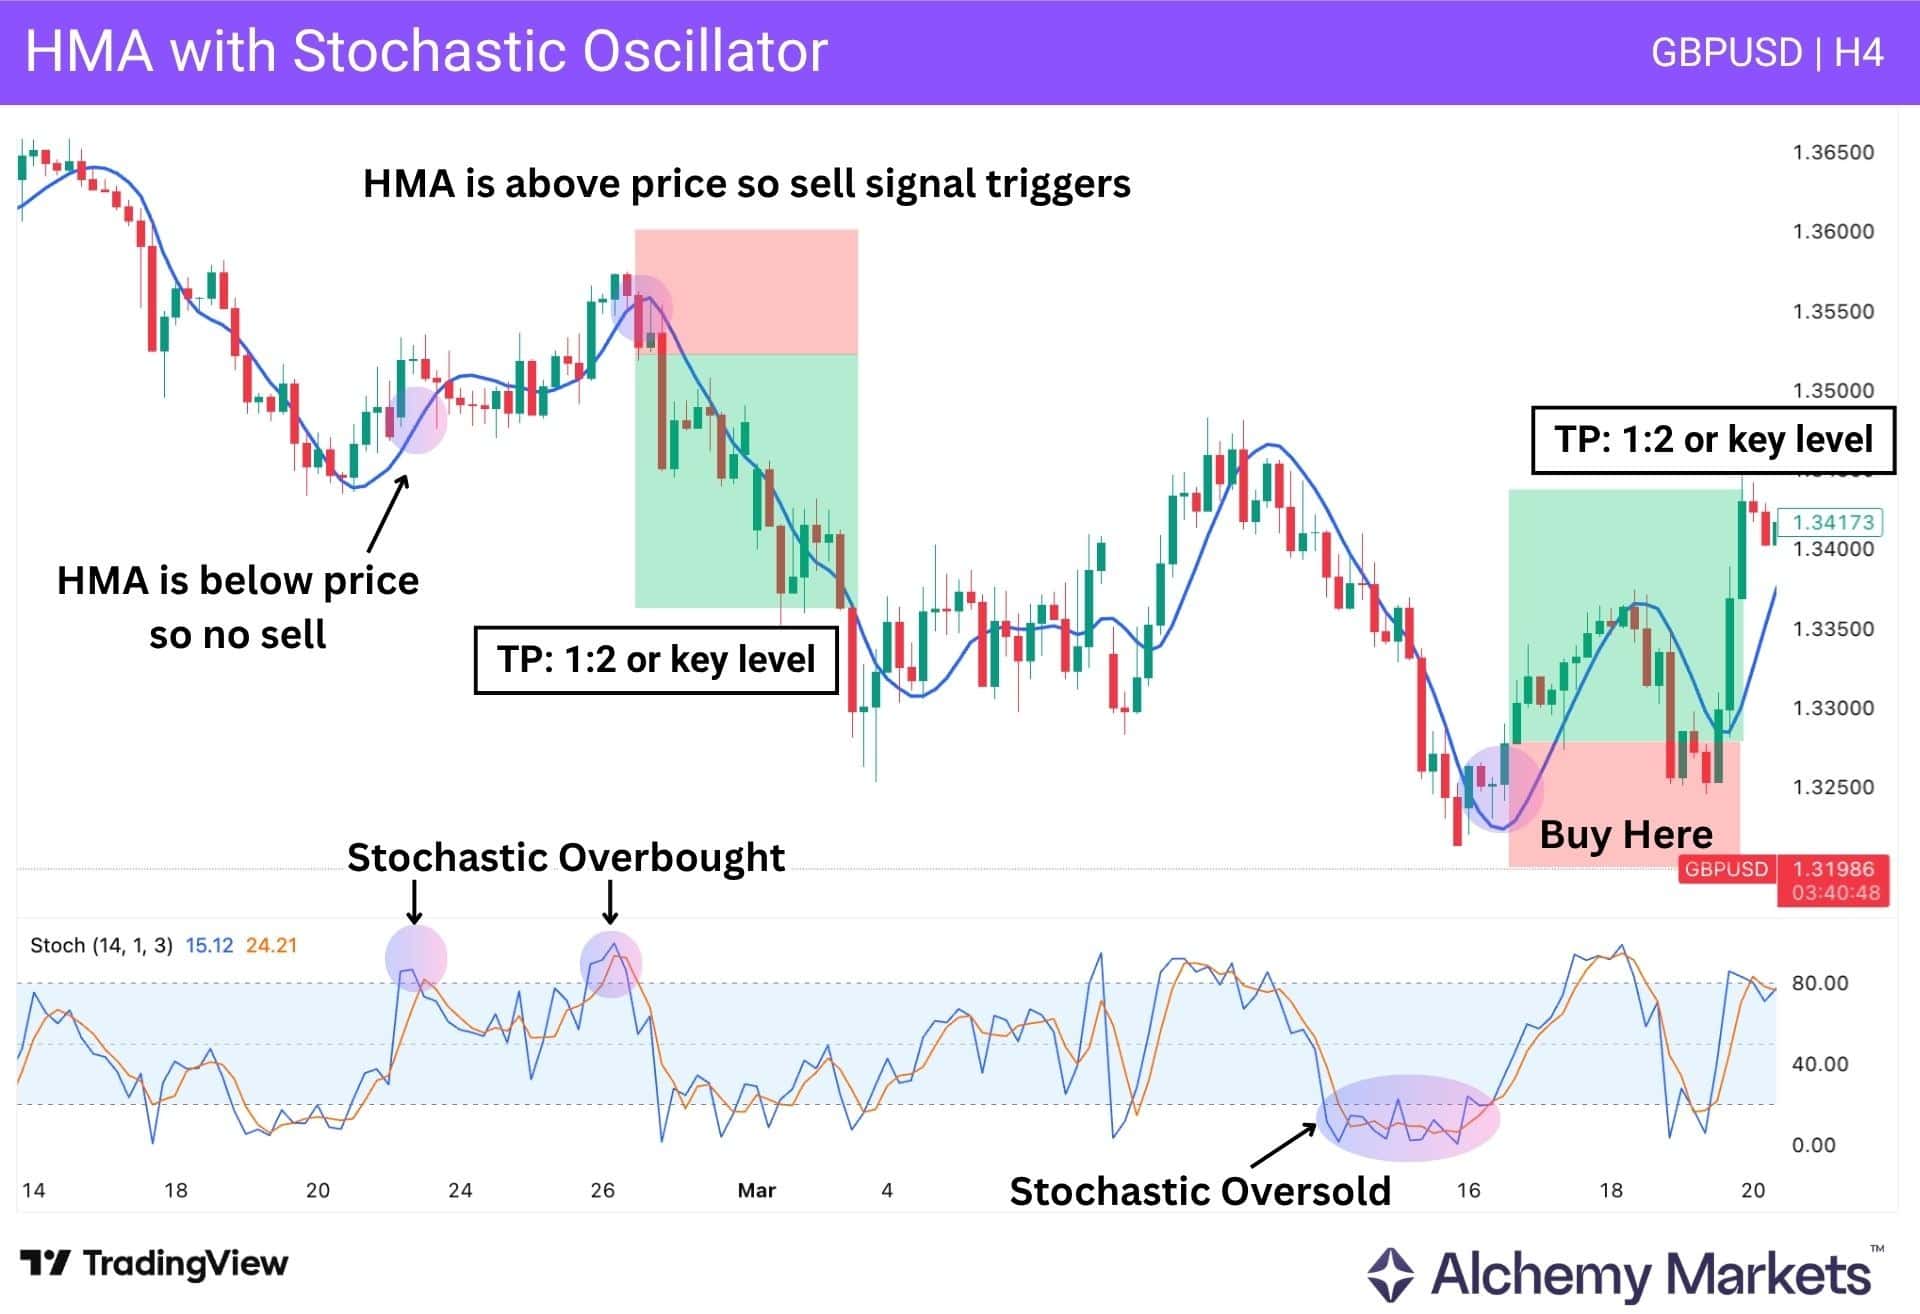
For a bearish setup, traders can first look for the Stochastic lines to cross lower near the overbought zone. That signal becomes more useful when the HMA (20) is also above price and starts turning down, as shown in the GBPUSD H4 example.
This matters because an overbought Stochastic alone is not enough. If the HMA is still below price, the market may simply be strong rather than ready to reverse.
The same logic applies in reverse for bullish setups: the Stochastic reaches oversold conditions, price reclaims the HMA (20), and the HMA begins curving higher.
Used this way, the Stochastic acts as the exhaustion filter, while the HMA acts as the directional filter. That makes the setup more selective and helps traders avoid fading momentum too early.
HMA with Candlestick Reversal Pattern
Candlestick reversal patterns become more useful when they are traded in context rather than in isolation.
In this setup, the HMA (50) acts as the trend filter, while the candlestick pattern helps time the entry during a pullback. The goal is not to buy or sell every reversal candle, but to focus on those that form when price is retracing into a market that still has directional momentum.
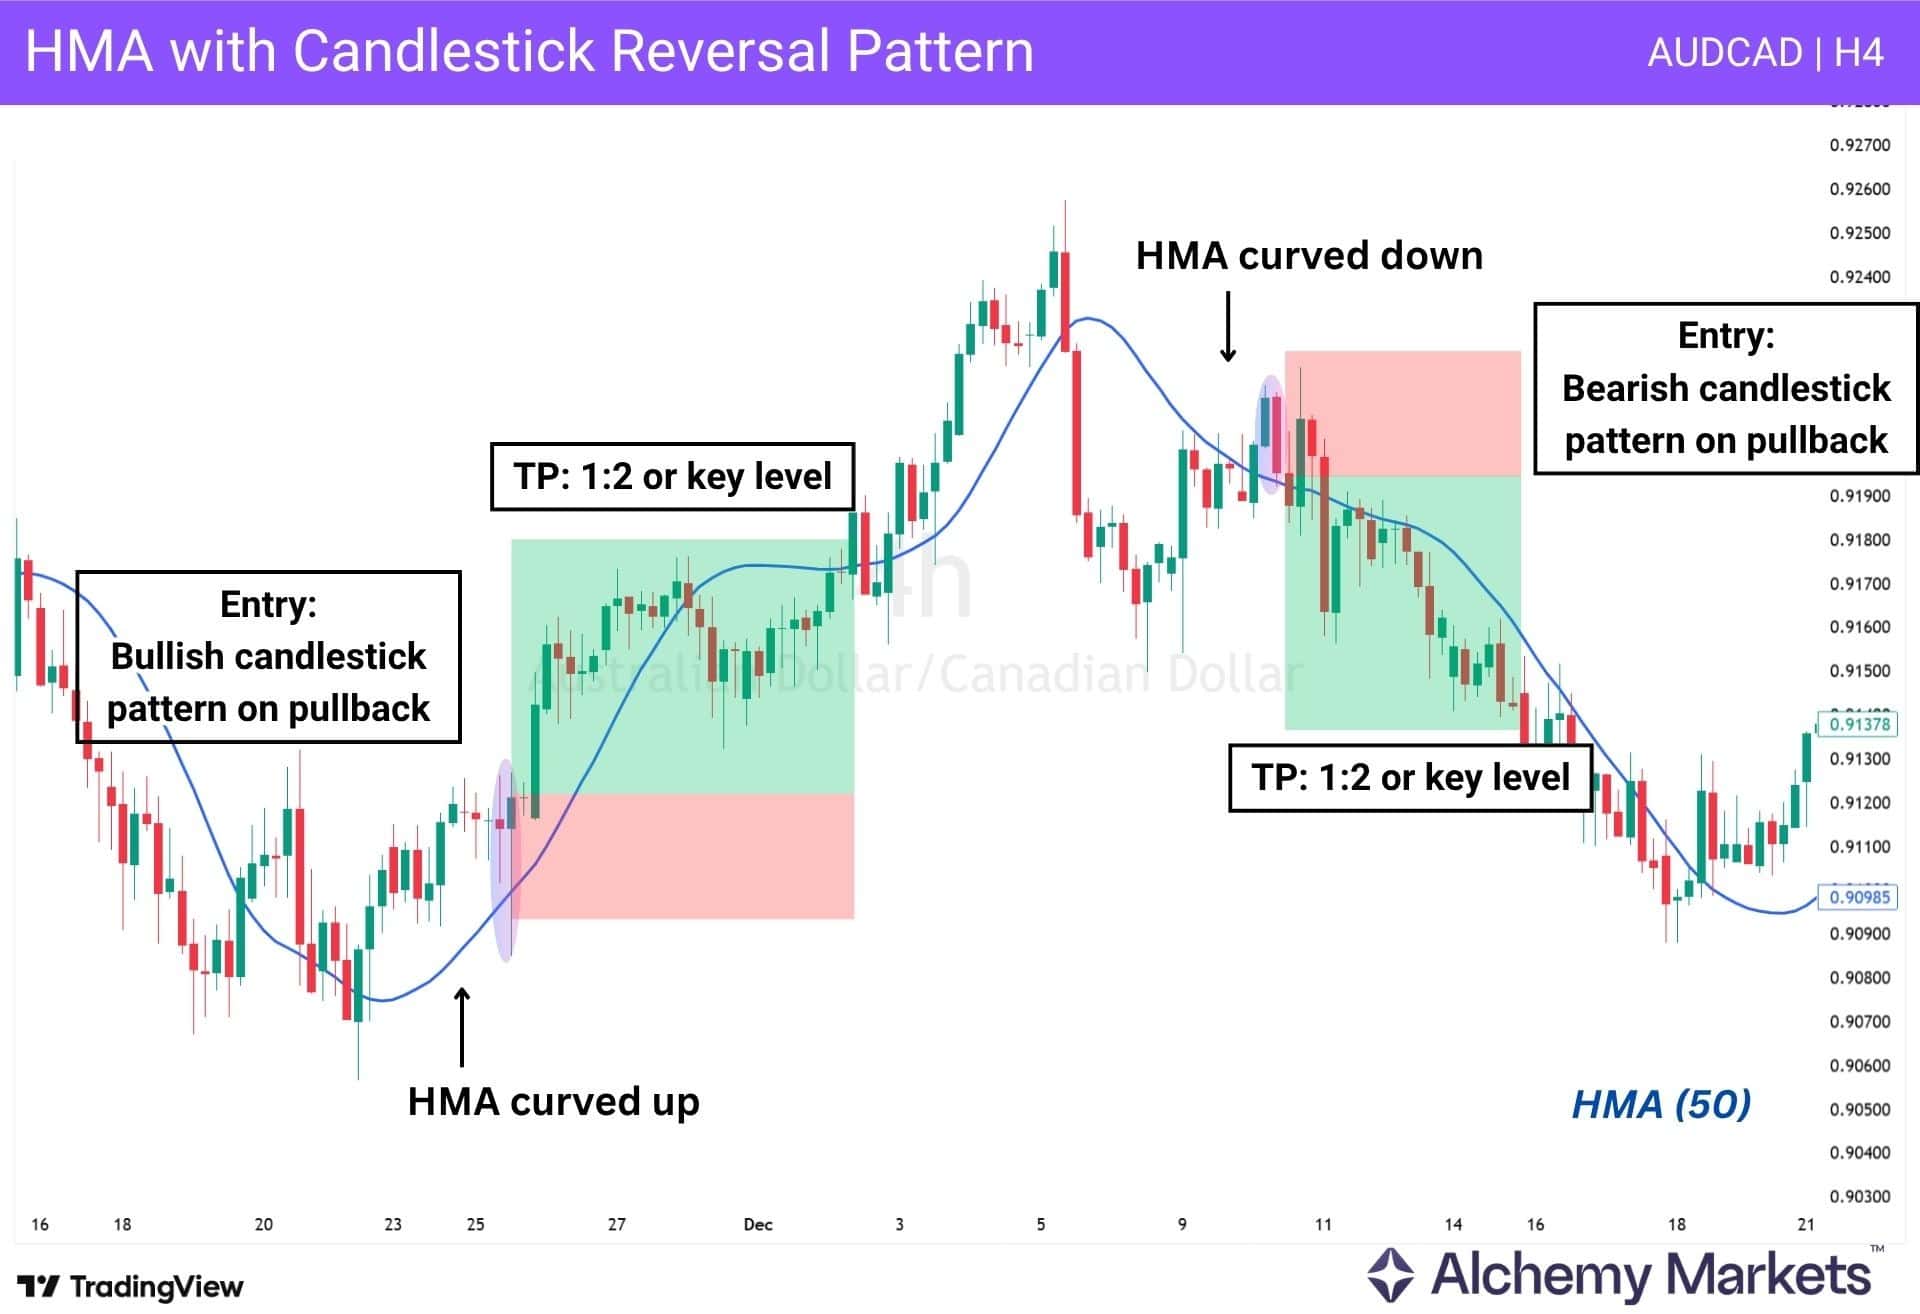
In the AUDCAD H4 example, the bullish setup appears after the HMA (50) starts curving higher. Price then pulls back, forms a bullish reversal candle, and resumes in the direction of the rising HMA.
The bearish setup works the same way in reverse: the HMA (50) turns lower, price rallies into a pullback, and a bearish reversal candle forms before the trend continues downward.
Patterns such as bullish or bearish engulfing candles, hammers, shooting stars, and pin bars can all be used here, provided they form in the right location.
HMA Crossovers and Pattern Confirmation
Chart patterns become more useful when they are confirmed by momentum rather than traded on shape alone. In this setup, the HMA (20) is used as a directional filter, while the pattern provides the structure.
The idea is to wait for a chart pattern such as a double bottom or double top to form, then use the HMA to confirm whether price is moving away from the neckline with enough strength to support the breakout.
In the LTCUSD H1 example, the bullish setup appears after a double bottom forms and price breaks above the neckline while also reclaiming the HMA (20).
That suggests the pattern is not only complete, but also supported by improving momentum.
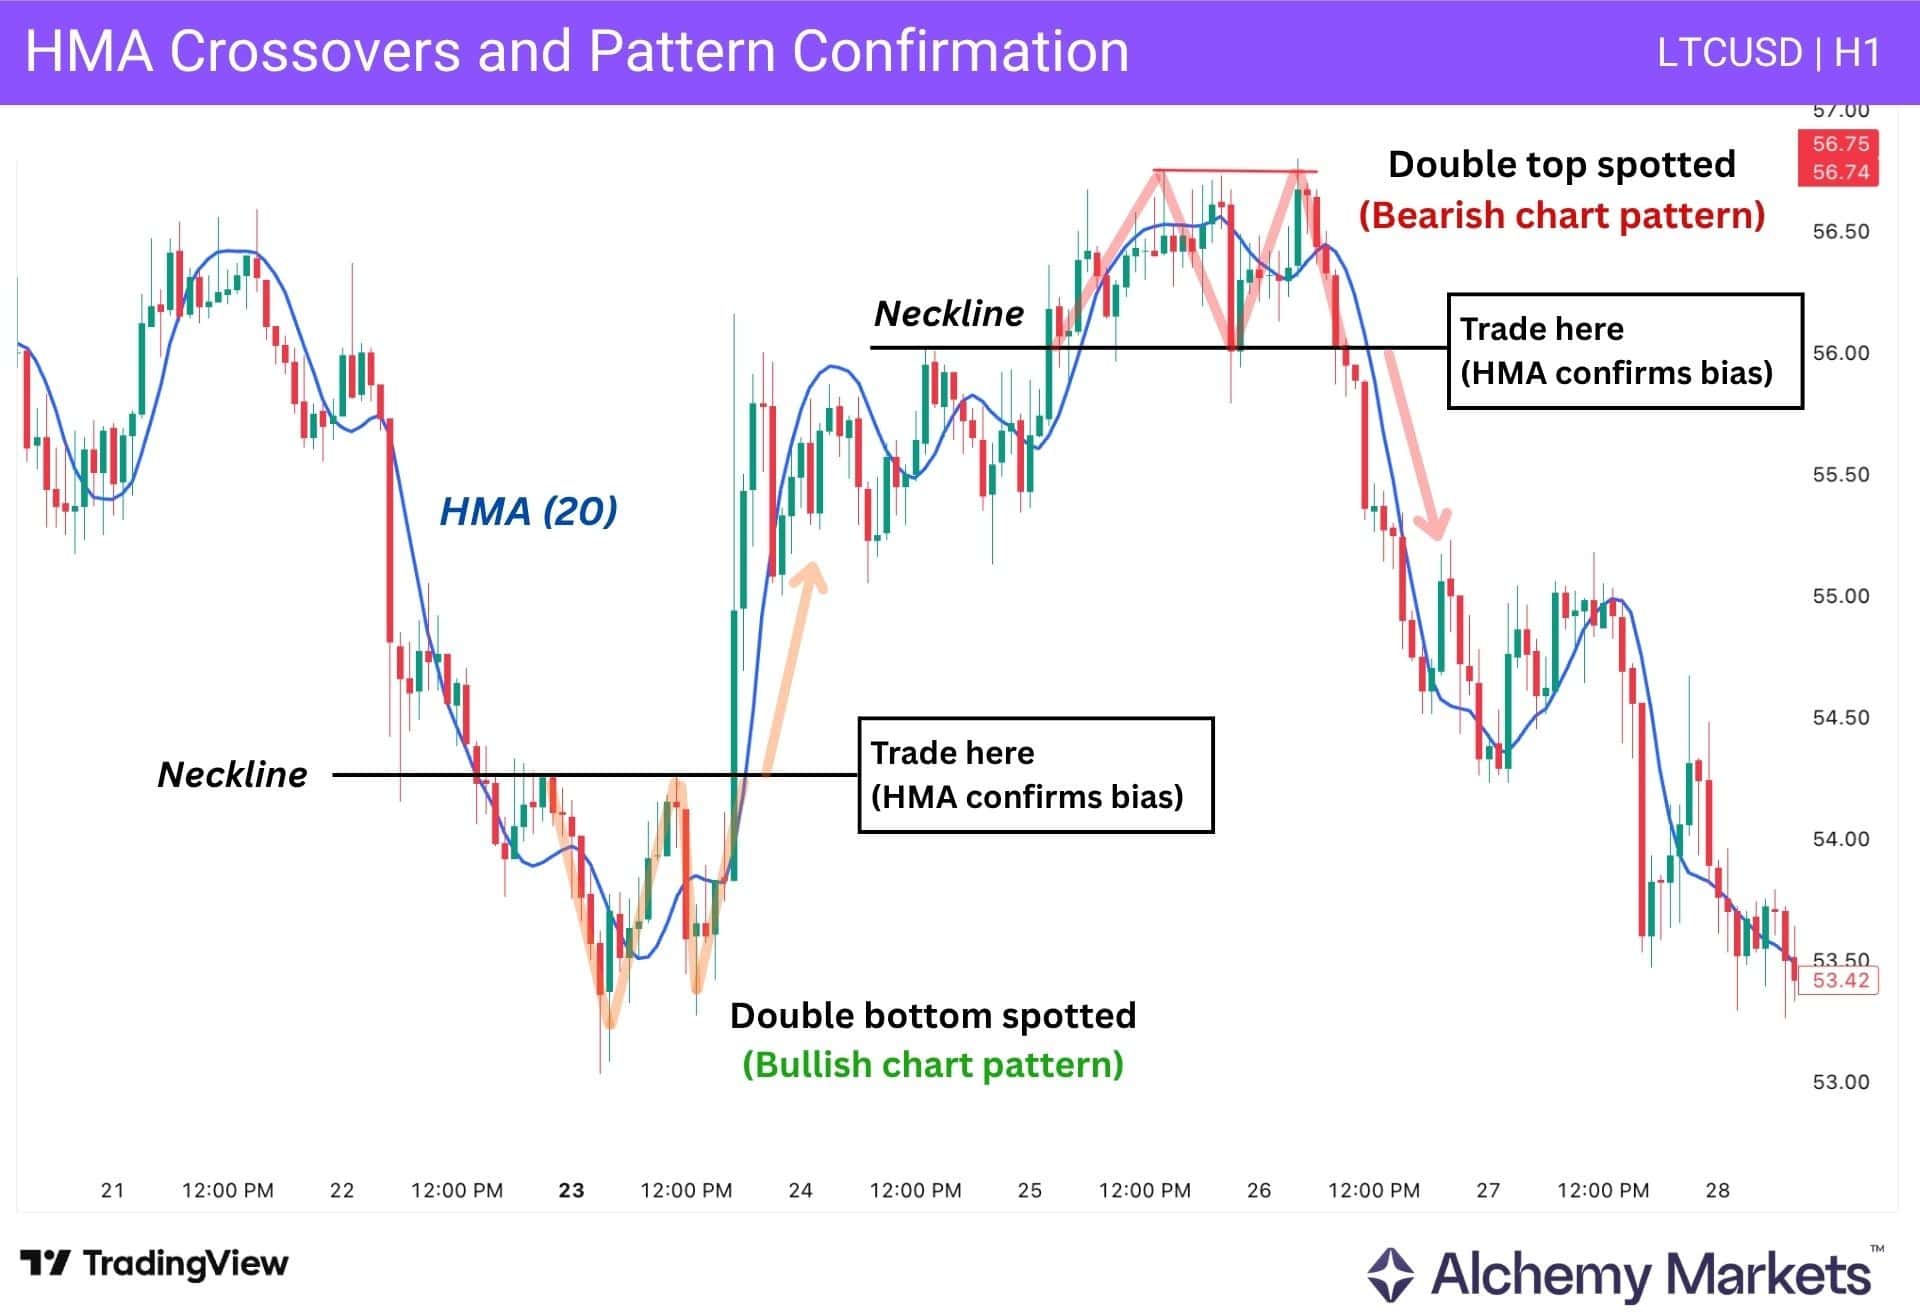
The bearish setup works the same way in reverse: a double top forms, price breaks below the neckline, and the HMA (20) turns lower as price moves away from the pattern.
In both cases, the HMA helps confirm the bias rather than acting as the main trigger.
In this strategy, chart patterns define the structure, breakout trigger, and take profit targets. The HMA (20) helps confirm whether momentum is aligning with the move.
That makes the setup more selective than trading chart patterns alone.
Multi-HMA Approach with Candlestick Patterns
Candlestick patterns can be more useful when they are confirmed by fast-moving trend filters instead of traded on their own.
In this setup, the candlestick signal comes first, while the HMA (10) and HMA (30) are used to confirm whether momentum is starting to move in the same direction. Lower-period HMAs work better here because candlestick signals often form quickly, so the confirmation tool also needs to adapt quickly.
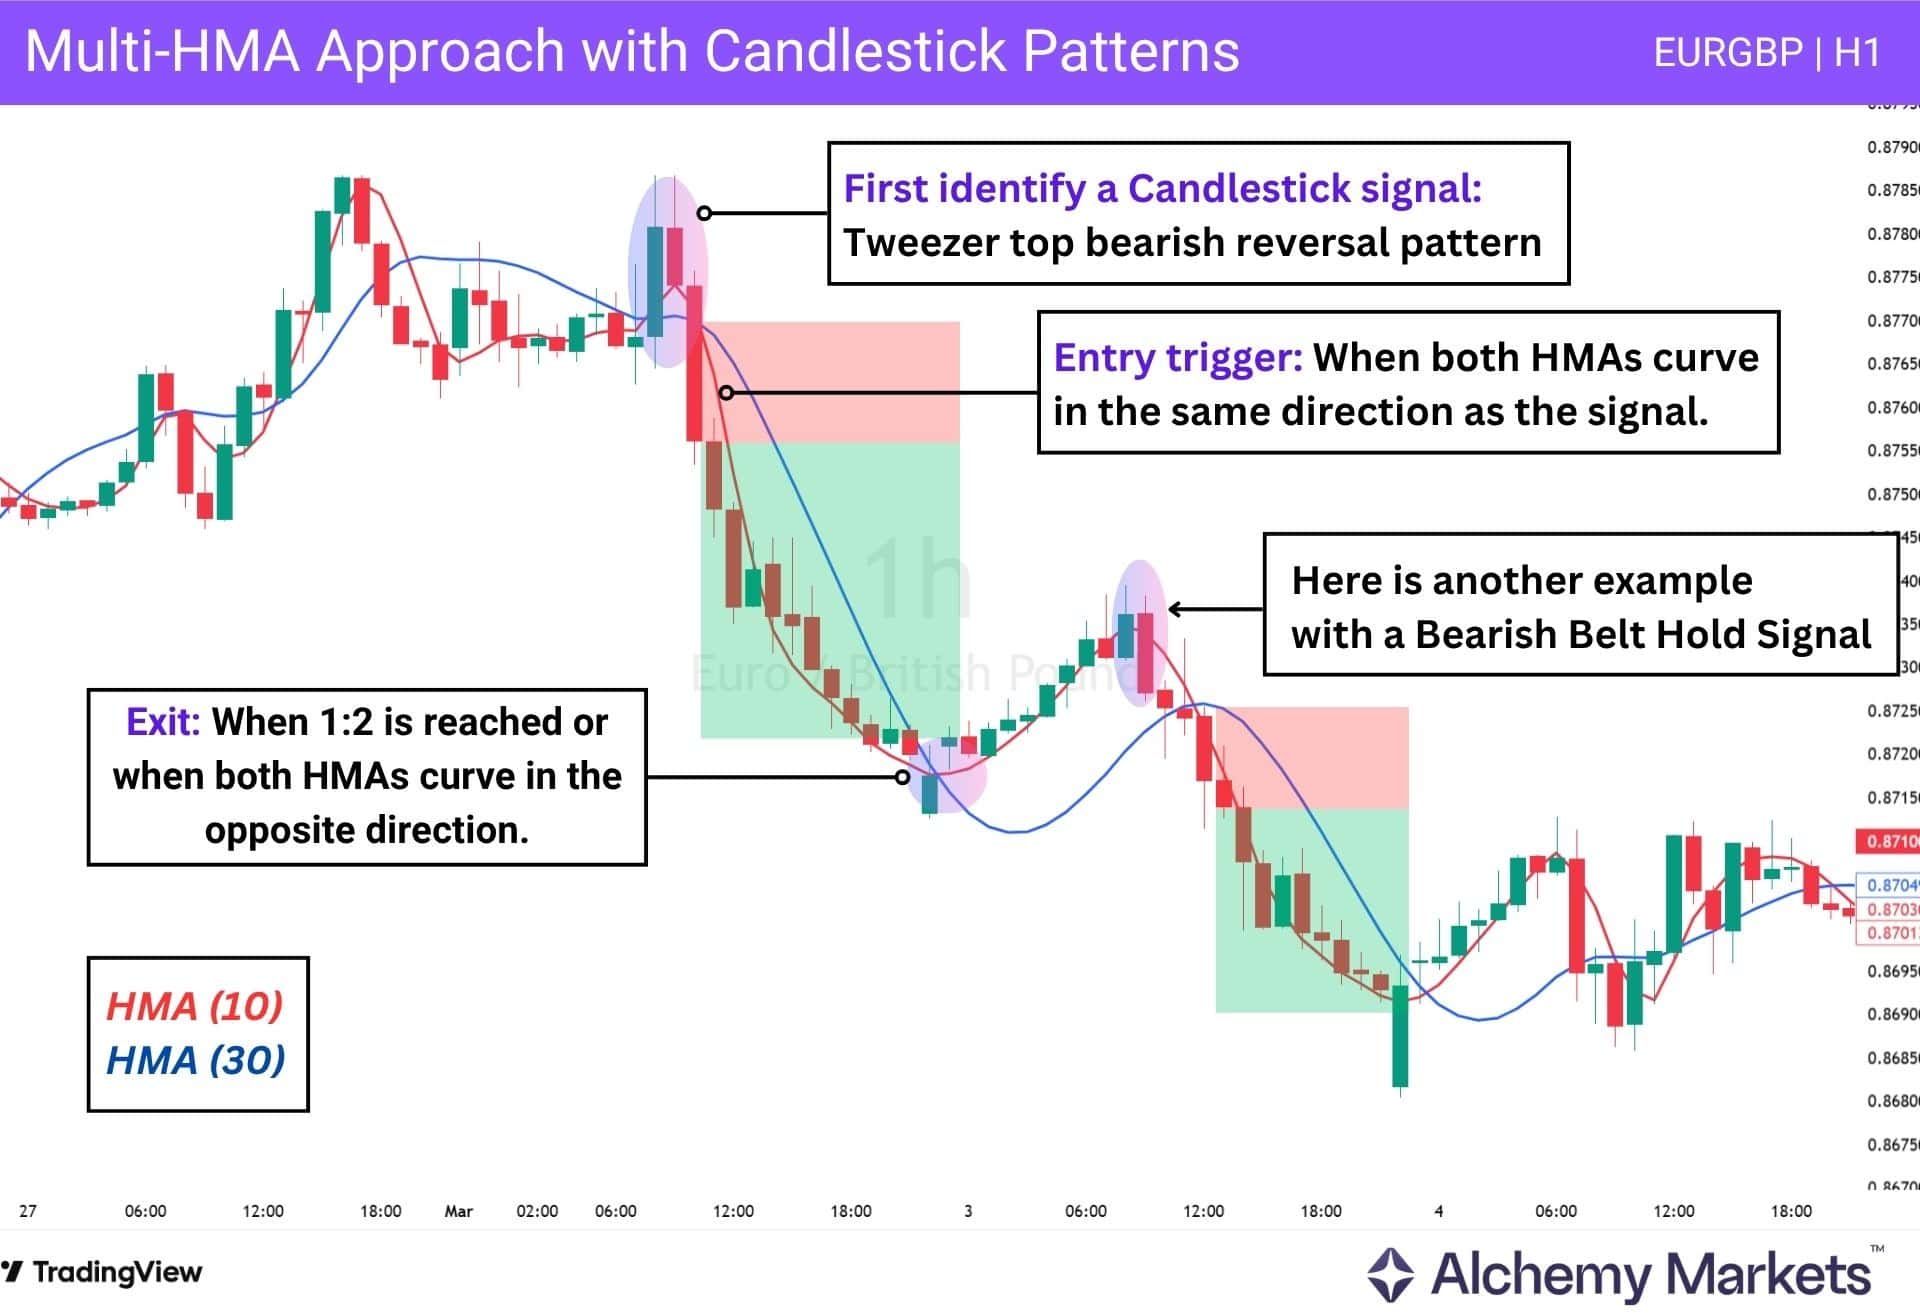
In the EURGBP H1 example, the process starts by identifying a candlestick signal, such as a tweezer top or bearish belt hold. That pattern becomes more actionable when both the HMA (10) and HMA (30) begin curving lower in the same direction as the signal.
The same logic applies in reverse for bullish setups: a bullish candlestick pattern forms first, then both HMAs start turning higher to confirm that momentum is beginning to align with the reversal. This makes the setup more selective than trading candlestick patterns alone, because the entry is only taken once price action and HMA direction start agreeing.
Stop loss should be placed at the HMA furthest away from the entry point, with TP targets placed at 1:2 or exited at the conditions of when both HMAs flip in the opposite direction.
As a bonus filter for immediate traders, it also helps to prioritise candlestick signals that align with the broader market structure.
- In an uptrend, that usually means favouring bullish patterns within a higher high → higher low → higher high structure.
- In a downtrend, the focus shifts to bearish patterns that form within a lower low → lower high → lower low structure.
That way, the candlestick pattern is not just valid on its own, but also supported by the wider trend.
HMA Filter Strategy
This setup is better suited to position trading than short-term trading because it uses the HMA (50) and HMA (200) to track broader market shifts rather than quick swings.
On higher timeframes, that slower structure can be useful for staying with a larger move and avoiding the noise that often appears in lower-timeframe signals. The RSI then adds context by showing whether the market had recently gone through an overbought or oversold stretch before the crossover appeared.
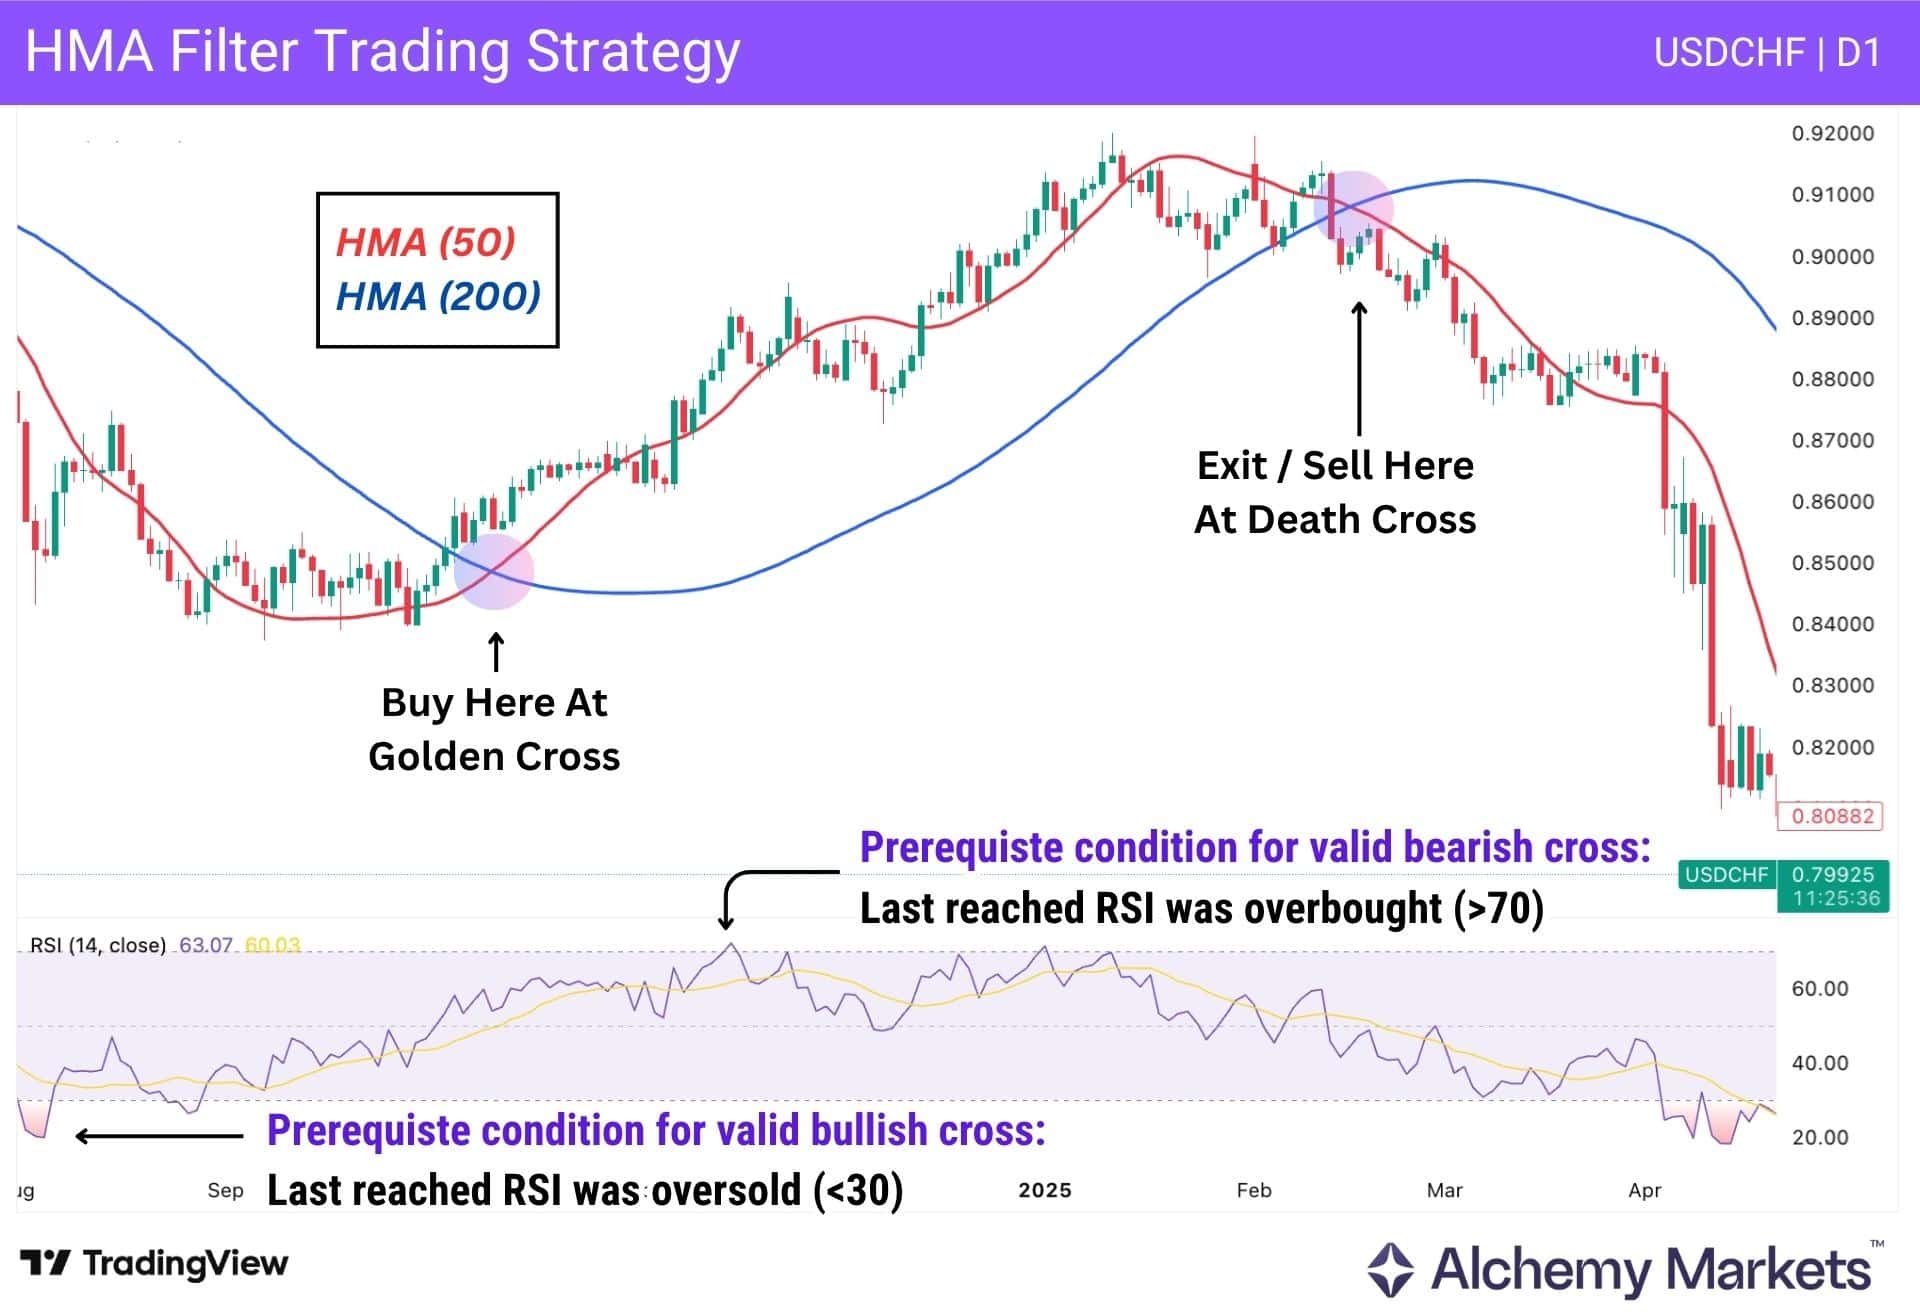
In the USDCHF daily example, a golden cross forms when the HMA (50) rises above the HMA (200). That bullish crossover becomes more meaningful when the most recent important RSI condition was oversold, since it suggests the market had already been washed out before the trend started turning higher.
In that sense, the RSI is not the trigger by itself. It acts more like a quality filter, helping traders judge whether the crossover is happening after a meaningful reset rather than in the middle of a random drift.
The death cross works a little differently. It can still support a bearish bias, and some traders may choose to take a short from it, but it is often more useful as an exit signal or a warning that the broader uptrend has likely weakened. By the time a death cross appears, a good portion of the downside move may already be underway, which makes fresh short entries less attractive and more dependent on context.
That is why this approach works best as a higher-timeframe filter: the golden cross can help identify longer-term upside transitions, while the death cross is often more useful for protecting gains, reducing exposure, or shifting bias rather than blindly chasing a late short.
Advantages of The Hull Moving Average
Like any technical indicator, the Hull Moving Average has strengths and limitations. Its main appeal is that it aims to stay responsive to price while remaining smoother than many fast-moving averages.
- The HMA is designed to reduce some of the lag found in traditional moving averages, which can help it respond faster to changing price conditions.
- It stays relatively smooth while remaining responsive, making it useful for both trend-following and momentum-based analysis.
- Traders can apply it across different styles, including intraday, swing, and position trading, depending on the chosen period.
- It can work well as a confirmation tool when combined with price structure, support and resistance, or other indicators.
Disadvantages of The Hull Moving Average
That said, the HMA is not a perfect indicator. Like other moving averages, it still relies on past price data and can become less reliable when market conditions turn choppy.
- Despite being more responsive than many traditional moving averages, the HMA is still a lagging indicator because it is based on historical price data.
- In sideways or range-bound markets, it can still produce false signals and frequent directional flips.
- Its calculation is more complex than that of the SMA or EMA, which can make it less intuitive for newer traders.
- Results can vary significantly depending on the chosen period, so poor settings can reduce its usefulness.
Hull Moving Average (HMA) vs Simple Moving Average (SMA)
The HMA and SMA both track trend direction, but they do so in different ways. The HMA is built to react faster, while the SMA is designed to keep things simple.
| HMA | SMA |
| Uses a weighted formula and a smoothing step to reduce some lag. | Uses a simple average of closing prices over a chosen period. |
| Usually reacts faster to price changes while still staying relatively smooth. | Responds more slowly and often lags more in fast markets. |
| Better suited when traders want a more responsive trend tool. | Better suited for broad trend direction and simple long-term smoothing. |
| More complex to calculate. | Easier to understand and apply. |
Hull Moving Average (HMA) vs Exponential Moving Average (EMA)
The HMA and EMA are both more responsive than the SMA, but they are built differently. In general, the HMA aims for a smoother response, while the EMA is more direct and widely used.
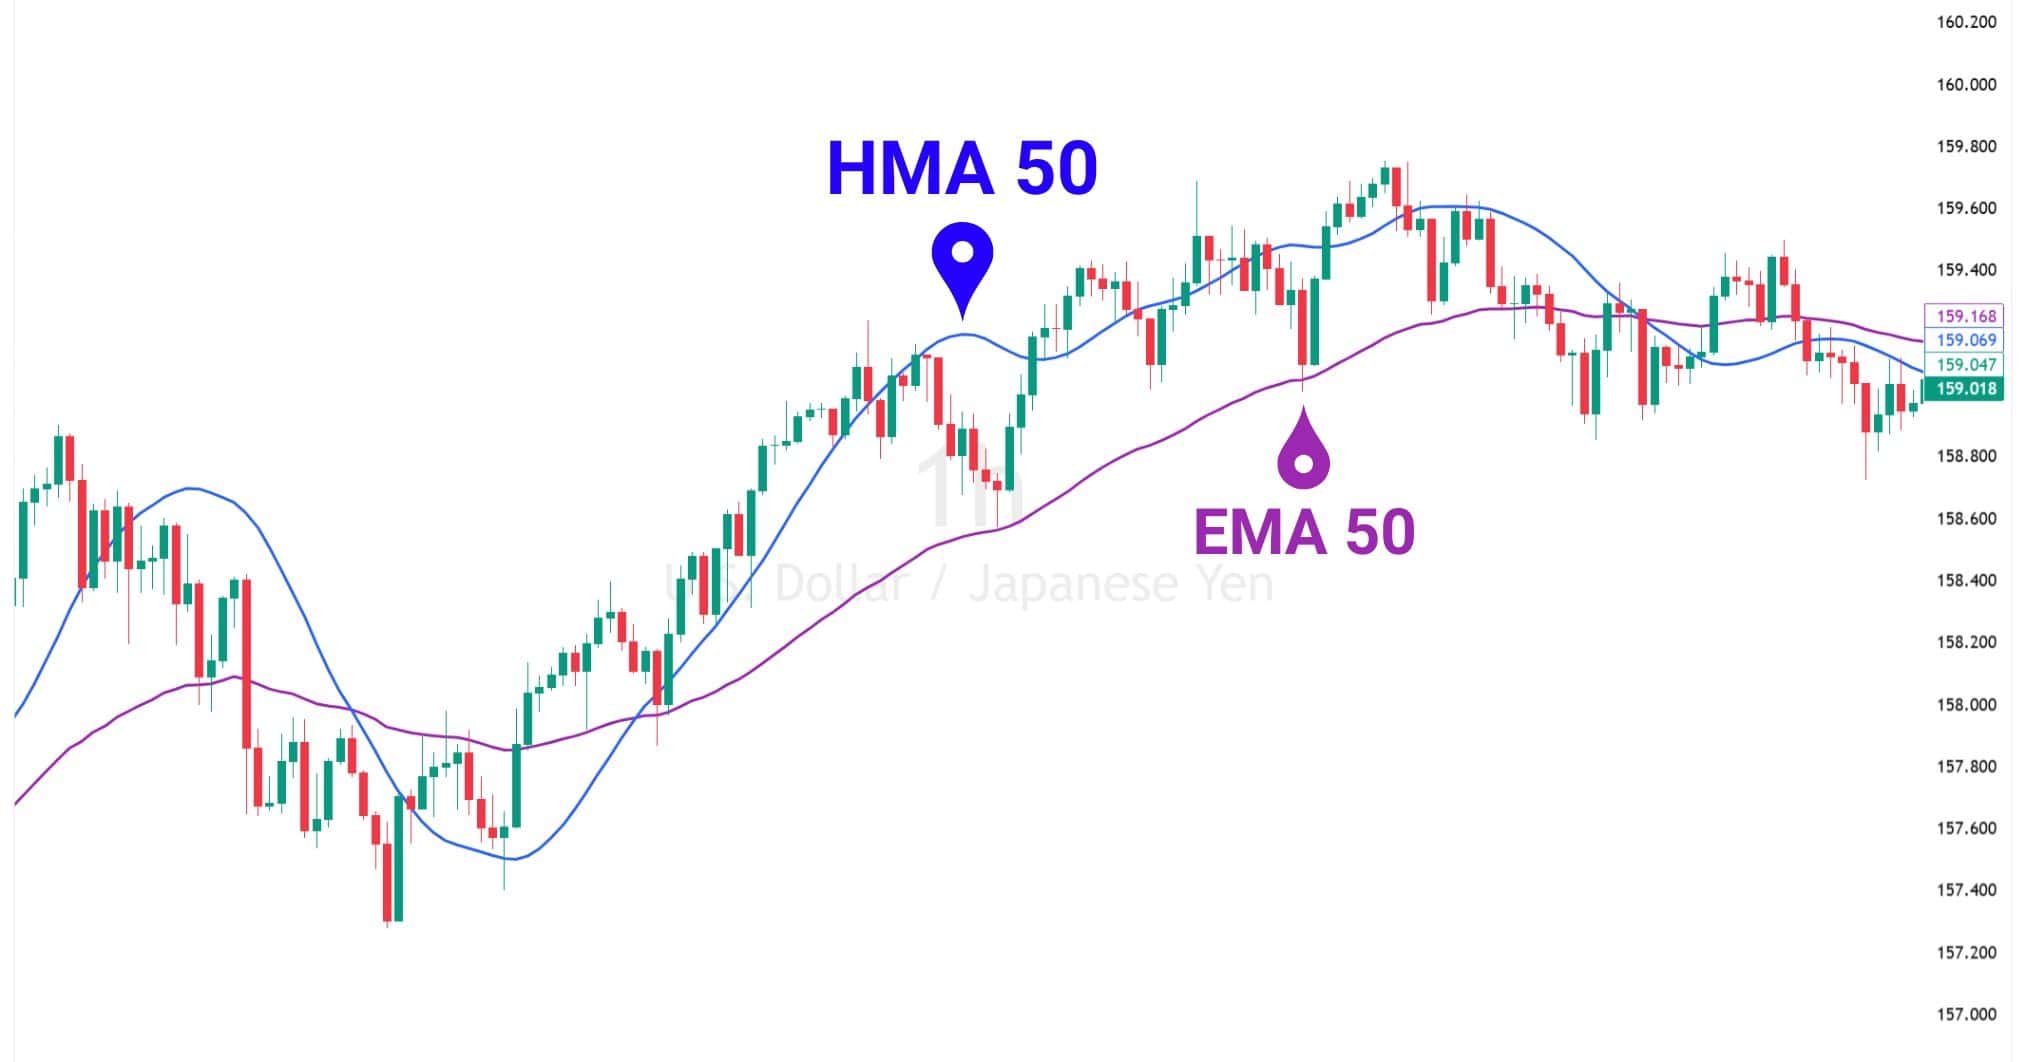
| HMA | EMA |
| Uses multiple weighted calculations and a final smoothing step. | Applies greater weight to recent prices using a simpler formula. |
| Often aims to balance responsiveness and smoothness. | Reacts quickly, but can be more sensitive in choppy conditions. |
| Useful when traders want a smoother but still responsive trend line. | Commonly used for fast trend tracking, crossovers, and dynamic support or resistance. |
| More complex and less standard across platforms. | Simpler and more widely available. |
Hull Moving Average (HMA) vs Weighted Moving Average (WMA)
Since the HMA is built from weighted moving averages, the comparison with the WMA is especially useful. The key difference is that the HMA adds an extra smoothing process to make the line easier to read.
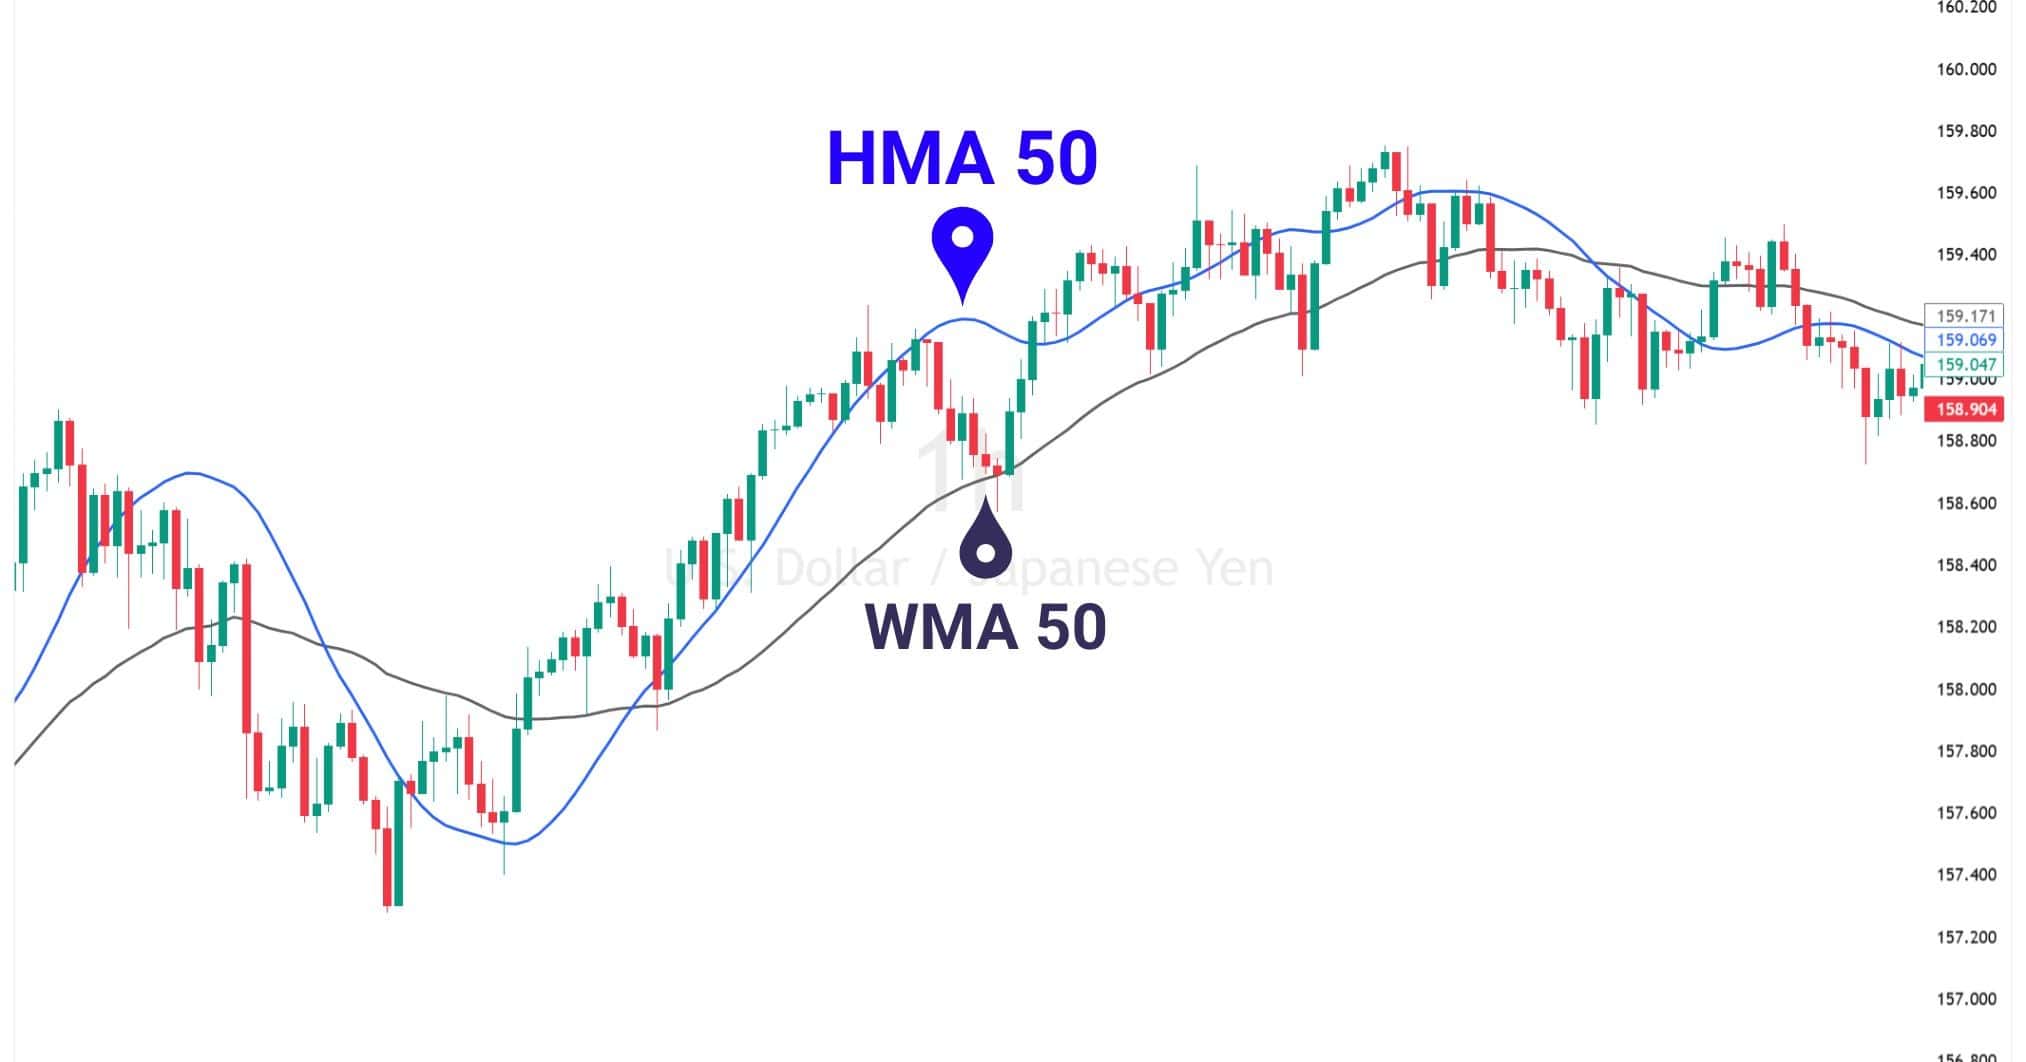
| HMA | WMA |
| Builds on the weighted moving average by adding lag-reduction and smoothing. | Directly gives more weight to recent prices than older ones. |
| Usually looks smoother while still reacting quickly to price. | Often reacts quickly, but can be more sensitive to short-term fluctuations. |
| Better suited when traders want a balance between responsiveness and readability. | Better suited when traders want a more direct reaction to recent price changes. |
| More complex to calculate. | Simpler than the HMA. |
FAQ
What are the best Hull Moving Average settings for trading?
There is no single best setting. Shorter HMAs are more responsive and tend to suit short-term trading, while longer HMAs are better for broader trend analysis. The right setting depends on the market, timeframe, and how the HMA is being used.
Is the Hull Moving Average a leading or lagging indicator?
The HMA is still a lagging indicator because it is based on past price data, but it is designed to reduce some of the lag found in more traditional moving averages.
Why does the Hull Moving Average use the square root of the period?
The square root is used in the final smoothing step. It helps smooth the raw calculation without adding as much delay as a full-length moving average would.
Can the Hull Moving Average be used for day trading?
Yes. Shorter-period HMAs are often used for intraday analysis because they react faster to short-term price changes. Even so, they tend to work better when combined with price structure or another confirmation tool.
Can the Hull Moving Average be used in different markets?
Yes. The HMA can be applied to forex, stocks, indices, commodities, and crypto. What matters more is whether the chosen setting fits the volatility and timeframe being traded.
Can the Hull Moving Average be used for both trend identification and trade timing?
Yes. Longer-period HMAs are often used to track the broader trend, while shorter-period HMAs can help traders time pullbacks, reversals, or momentum shifts.
What are the most common mistakes traders make when using the HMA?
One common mistake is treating the HMA as a standalone signal in every market condition. Like other moving averages, it can become less reliable in sideways markets, so it usually works better with structure, support and resistance, or another filter.
How do you use the Hull Moving Average on MT4?
If the HMA is not already available on the platform, it is usually added as a custom indicator. Once installed, traders can adjust the period and use it like any other moving average overlay.
Who created the Hull Moving Average?
The Hull Moving Average was developed by Alan Hull.
What is the KT Hull Moving Average?
The KT Hull Moving Average is a modified version of the standard HMA offered by specific vendors or platforms, rather than a core version of the original indicator.


