


Written by:

Reviewed by:


- March 27, 2026
- 25 min read
30 Technical Analysis Indicators That Work
In this guide, we explore 30 technical analysis indicators that traders have relied on for decades.
This technical analysis indicators list combines widely used tools with lesser-known indicators that still provide valuable insight into price behaviour.
These indicators help confirm ideas on the chart and offer insight into how other traders may be reading the market.
What Is a Technical Indicator?
Technical indicators are visual tools added to a price chart to help analyse price action — how an asset’s price is moving — and to gauge where it may move next.
They come in many forms. Some sit directly on the price chart alongside the candlesticks, while others appear in a separate panel below, like adding another floor to a building.
What is an overlay indicators?
An overlay indicator is plotted directly on the price chart, sitting alongside the candlesticks or price bars. Most commonly used to display:
- Average price levels
- Potential support and resistance areas
- Reference levels for trailing stop losses
Overlay indicators are useful for providing context without separating price from the analysis.
What is an oscillator indicators?
An oscillator indicator appears on a separate panel, typically below the actual price chart. Most commonly used for gauging:
- Momentum, or how strong price is moving relative to its normal behaviour
- Overbought and oversold conditions, which can hint at exhaustion or potential reversals
Oscillators are especially useful in ranging or slowing markets.
What is an Leading indicators?
A leading indicator attempts to signal potential price movements before they occur. It is most commonly used for gauging:
- Momentum shifts
- Overbought and oversold conditions
- Early reversal or entry opportunities
What is an Lagging indicators?
A lagging indicator reacts to price movements after they have already occurred. It is most commonly used for gauging:
- Trend direction
- Trend strength
- Confirmation of existing price moves
Types of Technical Analysis Indicators
Broadly, technical indicators fall into four categories: price action, trend following, momentum, and volume. Understanding the distinction helps you choose the right tool for the right situation.
Price Action
Price action indicators are usually overlay indicators, meaning that they are displayed right on the price chart itself. They are used to highlight key levels, ranges, and historical price behaviour.
| Examples include Pivot Points, Donchian Channels, and Price Channels. |
Trend Following
Trend following indicators are usually overlay indicators, meaning they are displayed directly on the price chart. They are used to smooth price movement and confirm the overall market direction.
| Examples include Moving Averages, Supertrend, and the Ichimoku Cloud. |
Momentum
Momentum indicators are usually oscillators, meaning they are displayed in a separate panel below the price chart. They are used to measure the strength and speed of price movements, as well as identify overbought and oversold conditions.
| Examples include RSI, Stochastic Oscillator, and Rate of Change. |
Volume
Volume indicators are usually displayed in a separate panel below the price chart, though some can also act as overlay indicators. They are used to assess trading activity and confirm the strength behind price movements.
| Examples include Volume, On-Balance Volume, Volume Profile, and VWAP. |
Technical Indicators Cheat Sheet
Below is a technical analysis indicators list organised by category, helping traders quickly understand which tools are used for price action, trend following, momentum, and volume analysis.
| Price Action | Trend Following |
| ⚖️ Bollinger Bands® 🧮 Fibonacci Retracement Levels 🎯 Pivot Points 🔀 Zig Zag Indicator | 📈 Average Directional Index (ADX) ⏱️ Aroon Indicator ☁️ Ichimoku Cloud Indicator 📉 Simple Moving Average (SMA) ⚡ Exponential Moving Average (EMA) 🚀 Hull Moving Average (HMA) 🌀 Parabolic SAR 📦 Donchian Channels 🧭 Directional Movement Index (DMI) 🔥 SuperTrend Indicator 📏 Keltner Channels |
| Momentum | Volume |
| 🔄 MACD 💪 Relative Strength Index (RSI) 🎢 Stochastic Oscillator 🌊 Average True Range (ATR) 📐 Commodity Channel Index (CCI) 📉 Williams %R 🔁 TRIX Indicator 📊 Standard Deviation Indicator ⚙️ Stochastic RSI 🌡️ Relative Vigor Index (RVI) 🏋️ Force Index Indicator 💰 Money Flow Index (MFI) | 📥 On-Balance Volume (OBV) 🧾 Accumulation/Distribution (A/D) Line 📊 Volume-Weighted Average Price (VWAP) |
Best Price Action Indicators
Bollinger Bands®
Type: Price action
| Best Used For |
| Identifying overbought and oversold conditions in a trend, as well as volatility |
| Best Trading Time Frames |
| Works across all timeframes |
| Indicator Complexity |
| Intermediate |
How Bollinger Bands Work:
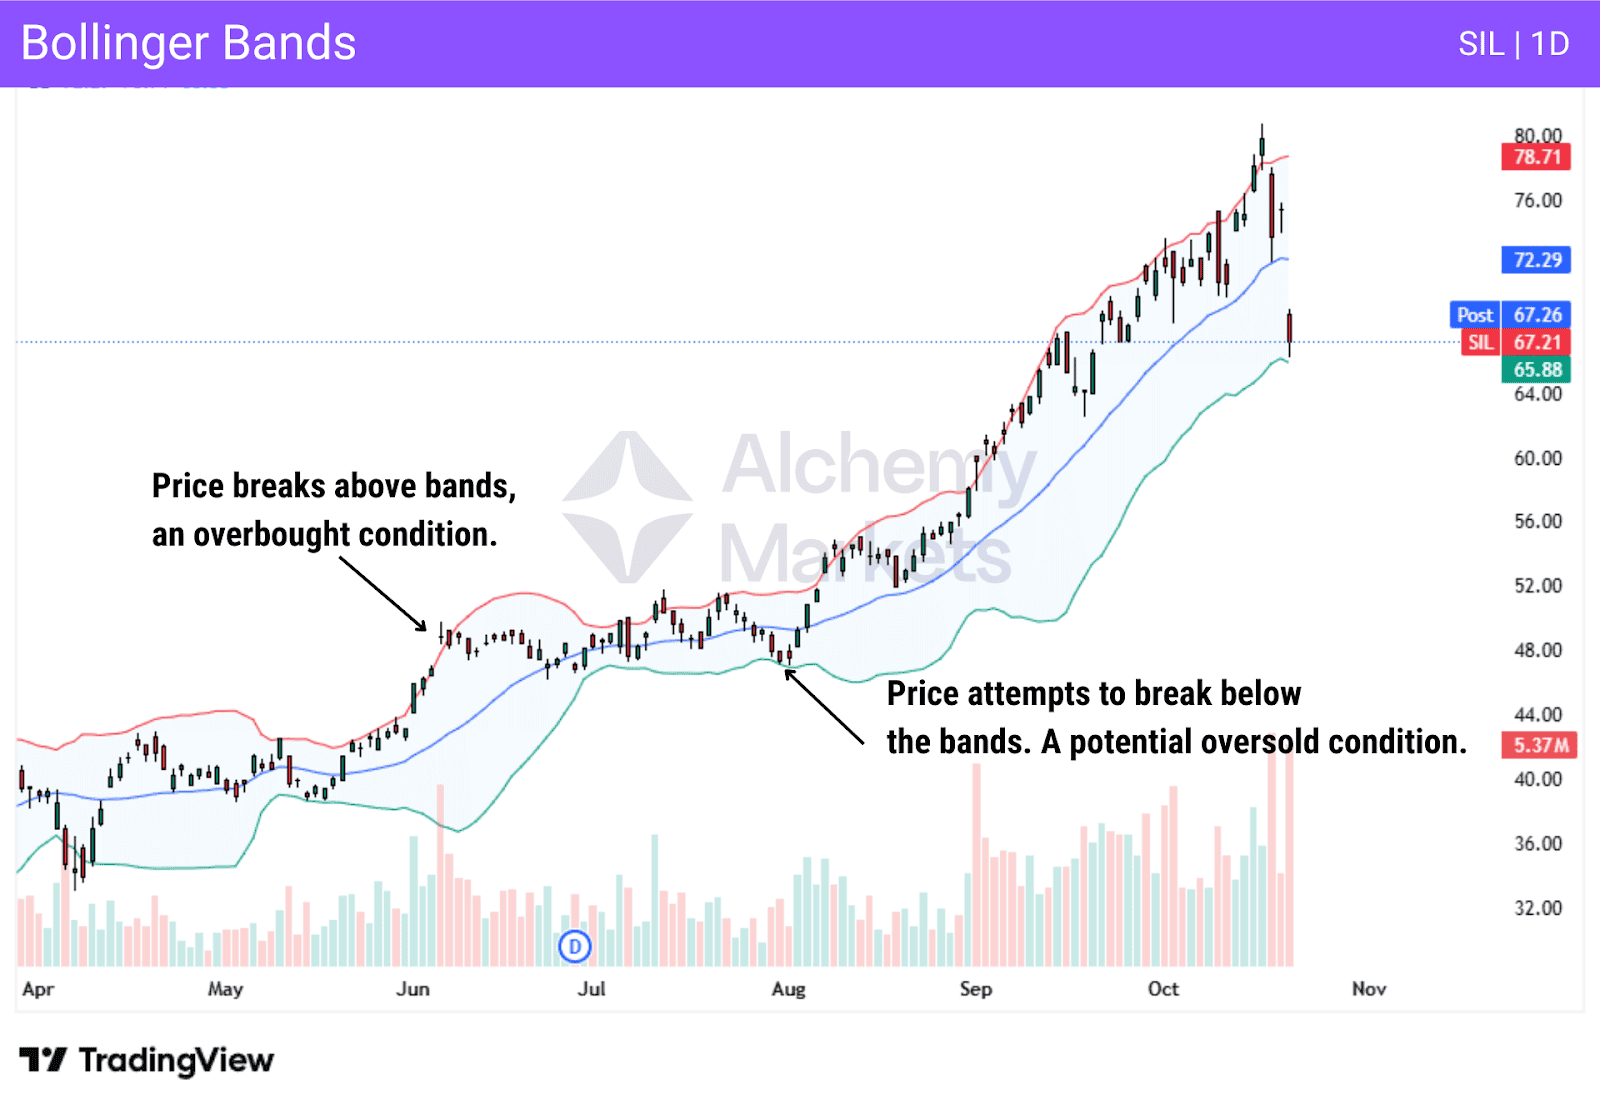
Bollinger Bandss® are built around a moving average, typically a 20-period SMA, with upper and lower bands plotted at a fixed number of standard deviations from the average.
The bands expand when volatility increases and contract when volatility decreases. Periods of contraction often precede strong price moves.
Additionally, when price approaches the upper band, it may be overextended to the upside. When price approaches the lower band, it may be overextended to the downside.
Bollinger Bands are most effective in ranging markets and as a confirmation tool alongside price action, rather than as standalone buy or sell signals.
Fibonacci Retracement Levels
Type: Price action
| Best Used For |
| Fibonacci levels are used to determine potential support or resistance levels when price retraces |
| Best Trading Time Frames |
| Any timeframe |
| Indicator Complexity |
| Intermediate, mainly due to the end user and whether they can cleanly identify areas of interest |
How Fibonacci Retracement Levels Work:
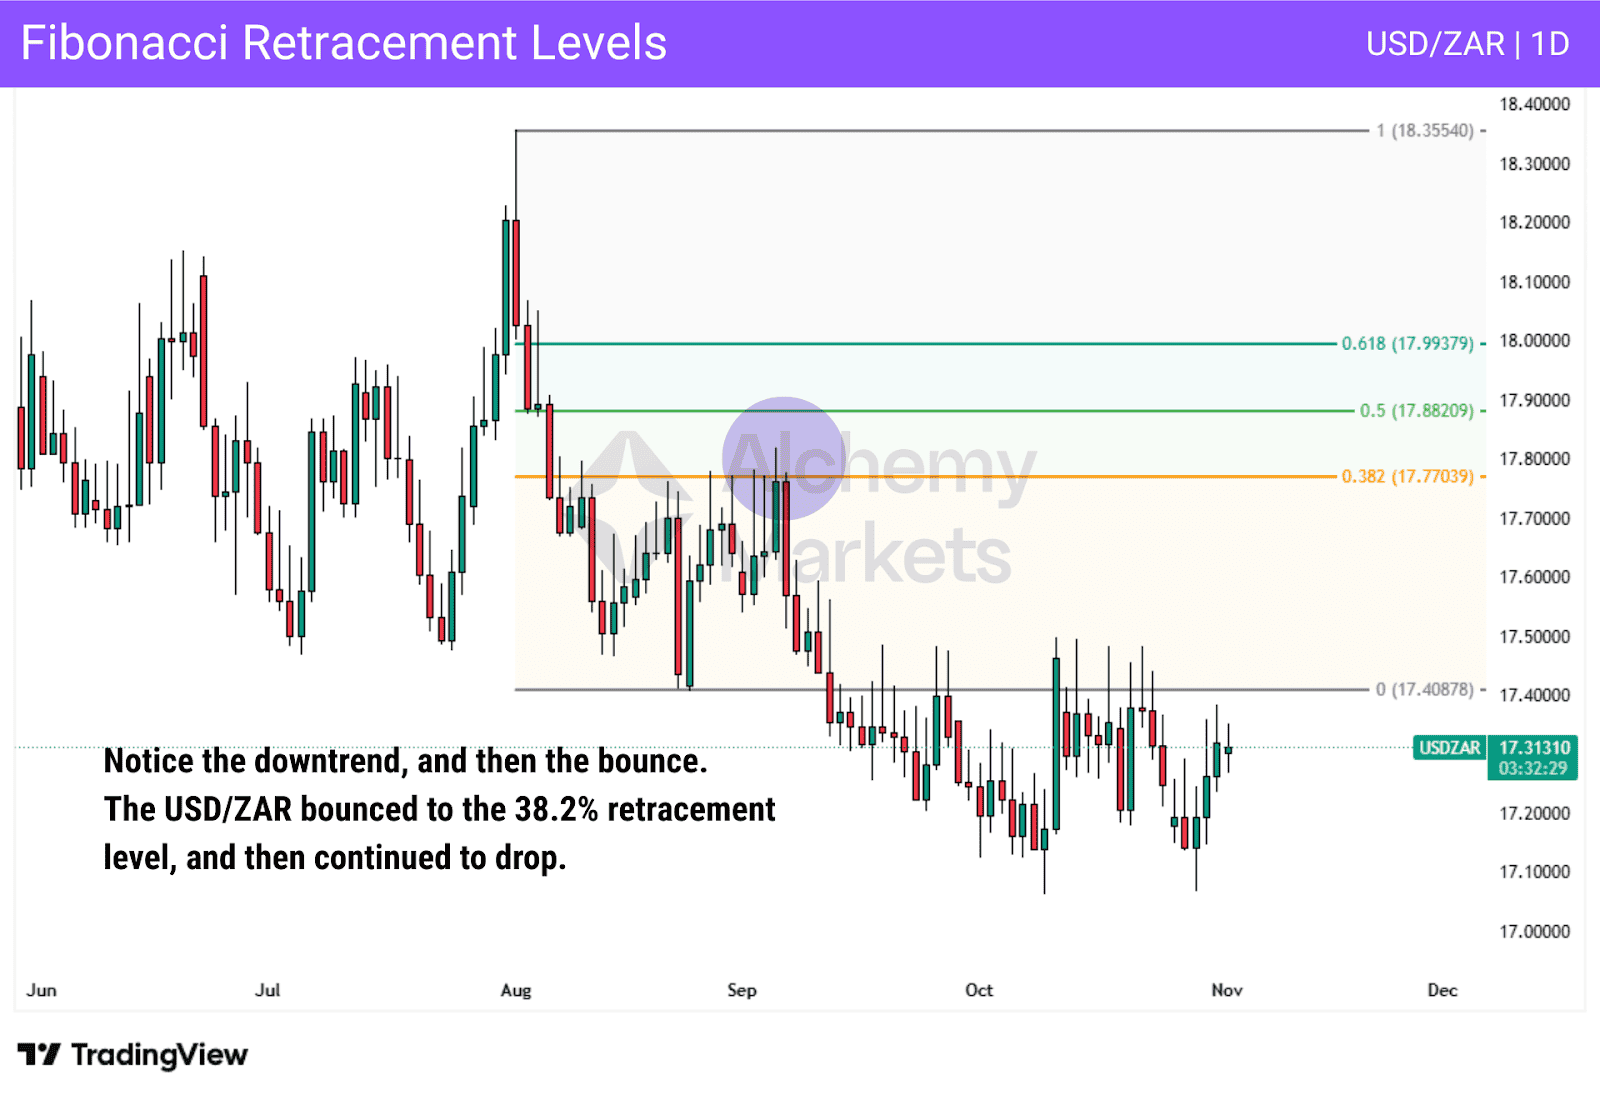
Fibonacci retracement levels are drawn after a large price move, from either the significant swing low to the swing high, or vice versa. It helps identify potential zones where price will return to (pullback), with the intent to rest briefly before continuing the impulsive move again.
The most commonly used levels are 38.2%, 50%, 61.8%, and 78.6%. These levels highlight areas where price may pause, consolidate, or reverse before continuing in the original direction.
Fibonacci retracements do not predict reversals on their own. They are most effective when aligned with structure, support and resistance, or other forms of confluence.
Zig Zag Indicator
Type: Price Action
| Best Used For |
| Highlighting market structure and significant swing points |
| Best Trading Time Frames |
| Works across all timeframes, most commonly used on higher timeframes |
| Indicator Complexity |
| Beginner |
How Zig Zag Indicator Works:
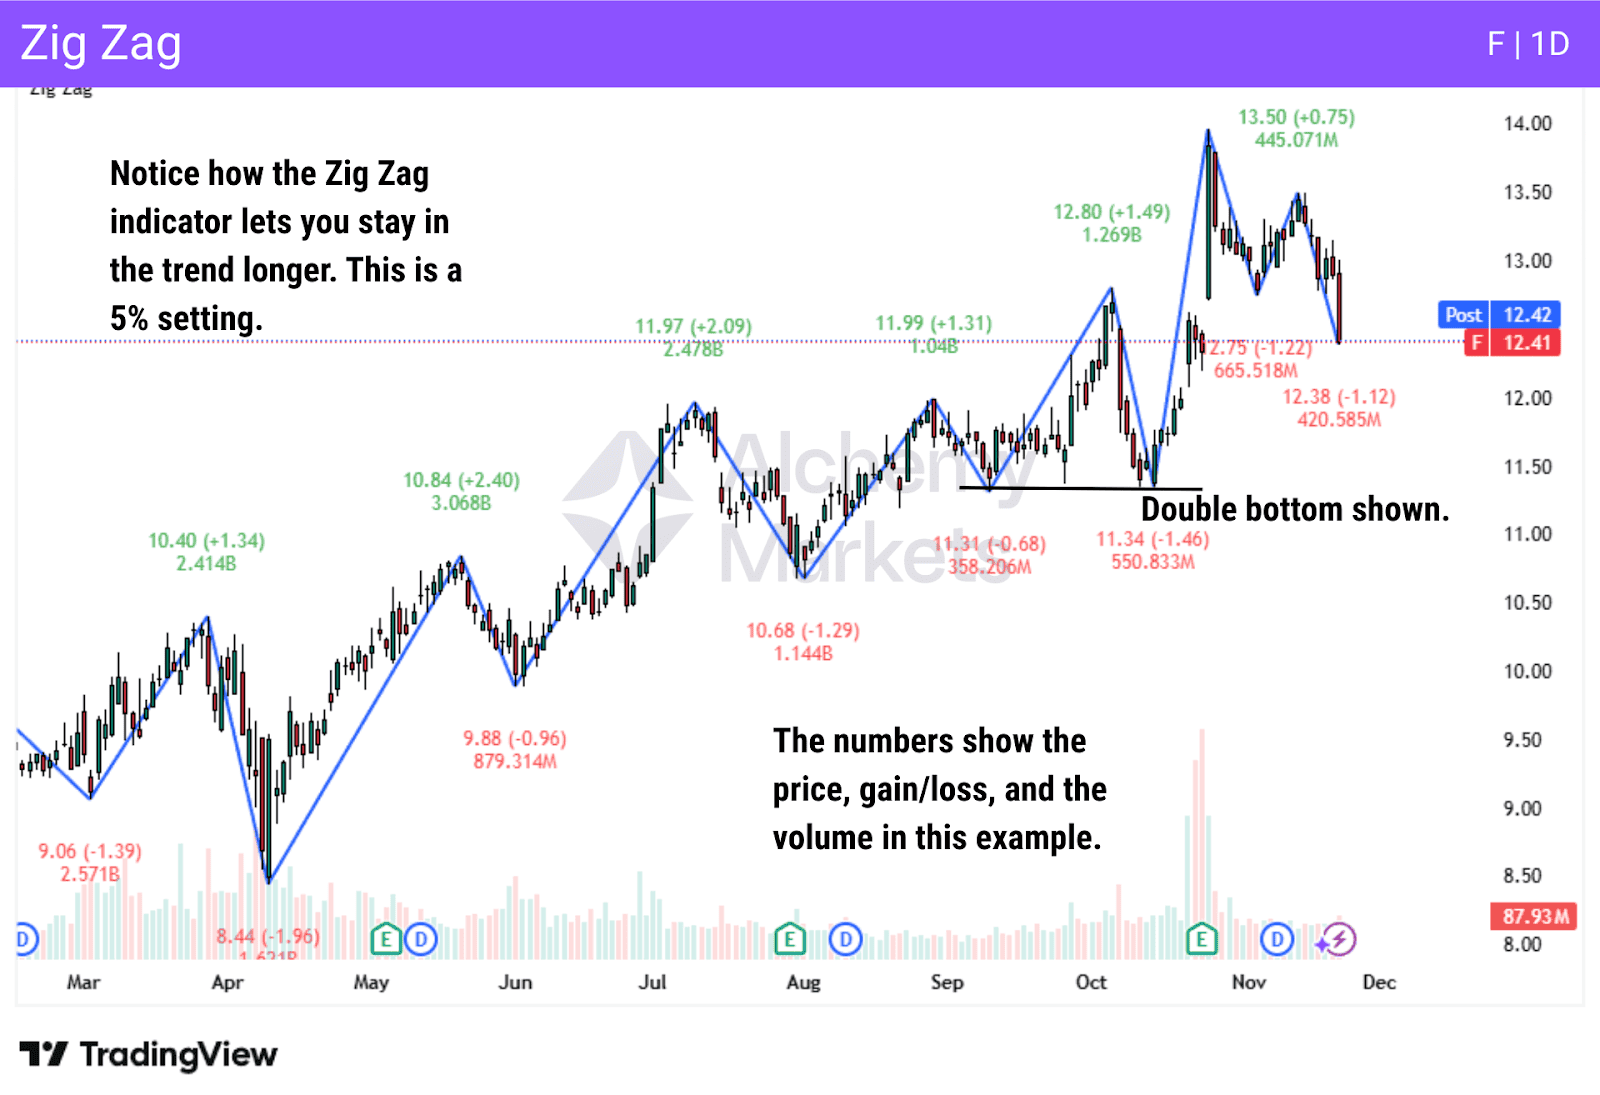
The Zig Zag indicator filters out minor price movements to highlight meaningful swing highs and lows.
It redraws only when price reverses by a specified percentage or point value. Because of this, Zig Zag does not predict price and does not generate trade signals.
Traders use Zig Zag primarily as an analytical tool to visualise structure, identify patterns such as ABCD formations, and measure retracements and extensions. It is rarely used on its own and works best as a visual overlay.
Pivot Points
Type: Price action
| Best Used For |
| Determining key intraday or daily support/resistance levels |
| Best Trading Time Frames |
| Primarily intraday charts |
| Indicator Complexity |
| Beginner |
How Pivot Points Work:
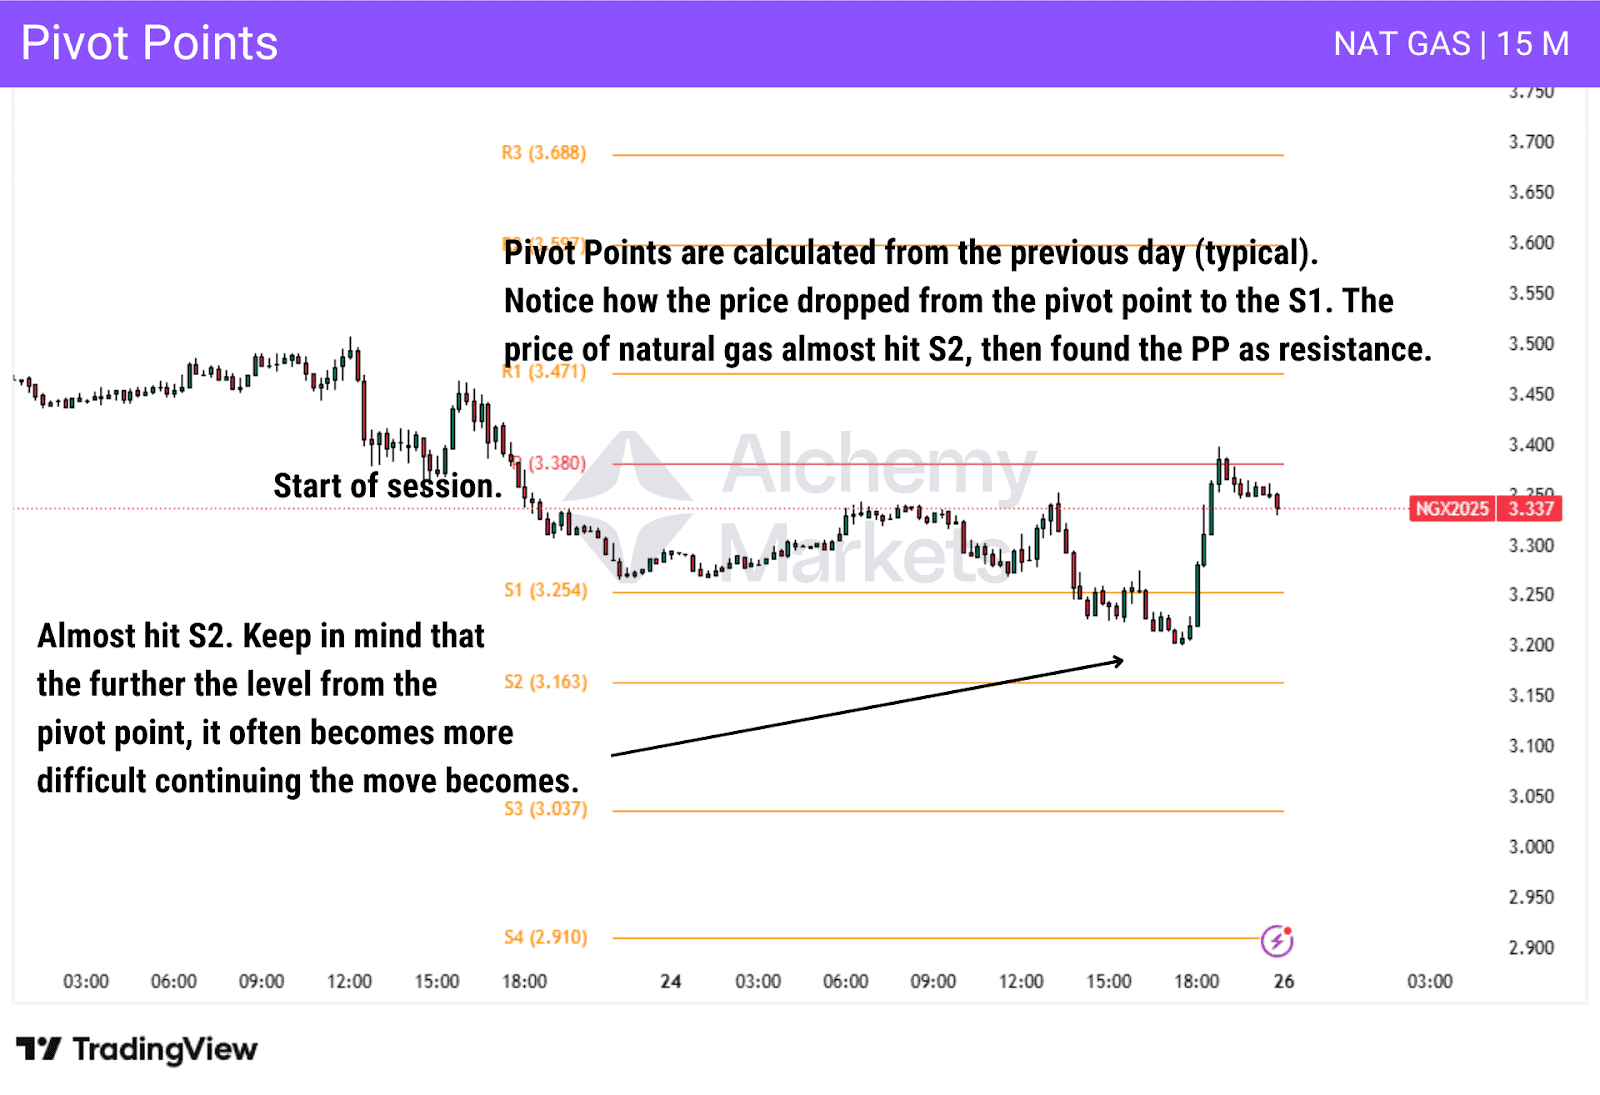
Pivot Points calculate a central price level based on the previous session’s high, low, and close, then project support and resistance levels around it.
When price trades above the central pivot, traders typically look for bullish opportunities. When price trades below it, bearish bias dominates. The surrounding support and resistance levels are often used for entries, exits, and profit targets.
Pivot Points are most effective in liquid markets and are widely used by intraday traders to define short-term structure.
Best Trend Following Indicators
Simple Moving Average
Type: Trend following
| Best Used For |
| Shows the average price of the market over a set period of time |
| Best Trading Time Frames |
| Works across all timeframes, more reliable on higher timeframes |
| Indicator Complexity |
| Beginner |
How Simple Moving Average Works:
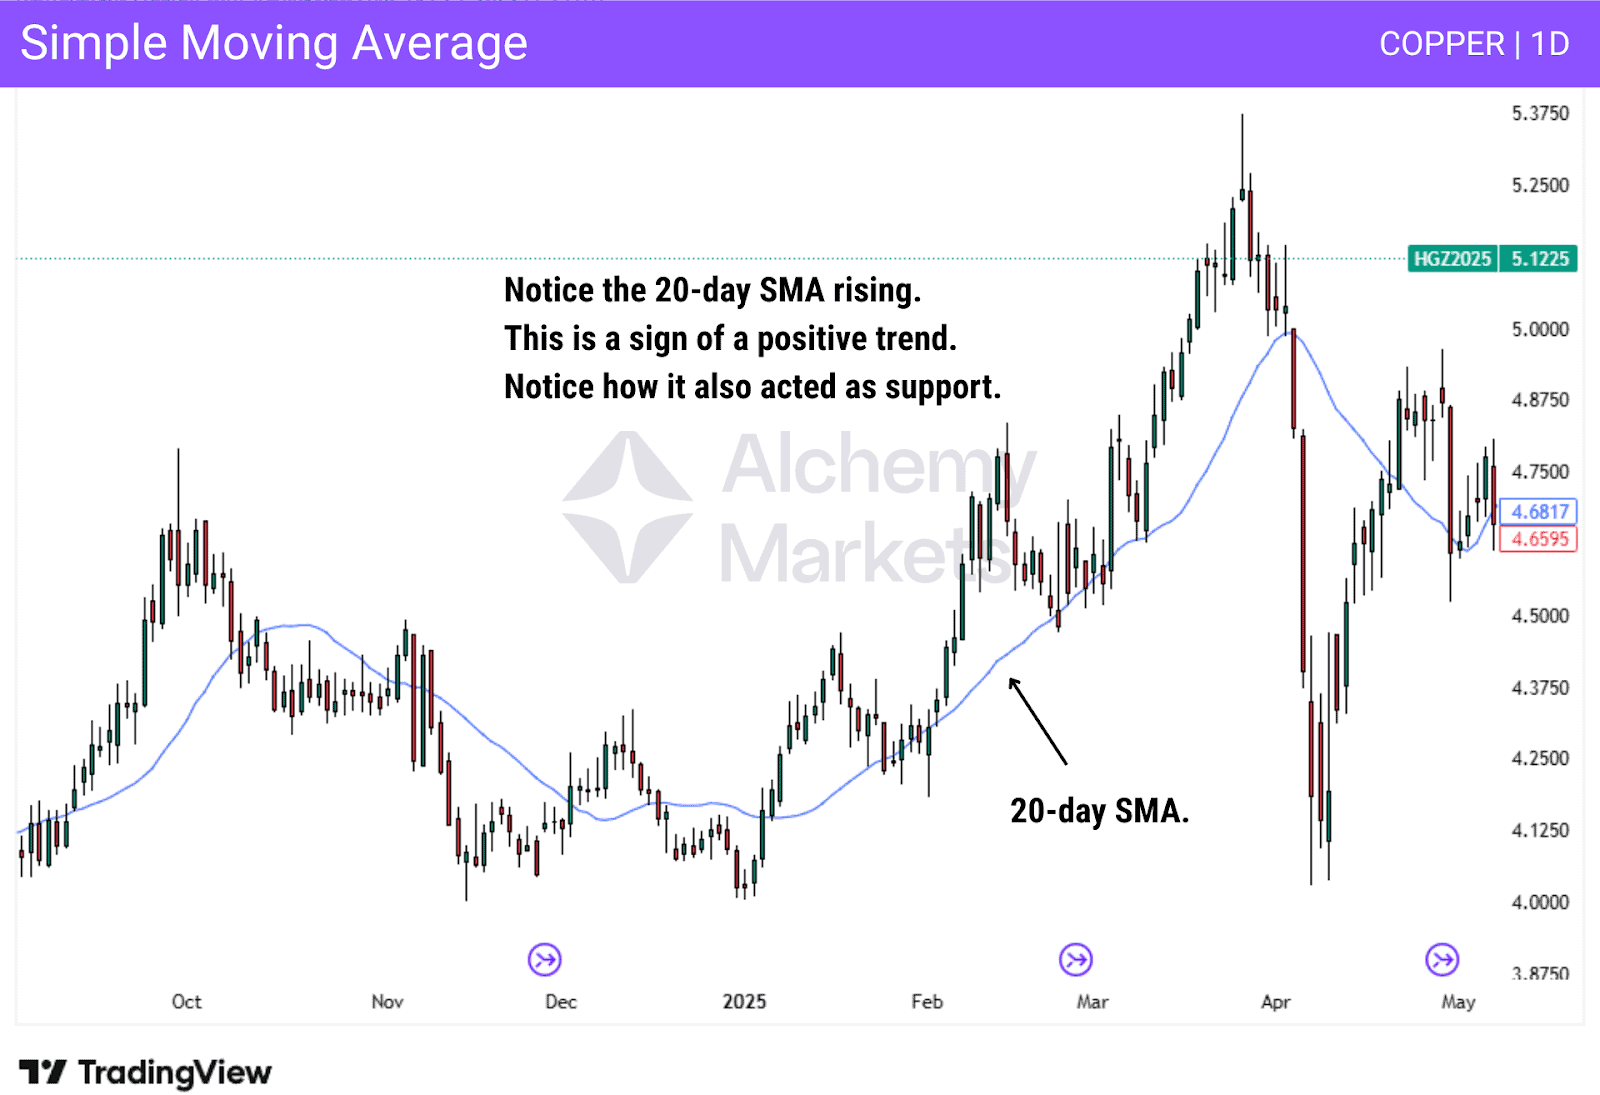
A Simple Moving Average (SMA) calculates the average closing price over a specified number of periods.
The SMA is one of the most foundational indicators for traders to get accustomed to, and it’s primarily used in the following ways.
Trend Identification:
The SMA’s slope shows direction. A rising SMA signals a bullish trend; a falling SMA signals a bearish one. Price above the SMA confirms an uptrend, while price below confirms a downtrend.
Dynamic Support & Resistance:
In an uptrend, the SMA often acts as support. In a downtrend, it acts as resistance, marking key areas for potential entries or reactions.
Exponential Moving Average
Type: Trend following
| Best Used For |
| Showing the average trend, with more weighting placed on recent price action |
| Best Trading Time Frames |
| Any, but more reliable on higher timeframes |
| Indicator Complexity |
| Beginner |
How Exponential Moving Average Works:
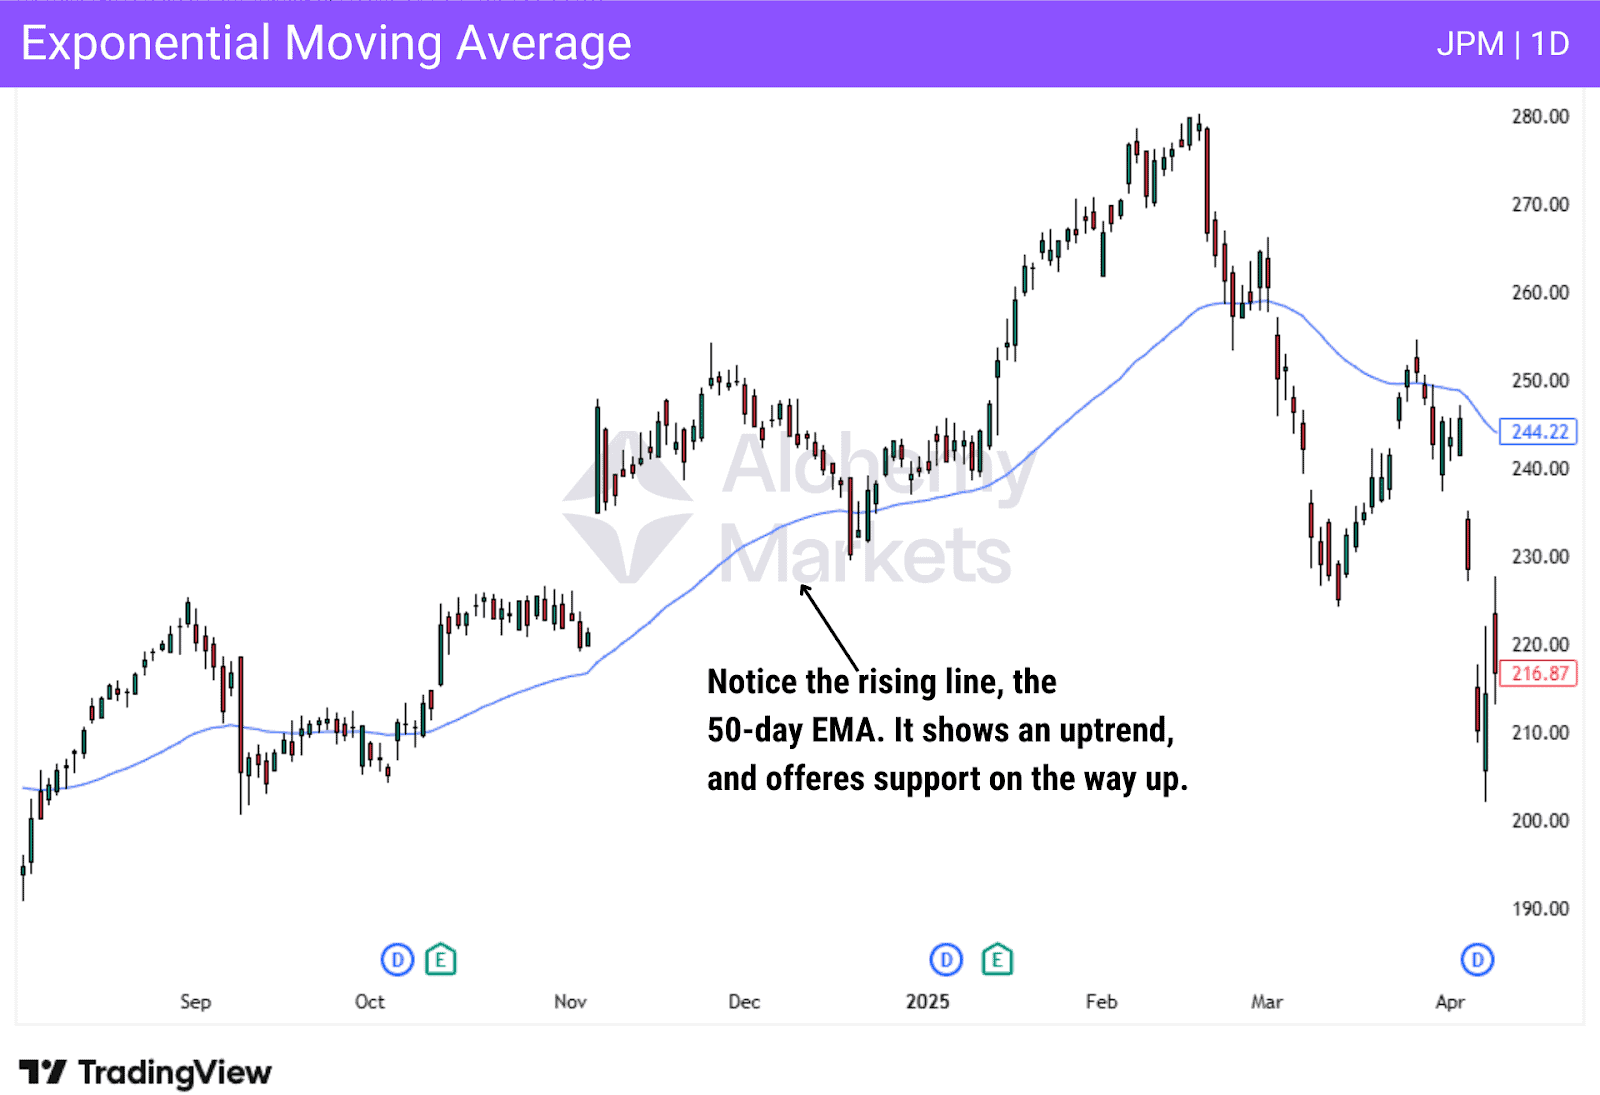
An exponential moving average smooths price data while placing more weight on recent candles. This allows it to react faster to changes in price compared to a Simple Moving Average.
The direction of the EMA indicates the prevailing trend. A rising EMA suggests bullish conditions, while a falling EMA signals bearish conditions. Price trading above the EMA supports an uptrend, while price below it supports a downtrend.
Because EMAs respond more quickly to price changes, they are commonly used by short-term traders and as dynamic support or resistance in trending markets.
Average Directional Index
Type: Trend Following
| Best Used For |
| Measuring trend strength and identifying ranging conditions |
| Best Trading Time Frames |
| 5-minute charts or above |
| Indicator Complexity |
| Advanced |
How Average Directional Index Works:
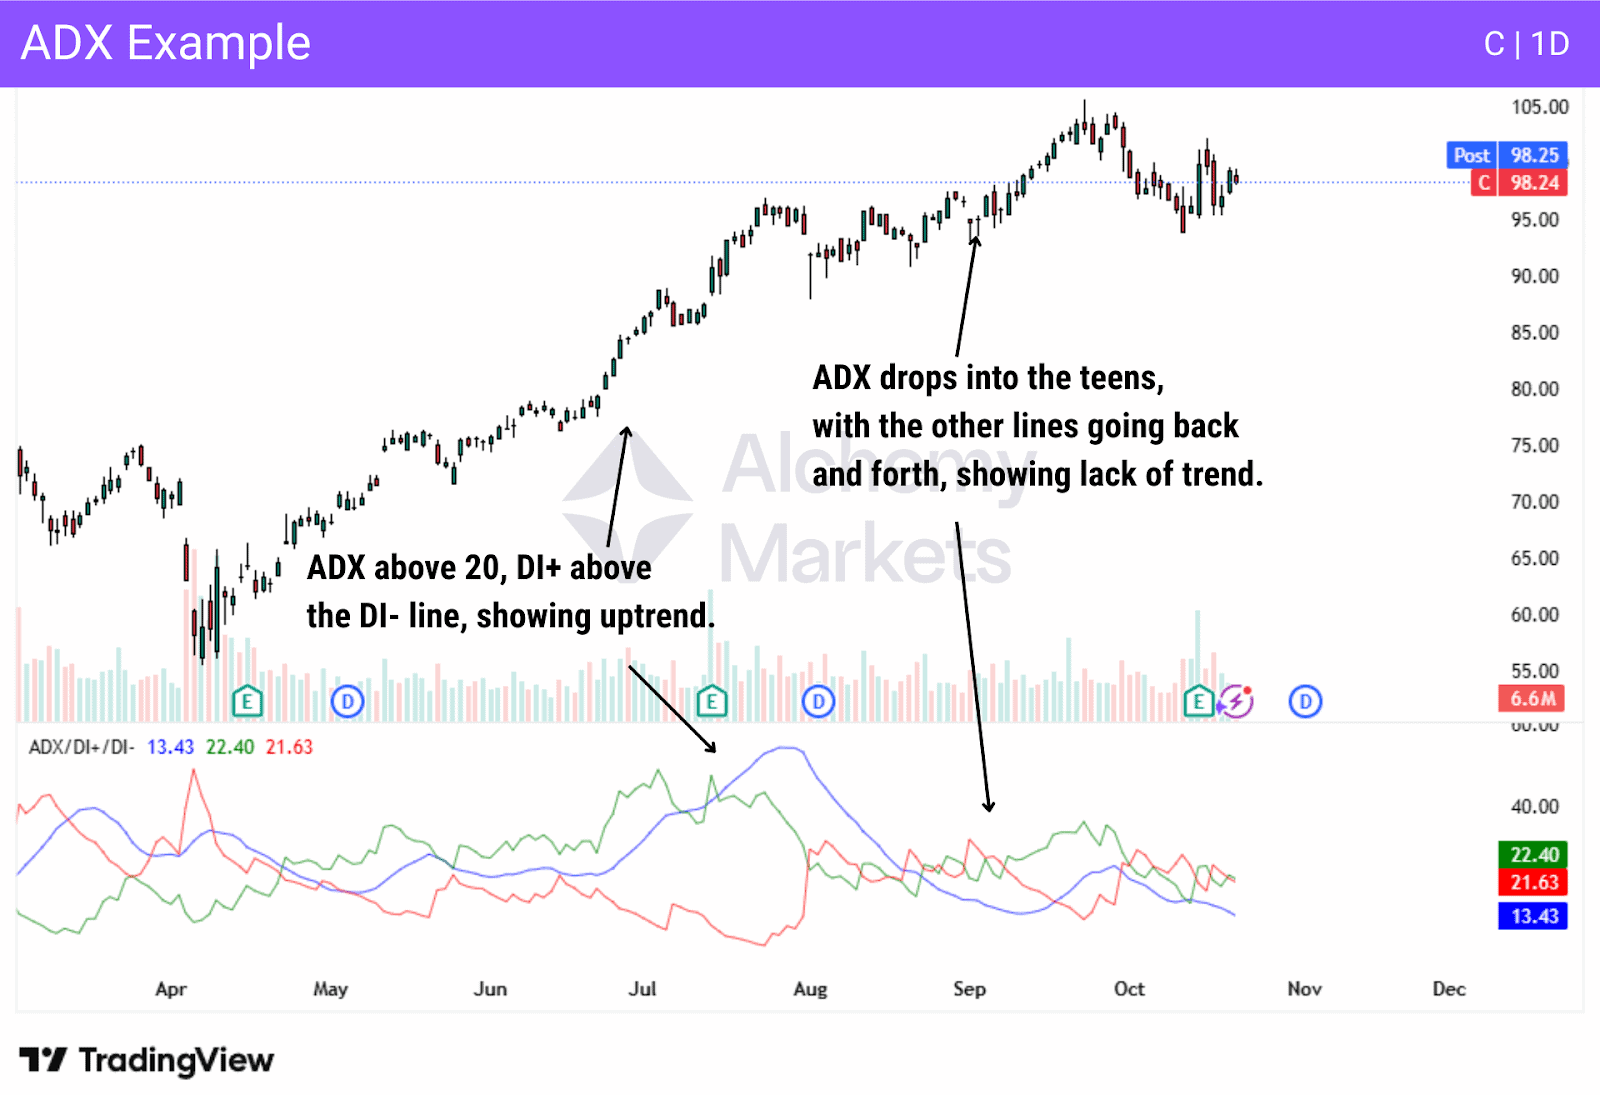
Average Directional Index (ADX) measures the strength of a trend, not its direction.
The indicator consists of three lines: ADX, +DI, and -DI. The +DI line reflects bullish pressure, while the -DI line reflects bearish pressure.
When ADX is above 20 and +DI is above -DI, the market is in a strong uptrend. When ADX is above 20 and -DI is above +DI, the market is in a strong downtrend.
An ADX reading below 20 signals weak or range-bound conditions, where trend-based strategies are less effective. ADX is commonly used as a filter to avoid trading during low-quality market conditions.
Aroon Indicator
Type: Trend Following
| Best Used For |
| Detecting the start of a trend, trend strength or lack thereof |
| Best Trading Time Frames |
| Daily and weekly |
| Indicator Complexity |
| Intermediate |
How the Aroon Indicator Works:
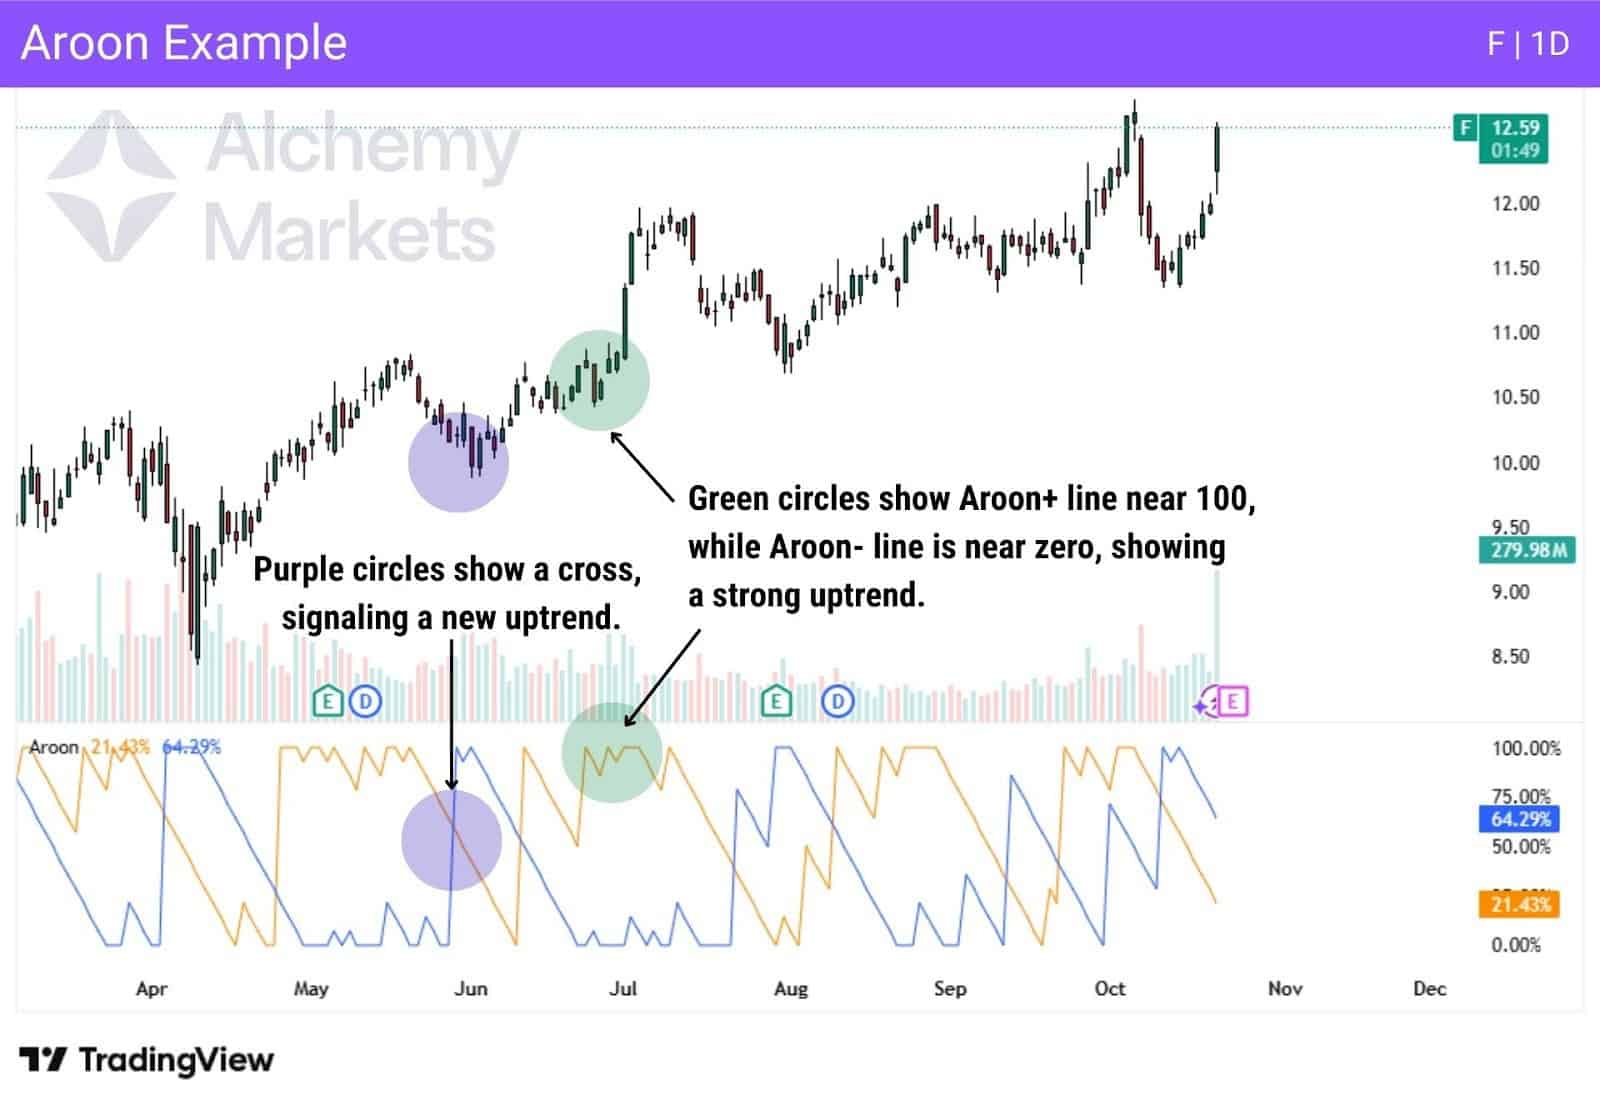
The Aroon indicator measures how recently the highest high and lowest low occurred within a given period. It consists of two lines: Aroon Up (Yellow Line) and Aroon Down (Blue Line).
The indicator focuses on time rather than price magnitude, making it useful for identifying new trends early. When the Aroon Up line stays above 70 while the Aroon Down line remains low, a strong uptrend is present. The opposite signals a strong downtrend.
Crossovers between the two lines can signal potential trend changes, especially when supported by price structure.
Ichimoku Cloud Indicator
Type: Trend following
| Best Used For |
| Identifying trend direction, momentum, and dynamic support or resistance |
| Best Trading Time Frames |
| Most effective on higher timeframes |
| Indicator Complexity |
| Advanced |
How Ichimoku Cloud Indicator Works:
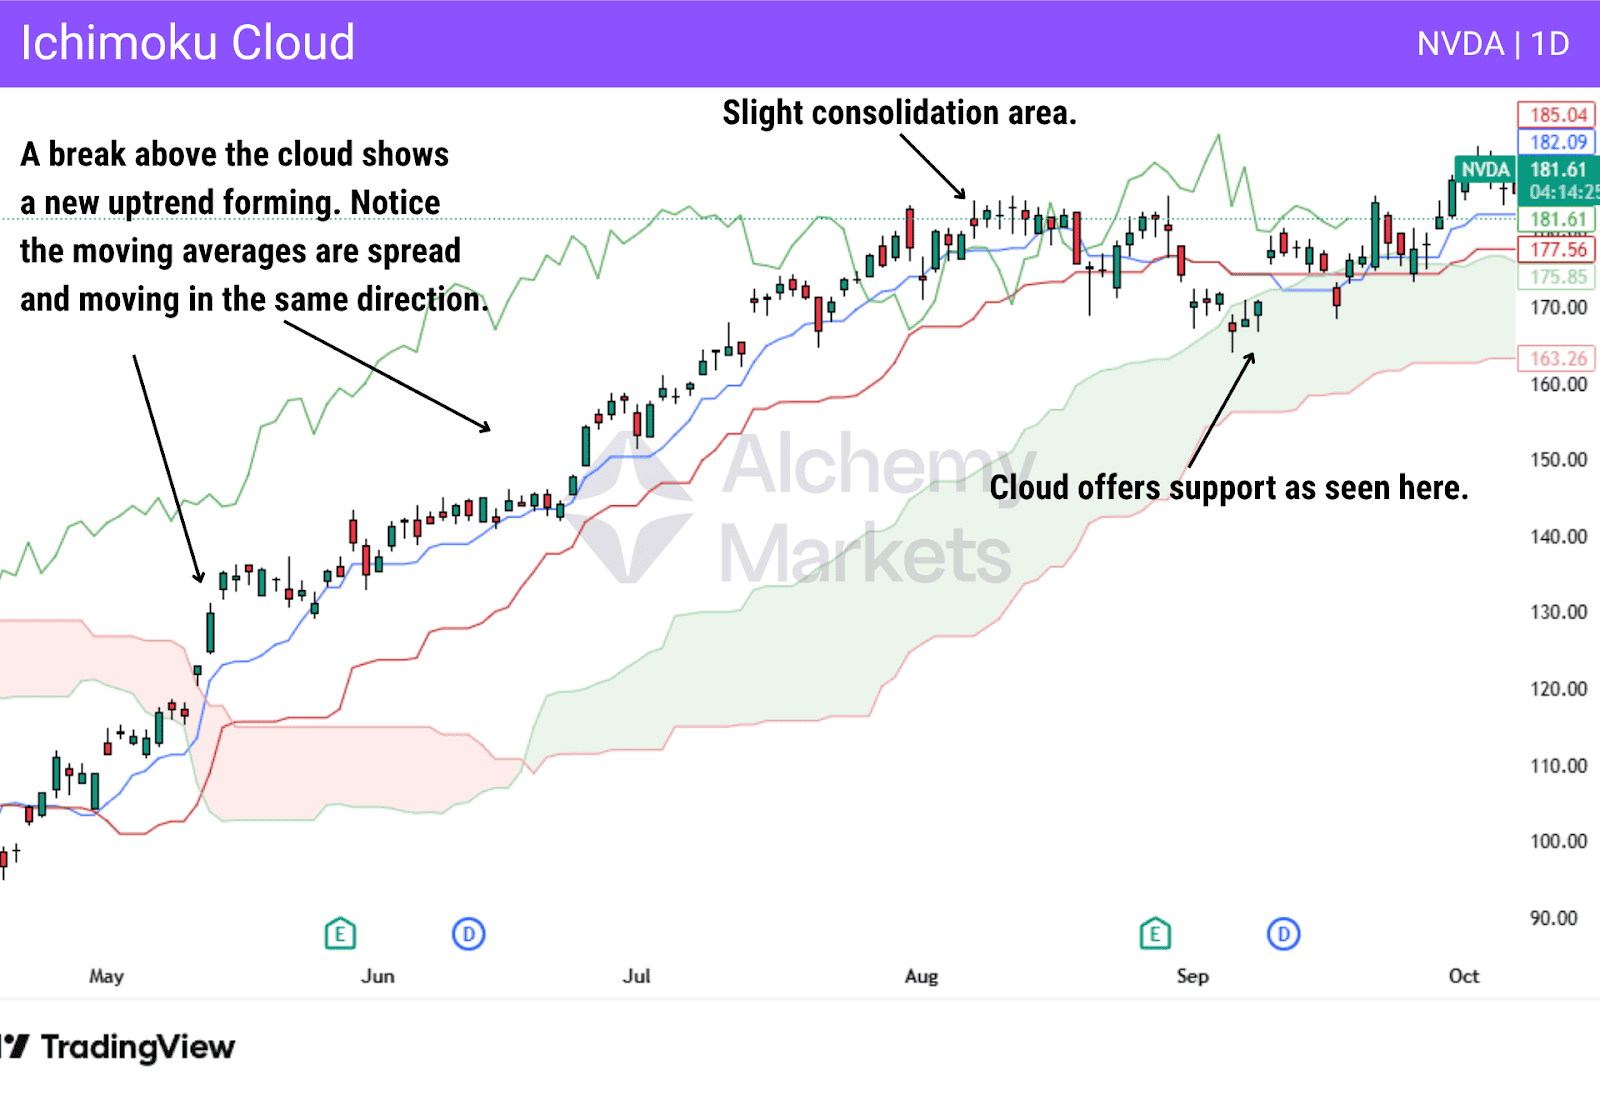
Ichimoku Cloud uses multiple moving averages to provide a comprehensive view of trend direction and momentum.
Price above the cloud signals an uptrend, price below signals a downtrend, and price within the cloud indicates consolidation.
The thickness of the cloud reflects the strength of potential support or resistance. Thicker clouds suggest stronger barriers.
But, because the Ichimoku isn’t just limited to the cloud alone, and also carries the lagging span and Senkou lines, many traders can get intimidated by this wonderful indicator.
Due to its complexity, Ichimoku is typically used by advanced traders as a complete system rather than combined loosely with other indicators.
Hull Moving Average
Type: Trend Following
| Best Used For |
| Identifying trend direction with reduced lag and spotting early trend shifts |
| Best Trading Time Frames |
| Works across all timeframes |
| Indicator Complexity |
| Beginner / Intermediate |
How Hull Moving Average Works:
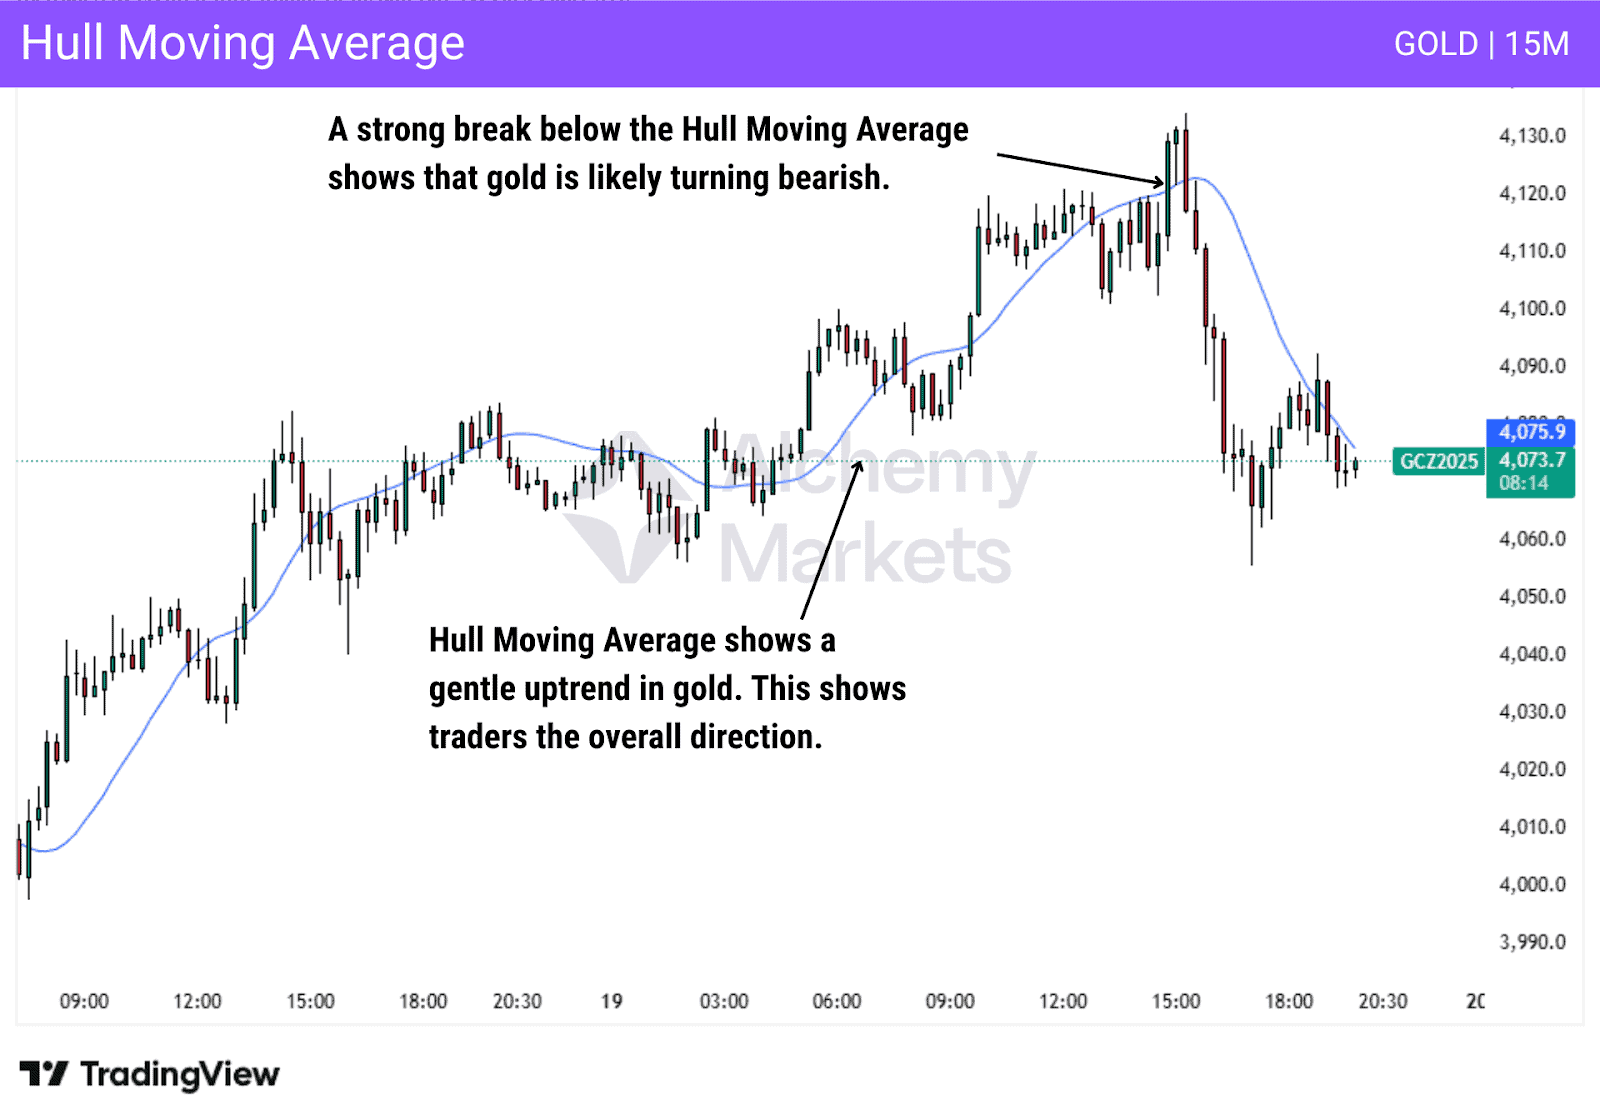
The Hull Moving Average (HMA) was designed to reduce lag while maintaining a smooth appearance.
It uses a modified weighted moving average calculation to respond quickly to short-term price changes without becoming overly noisy. This makes the HMA more sensitive than traditional moving averages.
The HMA is commonly used as a trend filter or early trend shift signal. Due to its sensitivity, it can produce false signals in choppy markets and is best used alongside other confirmation tools.
Parabolic SAR
Type: Trend following
| Best Used For |
| Trend identification, trailing stop placement, and exit signals |
| Best Trading Time Frames |
| Works across all timeframes, commonly used for intraday trading |
| Indicator Complexity |
| Beginner / Intermediate |
How Parabolic SAR Works:
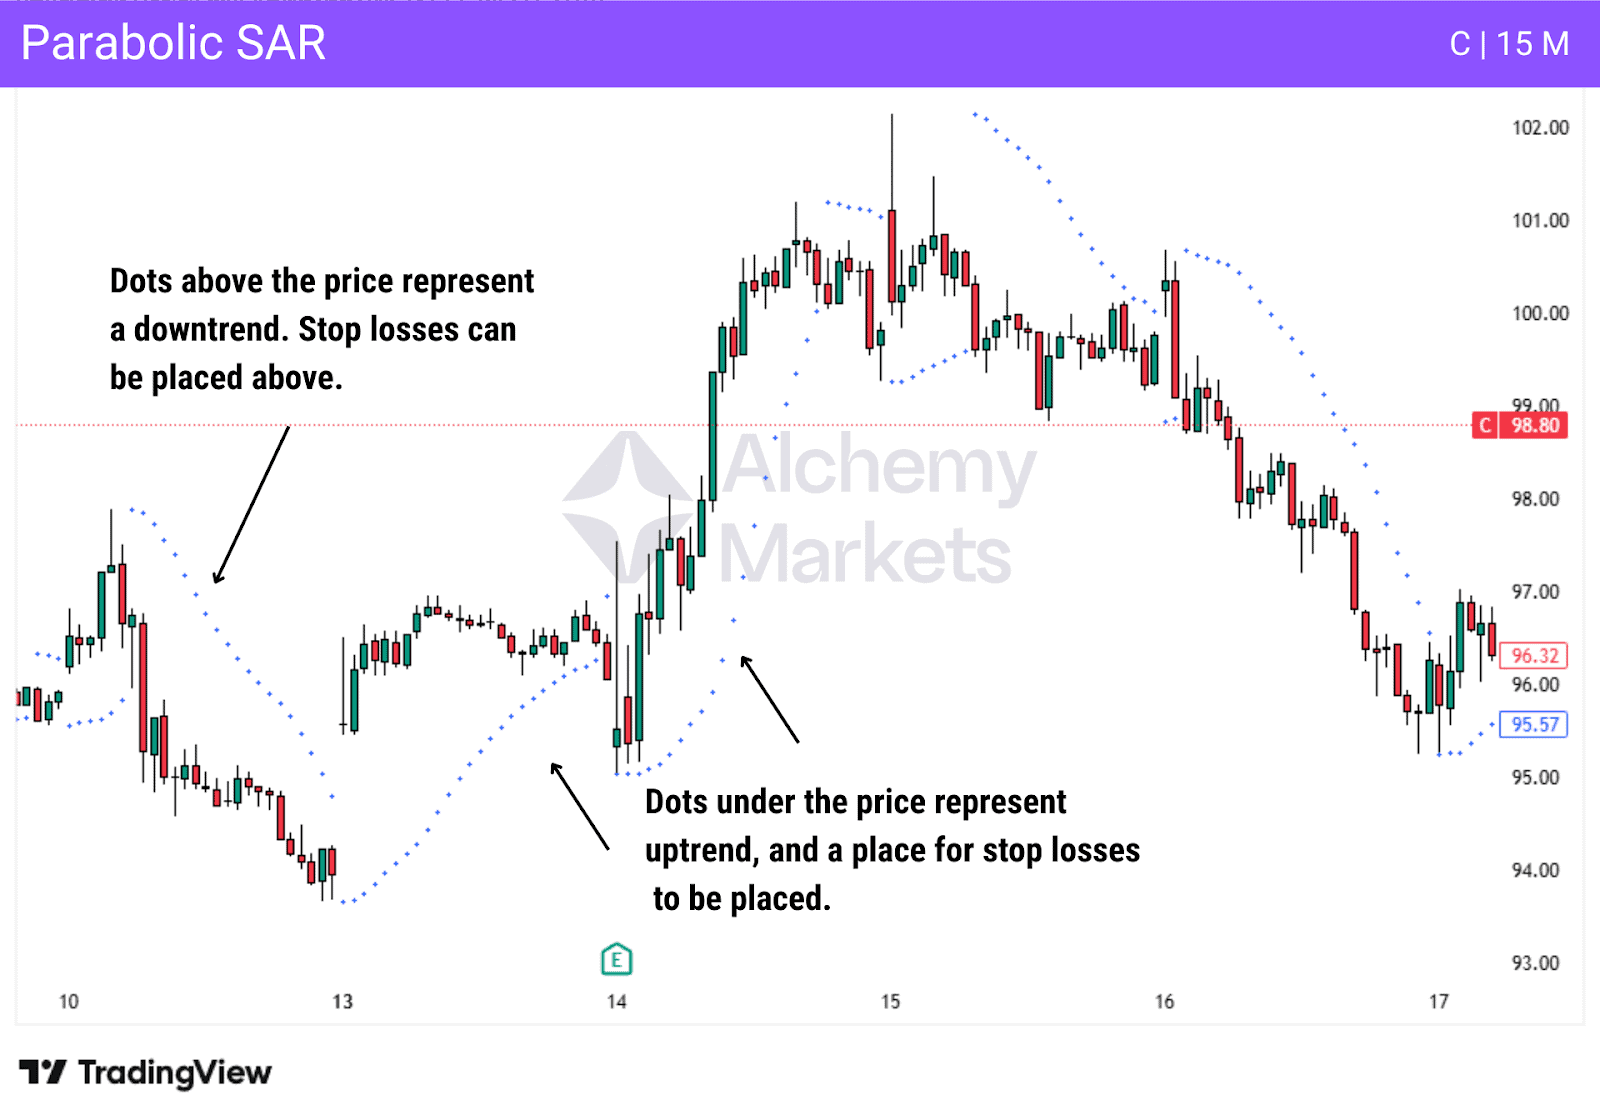
Parabolic SAR, or “Parabolic Stop and Reverse”, plots a series of dots above or below price to indicate trend direction.
When the dots are below price, the market is in an uptrend. When the dots are above price, the market is in a downtrend. A flip in dot position signals a potential trend change.
Parabolic SAR is often used as a trailing stop tool. When price crosses the dots, traders commonly exit positions. The indicator works best in strong trends and performs poorly in sideways markets.
Donchian Channels
Type: Trend following
| Best Used For |
| Helps identify breakouts in trending markets |
| Best Trading Time Frames |
| Higher time frames like the 4-hour or daily charts |
| Indicator Complexity |
| Intermediate |
How Donchian Channels Work:
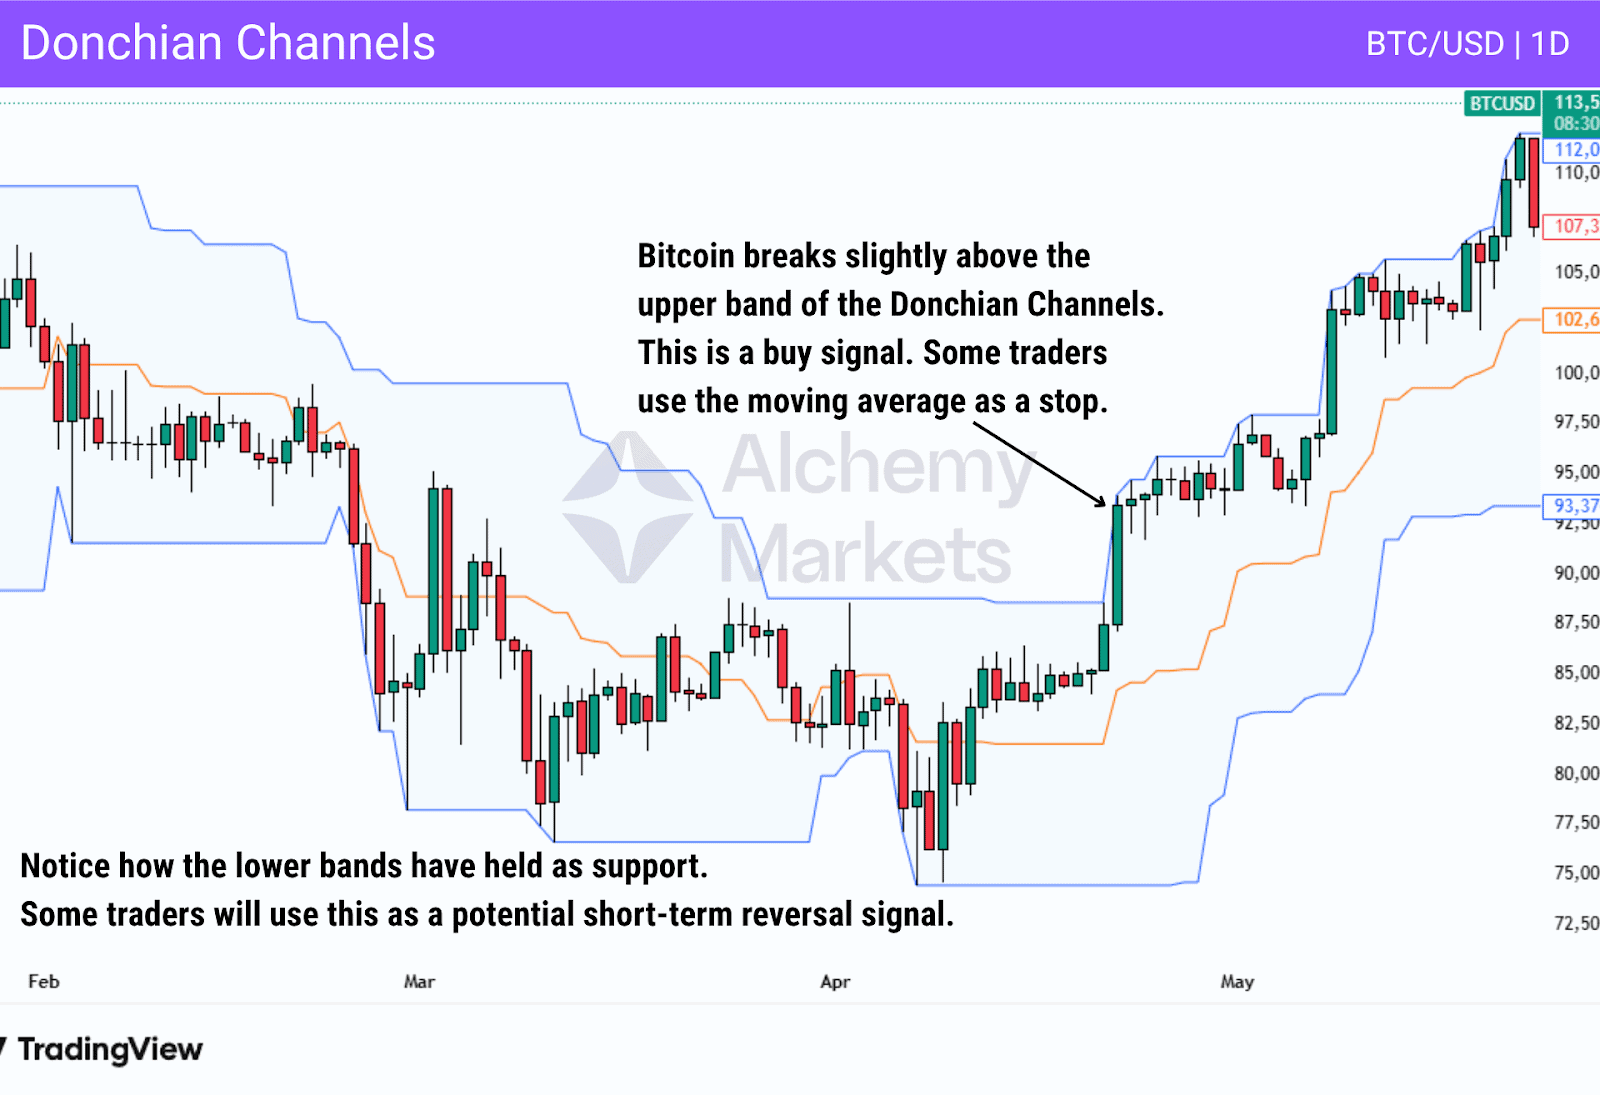
Donchian Channels plot the highest high and lowest low over a specified period, typically 20 periods.
A breakout above the upper band signals potential bullish continuation, while a break below the lower band signals bearish continuation.
Donchian Channels are most effective in trending markets and are commonly used as part of breakout-based strategies. They provide clear, objective levels, but can generate false signals during range-bound conditions.
Directional Movement Index (DMI)
Type: Trend Following
| Best Used For |
| Identifying trend direction and filtering low-quality market conditions |
| Best Trading Time Frames |
| Works across all timeframes, favoured on higher timeframes |
| Indicator Complexity |
| Intermediate / Advanced |
How Directional Movement Index (DMI) Works:
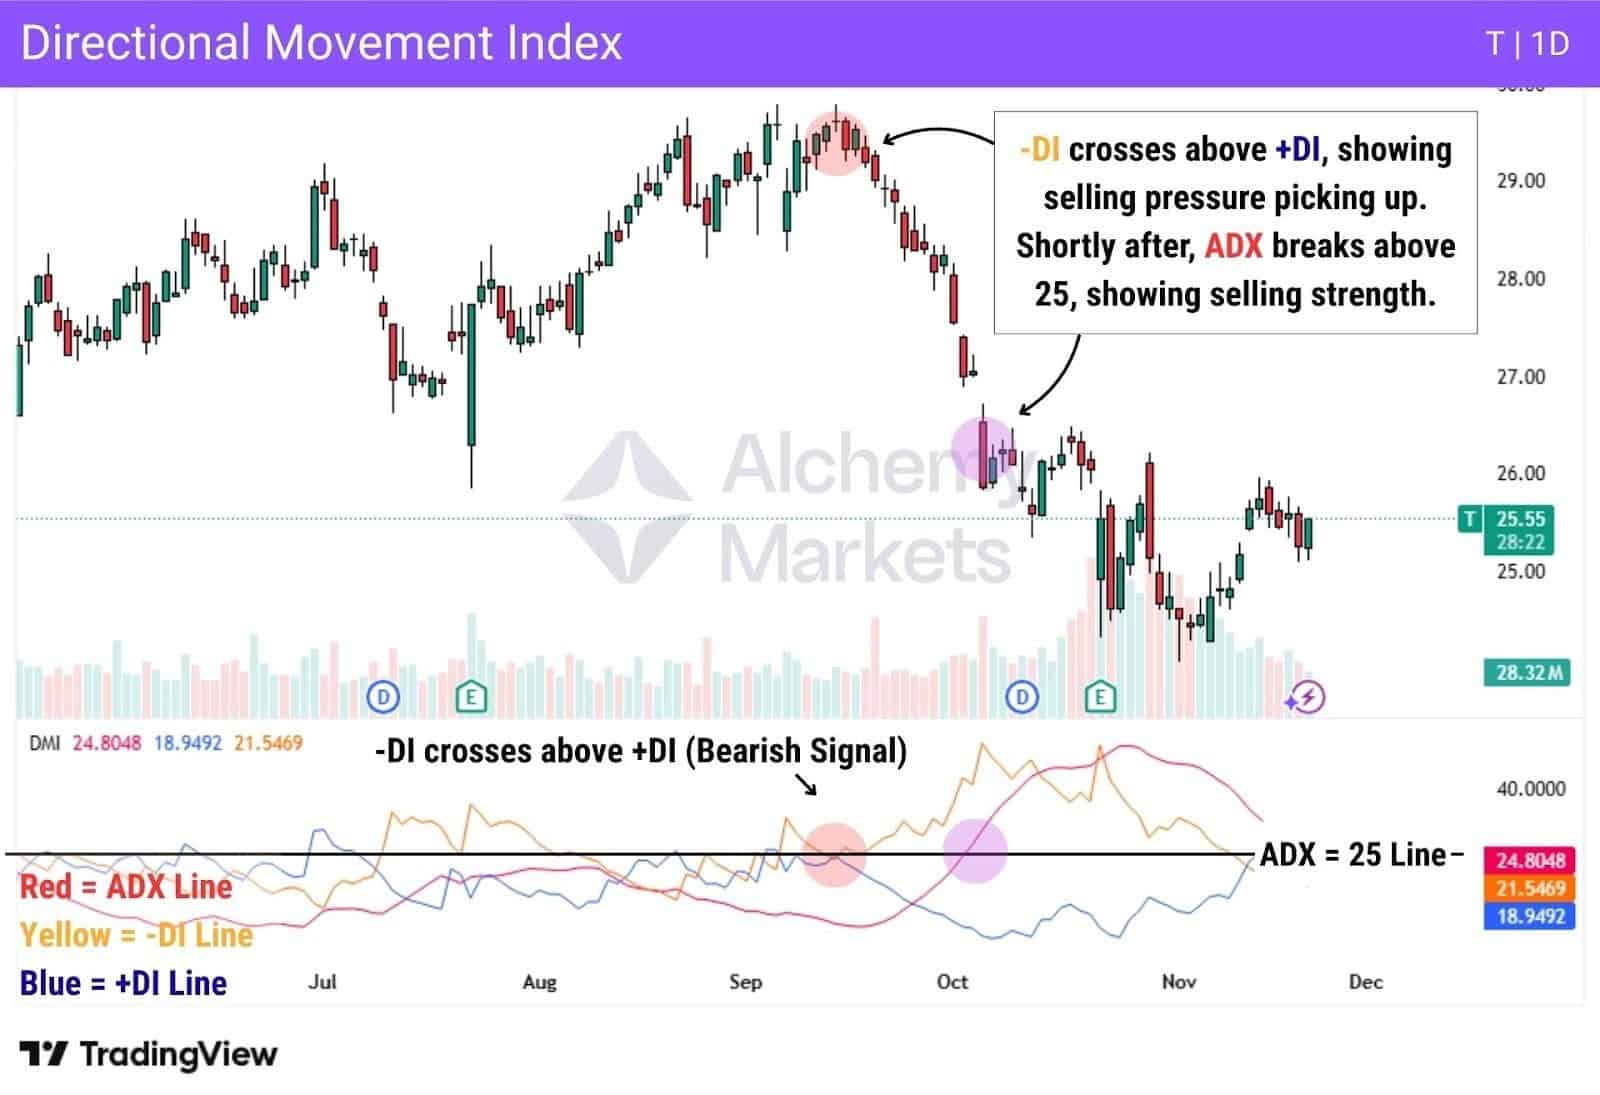
The Directional Movement Index consists of +DI, -DI, and ADX. The +DI line reflects bullish pressure, while the -DI line reflects bearish pressure. Their relationship determines directional bias.
ADX measures trend strength rather than direction. Rising ADX confirms a strengthening trend, while falling ADX signals weakening conditions. Values above 20–25 typically indicate a tradeable trend.
DMI is most effective as a trend filter, helping traders avoid choppy, low-momentum markets.
SuperTrend Indicator
Type: Trend Following
| Best Used For |
| Identifying clear trend direction and managing trades with trailing stops |
| Best Trading Time Frames |
| Works across all timeframes |
| Indicator Complexity |
| Beginner |
How Supertrend Indicator Works:
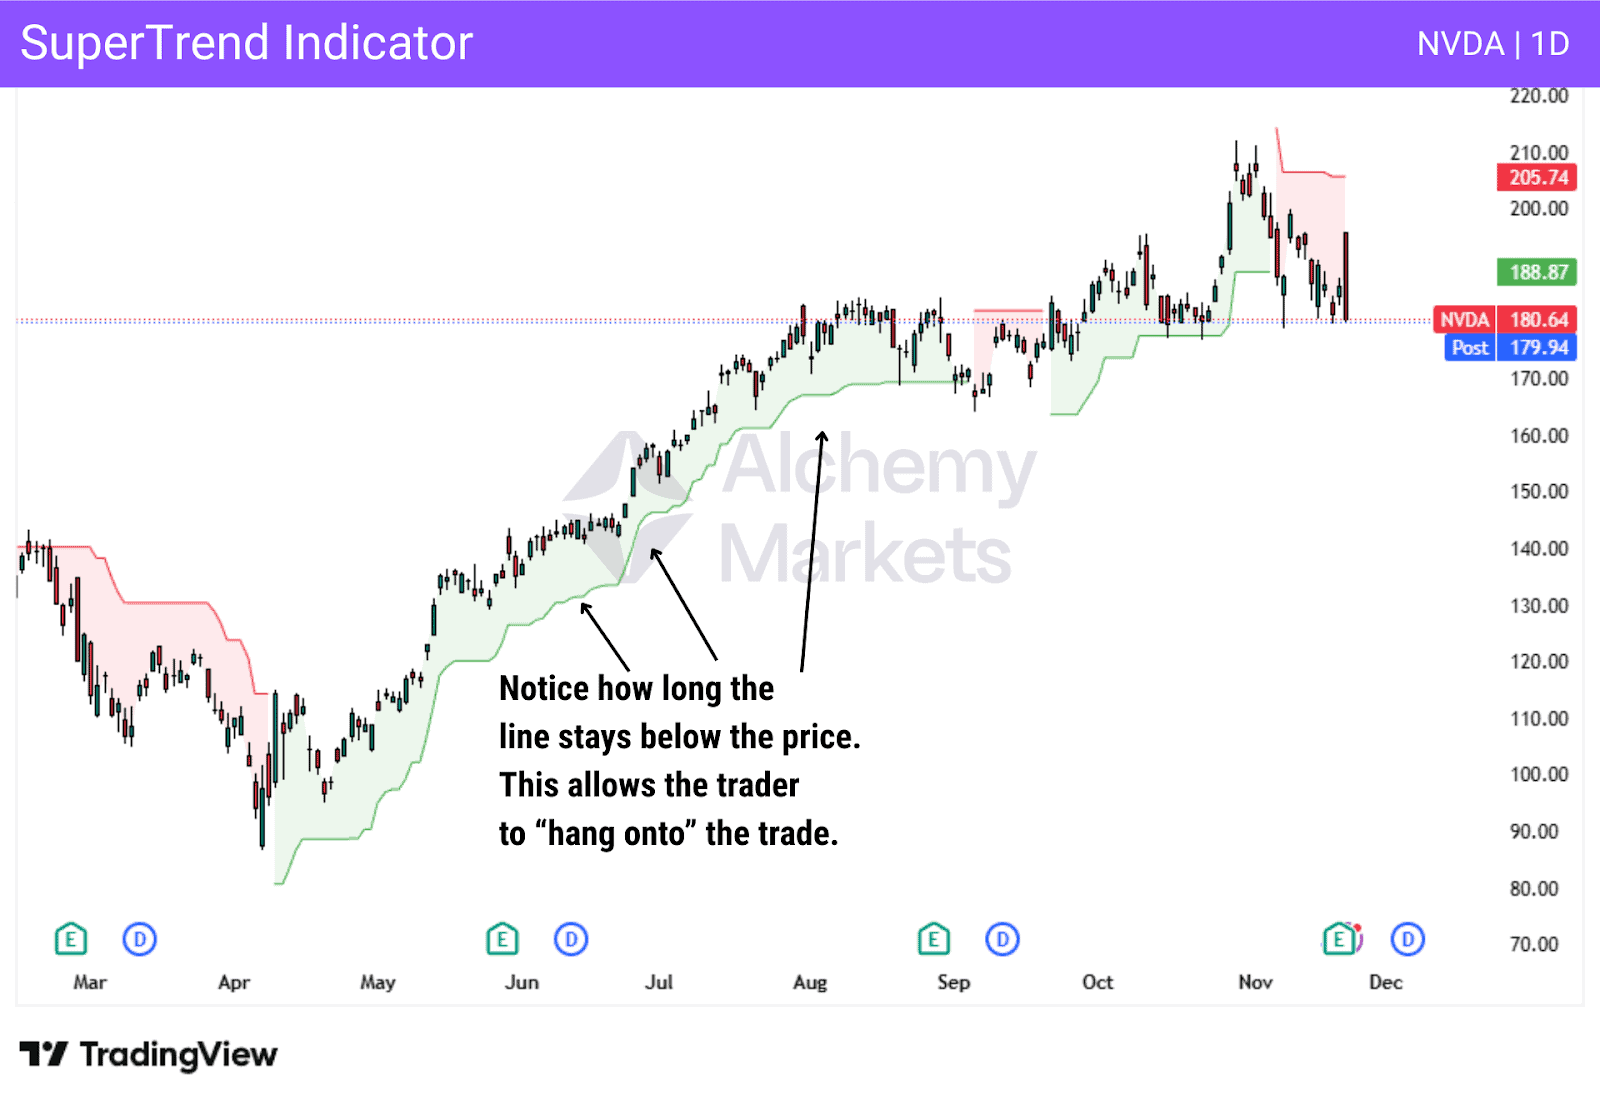
The SuperTrend indicator uses the Average True Range (ATR) to plot a volatility-adjusted trend line above or below price.
When the line is below price, the market is considered bullish. When it flips above price, the market is considered bearish. Each flip acts as a clear trend change signal.
SuperTrend is designed to reduce noise and keep traders aligned with strong trends. It performs poorly in sideways markets and is best used with structure or higher-timeframe confirmation.
Keltner Bands
Type: Trend Following
| Best Used For |
| Identifying trend direction, trend strength, and dynamic pullback zones |
| Best Trading Time Frames |
| Works across all timeframes |
| Indicator Complexity |
| Intermediate |
How Keltner Channels Works:
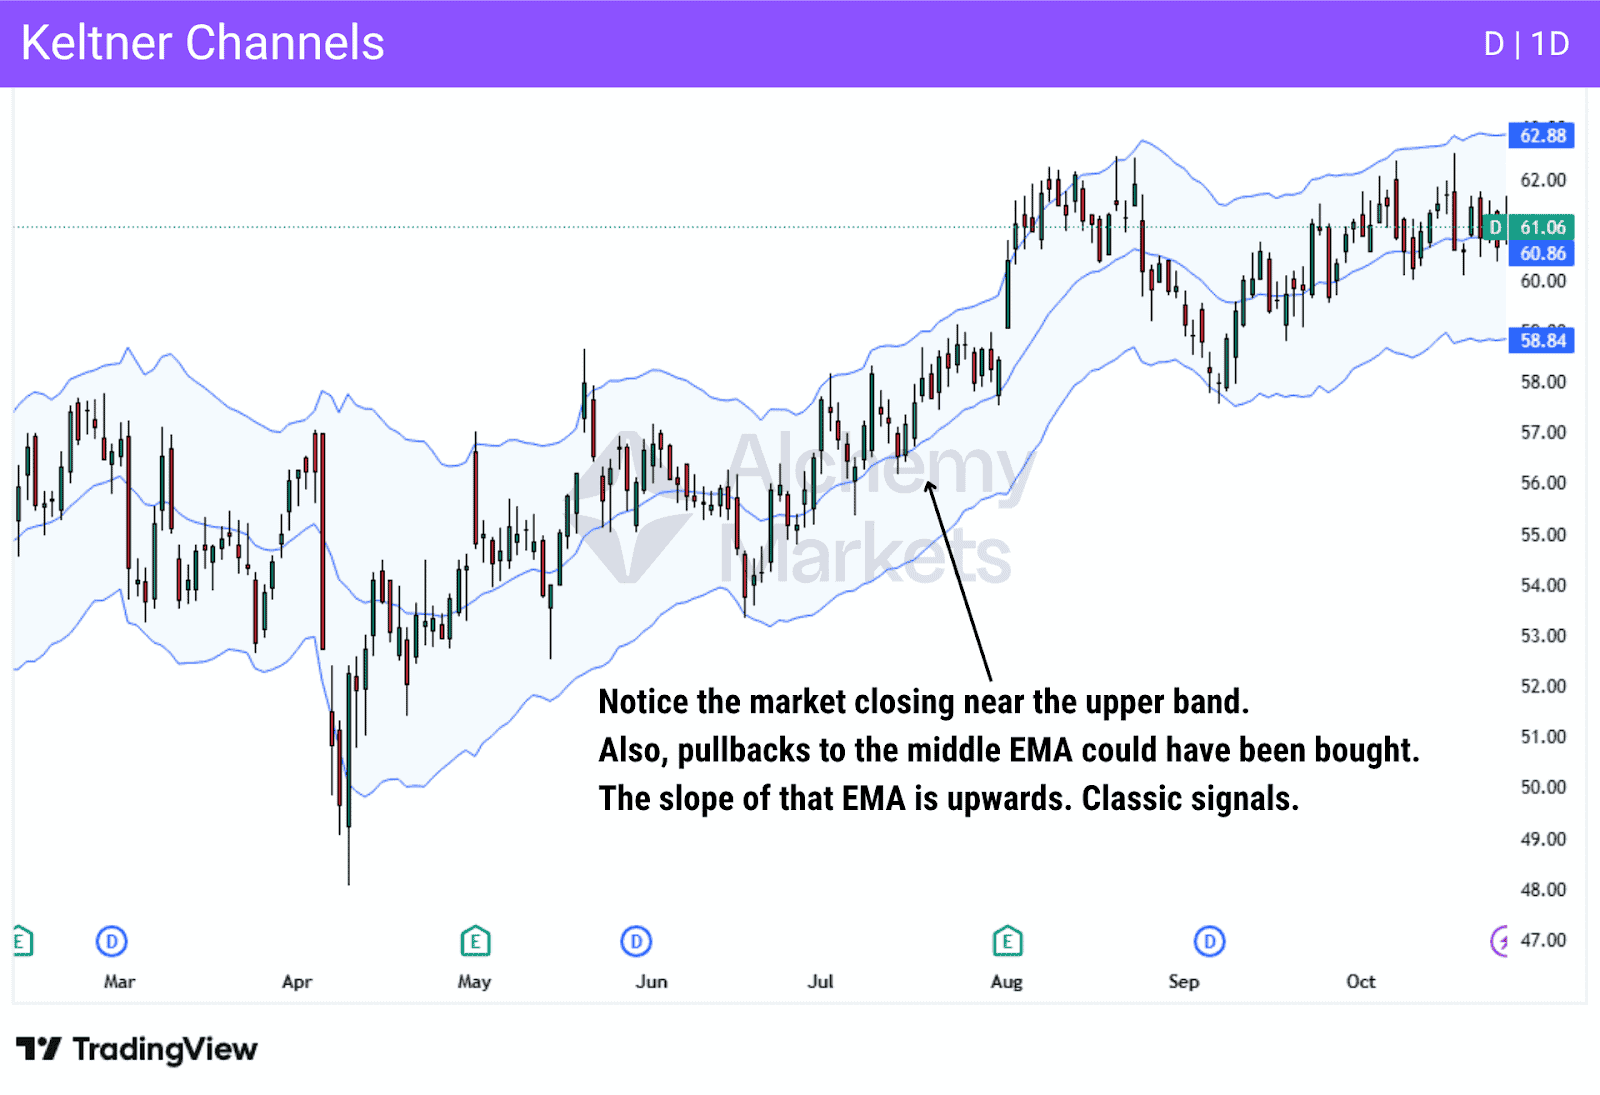
Keltner Channels are built around an exponential moving average, typically a 20-period EMA, with upper and lower bands derived from the Average True Range (ATR).
Because the bands expand and contract with volatility, Keltner Channels adapt smoothly to changing market conditions.
In an uptrend, price tends to respect the middle EMA as dynamic support, while repeated interaction with the upper band signals strength. The opposite applies in downtrends.
Keltner Channels work best in trending markets and are less effective during prolonged consolidation.
Best Momentum Indicators
Moving Average Convergence Divergence (MACD)
Type: Momentum
| Best Used For |
| MACD is used for identifying trends and momentum measurement |
| Best Trading Time Frames |
| MACD is used on all timeframes |
| Indicator Complexity |
| Intermediate to advanced |
How MACD Works:
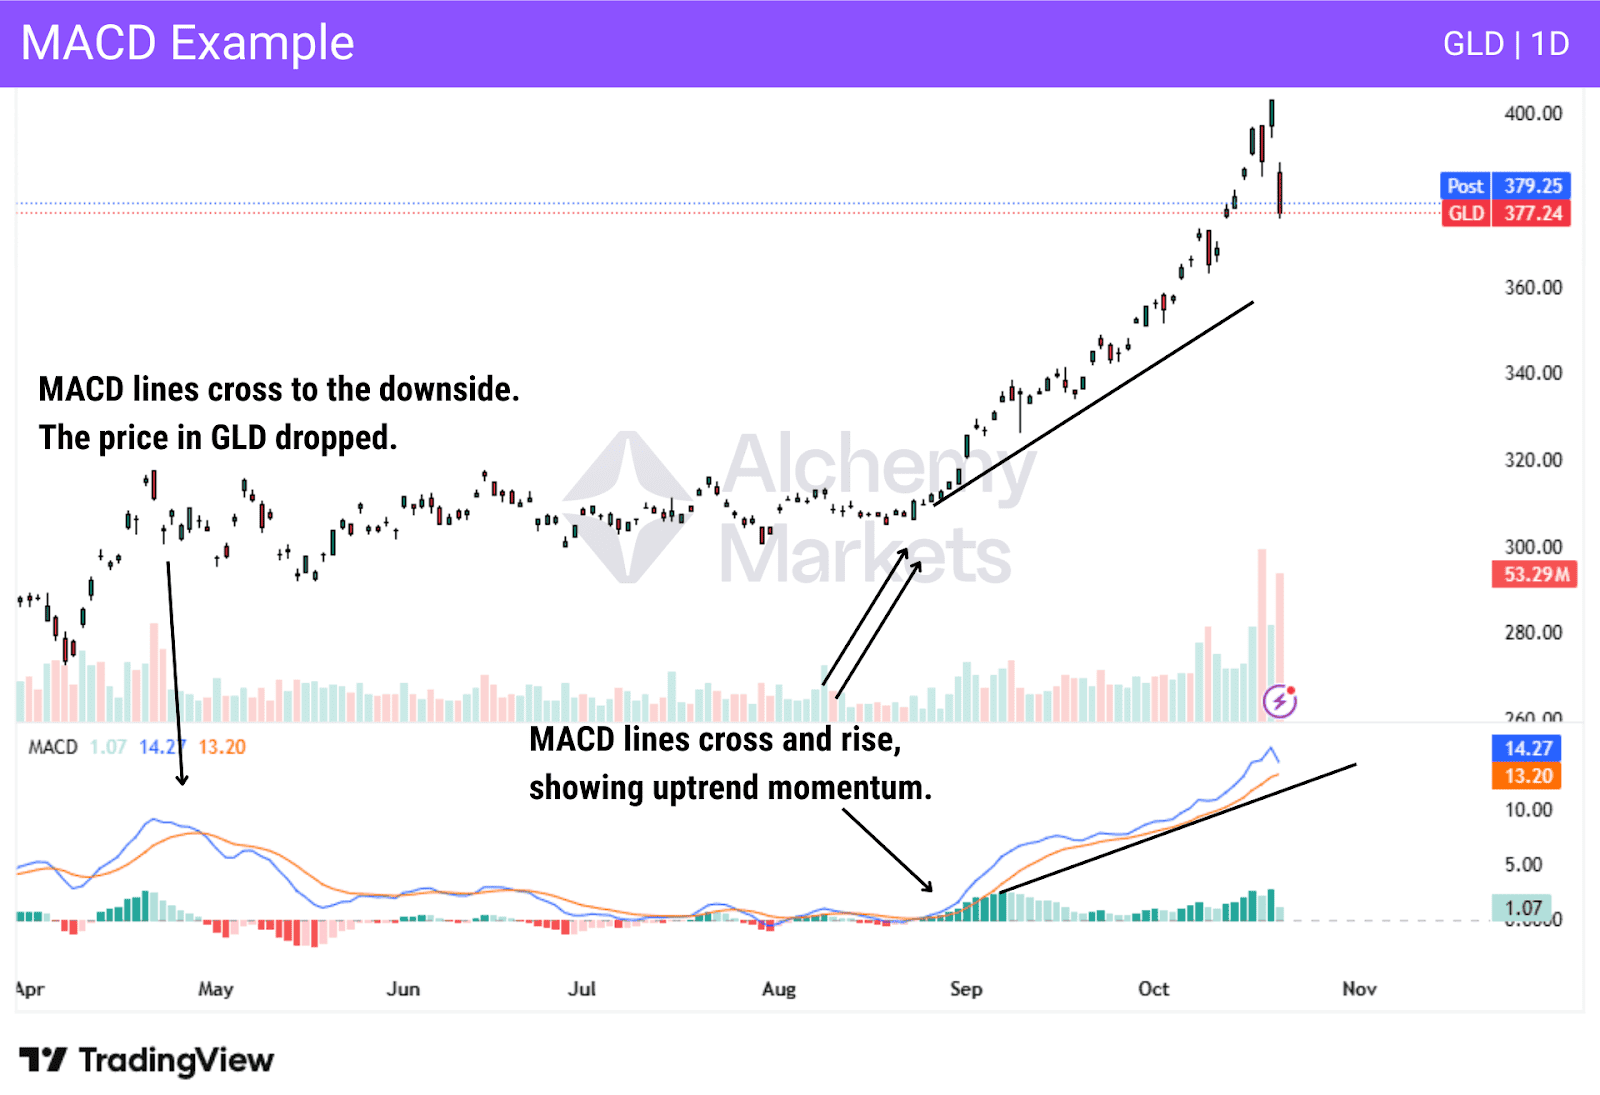
Moving Average Convergence Divergence (MACD) indicator measures the relationship between two moving averages to assess trend direction and momentum.
It consists of a MACD line, a signal line, and often a histogram. The MACD line reflects broader momentum, while the histogram reacts more quickly to short-term changes.
When the MACD line crosses above the signal line, bullish momentum is increasing. A cross below signals weakening momentum.
MACD is also widely used for spotting divergence. If price moves higher while the MACD fails to confirm, momentum is fading and a reversal or pullback may follow.
MACD works best when combined with trend structure rather than used in isolation.
Relative Strength Index (RSI)
Type: Momentum
| Best Used For |
| Measuring momentum, identifying overbought and oversold conditions, and spotting divergence |
| Best Trading Time Frames |
| RSI is used in all time frames |
| Indicator Complexity |
| Beginner to intermediate |
How the Relative Strength Index Works:
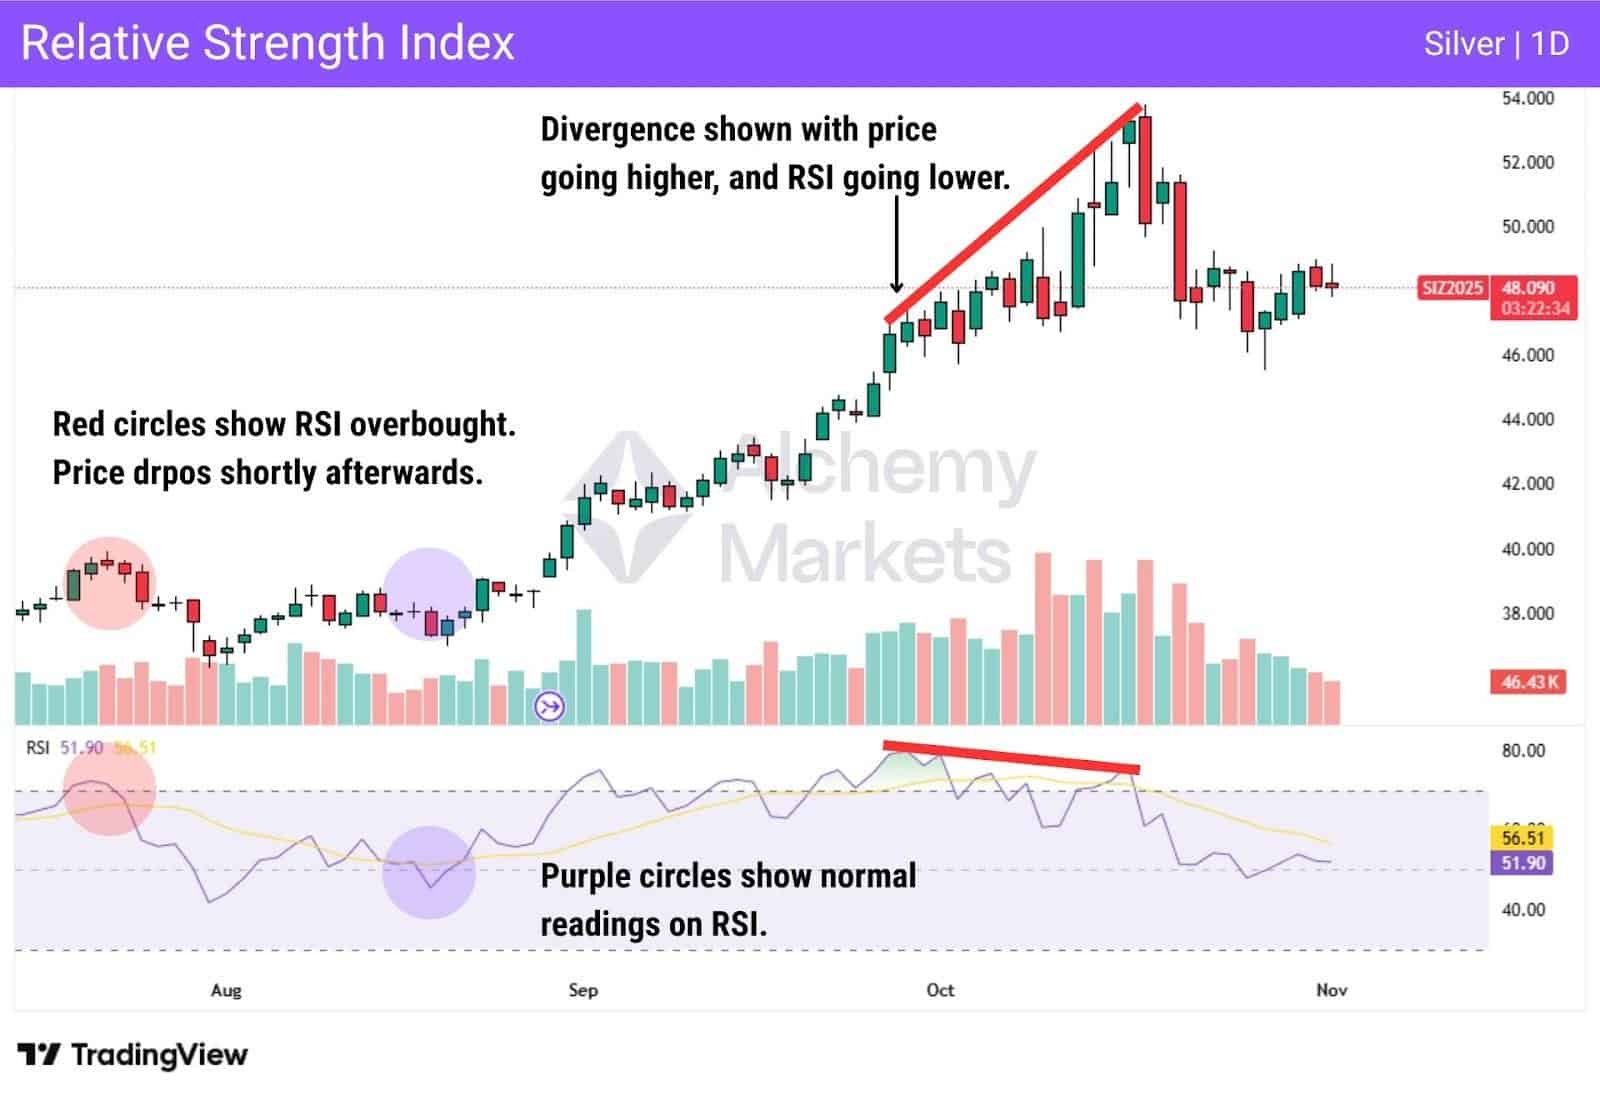
Relative Strength Index (RSI) measures the speed and magnitude of recent price movements to assess momentum.
The indicator oscillates between 0 and 100. Readings above 70 suggest overbought conditions, while readings below 30 suggest oversold conditions. These levels do not guarantee reversals, but they highlight areas where momentum may begin to slow.
In strong trends, RSI often stays between the 30 and 70 levels. This behaviour indicates trend strength rather than exhaustion.
RSI is also commonly used to identify divergence. If price makes higher highs while RSI fails to confirm, momentum is weakening and a pullback or reversal may follow.
Stochastic Oscillator
Type: Momentum
| Best Used For |
| Finding overbought and oversold conditions and potential momentum shifts |
| Best Trading Time Frames |
| Most popular on the 1H and 1D timeframes, but applicable on any timeframe |
| Indicator Complexity |
| Intermediate |
How the Stochastic Oscillator Works:
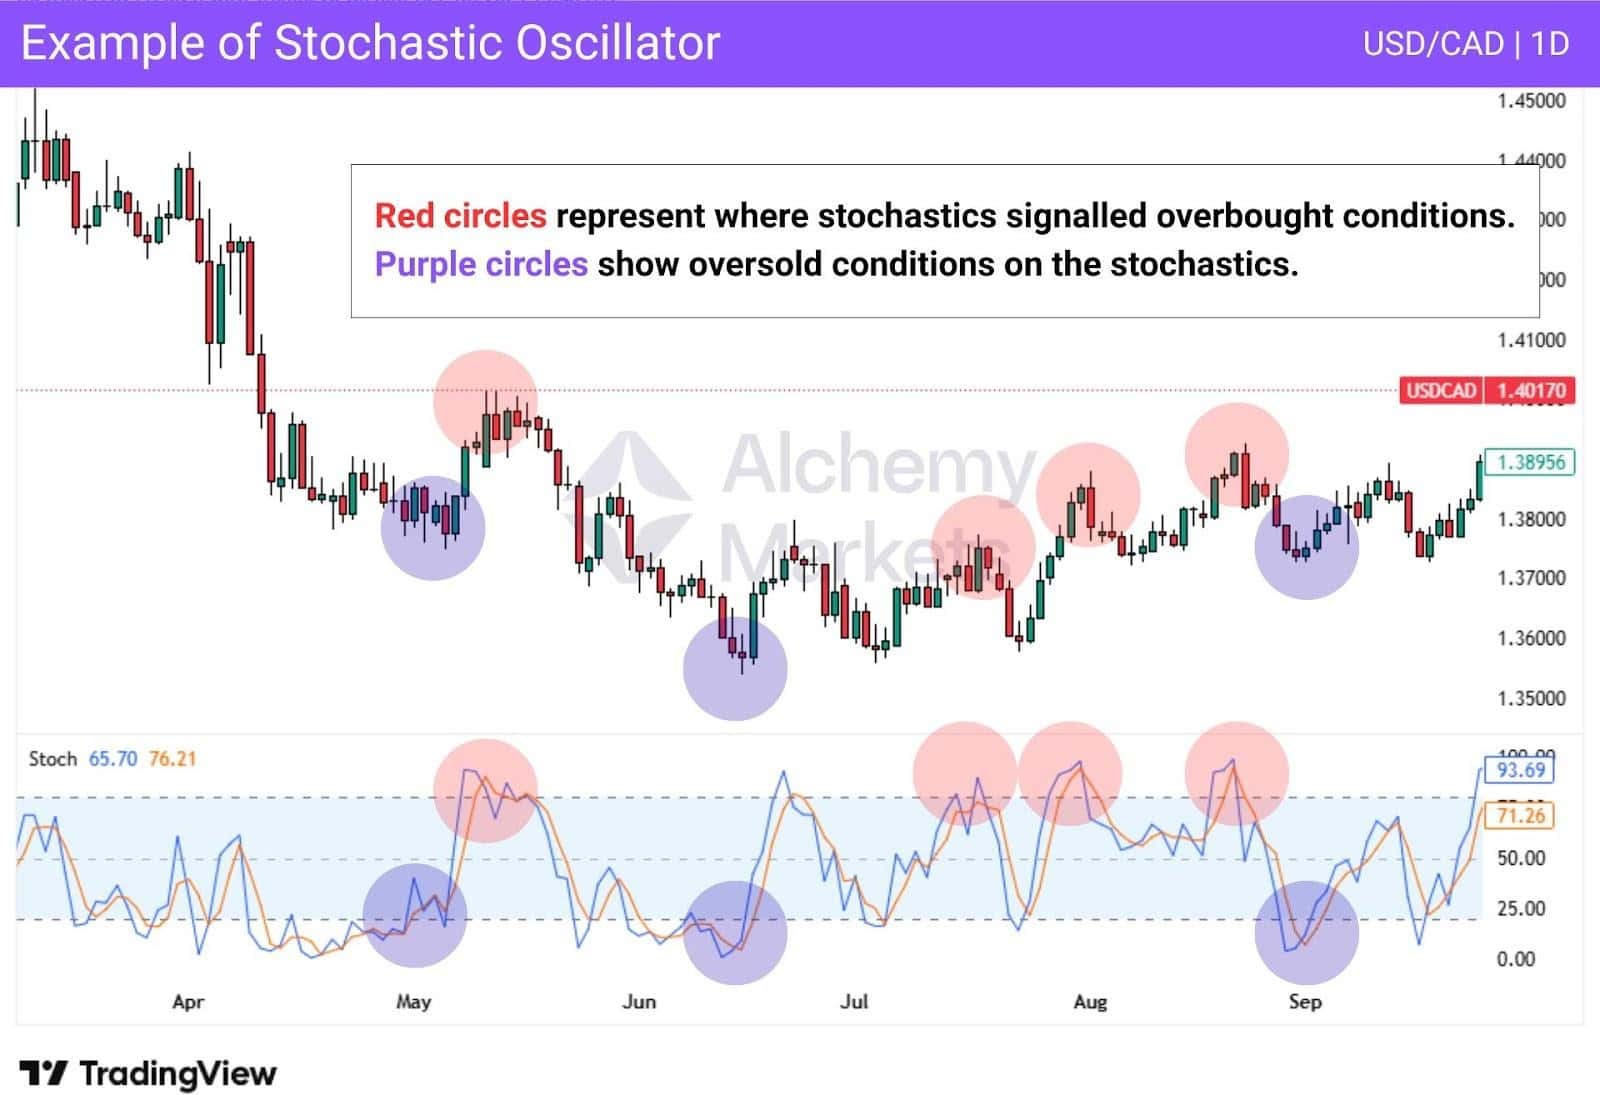
Stochastic oscillator compares the current closing price to the asset’s recent trading range.
Readings above 80 indicate potentially overbought conditions, while readings below 20 suggest the market may be oversold. When the indicator is between these levels, momentum is considered neutral.
The Stochastic Oscillator works best in range-bound markets. In strong trends, it can remain overbought or oversold for extended periods, producing false reversal signals.
Because of this, traders often combine the Stochastic Oscillator with trend filters or support and resistance levels to improve signal quality.
Commodity Channel Index (CCI)
Type: Momentum
| Best Used For |
| Understanding overbought or oversold conditions in a market |
| Best Trading Time Frames |
| Works across all timeframes |
| Indicator Complexity |
| Beginner / Intermediate |
How the Commodity Channel Index Works:
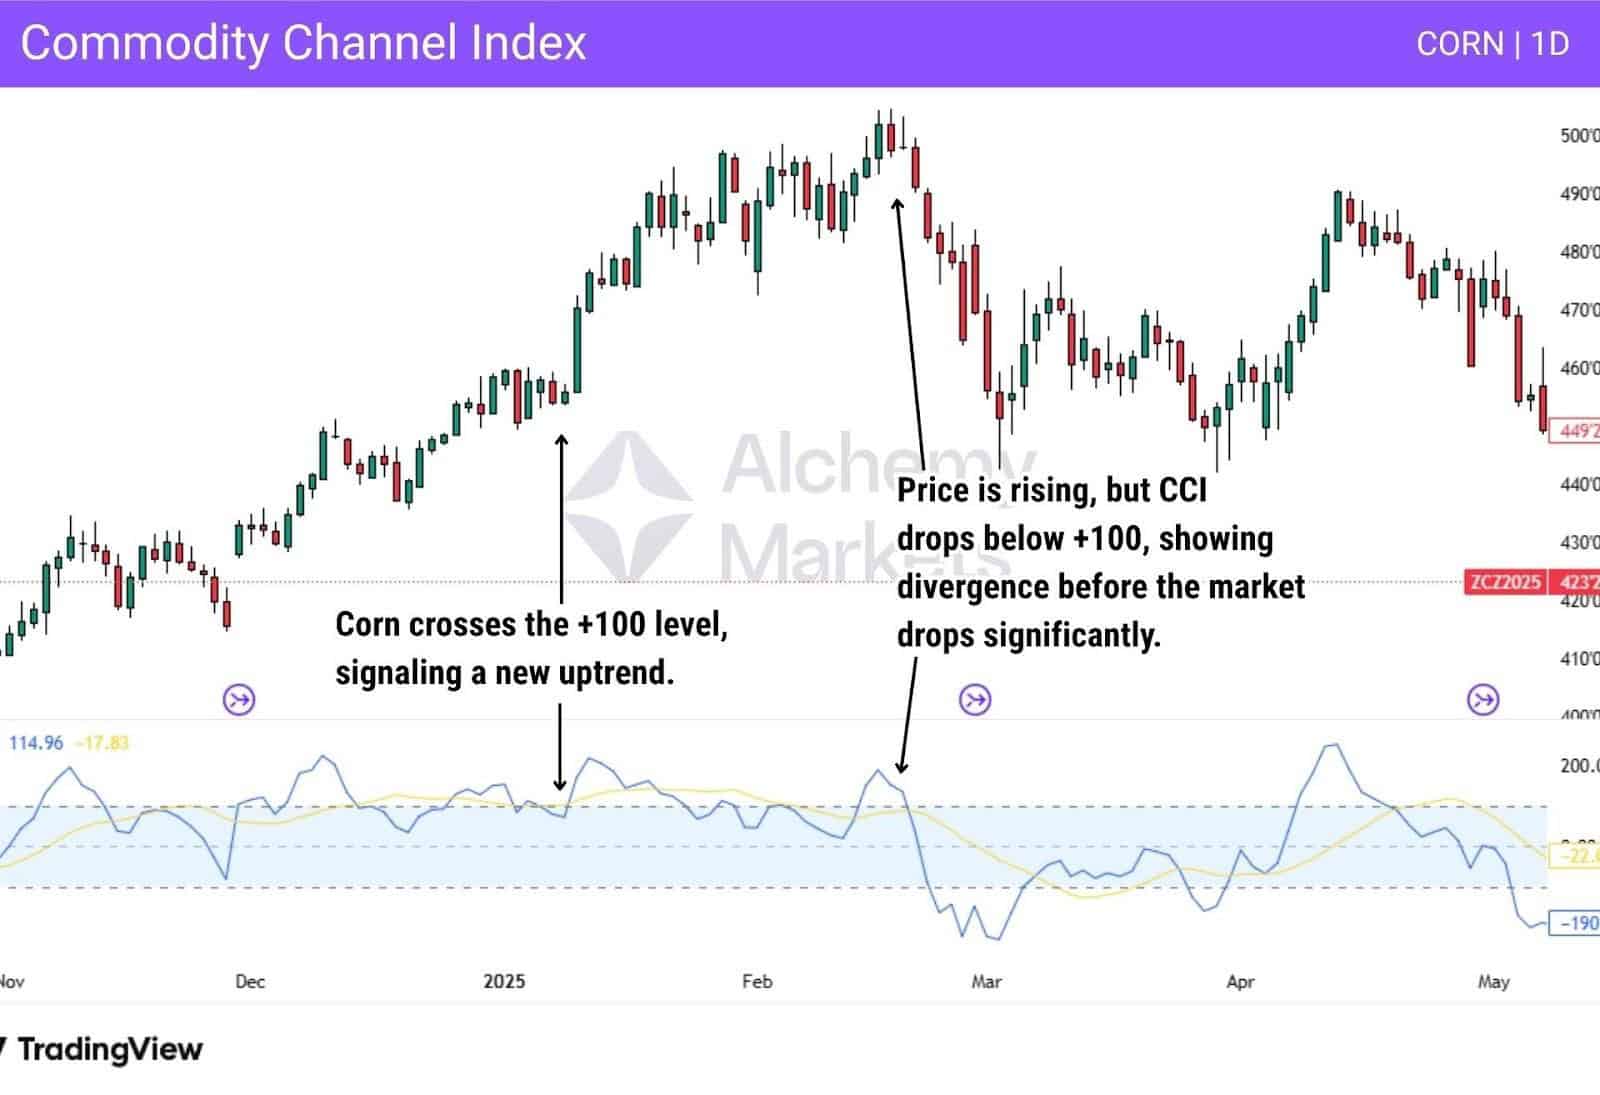
The Commodity Channel Index (CCI) measures how far price deviates from its average value over a given period. It’s similar to the RSI and MACD, in that divergence signals can be detected as well.
Readings above +100 indicate strong bullish momentum, while readings below -100 indicate strong bearish momentum. Moves back within these levels can signal momentum fading.
CCI is flexible and can be used for both trend continuation and reversal-based strategies, depending on how it is applied and filtered.
Standard Deviation Indicator
Type: Momentum
| Best Used For |
| Measuring volatility expansion and contraction |
| Best Trading Time Frames |
| Works across all timeframes, most effective on intraday and 4-hour charts |
| Indicator Complexity |
| Beginner |
How Standard Deviation Works:
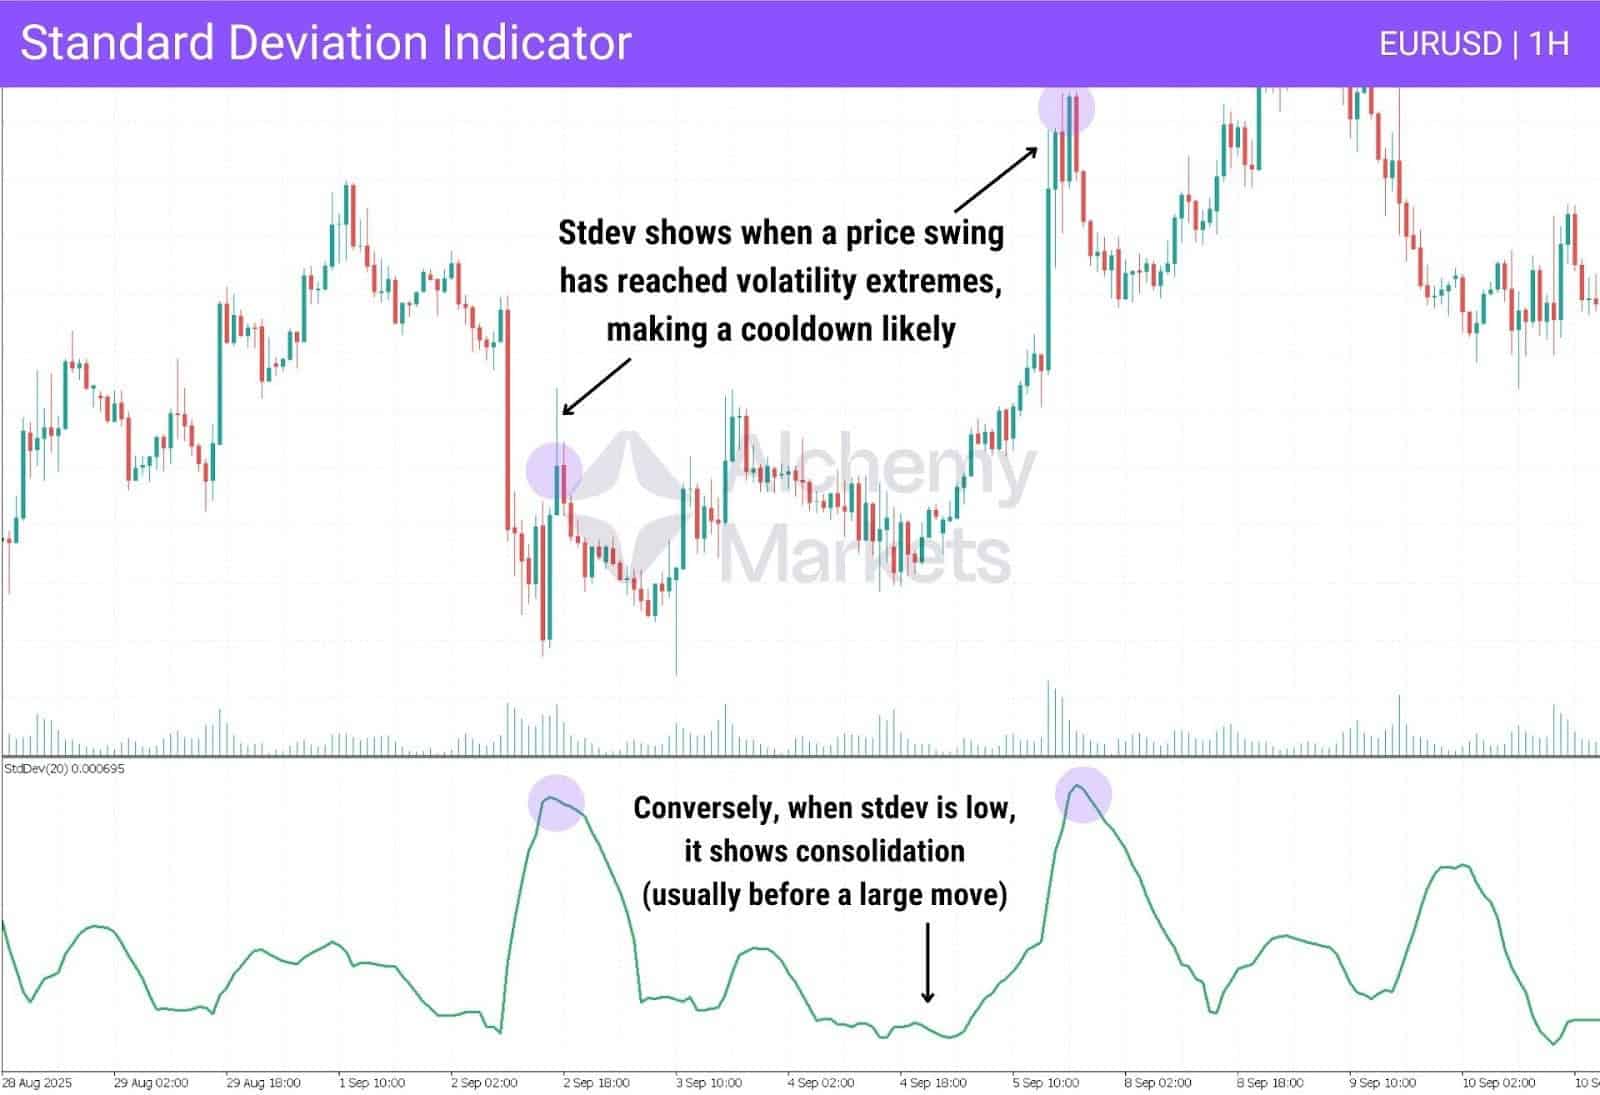
The Standard Deviation indicator measures how far price typically deviates from its average over a given period, providing a direct view of market volatility (how far price is expected to move).
Low readings indicate compressed, low-volatility conditions, while rising values signal expanding volatility.
Periods of low standard deviation often precede strong price moves, as markets transition from consolidation into expansion.
The indicator does not provide direction. Instead, it helps traders avoid chasing extended moves and anticipate environments where breakouts or trend acceleration are more likely.
Williams Percentage Range
Type: Momentum
| Best Used For |
| Identifying overbought, oversold and divergence conditions |
| Best Trading Time Frames |
| Daily or 4-hour charts |
| Indicator Complexity |
| Beginner |
How Williams Percentage Range Works:
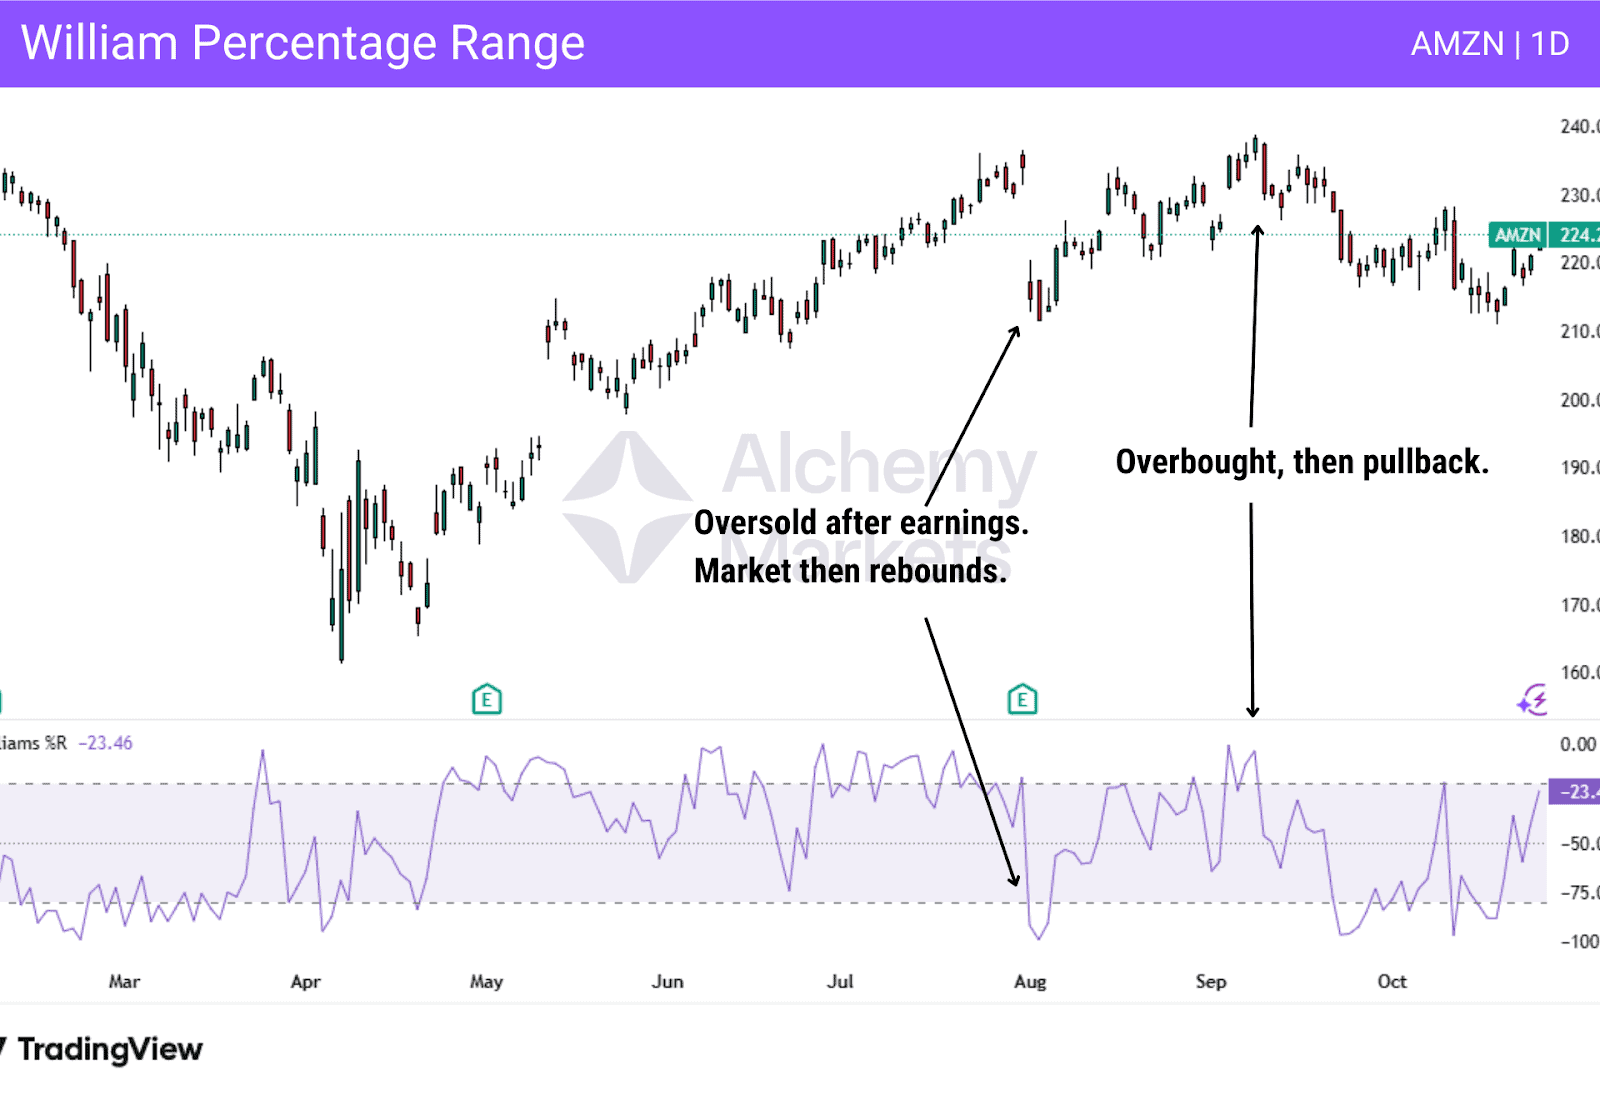
Williams Percentage Range compares the current closing price to the highest high and lowest low over a defined period, typically 14.
Readings above -20 suggest overbought conditions, while readings below -80 suggest oversold conditions.
Because of its sensitivity, Williams %R is best used alongside structure or support and resistance, rather than as a standalone signal.
Trix Indicator
Type: Momentum
| Best Used For |
| Identifying trend direction and momentum shifts while filtering noise |
| Best Trading Time Frames |
| Works across all timeframes, best in liquid markets |
| Indicator Complexity |
| Intermediate to Advanced |
How TRIX Indicator Works:
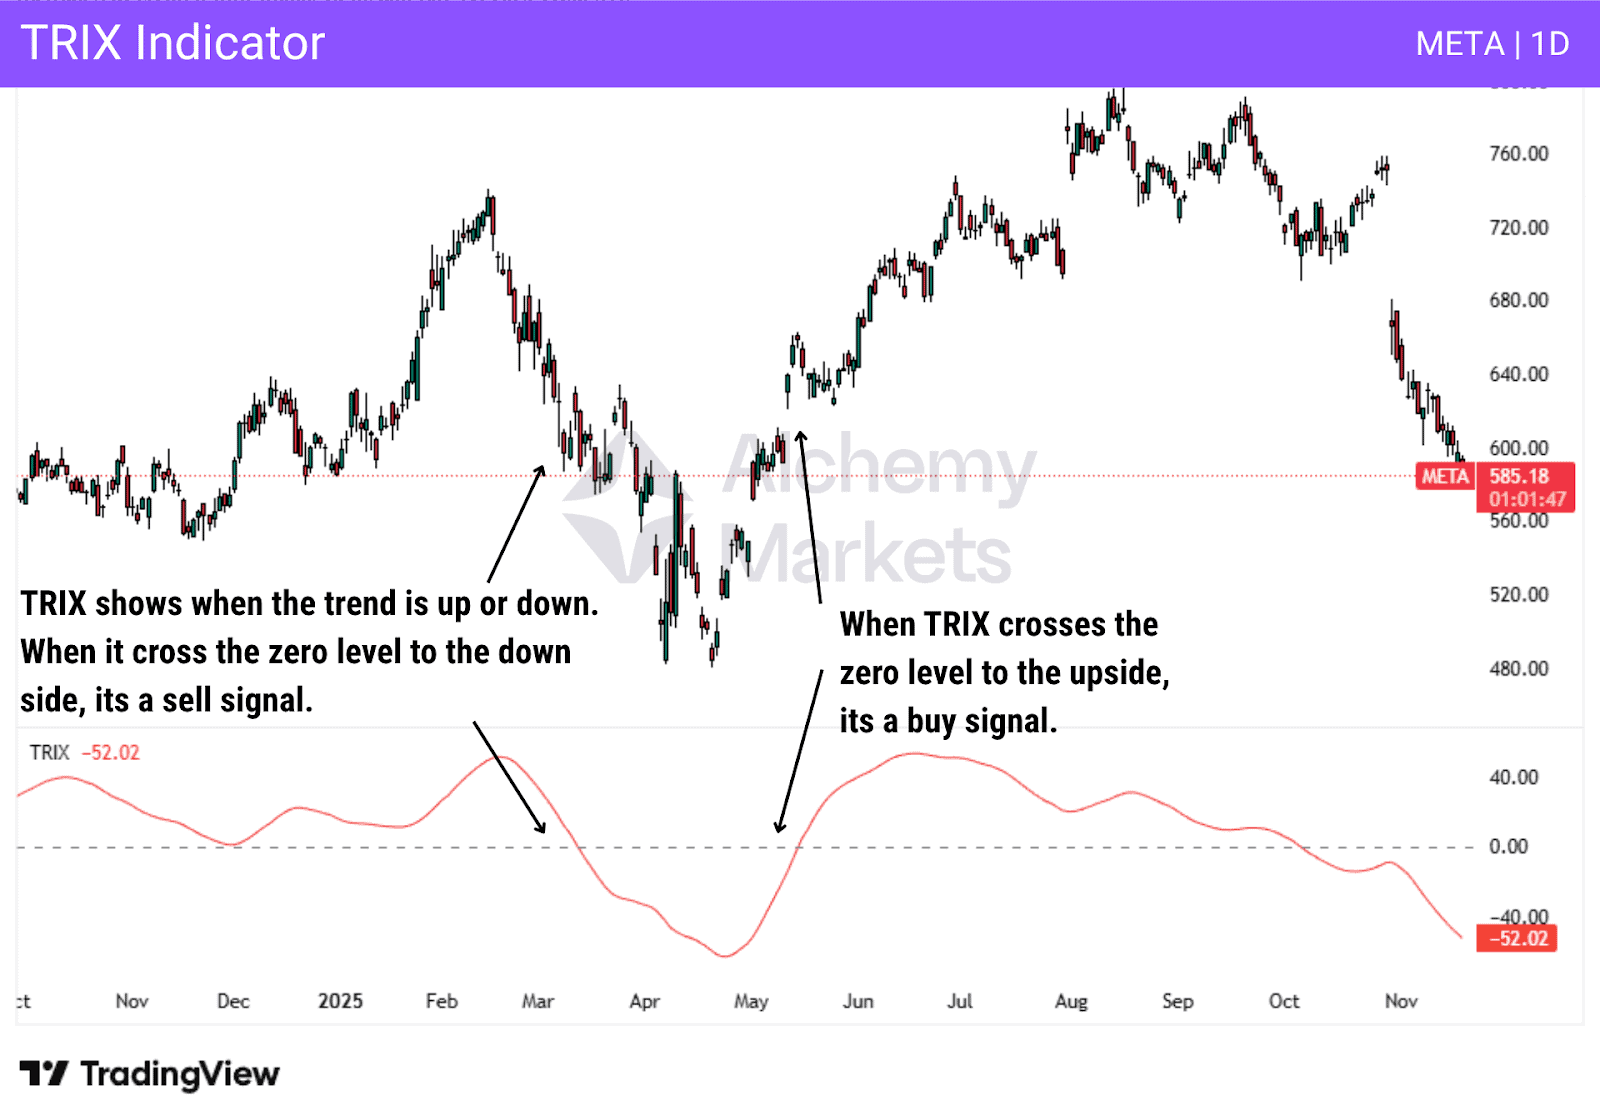
The TRIX indicator uses a triple-smoothed exponential moving average designed to avoid whipsaws by filtering out short-term market noise and isolating meaningful trend movements.
When the TRIX line moves above zero, it signals strengthening bullish momentum. A move below zero suggests increasing bearish momentum.
Signal line crossovers in the TRIX are commonly used to time entries and exits within an existing trend.
Due to its heavy smoothing, TRIX responds more slowly to sudden price changes. It is best used to confirm trend direction and momentum rather than to anticipate reversals. The indicator performs best in sustained trending environments and loses effectiveness in sideways markets.
For higher-quality signals, traders typically combine TRIX with price structure, key support and resistance levels, or higher-timeframe trend filters.
Force Index Indicator
Type: Momentum
| Best Used For |
| Measuring the strength behind price movements and spotting divergence |
| Best Trading Time Frames |
| Works across all liquid markets and timeframes |
| Indicator Complexity |
| Intermediate |
How Force Index Works:
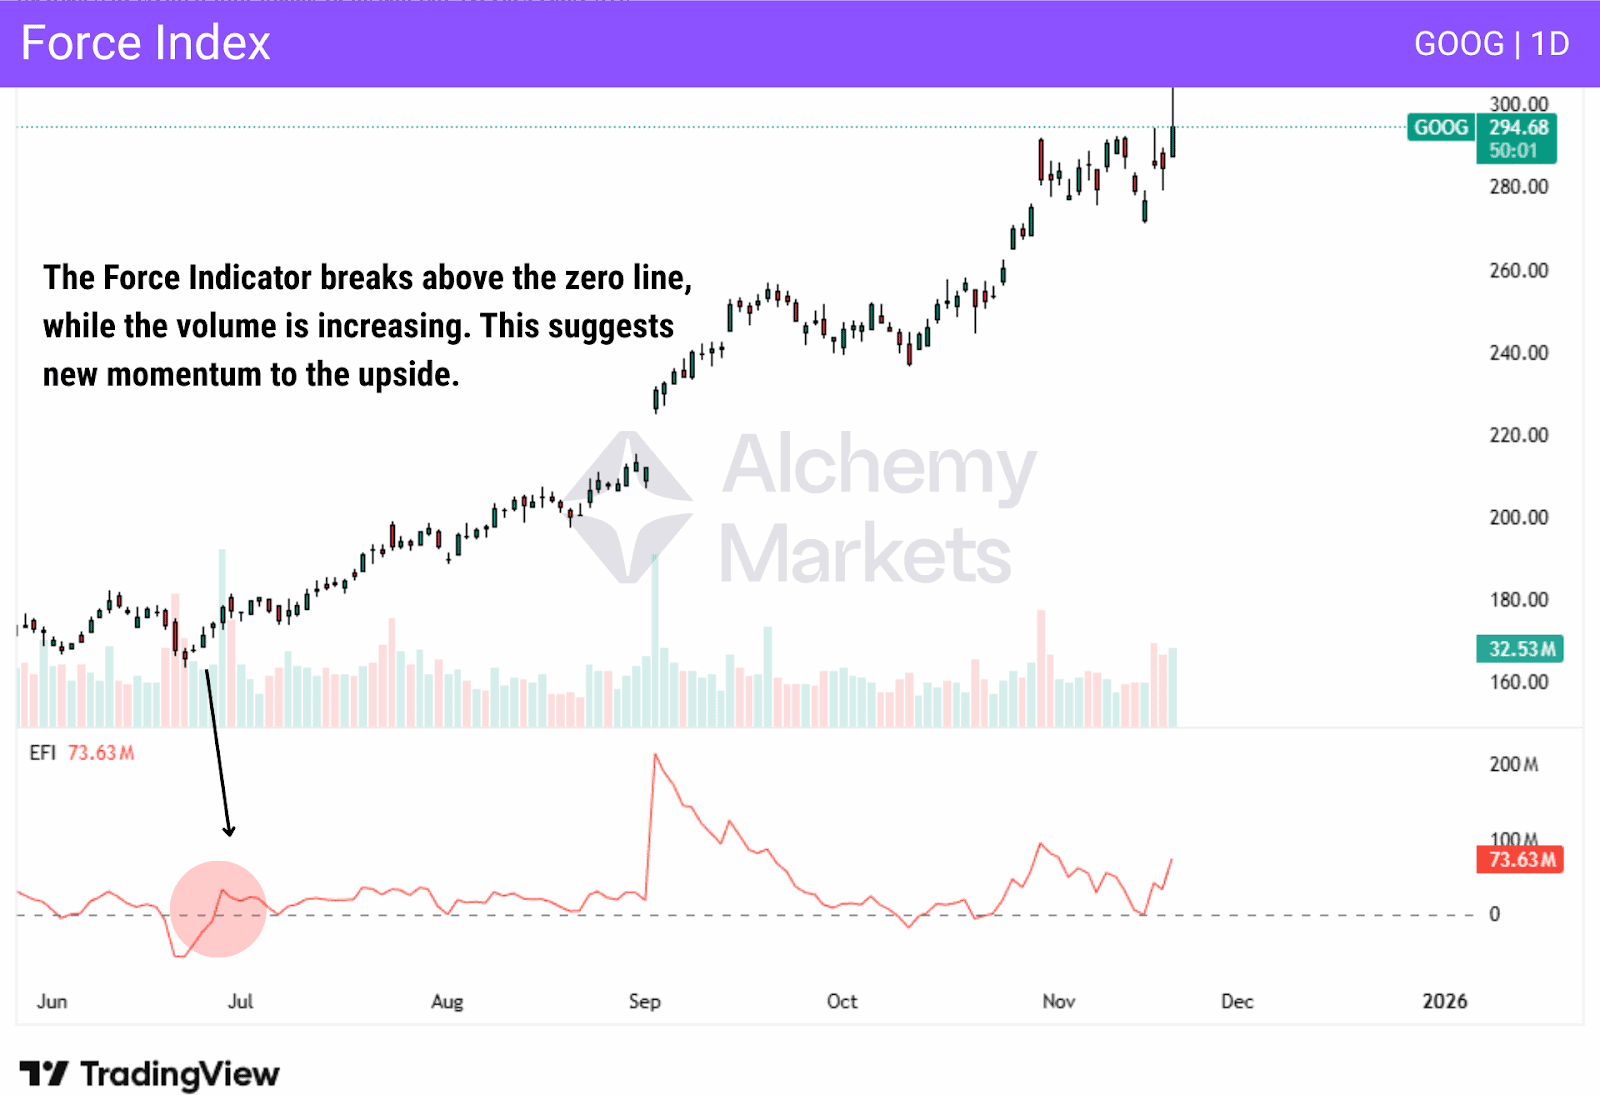
The Force Index combines price change and volume to measure the strength driving a market move.
Positive readings indicate buying pressure, while negative readings signal selling pressure.
Applying a short or medium-term exponential moving average helps smooth the indicator and clarify momentum shifts.
Divergence between price and the Force Index often signals weakening conviction, making the indicator useful for confirming breakouts, trend continuation, or potential exhaustion.
Money Flow Index (MFI)
Type: Momentum
| Best Used For |
| Understanding whether a trend or move has the potential to continue |
| Best Trading Time Frames |
| While it can be used on all time frames, the higher the time frame, the more reliable MFI is |
| Indicator Complexity |
| Intermediate |
How Money Flow Index Works:
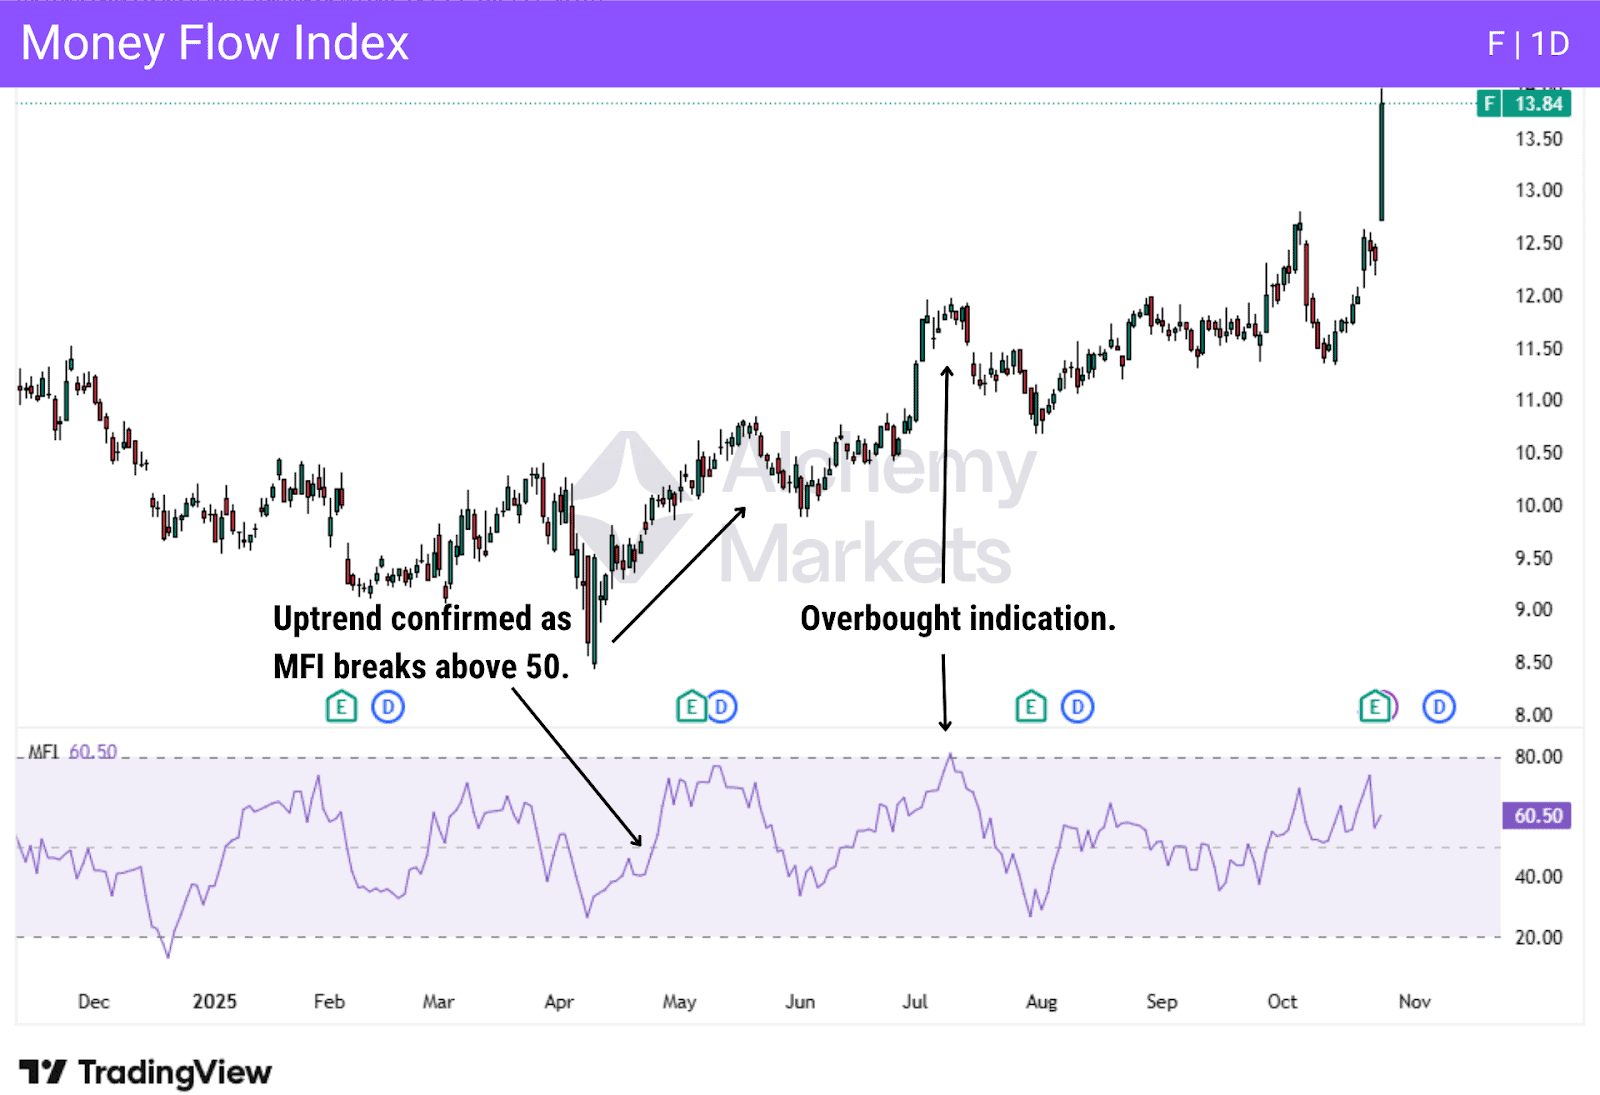
The Money Flow Index combines price and volume to measure buying and selling pressure. It oscillates between 0 and 100.
Readings above 80 suggest overbought conditions, while readings below 20 indicate oversold conditions. Crosses above or below the 50 level are often used to gauge bullish or bearish momentum.
Divergence between price and MFI can signal weakening conviction, making the indicator useful for spotting potential reversals or trend exhaustion.
Relative Vigor Index (RVI)
Type: Momentum
| Best Used For |
| Identifying momentum shifts and confirming trend direction |
| Best Trading Time Frames |
| Works across all timeframes, commonly used on short-term charts |
| Indicator Complexity |
| Intermediate |
How Relative Vigor Index Works:
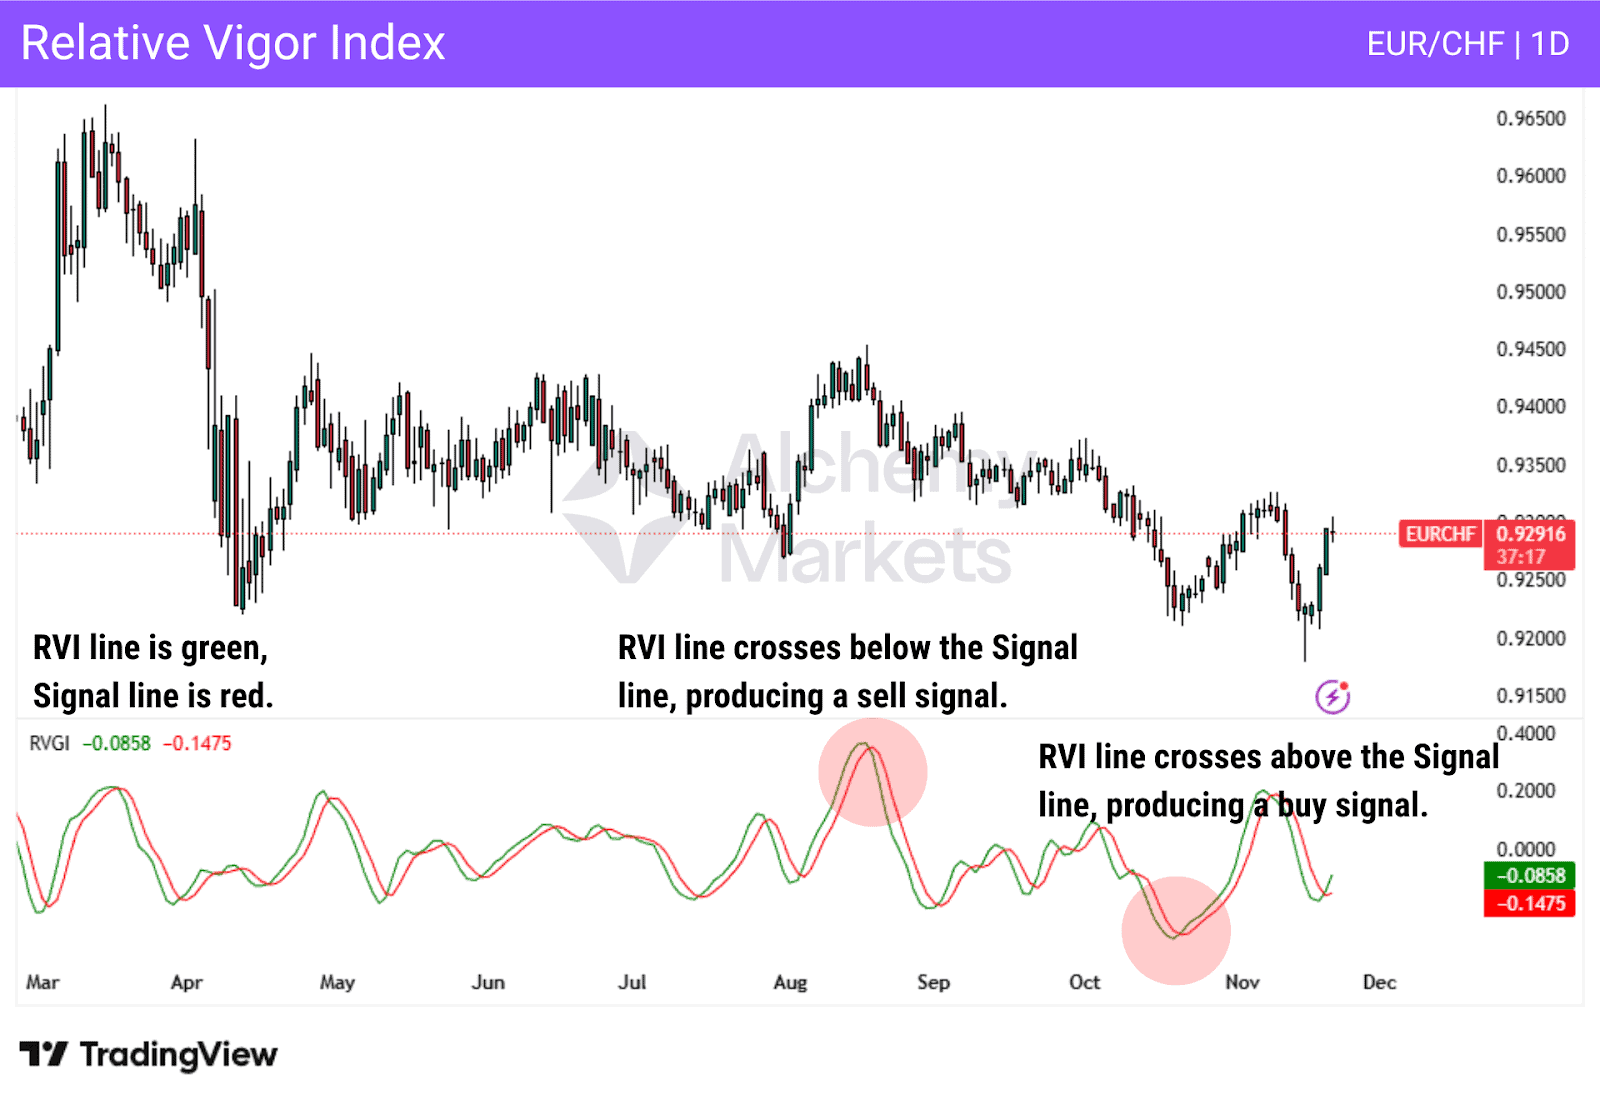
The Relative Vigor Index (RVI) measures momentum by comparing where price closes relative to its trading range.
The core assumption behind RVI is simple: in healthy uptrends, price tends to close near the high of each candle, while in downtrends, price tends to close near the low. RVI quantifies this behaviour and smooths it using moving averages to reduce noise.
The indicator consists of an RVI line and a signal line. When the RVI crosses above the signal line, bullish momentum is increasing. A cross below signals growing bearish momentum.
RVI is also effective for spotting divergence. If price makes a new high or low but RVI fails to confirm it, momentum may be weakening and trend exhaustion could follow. The indicator works best as a confirmation tool alongside structure or trend filters rather than as a standalone signal.
Stochastic RSI
Type: Momentum
| Best Used For |
| Identifying rapid momentum shifts and short-term overbought or oversold conditions |
| Best Trading Time Frames |
| Most effective on lower timeframes, commonly 1-hour or below |
| Indicator Complexity |
| Beginner |
How Stochastic RSI works:
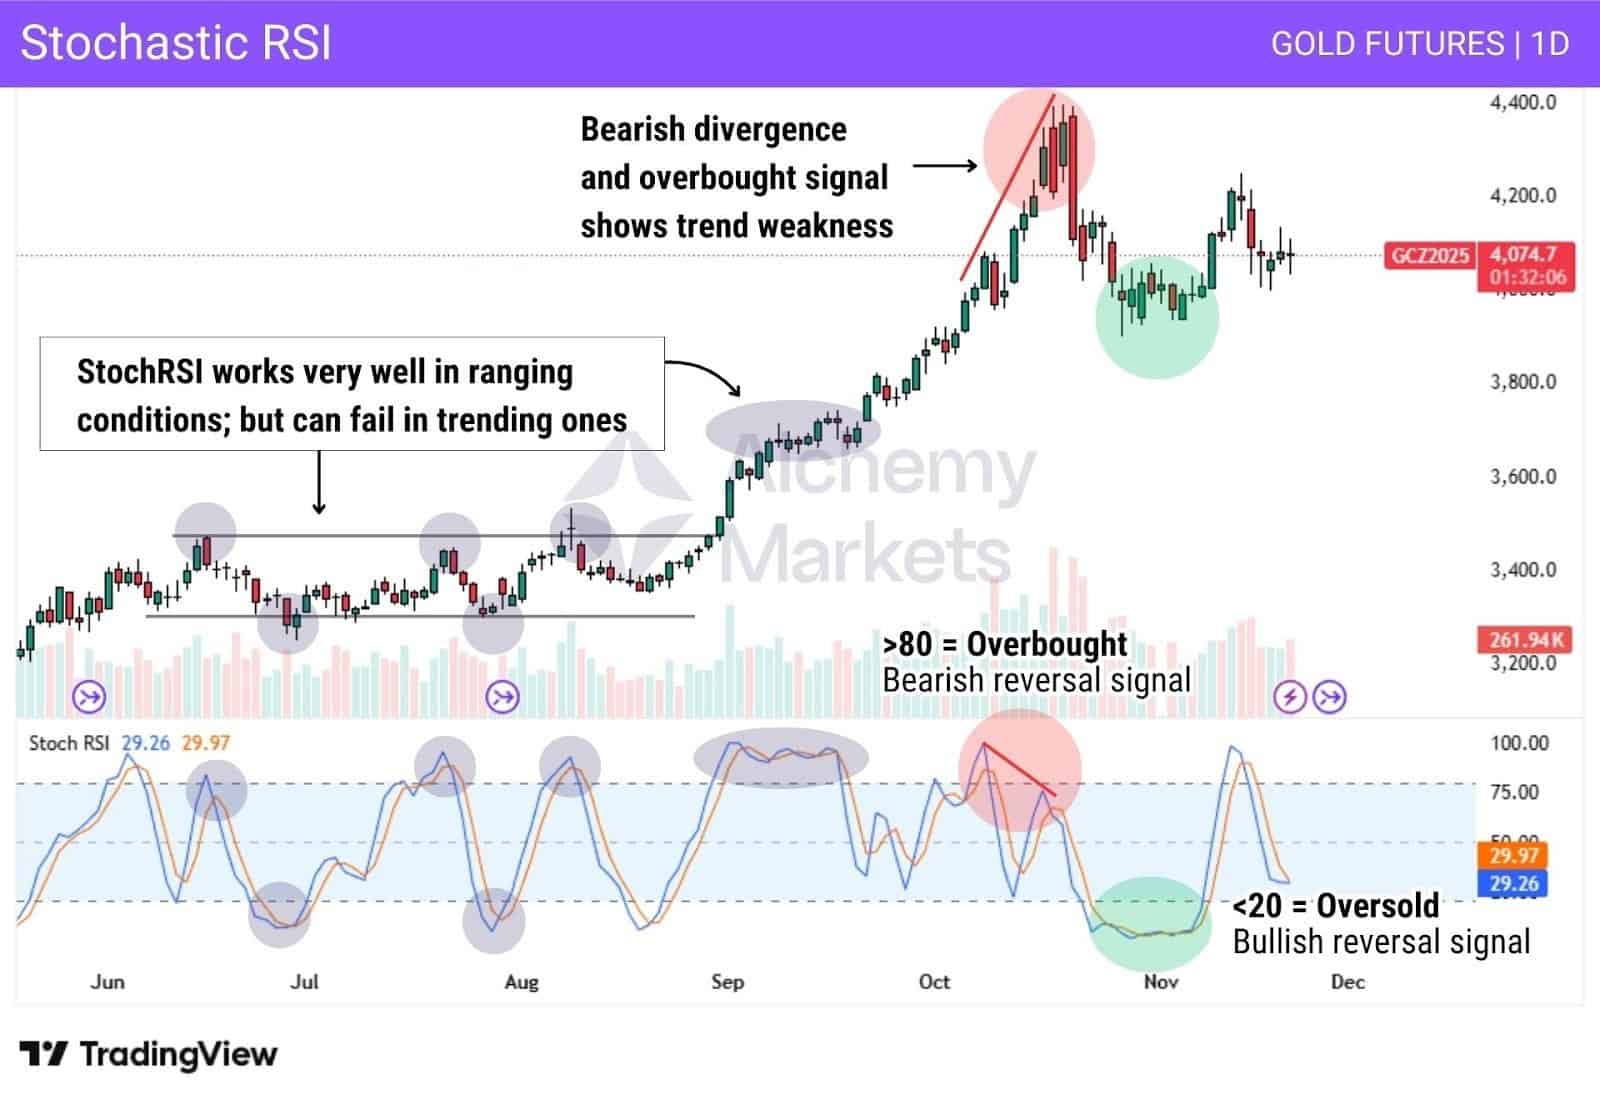
The Stochastic RSI measures where the current RSI value sits relative to its recent range, making it far more sensitive than standard RSI.
Readings above 0.8 suggest strong bullish momentum, while readings below 0.2 indicate strong bearish momentum. Because of its sensitivity, Stochastic RSI can generate frequent signals.
The indicator performs best in range-bound markets or when used to time entries within a broader trend. Without context, it is prone to false signals in volatile conditions.
Average True Range
Type: Momentum
| Best Used For |
| Measuring volatility and setting stops or targets |
| Best Trading Time Frames |
| Works across all timeframes, commonly used on daily charts |
| Indicator Complexity |
| Beginner |
How Average True Range Works:
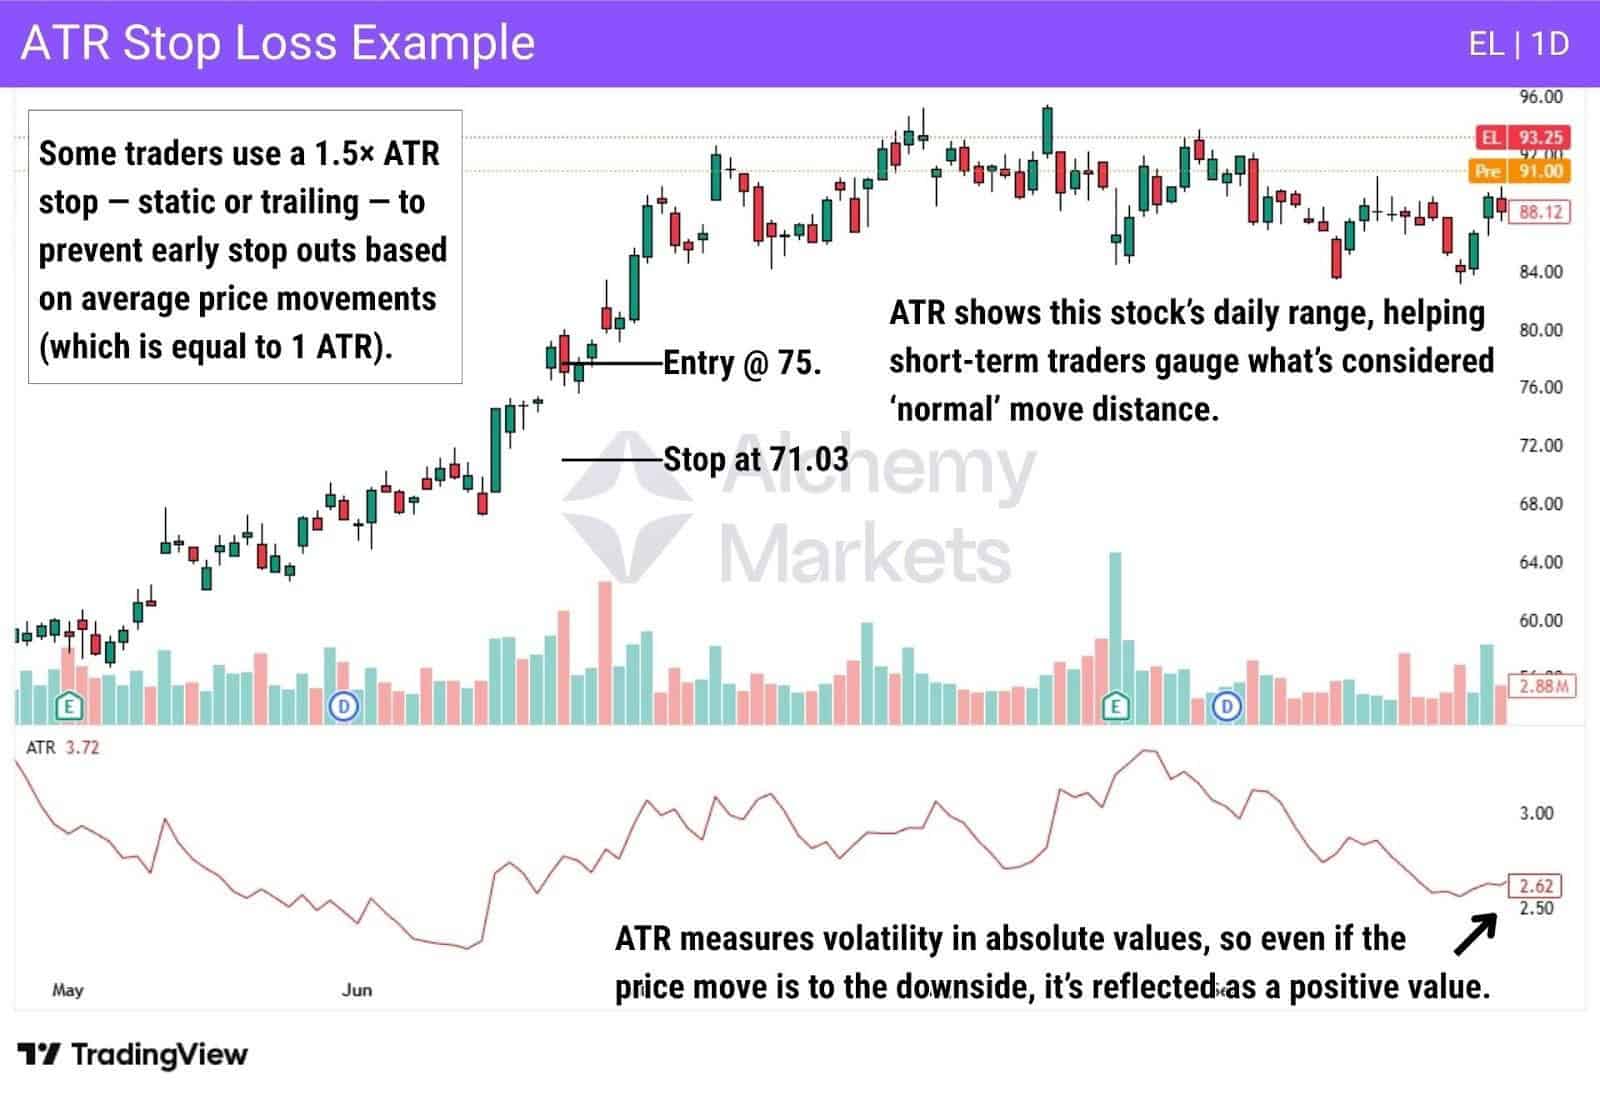
Average True Range (ATR) measures how much an asset typically moves over a given period, usually 14 candles.
ATR does not indicate direction. Instead, it shows the expected range of movement, helping traders understand whether current price behaviour is normal or extreme.
Traders commonly use ATR to size stop losses, trail stops, or estimate realistic profit targets. Higher ATR readings indicate increased volatility, while lower readings suggest compressed market conditions.
Best Volume Indicators
On-Balance Volume Indicator
Type: Volume indicator
| Best Used For |
| Determining trend strength and divergence |
| Best Trading Time Frames |
| Works across all timeframes |
| Indicator Complexity |
| Beginner |
How On-Balance Volume Works:
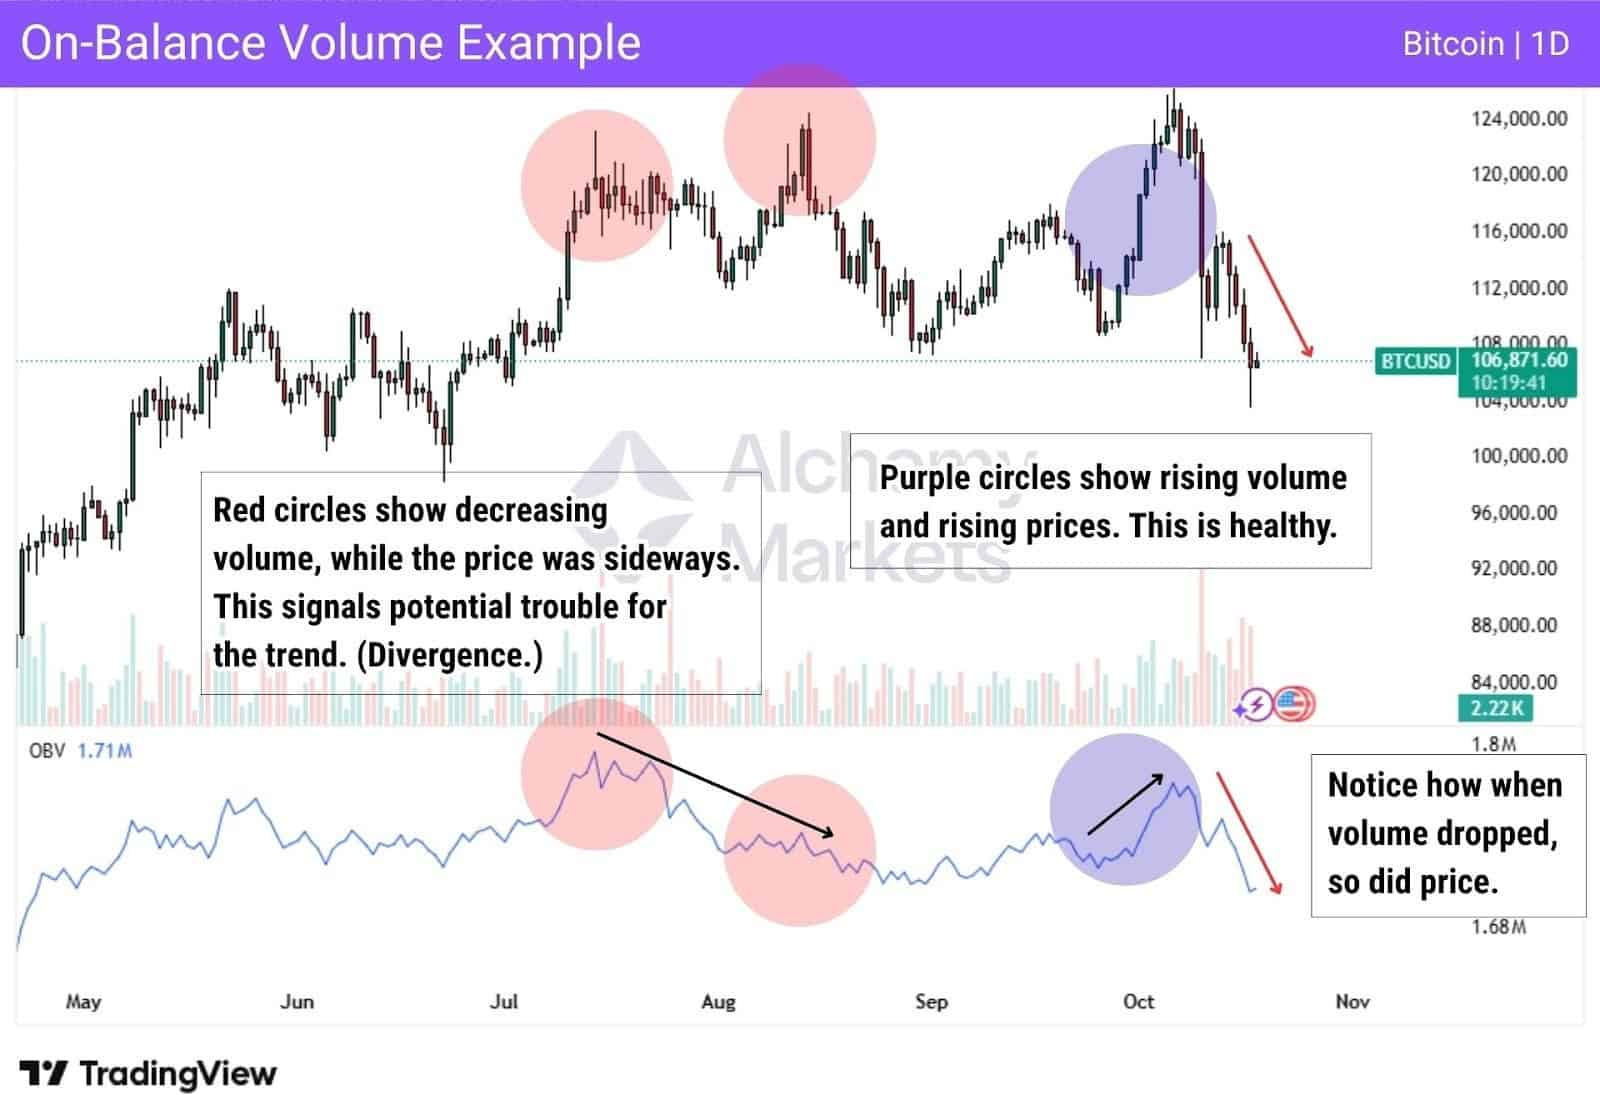
On-Balance Volume (OBV) links volume flow to price direction to assess whether a trend is being supported by participation.
When price closes higher, volume is added to the OBV line. When price closes lower, volume is subtracted. The direction of the OBV line reflects whether buyers or sellers are exerting more influence:
- If both price and OBV are rising, the uptrend is considered healthy.
- If both are falling, selling pressure is dominant.
OBV is most valuable when divergence appears. If price makes a higher high while OBV fails to confirm it, buying pressure is weakening. This often precedes a pullback or reversal, but timing is not guaranteed.
OBV works best as a confirmation tool rather than a standalone signal.
Accumulation/Distribution Line
Type: Volume indicator
| Best Used For |
| Identifying buying and selling pressure and spotting divergence |
| Best Trading Time Frames |
| Daily and intraday |
| Indicator Complexity |
| Intermediate |
How the Accumulation/Distribution Line Works:
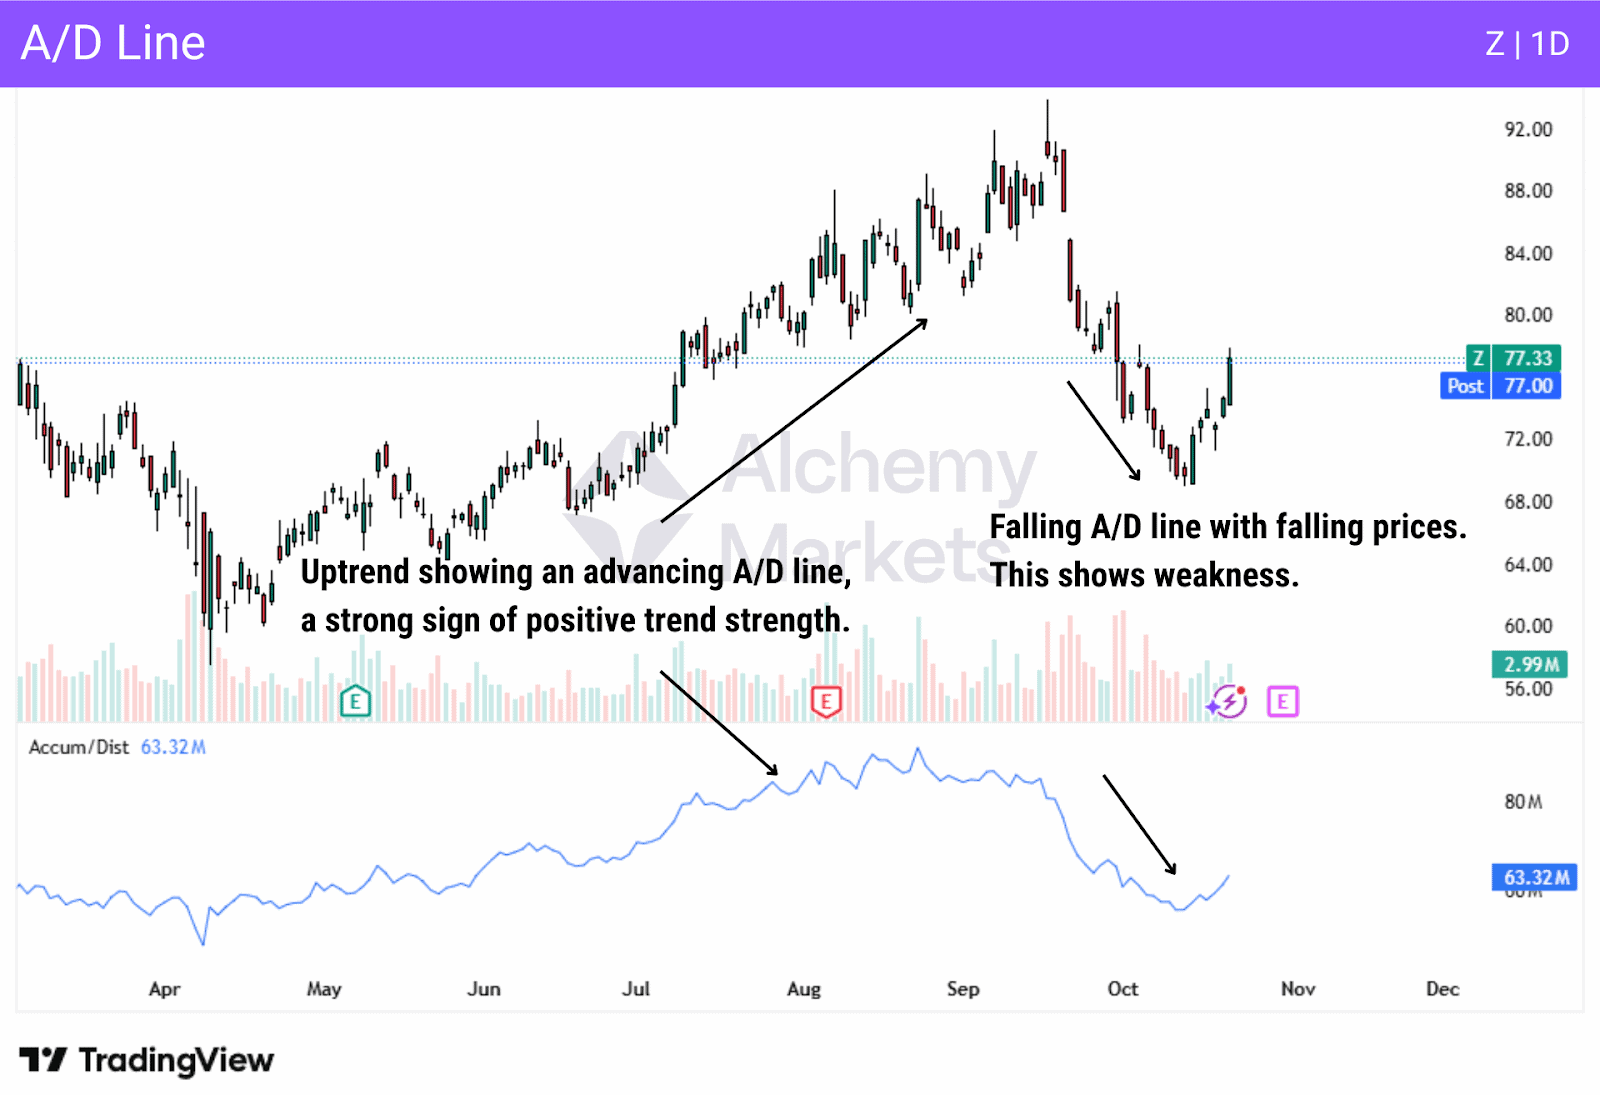
The Accumulation/Distribution (A/D) line compares price movement and volume to determine whether an asset is being accumulated or distributed.
Unlike OBV, the A/D line places greater emphasis on where price closes within its daily range. A close near the high suggests accumulation, while a close near the low suggests distribution.
When price is rising and the A/D line is also rising, buying pressure supports the move. When price rises but the A/D line falls, this divergence signals underlying weakness. The opposite applies during downtrends.
The A/D line is particularly effective for identifying hidden shifts in market conviction before they become obvious on price alone.
Volume-weighted average price (VWAP)
Type: Volume indicator
| Best Used For |
| Assessing intraday trend bias and identifying fair value |
| Best Trading Time Frames |
| Intraday trading |
| Indicator Complexity |
| Intermediate |
How VWAP Works:
VWAP (Volume-Weighted Average Price) calculates the average price of an asset, weighted by volume, over a single trading session.
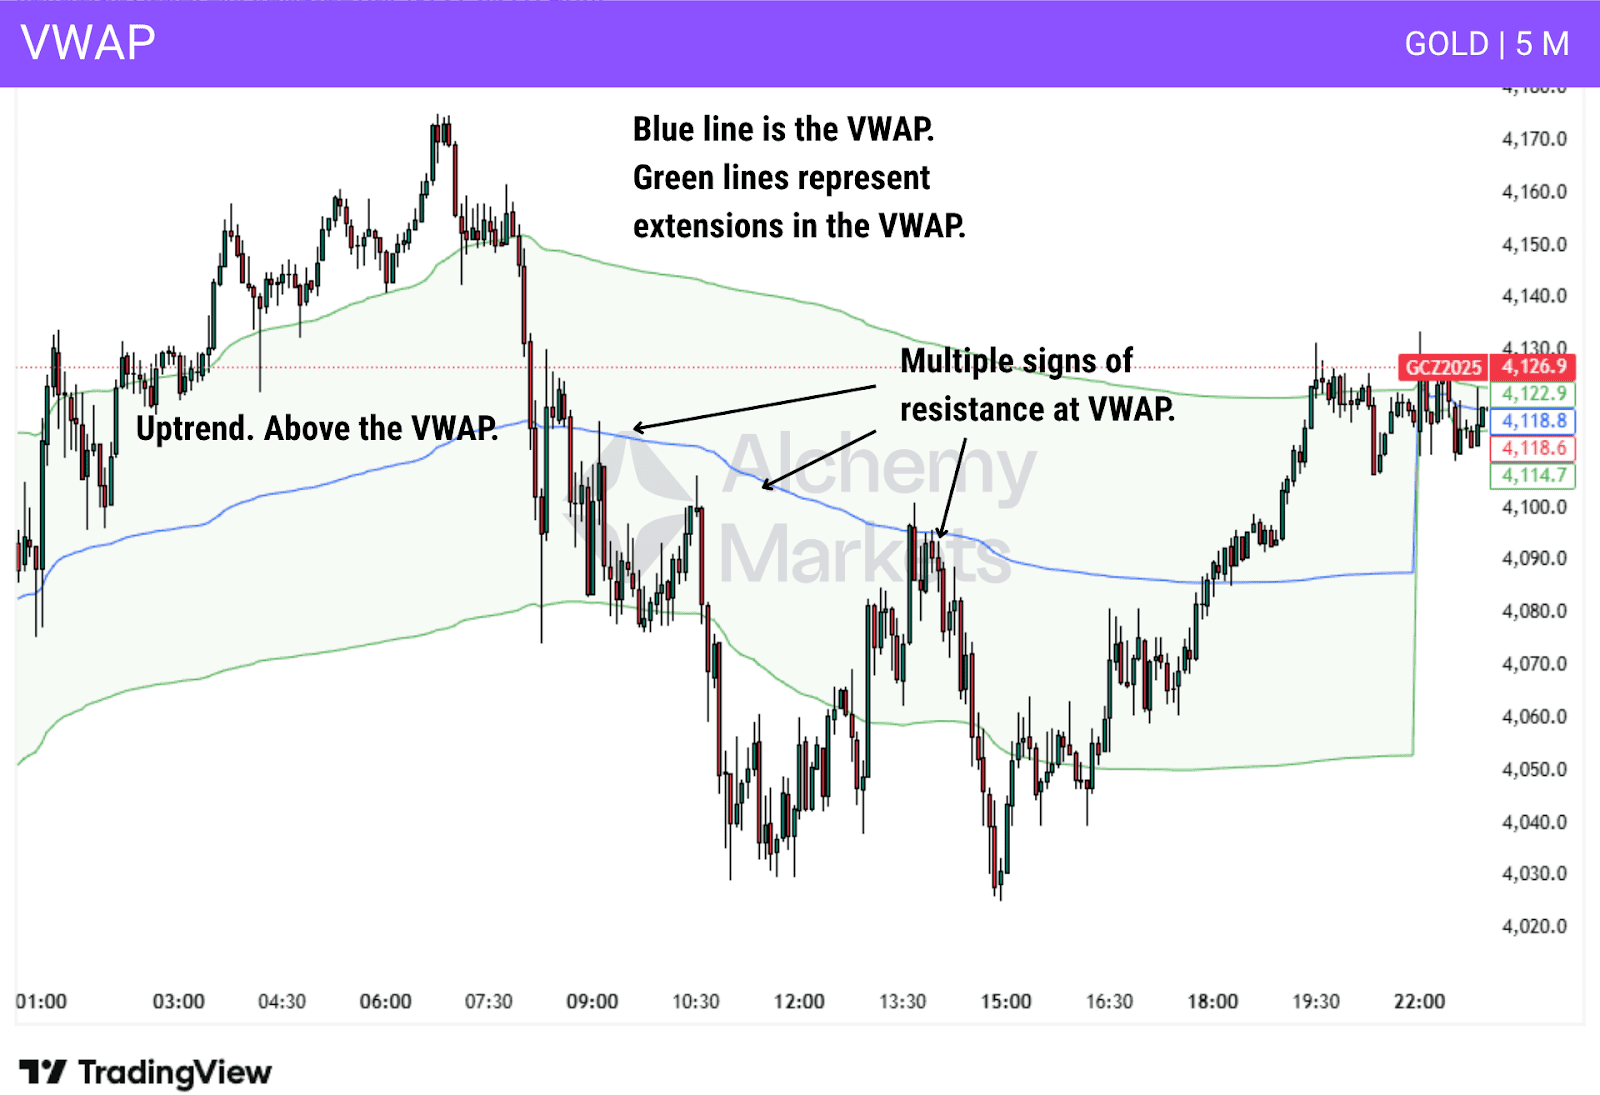
Price trading above VWAP suggests buyers are in control, while price below VWAP suggests selling pressure dominates. Because volume is central to the calculation, VWAP reflects where the majority of trading activity has occurred.
VWAP often acts as dynamic support or resistance during the session. It is widely used in futures and equities, but less effective in decentralised markets such as Forex.
Aside from the regular vWAP, traders can opt for the anchored vWAP tool to pin a vWAP to a starting point, then calculate the volume-weighted average price from there onwards.
Advantages of Technical Indicators
Technical indicators are popular for a reason, and they’re not just limited to beginners, but also advanced traders and even institutional traders who operate on an algorithmic level. Here are the advantages they offer…
Advantage 1: Objective decision-making
Indicators remove emotion from trading decisions. Instead of reacting to fear or hesitation, traders can rely on clearly defined trading signals, levels, and conditions to guide entries, exits, and trade management.
Advantage 2: Market context and confirmation
Beyond objectivity, technical indicators help traders understand how the market is behaving. Trend indicators clarify direction, momentum tools reveal strength or exhaustion. This added context can help improve a trader’s edge in the market over time.
Advantage 3: Versatility across markets and timeframes
Most technical indicators work across stocks, forex, crypto, and commodities, and can be applied on nearly any timeframe. The key takeaway, however, is flexibility. Indicators can be customised and tuned to suit the asset and timeframe you’re trading.
Disadvantages of Technical Indicators
Technical indicators are powerful tools, but they are not perfect. Understanding their limitations is just as important as understanding how to use them. Here are the main disadvantages traders should be aware of…
Disadvantage 1: Lagging behaviour
Many indicators react to price after a move has already occurred. This means entries and exits can be delayed, especially during fast market moves, reducing potential reward if not managed carefully.
Disadvantage 2: False signals in certain market conditions
Indicators can perform poorly in sideways or low-volatility markets. Trend indicators may whipsaw, while momentum indicators can give misleading overbought or oversold signals that fail to result in meaningful reversals.
Disadvantage 3: Over-reliance on indicators
Relying too heavily on indicators can lead traders to ignore price structure and market context. Indicators interpret past data, not future price, and without proper risk management and discretion, they can create a false sense of confidence.
FAQ
Are Technical Analysis Indicators Reliable?
Technical analysis indicators are reliable when used for confirmation rather than prediction. They help traders interpret trend, momentum, and volatility, but no indicator works in isolation. Context, structure, and risk management determine their effectiveness.
What Technical Indicator should I learn first?
Beginners should start with simple indicators like Moving Averages, RSI, and basic Volume tools. These teach core concepts such as trend direction and momentum without unnecessary complexity. They also form a solid foundation for more advanced analysis later on.
Which Technical Indicator Can Best Spot Overbought and Oversold Conditions?
Momentum oscillators are best suited for identifying overbought and oversold conditions. RSI, Stochastic Oscillator, Williams %R, and Stochastic RSI are commonly used for this purpose. They work best in ranging or slowing markets.
What are the best technical analysis indicators for day traders?
Day traders commonly use VWAP, Moving Averages, RSI or Stochastic RSI, and Volume-based tools. These indicators respond well to intraday price movement and liquidity. They help define bias, timing, and short-term structure.
What are the best forex trading indicators?
Forex traders often rely on Moving Averages, RSI, MACD, ATR, and SuperTrend. Because forex markets are decentralised, volume indicators are generally less reliable. Price-based and volatility tools tend to perform better.
What are the best Crypto trading indicators?
Crypto traders frequently use Moving Averages, RSI, Stochastic RSI, Bollinger Bands, ATR, and Volume indicators. High volatility makes confirmation and risk management essential. Indicators should be adapted to each asset’s behaviour.
What are the best Stock trading indicators?
Stock traders commonly use Moving Averages, VWAP, RSI, MACD, and volume-based indicators like OBV. Centralised volume data improves the reliability of volume analysis. These tools help confirm trend strength and participation.


