


Written by:

Reviewed by:

- February 5, 2025
- 24 min read
Ichimoku Cloud – How to Trade It
What Is the Ichimoku Cloud?
The Ichimoku Cloud indicator, also known as ichimoku kinko hyo, is a sophisticated and highly effective technical indicator that is used primarily for trend identification. Originating in Japan, its name—translated as “one glance cloud”—reflects its ability to provide a comprehensive snapshot of market dynamics.
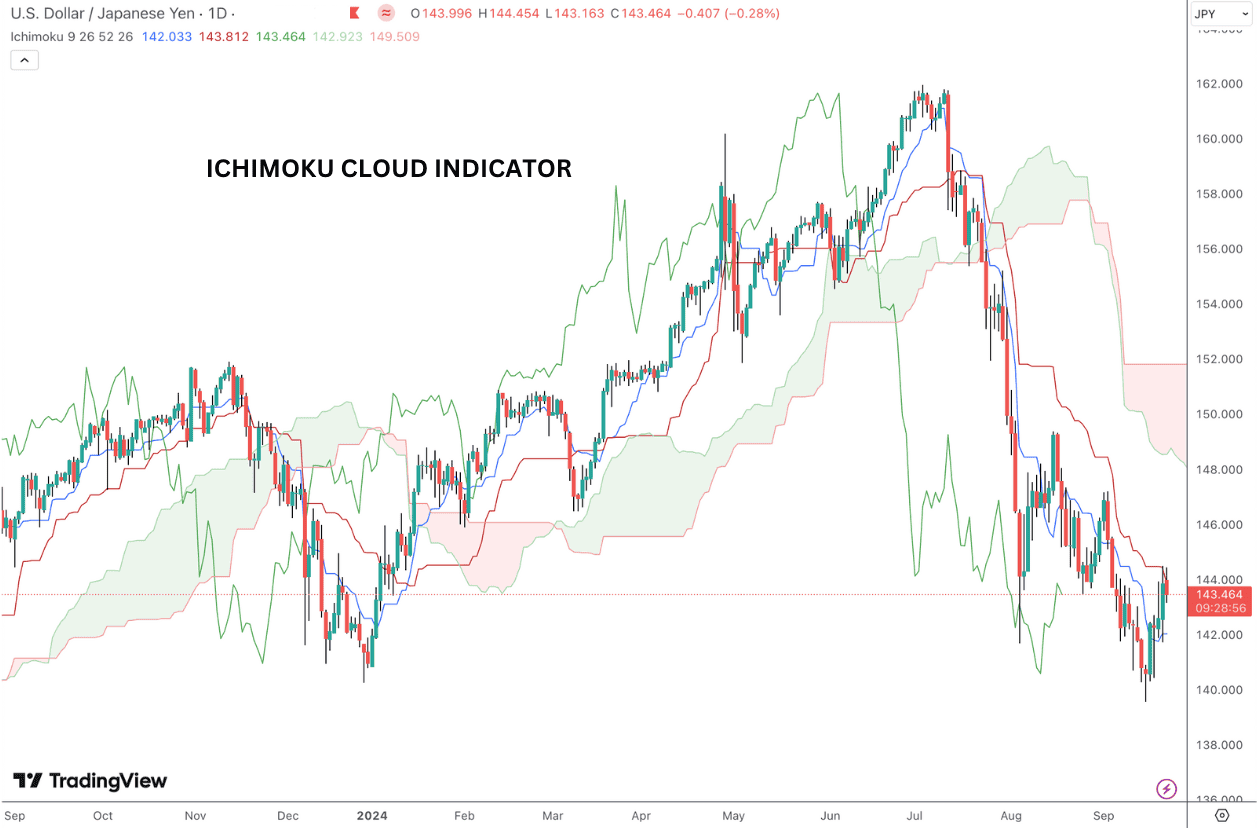
Comprising five distinct components, the Ichimoku cloud elegantly synthesizes price action, support and resistance levels, and momentum into a single, cohesive framework. Given its versatile nature, the Ichimoku cloud indicator can be used across asset classes and on all time frames, making it a popular trading tool for retail traders and professional traders alike.
What Are the Components of the Ichimoku Cloud
At its core, the indicator uses the measurement of and difference between a series of moving averages to provide chart information. The Ichimoku cloud system features the Senkou Span A and B, which form the “cloud” itself, highlighting areas of potential support or resistance.
The Tenkan-sen and Kijun-sen, moving averages of varying lengths, offer insights into short- and medium-term price trends. Finally, the Chikou Span provides a crucial lagging perspective, enabling traders to assess the current price in relation to historical performance.
Here are the five components of Ichimoku:
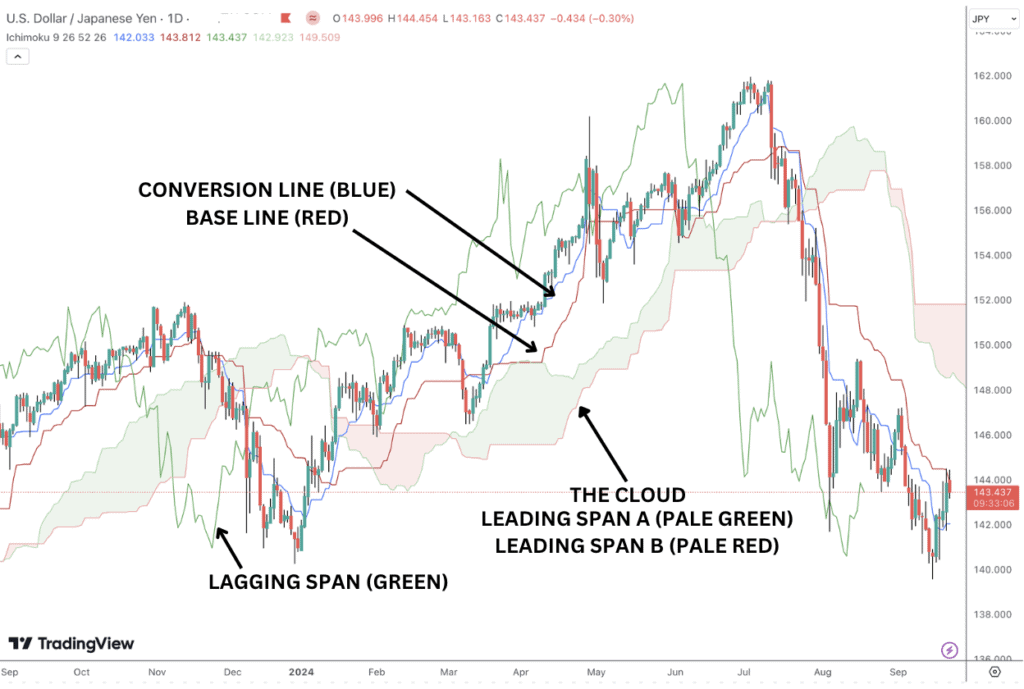
Tenkan-sen (Conversion Line)
The Conversion Line, typically plotted as a blue line, marks the midpoint of the relative asset’s high-low range over the last nine trading periods. On a daily chart, therefore, the Conversion Line marks the midpoint of the last nine days’ trading. On the hourly chart, it marks the midpoint of the last nine hours’ trading. If the price is above the conversion line, then the near-term trend is viewed as bullish.
Kijun-sen (Base Line)
The Base Line, typically plotted as a red line, marks the midpoint of the relative asset’s high-low range over the last 26 trading periods. The base line is viewed as an intermediate trend indicator based on its location relative to the price.
Senkou Span A (Leading Span A)
Senkou Span A is the average of the Tenkan-sen and Kijun-sen, measured over the last 26 periods and projected 26 periods ahead.
Senkou Span B (Leading Span B)
Senkou Span B or leading span B as it’s known in English, marks the midpoint of the relative asset’s high-low over the last 52 periods, projected 26 periods ahead.
Ichimoku Cloud
The shaded area between Leading Span A and leading span B is noted as the Ichimoku Cloud. It serves as a price zone of support and resistance for longer-term trend identification.
Chikou Span
The lagging line (in its English translation) plots the current market price 26 periods behind to show the relationship between the current price and its historical performance. When looking back and if the lagging line is above the price from 26 periods ago, then it shows current prices are trending higher.
| Japanese Name | English Name | Formula |
| Tenkan-sen | Conversion Line | (Highest High + Lowest Low)/2 for past 9 periods |
| Kijun-sen | Base Line | (Highest High + Lowest Low)/2 for past 26 periods |
| Senkou Span A | Leading Span A | (Tenkan-sen + Kijun-sen)/2 shifted forward 26 periods |
| Senkou Span B | Leading Span B | (Highest High + Lowest Low)/2 for past 52 periods; shifted forward 26 periods |
| Chikou Span | Lagging Line | Current Closing Price shifted backward 26 periods |
Why is the Ichimoku Cloud Important in Technical Analysis?
Rather than relying solely on past price movements, the Ichimoku cloud integrates multiple time frames, offering a nuanced view of market sentiment and making it extremely useful in identifying trading signals.
Traders often appreciate its ability to signal potential reversals and continuations with a clarity that ranks it above more traditional indicators through an artful blend of analysis and intuition. The indicator can essentially be thought of as a one look equilibrium chart for establishing whether price is bullish or bearish and identifying support and resistance levels.
How To Use The Ichimoku Cloud Indicator
Bullish Indicator
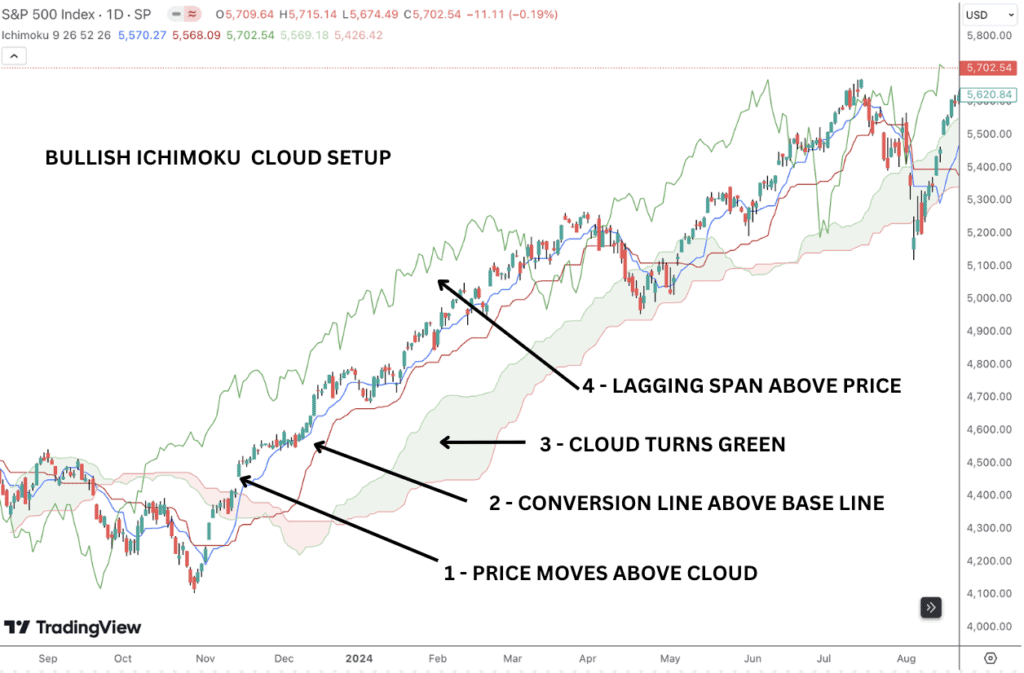
Key aspects of a bullish Ichimoku cloud chart setup are:
- Price Position: A closing price above the cloud signals a bullish trend and can be used as a buy signal.
- Tenkan-sen and Kijun-sen Crossover: A bullish signal occurs when the Tenkan-sen (conversion line) crosses above the Kijun-sen (base line), indicating a shift in short-term strength.
- Green Cloud Color: The cloud should turn green, a condition met when Senkou Span A is above Senkou Span B, reinforcing the bullish outlook.
- Chikou Span Confirmation: The Chikou Span (lagging line) must also be positioned above the current price, confirming that recent price movements support the overall bullish sentiment.
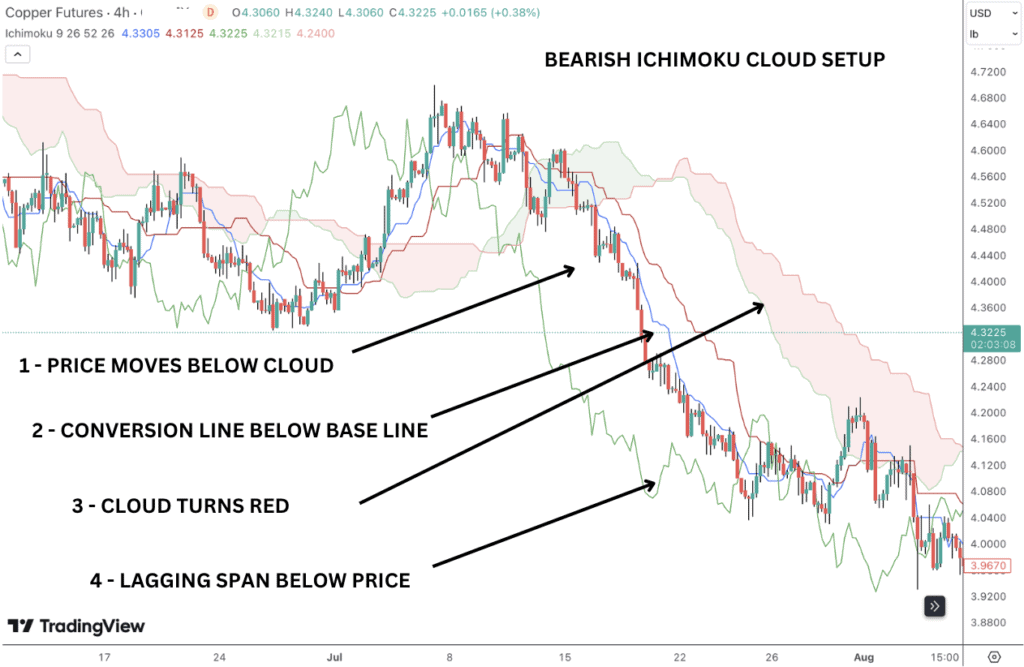
Bearish Indicator
Key aspects of a bearish Ichimoku cloud chart setup are:
- Price Position: A closing price beneath the cloud signals a bearish trend and can be used as a sell signal.
- Tenkan-sen and Kijun-sen Crossover: A bearish signal occurs when the Tenkan-sen (conversion line) crosses below the Kijun-sen (base line), suggesting a shift in short-term weakness.
- Red Cloud Color: The cloud should turn red, a condition met when Senkou Span B is above Senkou Span A, reinforcing the bearish sentiment.
- Chikou Span Confirmation: The Chikou Span (lagging line) must also be situated below the current price, confirming that recent price movements support the overall bearish trend.
How to Calculate The Ichimoku Cloud
As we’ve explored, there are several components to the Ichimoku cloud indicator, making it a very sophisticated and complex chart indicator to plot by hand. Thankfully, your trading platform will automatically calculate and plot the Ichimoku cloud system on your charts for you so you don’t need to calculate by hand.
However, for the ambitious, here are some steps to follow to make the calculations.
- Calculate the Conversion Line and the Base Line. A quick way of calculating them is by adding the Donchian Channels to your chart and activate only the mid-line for 9 periods (Conversion Line) and 26 periods (Base Line).
- Calculate the Leading Span A as an average between the Conversion Line and Base Line. Project this 26 periods into the future.
- Calculate the Leading Span B. A simple way to do so is add the Donchian Channels to your chart with a 52 period setting, but change the shift from 0 to +25. Activate only the mid-line and this will project mid point of the past 52 periods 26 periods into the future.
- The difference between Leading Span A and Leading Span B is the cloud. When Leading Span A is above the cloud, the cloud is colored green. When the Leading Span B is below the cloud, the cloud is colored red.
- The lagging line is simply the current price shifted 26 periods into the past by changing the shift period to -26.
Ichimoku Cloud Formula
If you’re interested in understanding the math behind the Ichimoku cloud, here is the formula used to calculate the the data points the indicator offers:
Conversion Line (Tenkan Sen) = (9-Period High+9-Period Low) / 2
Base Line (Kijun Sen) = (26-Period High+26-Period Low) / 2
Leading Span A (Senkou Span A) = (Conversion Line + Base Line) / 2
Leading Span B (Senkou Span B) = (52-Period High + 52-Period Low) / 2
Lagging Span (Chikou Span) = Current closing price plotted 26 periods in the past
What Does the Ichimoku Cloud Tell You?
The Ichimoku cloud tells traders a great deal about the trends and momentum of the asset from just a quick glance. Primarily, the Kumo cloud tells traders what the current market trend is and where the key support and resistance levels are located.
At a quick glance, traders know that the trend is bullish if price is above the cloud and bearish if price is below the cloud. Additionally, the shaded region of the cloud will mark areas of support (when prices are above the cloud) and areas of resistance (when prices are below the cloud).
For example, there is a red cloud when the Leading Span A is below Leading Span B. Conversely, there is a green cloud when the Leading Span A is above the Leading Span B.
This information on trend direction and support and resistance makes the indicator equally as useful for trade management as it is for trade execution. Consequently, the Ichimoku chart setup can be employed by itself or in combination with other technical indicators.
Ichimoku Cloud Example
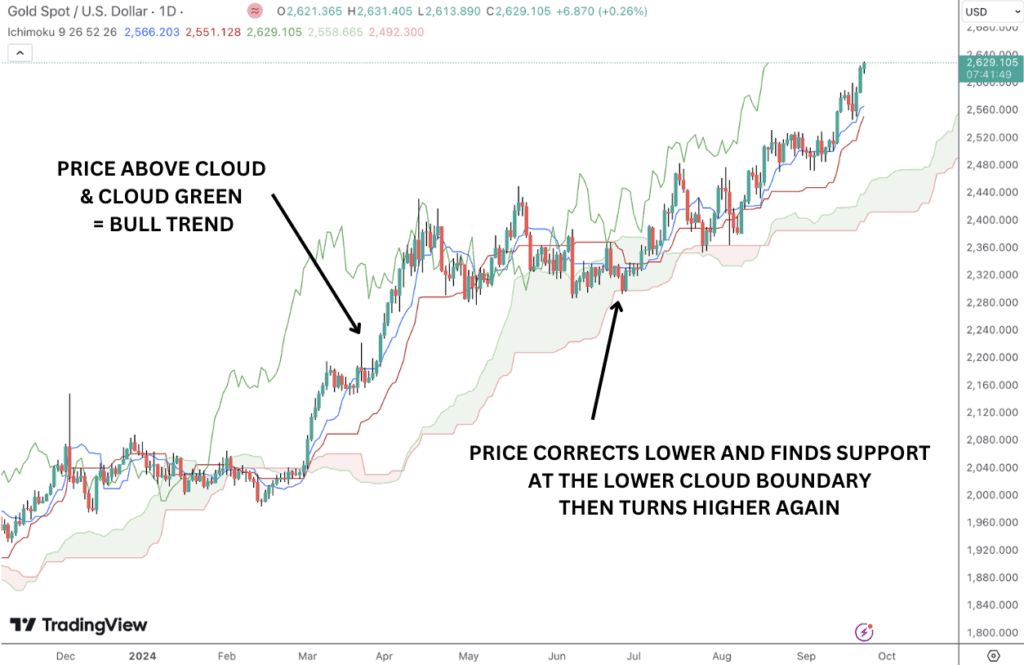
In the above example for gold, a bullish trend is in progress when the price is above the cloud and the Kumo cloud is colored green. Price then corrects lower within the bull trend breaking into the cloud and testing the lower cloud boundary level which is acting as support. From the lower boundary level of the cloud, the bull trend resumes and price breaks higher.
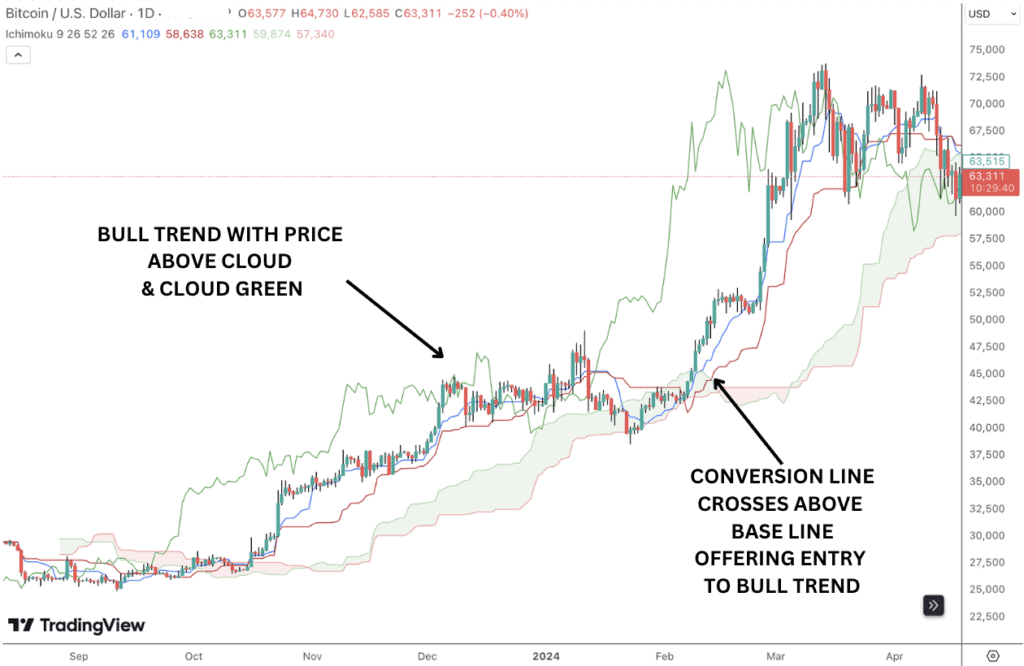
In the above example for bitcoin, we have a bull trend where price is moving above the Kumo cloud and the cloud is green. During a counter-trend correction, the Conversion Line crosses below the Base Line, possibly indicating a trend reversal.
However, the price doesn’t fully break below the Kumo cloud suggesting that bears could not overcome the bulls. As the price starts moving higher again, we see the Conversion Line cross back above the Base Line, offering a strong bullish signal.
The lagging line remained above the cloud the whole time suggesting the trend remained firmly planted to the upside.
Ichimoku Cloud Trading Strategy
The multi-faceted nature of the Ichimoku cloud indicator means that there are a variety of trading strategies that can be deployed using the information within the Ichimoku chart.
We have already established one trading signal above, as we compare the location of price relative to the cloud. The trend is considered bullish when the price is above the cloud and bearish when the price is below the cloud.
Now let’s look at some further trading strategies using the Senkou span A and B lines.
Leading Span A Line
If price action is above the cloud, then we have a bull trend in action. This filters trades so that the leading span A line can be used for buying opportunities. One method is to look for a situation where price pulls back towards the leading span A line after being above the Kumo cloud.
The line can then be used as a support level to buy, anticipating a resumption of the uptrend. Instead of simply just buying as price touches the line, traders can look for extra confirmation, waiting until price breaks above the highs of the candle which touched the cloud. The stop loss is then positioned below the cloud at the point where that candle first touched the cloud.
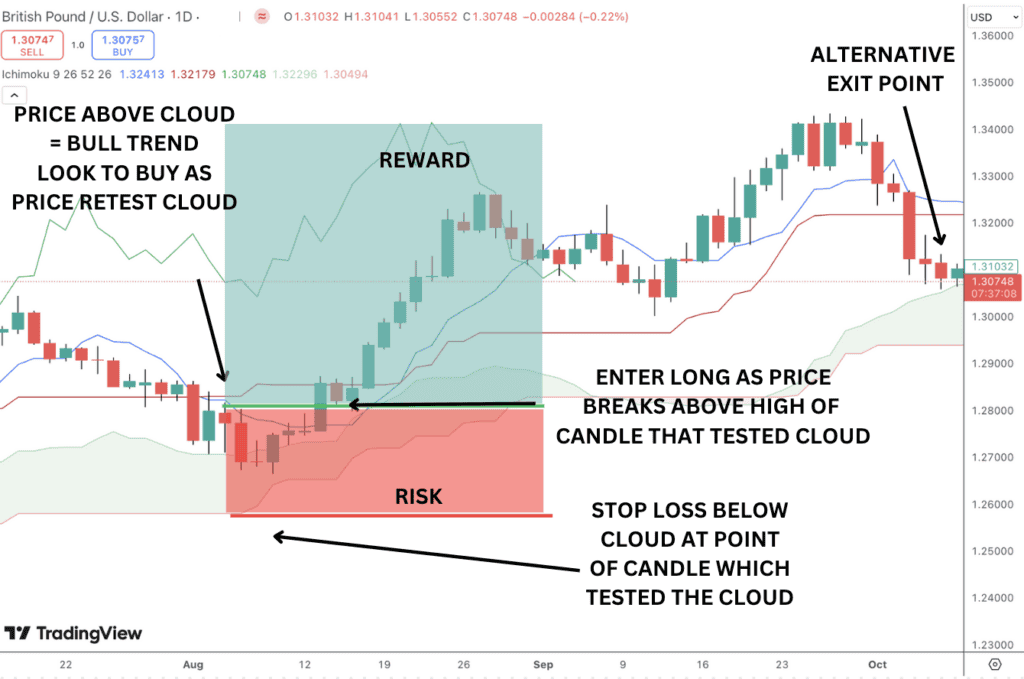
For taking profit, traders can aim for a minimum of 3x their trade risk. This means if your stop loss was 100 pips away, then set a target for 300 pips.
Alternatively, traders can hold their position until the market touches the Kumo cloud again in hopes the market and the rally would carry significantly higher. Naturally, the alternate method would utilize a dynamic trailing stop based on the position of the leading span A.
Leading Span B Line
Similar to the strategy discussed above, we can use the leading span B line in conjunction with the Kumo cloud to identify trading signals.
In a bearish trend (when the price is below the cloud), watch for a situation when the price rebounds higher toward the Senkou Span B line, but remains below the cloud. Traders can use the line as resistance to trigger a sell signal and enter a short position.
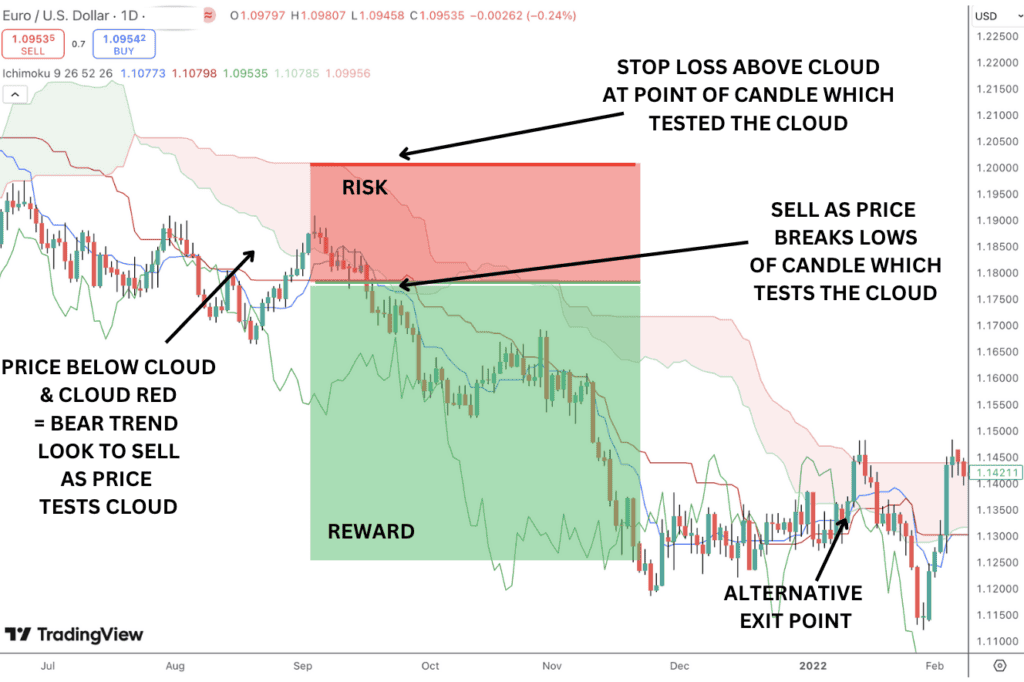
As with the leading span A strategy, traders can look for extra confirmation by waiting for price to break below the low of the candle which tested the Kumo cloud. The stop loss is positioned above the cloud at the highest point of the candle testing the cloud.
Profit target is then 3x risk, or waiting for price to test the cloud again, as shown below.
How To Spot Resistance and Support
To spot dynamic and hidden levels of support and resistance, traders should focus on the following key components of the Ichimoku indicator.
- The Kumo Cloud:
- Above the Cloud: If price is above the Kumo cloud, the upper boundary (Leading Span A) serves as support. The lower boundary (Leading Span B) provides a deeper level of support.
- Below the Cloud: If price is below the Kumo cloud, the lower boundary (Leading Span B) acts as resistance, and the upper boundary (Leading Span A) offers a stronger resistance level.
- Base Line:
- The Base Line, which tracks the midpoint of the highest and lowest prices over a set period, can act as dynamic support or resistance.
- Conversion Line:
- The Conversion Line can also act as minor support or resistance in shorter time frames.
Using Volume as a Signal with Ichimoku Cloud
However, one further chart element which can be combined with Ichimoku kinko hyo charts to add extra confirmation for taking trading signals is volume.
An example of how volume can be used to confirm buy or sell signals is as follows. If price is above the cloud boundaries and therefore we know the trend direction is bullish, we can watch for price to correct lower and test the cloud boundaries, expecting them to hold as a support level.
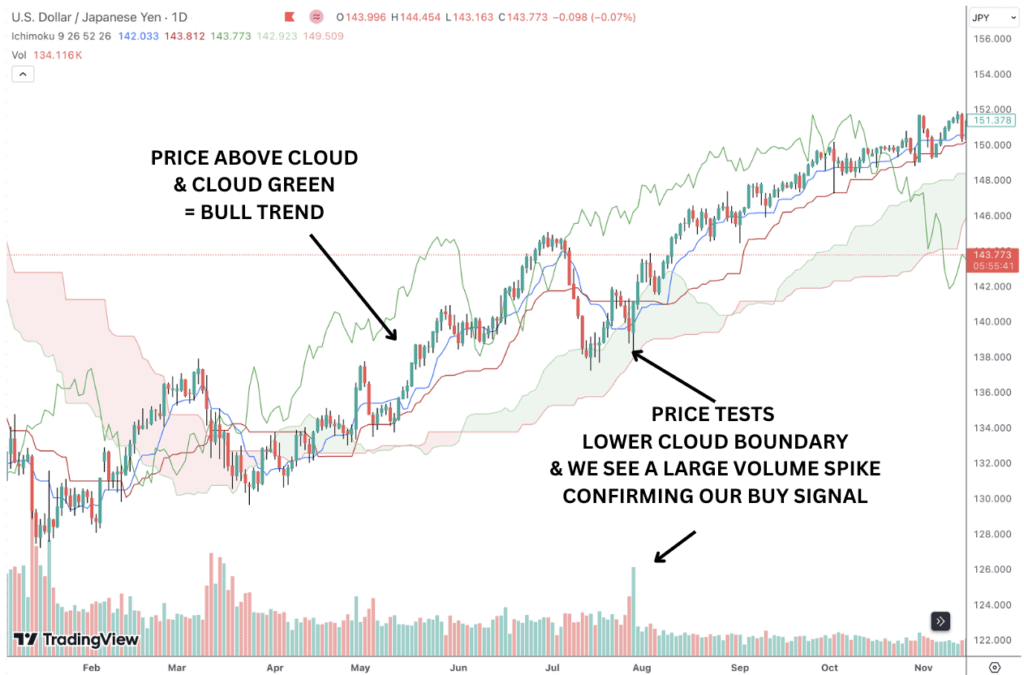
We can then monitor the volume indicator to look for a spike in volume as price tests the leading span A line (upper Kumo cloud boundary level) or leading span B line (lower Kumo cloud boundary level). If we see a spike in volume this can be used to improve our conviction in taking a buy position at that level.
A volume spike essentially shows an increase in activity at a certain price point. If we already suspect that price will hold the cloud boundary as support, a volume spike is then seen as confirmation of this trade idea. If we don’t get a volume spike, we simply don’t enter a trade. As such, using volume spikes as trade confirmation is a great way of filtering out weaker trade signals and improving your trading with the Ichimoku cloud strategy.
How Can Ichimoku Clouds Help You Identify Trends?
The ‘cloud’ aspect of the Ichimoku kinko hyo indicator is the most useful in helping traders determine the trend. The Kumo cloud is essentially the difference between the Leading Span A and B lines. A green cloud is when the shorter term span A line is above the span B line, turning the Kumo cloud green and indicating bullish market conditions.
A red cloud is when the span A line is below the span B line, turning the Kumo cloud red, indicating bearish market conditions. A thicker Kumo cloud indicates a stronger overall trend and the presence of larger price moves. As such, trend followers tend to pay most attention to the cloud for trade signals.
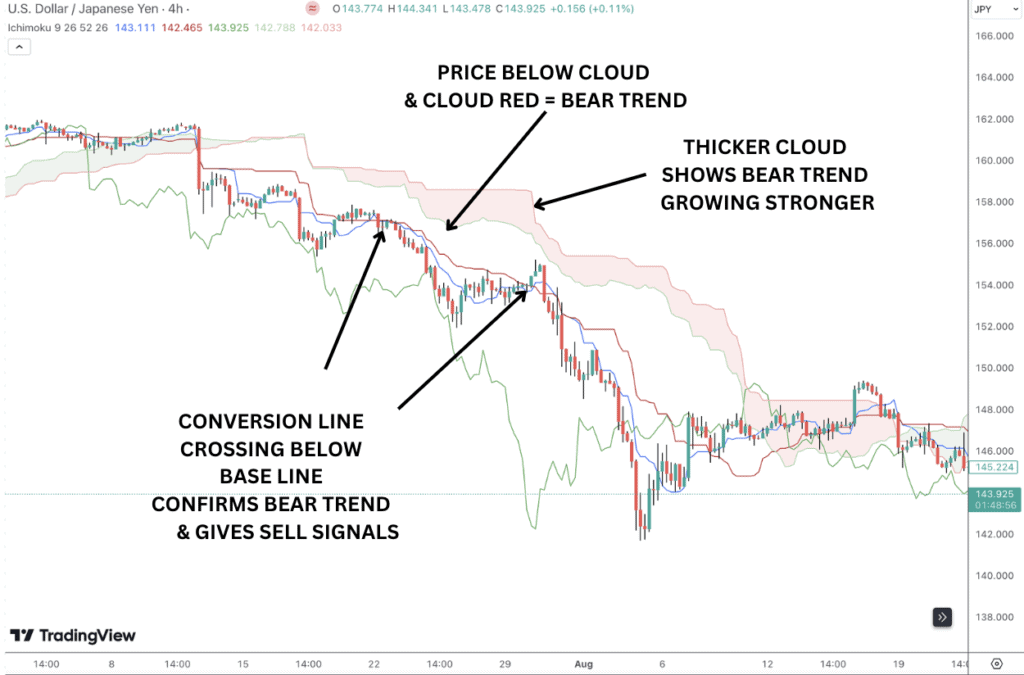
Once a trend has been identified traders can then look to further confirmation from the crossing of the Conversion Line and Base Line. In a bullish trend, when price is above the cloud, the Conversion Line crossing above the Base Line adds additional confirmation of the bull trend and can be used as a buy signal.
In a bearish trend, when price is below the Kumo cloud, the Conversion Line crossing below the Base Line gives additional confirmation of the bear trend and can be used as a sell signal. When taking trades using this system, more aggressive traders tend to enter as price crosses the cloud while more conservative traders will wait for the lines to cross.
Ichimoku Cloud for Day Trading
One very popular trading strategy used by day traders who employ the Ichimoku kinko hyo system is known as the Edge-to-Edge strategy.
In a bullish scenario, traders can enter long positions when price breaks above the cloud, targeting a move toward the Senkou Span A line, the upper resistance barrier of the cloud.
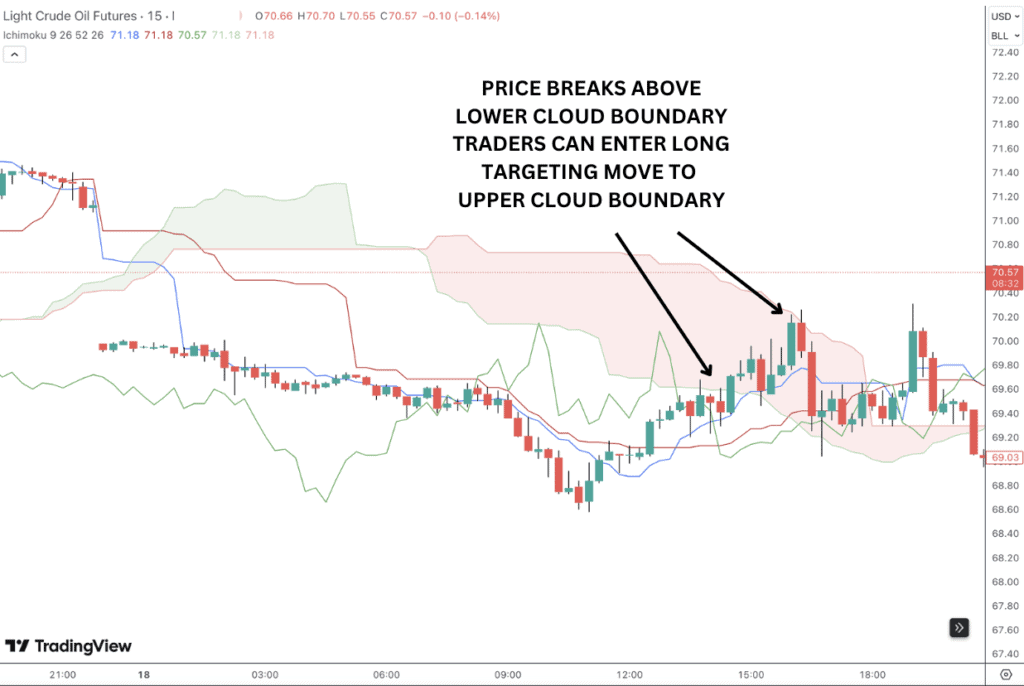
Conversely, in a bearish scenario, traders can use a price decline below the cloud for short opportunities, with the goal of reaching the lower edge, or Senkou Span B. Essentially, the Edge-to-Edge strategy is a counter-trend method targeting a break from one side of the cloud to the other, where the secondary line offers exit points for the trade.
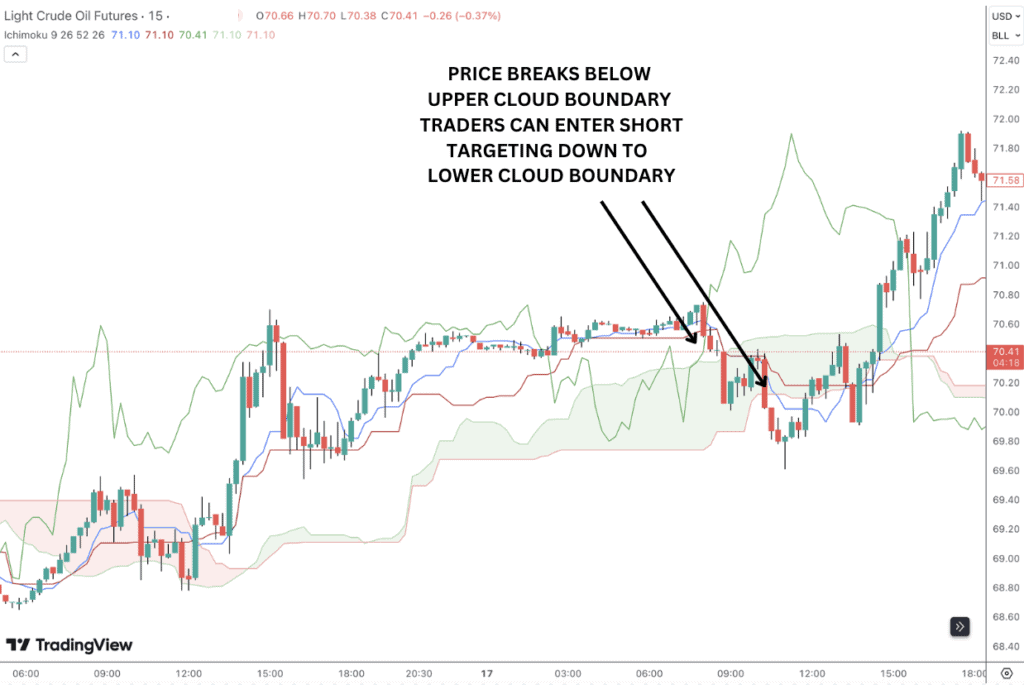
As with the other Ichimoku chart strategies we’ve discussed, traders can seek extra confirmation through additional indicators, such as volume spikes or crossovers of the Tenkan-sen and Kijun-sen.
By focusing on these defined cloud boundaries, the Edge-to-Edge strategy allows traders to capitalize on momentum while maintaining clear risk management, thus fostering a disciplined approach in varying market conditions.
Ichimoku Cloud for Swing Trading
In the last section, we looked at how short-term day traders can use the Ichimoku cloud charts for trading signals on the lower-time frames. However, the Ichimoku indicator is just as effective on higher-time frames for swing trading.
Let’s take a look at a basic swing trading strategy that can be employed using the Ichimoku technical indicator. In this walk through we will detail a step by step method for executing and managing a swing trade using the Ichimoku technical indicator. We will use a bullish example for this.
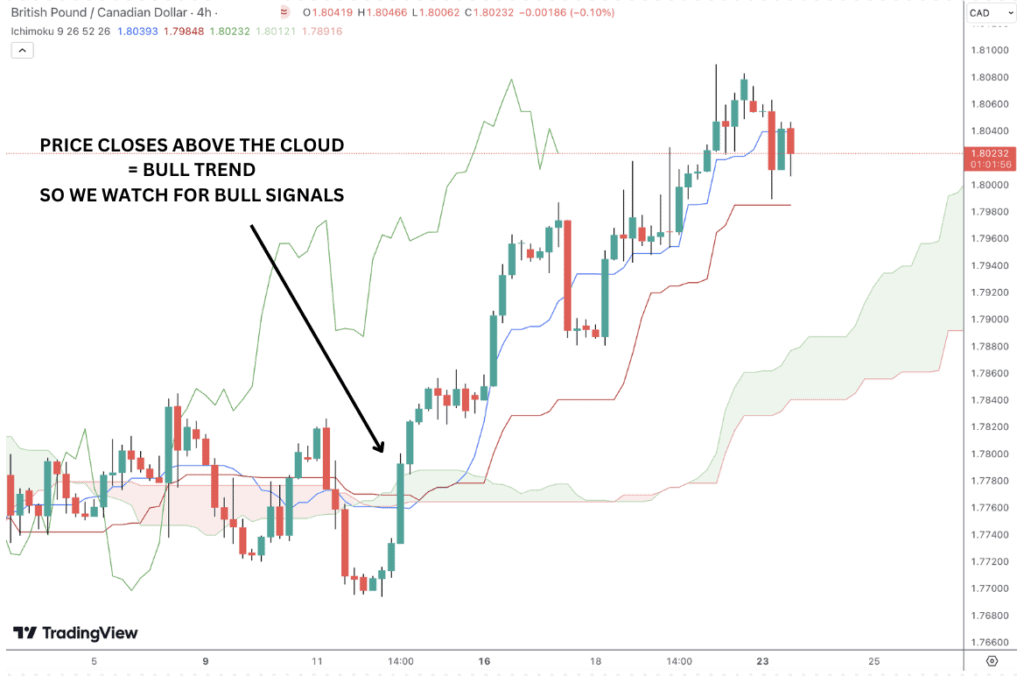
Wait for the Price to Break and close above the Ichimoku Cloud
The first step is to wait for price to break above the cloud. We know that price above the cloud indicates a bullish trend and therefore guides us to look for buy signals instead of sell signals.
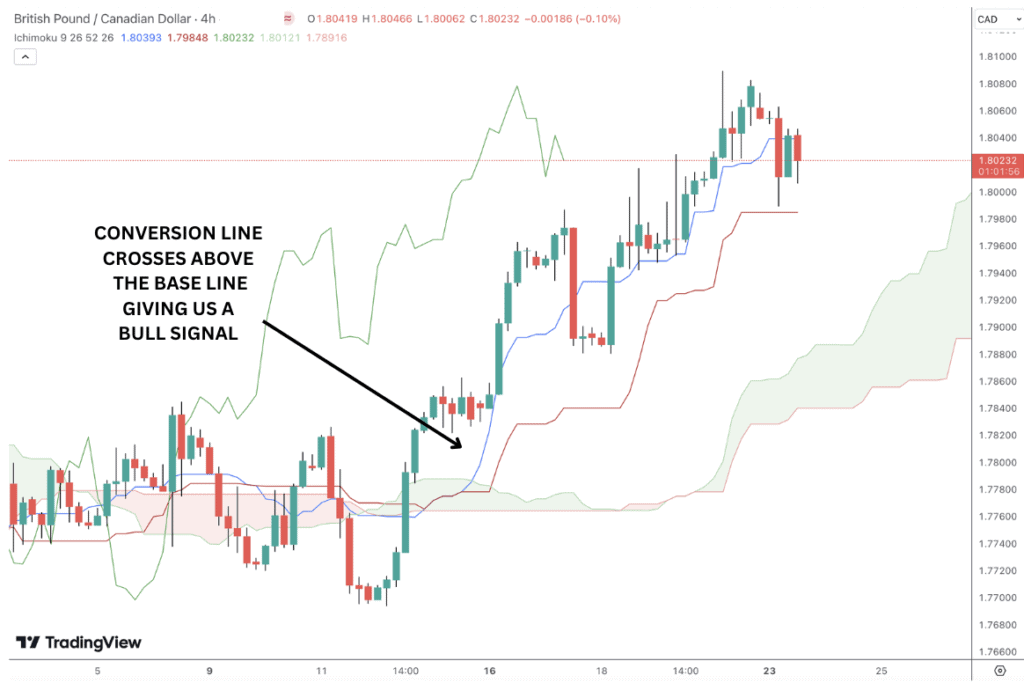
Wait for the Crossover: The Conversion Line needs to break above the Base Line
Once we have established that price is moving above the cloud, putting us on alert for long entries, we then want to monitor the charts waiting for the Conversion Line to cross above the Base Line.
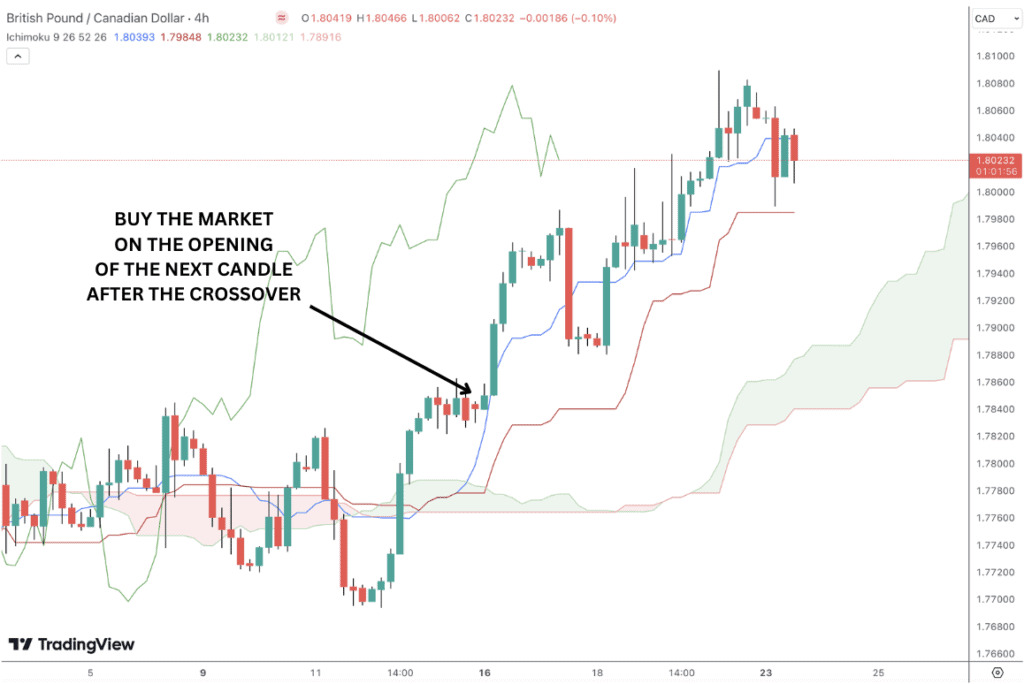
Buy after the crossover at the opening of the next candle
Once we have seen the Conversion Line cross above the Base Line we can enter a buy trade at the opening of the next candle. Some traders will look to enter the trade at the current closing price where the crossover occurred. However, it is always worth waiting for the next candle just to add an extra layer of protection against false moves.
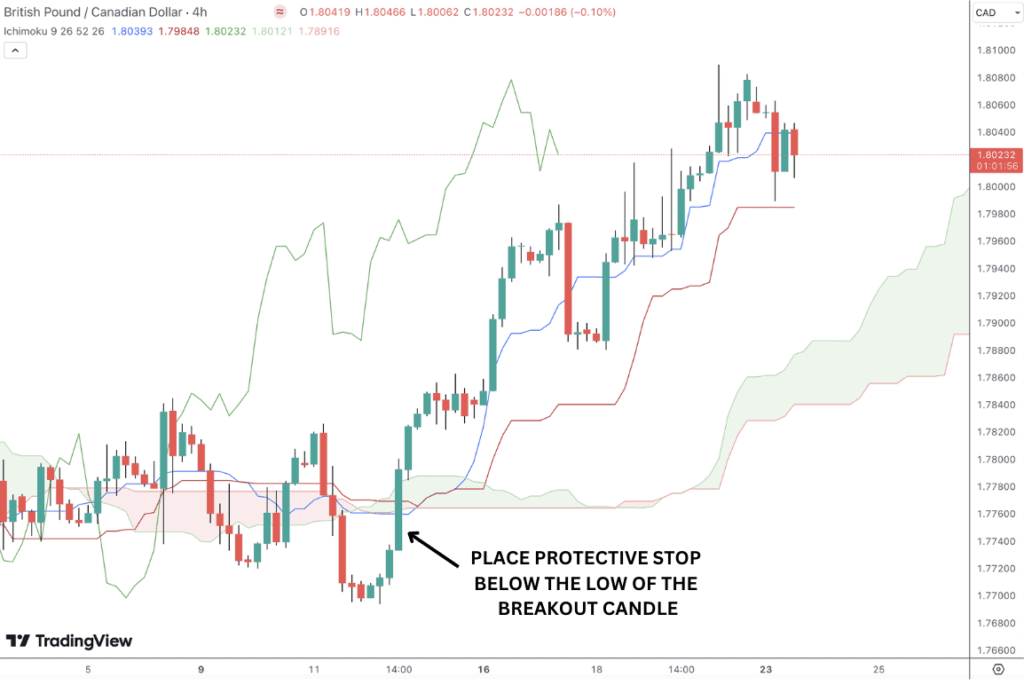
Place protective stop loss below the breakout candle
Once we have entered our buy trade, we can then place a protective stop below the low of the candle that formed as price broke above the cloud. It is important to note that we don’t place our stop below the entry candle.
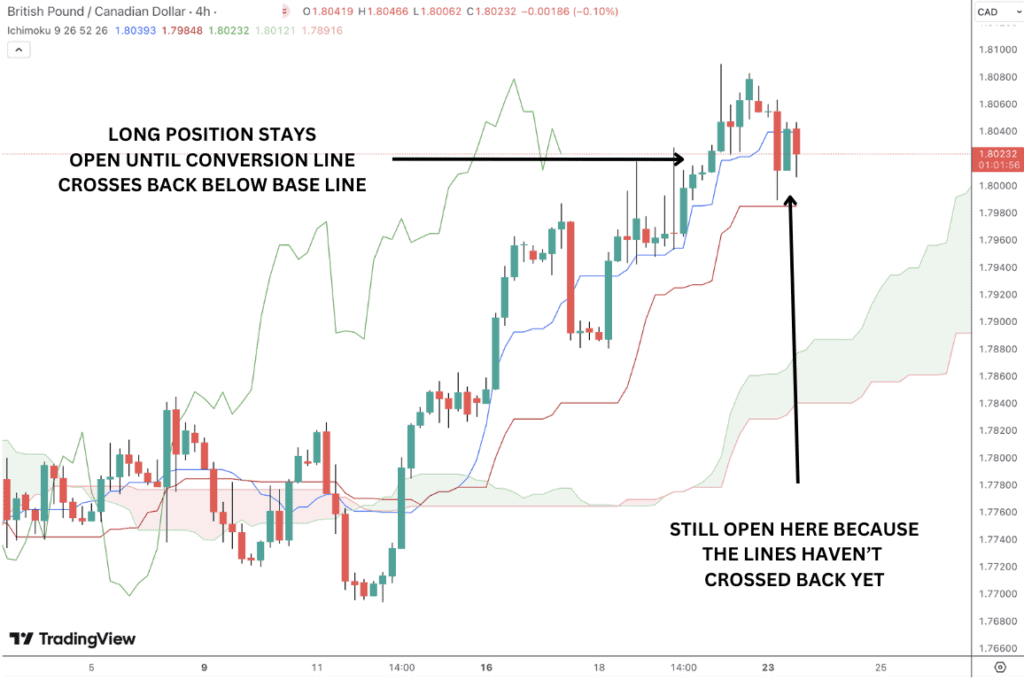
Take Profit when the Conversion Line crosses below the Base Line
Another extremely beneficial aspect of the Ichimoku cloud system is its usefulness in helping traders identify exit points for traders. Given that the entry point for this strategy was the crossing of the Conversion Line above the Base Line, it stands to reason that we should exit the trade as the Conversion Line crosses back below the Base Line.
Ichimoku Cloud with RSI
Given that the Ichimoku indicator gives us a wide range of information on the market, including trend direction, trend strength and support and resistance, Ichimoku charts can be easily combined with other technical indicators. One such indicator is the RSI (Relative Strength Index).
Let’s look at how we can combine the two indicators to identify trading signals, using a bullish setup as an example.
In this scenario, we look to see price trading above the cloud to identify our overall trend direction through the Ichimoku indicator. Traders can wait to see a green cloud if they want to establish a stronger trend. Once we establish our trend using Ichimoku we then look to the RSI indicator to give us potential entry points.
Knowing that the RSI indicator is a trend strength indicator which measures price moves as either overbought or oversold, we want to wait for price to correct lower and the RSI to identify oversold conditions in the market by falling below the lower 30 threshold.
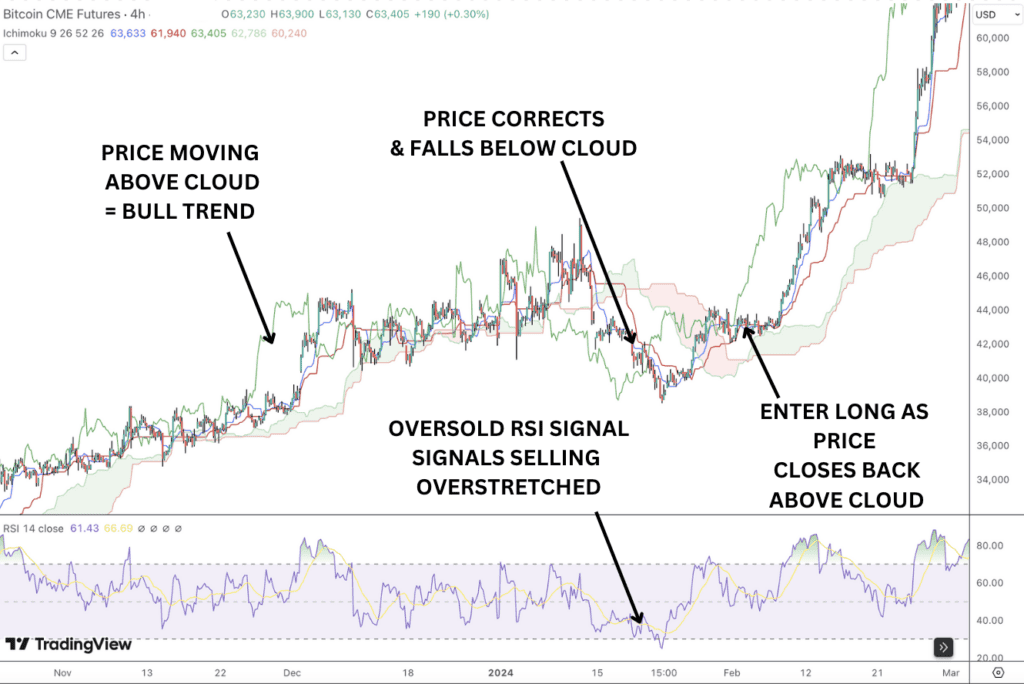
One very simple, yet effective method is where we establish a bull trend then wait for price action to move lower and fall below the cloud. We then want to see an oversold signal on the RSI indicator telling us that bearish momentum is overdone.
We then wait for price to start moving higher again and can enter a long trade as price breaks back above the cloud and resumes the bull trend, giving us our buy signal. The beauty of this system is that if price doesn’t cross back above the cloud, we likely have a trend reversal underway and so there is now entry point.
Using the two indicators together like this is a great way to add extra conviction to your trading and helps to filter out weaker trade ideas.
Ichimoku Cloud with Bollinger Bands
Another great indicator to combine with the Ichimoku indicator is the Bollinger Bands®. Bollinger Bands look at the price trend and measure volatility with a view to establishing support and resistance points that can be used to place trades.
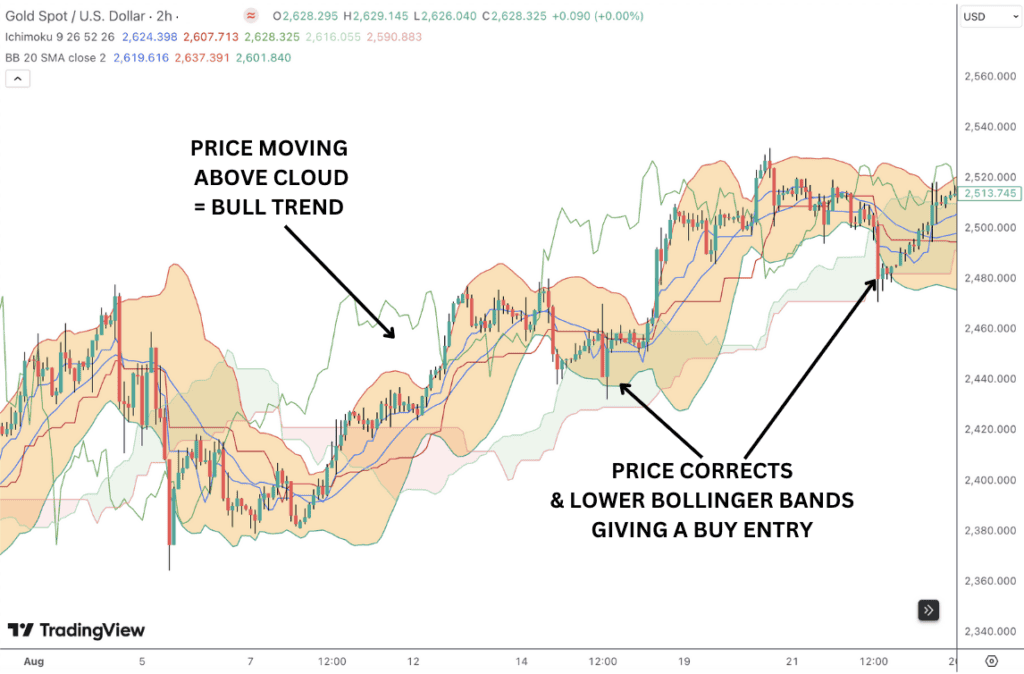
Let’s examine the two indicators together, looking at a bullish trade as an example. For a bullish trade, we want to identify price moving above the cloud boundaries to signal a bullish trend. Traders can wait to see a green cloud to signal a stronger bull trend.
Once price is trading above the cloud, we then look to see price correcting lower within the Bollinger Bands indicator. When price touches the lower Bollinger Bands line, this indicates that downside volatility is overstretched and price is vulnerable to a reversal higher and a continuation of the bull trend signalled by the Ichimoku indicator. At this point we have our buy signal and we can enter a long position on our price chart.
Ichimoku Cloud vs Moving Averages
While the Ichimoku Cloud uses averages, its calculations and data points are different from those of traditional moving averages. A simple moving average (SMA) works by adding up the closing prices over a specified period and dividing that total by the number of periods.
For example, a 26-period moving average takes the sum of the closing prices from the last 26 periods and divides by 26 to find the average on the price chart.
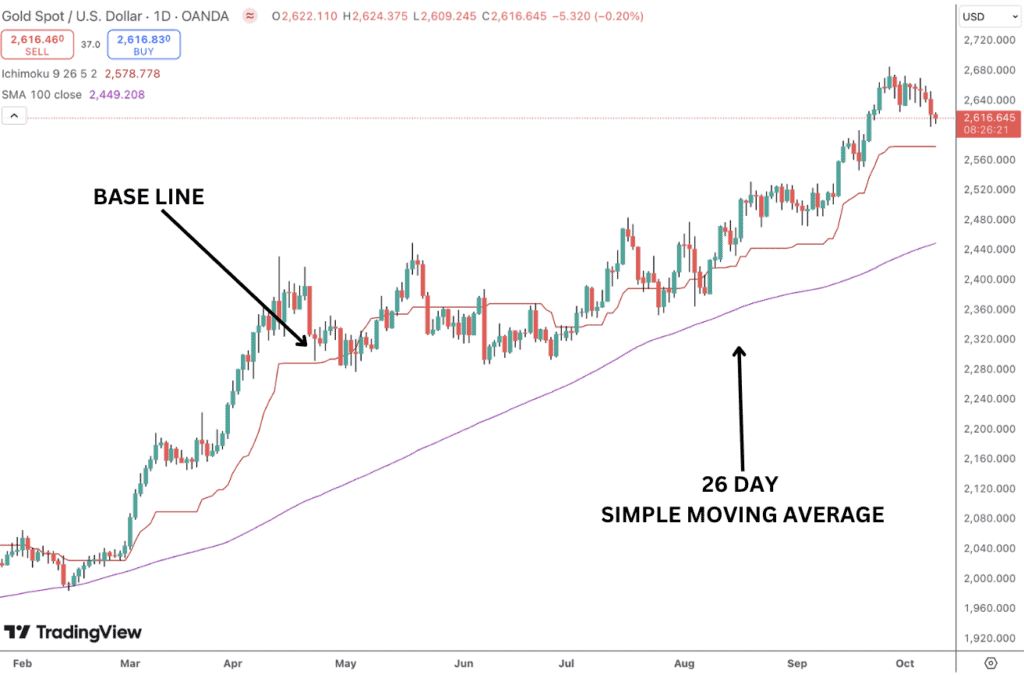
In contrast, the Ichimoku Cloud calculates averages based on the highest and lowest prices over a set period, then divides that result by two.
Essentially, this means that even if you use the same number of periods, Ichimoku averages will differ from traditional moving averages, as you can see in the image above.
It’s worth noting that this alternative calculation doesn’t necessarily make the Ichimoku cloud ‘better’ than a simple moving average for example, just different. It’s always a good idea to explore different indicators and find which works best for you. Traders should remember that the data points in both Ichimoku and moving averages setting can be adjusted to give a longer run or shorter run view on price action.
Advantages of Ichimoku Cloud
- One Glance Indicator: Ichimoku provides an abundance of information on trend direction, trend momentum, support and resistance levels. This means less cluttered charts and more focus on what’s important.
- Versatility: There are many different ways of using the indicator, making it valuable in identifying different entry points to the market. Ichimoku trading strategies can be as simple or as complex as the trader desires. This means that traders can add to their Ichimoku trading as their skills and expertise develop.
- Multi-Time Frame: The Ichimoku cloud system can be used on any timeframe and in all asset classes, making it a highly versatile tool, suitable for traders no matter what their preferred market or time frame.
Disadvantages of Ichimoku Cloud
While the indicator can be a fantastic tool for technical analysis, it does have its drawbacks which traders should consider when using it.
- Complicated: One disadvantage is that the indicator comprises multiple components, which can be overwhelming for beginners. Understanding how each element interacts requires time and experience, potentially leading to confusion in fast-moving markets.
- Trend-Based: Another disadvantage stems from the IchImoku cloud’s primary use as a trending tool. As such, the effectiveness of the Ichimoku system can diminish in choppy or sideways markets, where the cloud may produce false signals. In such scenarios, traders might struggle to identify clear trends, leading to potential losses.
- Profit-Taking: One final disadvantage is, depending on the trading strategy, Ichimoku systems can give back a lot of unrealized profit if, for example, the trader is buying the market as it crosses above the cloud and closing the trade as it crosses back below the cloud.
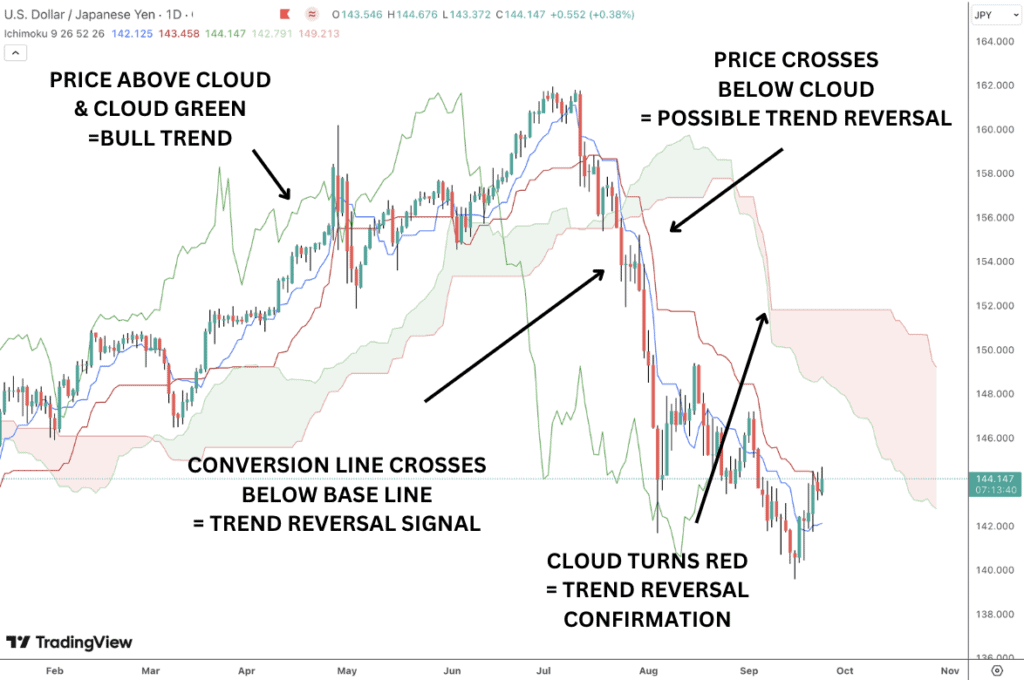
Can the Ichimoku Cloud Indicator be used to identify potential trend reversals?
The Ichimoku indicator is a fantastic tool for identifying trend reversals. We have already established how we can use the indicator to assess price moves, identify future or support or resistance levels and provide us with buy or sell signals. When looking to identify trend reversals the most basic option is to look for price to cross through the cloud and begin moving against the prior trend.
So, if price is trending higher and is above the Kumo cloud and the Conversion Line is above the Base Line, we know we have a bull trend. Once price crosses below the cloud, this alerts us to a potential trend reversal.
If the Conversion Line crosses below the Base line, this tells us a trend reversal is underway and we have a sell signal to take a short position. Finally, If the cloud then turns red, this gives further confirmation that a trend reversal is underway and strengthens our conviction in taking a short trade.
How does the Ichimoku Cloud define support and resistance?
The Ichimoku Kumo cloud, formed by the Leading Span A and Leading Span B, represents areas of future support and resistance. When price is above the Kumo cloud, the upper cloud boundary acts as support, while the lower boundary provides further support. When the price is below the cloud, these lines act as resistance.
FAQ
What is the best time frame for the Ichimoku Cloud indicator?
The Ichimoku cloud can be used successfully across all time frames, as such, there is no specific time frame that provides the best results. Typically, higher time-frames will produce less signals but are likely to see large price movements when compared with lower time frames where there will be more signals but smaller moves on average.
How reliable is Ichimoku?
The Ichimoku cloud indicator is considered among the more reliable technical indicators given the amount of inputs the system uses to provide price information. Ultimately, the reliability of signals depends on asset class, time frame and how the trader employs the signals within their own trading.
What is the origin of the Ichimoku Cloud?
The Ichimoku system originated in Japan during the late 1930s, developed by journalist Goichi Hosoda. His aim was to create a comprehensive trading indicator that could provide a clearer view of market trends and price action.
The term “Ichimoku” translates to “one glance,” reflecting its design to offer a quick yet detailed overview of market conditions. The system is also known as Ichimoku Kinko Hyo, meaning
What are the best Ichimoku Cloud Strategy settings?
The default indicator settings are the best to use for beginner traders. Once you have developed enough skill and experience with the indicator you might wish to explore different settings, such as shorter periods for more aggressive signals and trading or longer periods for less aggressive trading and less signals.
What does Ichimoku mean in English?
“Ichimoku” is Japanese and translates to “one glance” in English. This name reflects the essence of the Ichimoku Cloud indicator, which is to give traders a comprehensive view of market conditions at a single glance.
How are bullish and bearish signals reinforced in Ichimoku Clouds?
Once price has crossed below the cloud, the Conversion Line crossing below the Base Lien reinforces the bearish signal. Once price has crossed above the cloud, the Conversion Line crossing above the Base Line reinforces the bullish signal.
Is Ichimoku Cloud a leading indicator or a lagging indicator?
The Ichimoku indicator is primarily considered a leading indicator, although it incorporates both leading and lagging elements.
The leading Span A and leading Span B are leading elements. These two lines are plotted ahead of the current price, helping to forecast potential future support and future resistance levels. This forward-looking aspect allows traders to anticipate future price movements.
Chikou Span is a lagging line. The Chikou line is plotted 26 periods back from the current price. It provides context about past price action, confirming current trends.


