


Written by:

Reviewed by:

Bearish
- September 11, 2024
- 21 min read
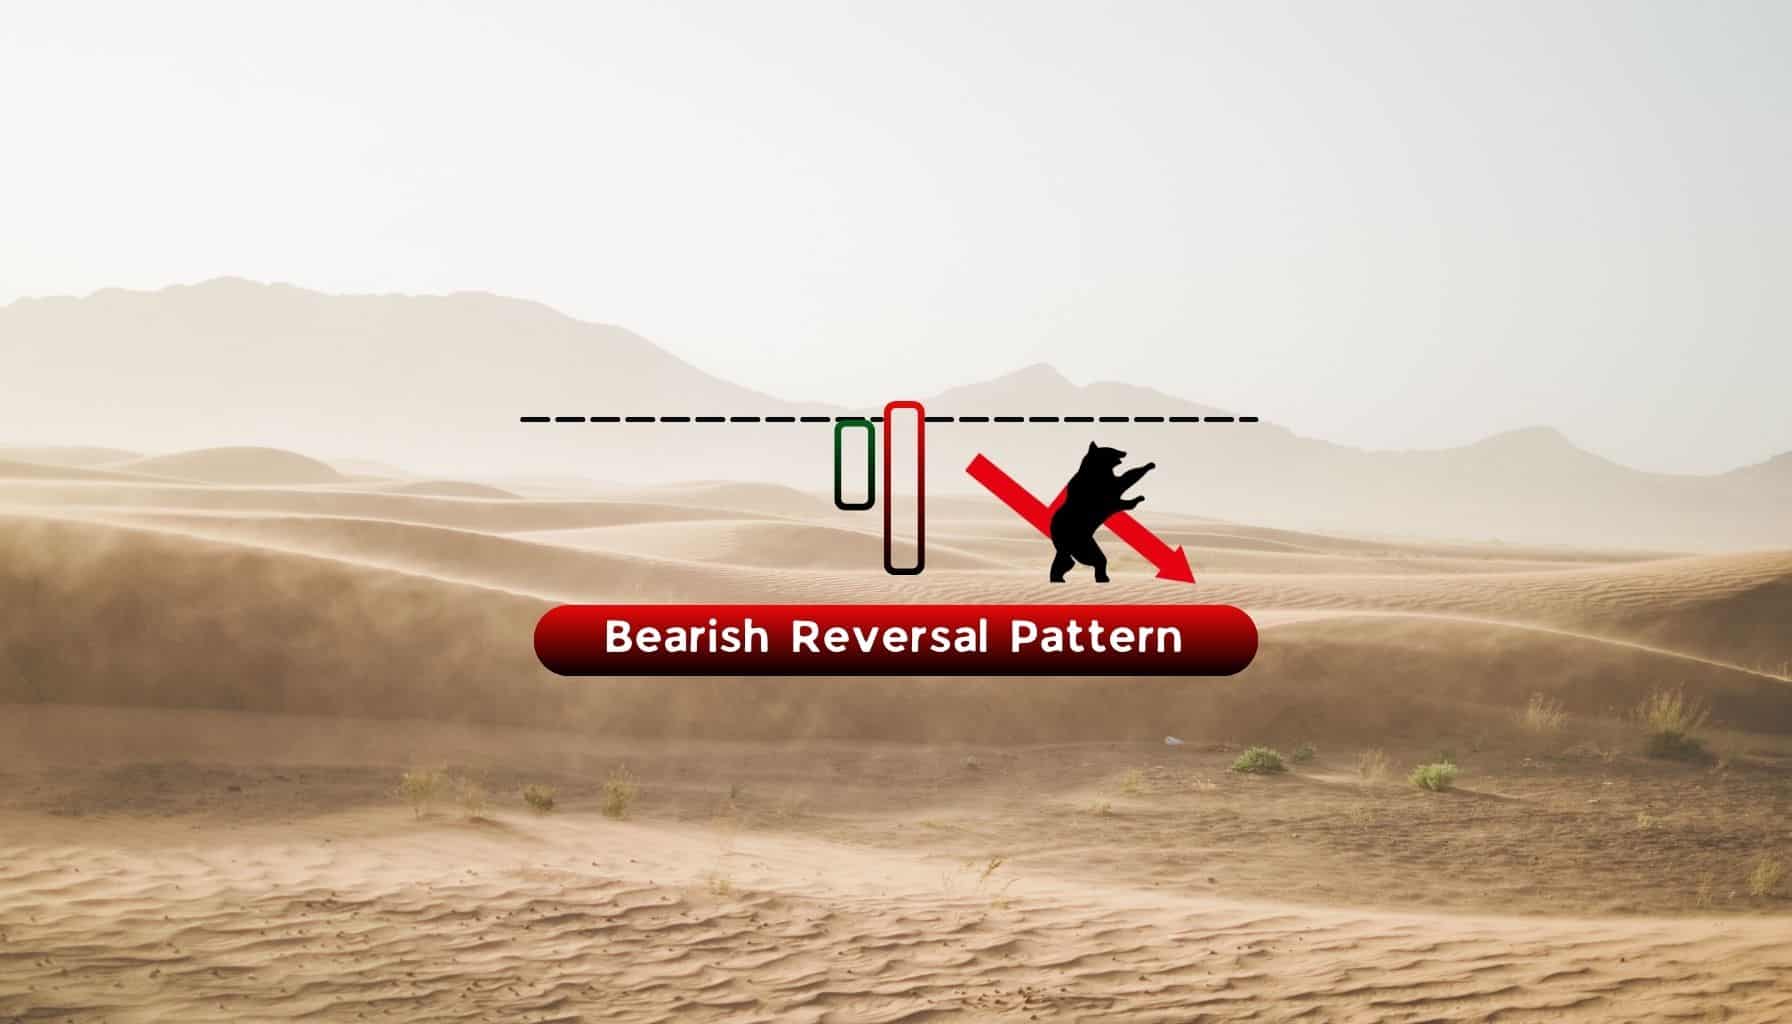
Bearish Engulfing Candlestick
The bearish engulfing pattern is a clear sign that the markets may be reversing to the downside soon, serving as a sell opportunity or exit signal.
Key Takeaways
- After a price rally, the bearish engulfing pattern hints at a potential bearish price reversal.
- This pattern is most effective when it appears within an overarching downtrend.
- It is reliable on the daily time frame with a 57% win rate.
What Is a Bearish Engulfing Candlestick Pattern?

The bearish engulfing pattern is a two-candlestick pattern used by technical traders to predict a bearish price reversals after the price has been rising. The emergence of a bearish engulfing pattern signals that the price may begin to enter a downtrend, and can be used as an exit signal for your long trades, or as a short entry opportunity.
According to research by market analyst group, Liberated Stock Trader, the bearish engulfing pattern has a win rate of 57% rate on the daily timeframe, making it a fairly reliable pattern.
How to Identify the Bearish Engulfing Pattern?
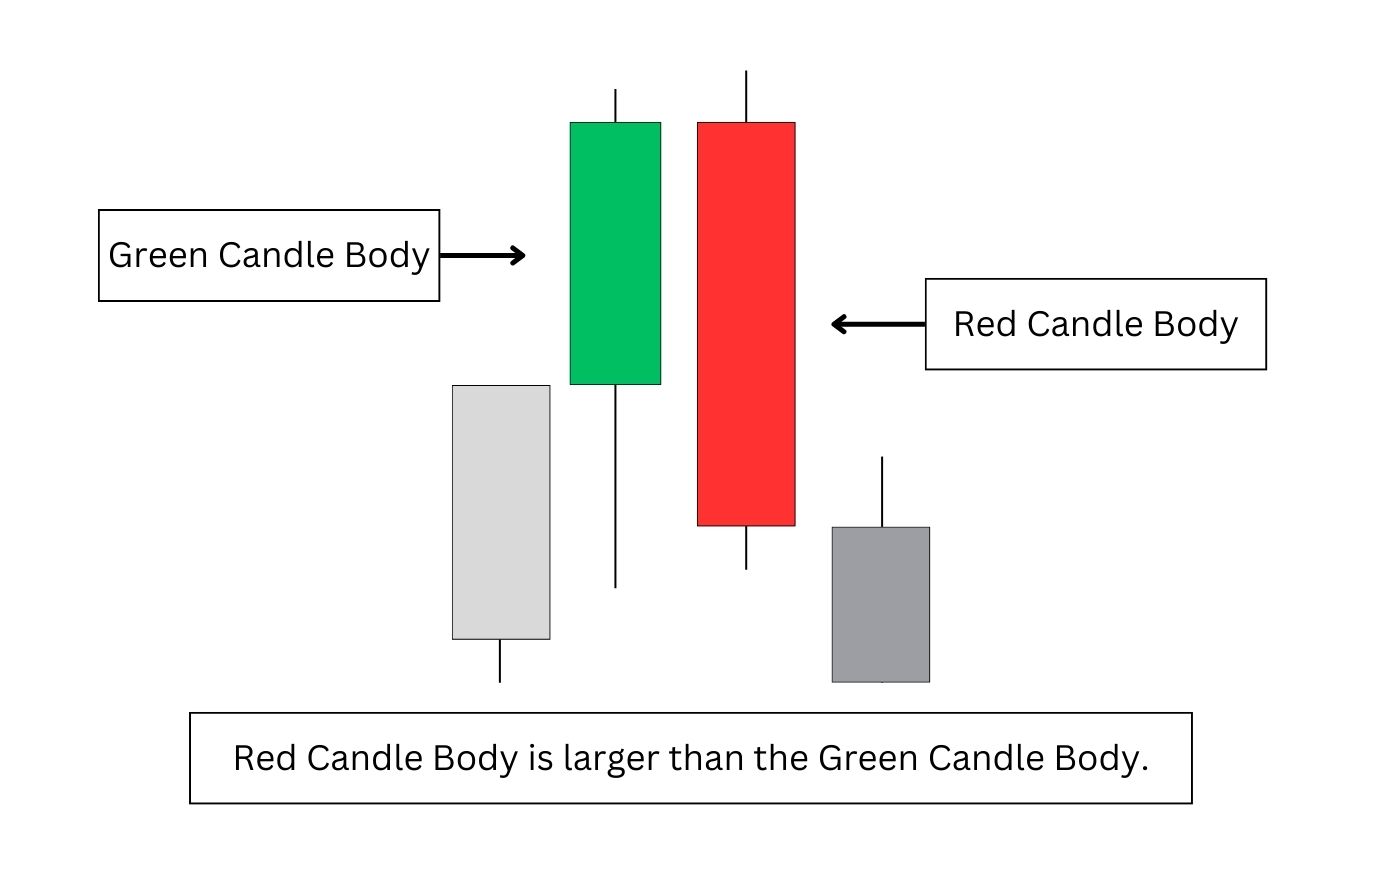
A bearish engulfing candlestick pattern is made up of two candlesticks: a green/white candle, followed by a red/black candle. The red/black candle must be larger than the green/white candle, thus engulfing it.
One key aspect many traders miss is that the red/black candle needs to have either:
- A higher opening price than the green/white candle’s closing price or,
- A higher wick than the green/white candle’s closing price.
When trading on the daily time frame on traditional markets like stocks and forex, the second candle should gap higher on the open, only to trend lower than the first candle’s body. This tells us that despite the market opening being bullish, it was not able to sustain the high price and was forced lower by stronger selling pressure.
This gap behaviour is common in traditional markets due to limited operation hours. So, the price will often close at a certain price on one day, only to open at a higher or lower price on the next.
The location where you’re searching for the bearish engulfing pattern is important too.
You would normally find this pattern at key resistance levels or at the end of a prolonged uptrend. The longer the uptrend, the stronger the bearish signal is.
When do Bearish Engulfing Candlestick Patterns occur?
Bearish engulfing candlestick patterns tend to occur at the end of an uptrend, typically near a resistance zone. These can come in the form of static or dynamic levels.
Static levels are horizontal zones in the price chart, where the price has previously reacted. You can notice these levels as points where the price has made a sharp pivot. These levels act as a support level when prices are above it, and as a resistance level when prices are below.

Dynamic levels are less obvious, acting as hidden support and resistance levels in the chart. They change and adapt according to the price action. These levels are displayed through indicators like moving averages, vWAP, trend lines, Fibonacci retracement, or volume profiles.

Recognising bearish engulfing patterns is beneficial for traders as it offers a clear trading objective and can serve as an exit signal, aiding in risk management.
Importance of Bearish Engulfing Pattern
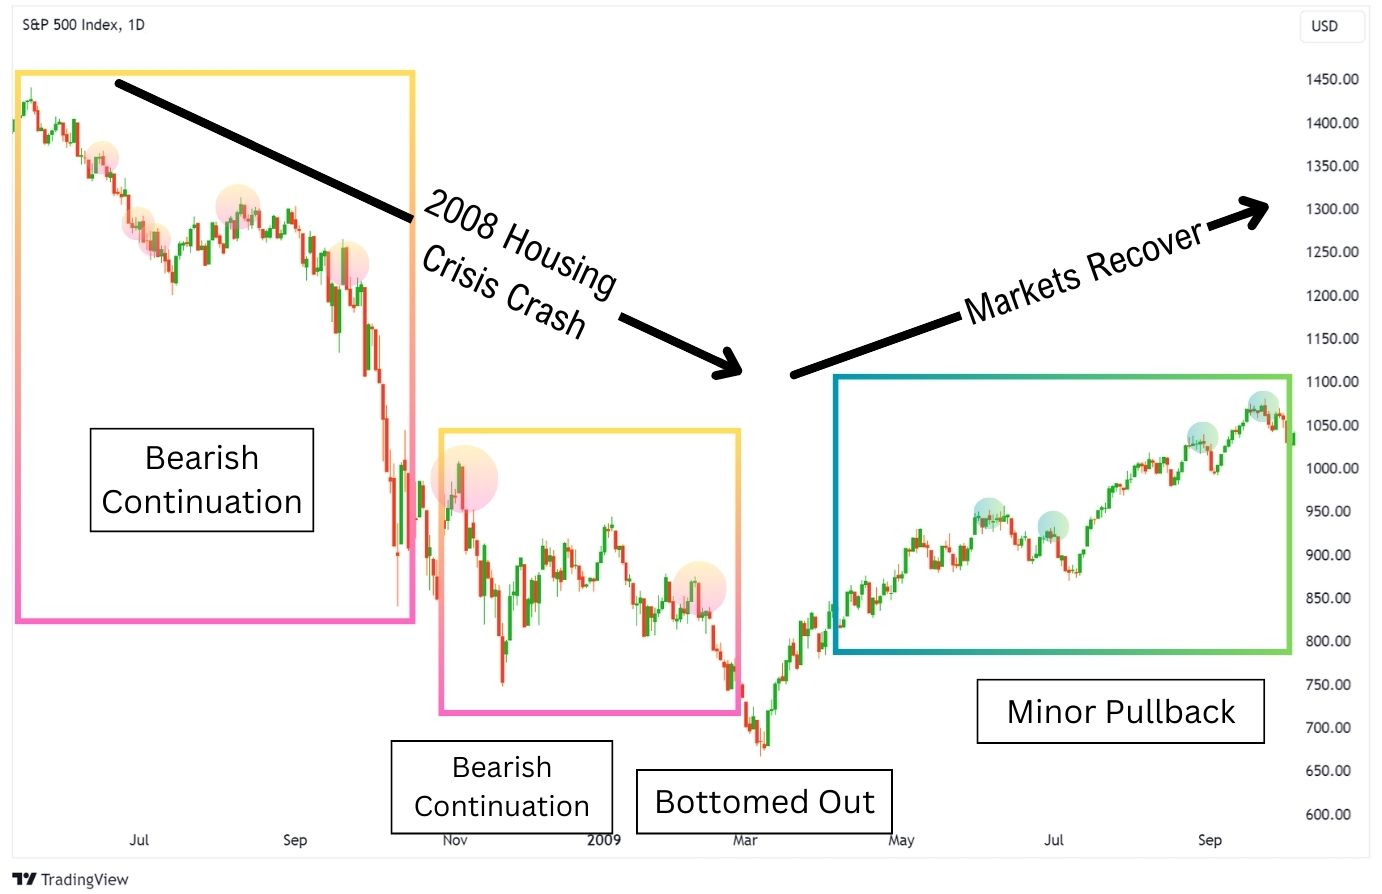
The bearish engulfing pattern often plays a small part in indicating the end of a major uptrend, and when paired with other indicators, can help investors get out of positions before things get dicey.
The infamous 2008 housing crash created a bearish cascade of price action, leading to an over 50% fall on the S&P 500. By using the bearish engulfing pattern as our signal, we would have been able to enter two significant short trades, riding the price down.
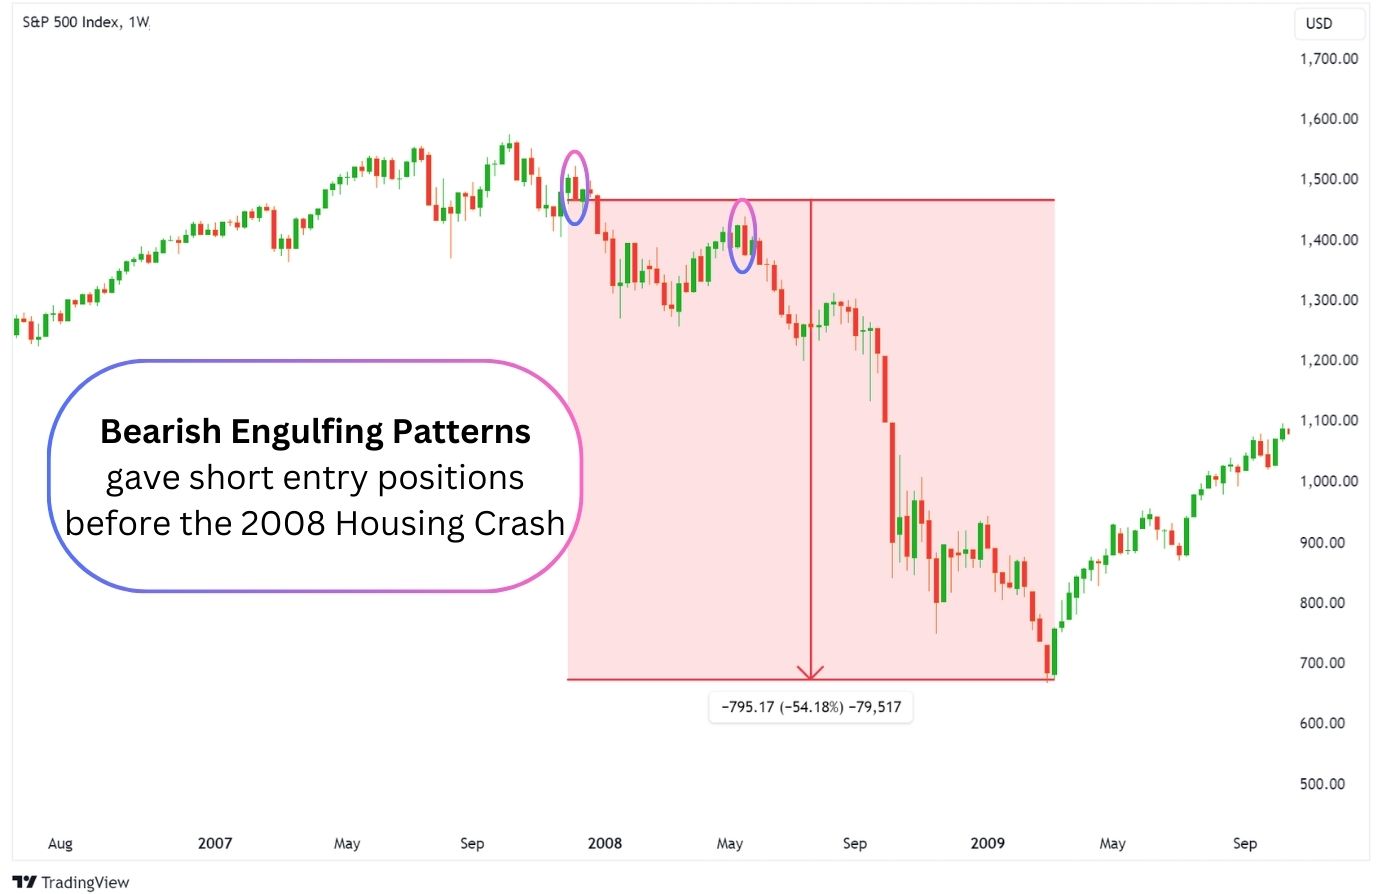
Understanding the bearish engulfing pattern could mean the difference between exciting a trade or holding an asset to extreme losses.
Bearish Engulfing Pattern Example
Bearish engulfing patterns can signal the beginning of a major downtrend, especially when they form on a higher time frame like the daily or weekly chart.
In this GBPUSD example, we see a bearish engulfing pattern form at $1.437. Then, over a year, the price of GBPUSD dropped by a substantial 2004 pips.
This bearish engulfing pattern also marked the second high of the double top pattern.

Of course, the bearish engulfing pattern by itself isn’t always going to be the perfect entry. This example of EURUSD from 2013 to 2015 demonstrates this perfectly.
Eventually, the price does begin its significant downtrend, but only after a year of grinding up until May 2014. No one wants to be holding an underwater position for that long!
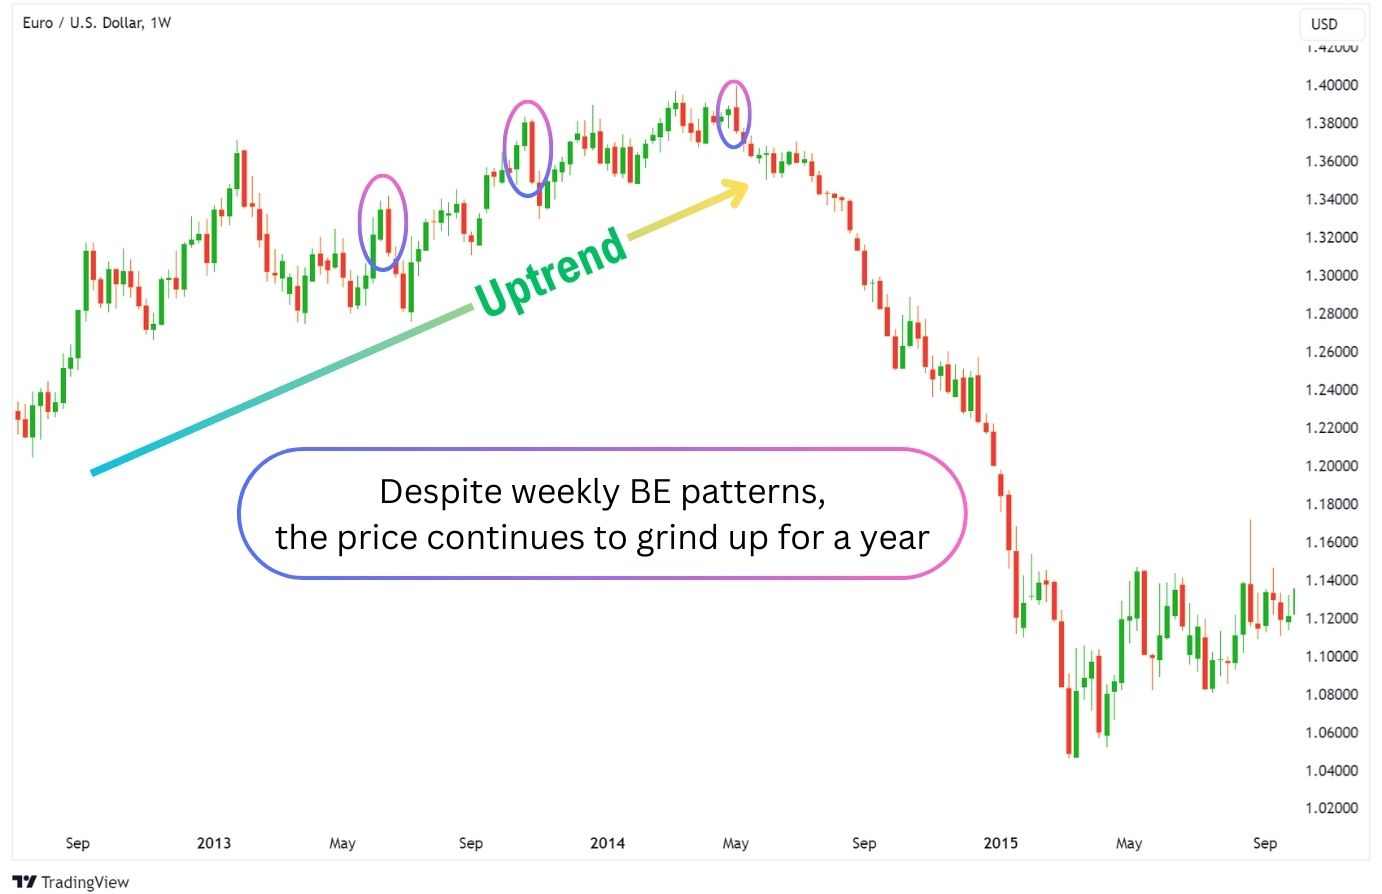
That is why it’s important to consider the overarching trend of the markets. The bearish engulfing candle will work better within the context of a larger downtrend, producing much larger downswings than when markets are generally trending up.
Conversely, during general uptrends, the bearish engulfing pattern will produce minor pullbacks before major continuation to the upside. In times like this, it’s better to trade the pattern with more conservative targets, such as targeting the next pivot low rather than a higher time frame support level.
That’s why trading the bearish engulfing pattern requires nuance, and should not be the sole entry signal you’re using to enter a short trade.
Strategies To Trade The Bearish Engulfing Pattern

The bearish engulfing pattern is much more effective when traded with other technical indicators, adding clarity to each trade.
To make the bearish engulfing pattern more reliable on the daily time frame, we can consider combining the bearish engulfing pattern with the following techniques and indicators:
- Horizontal support/resistance levels
- Trendline support/resistance
- Moving Averages
- RSI Bearish Divergence
- Bollinger Bands
- MACD
Trading the Bearish Engulfing Candle Using Support & Resistance
Support and resistance levels are the cornerstones of technical analysis. These are clear zones where the price has previously pivoted away from, giving traders a hint of where to look for a long or short trade.
The concept is simple:
- Look for longs at support, and short at resistance.
- When the zone is below current price, it acts as support.
- When the zone is above current price, it acts as resistance.
For this strategy, we’ll be looking for moments where the price tests a resistance, then forms a bearish engulfing candle confirming the presence of strong selling pressure.
With the bearish engulfing candle confirmation, we can confidently enter a short trade targeting the next significant support level.
Here’s how it works:
- Monitor the price action as the price approaches a resistance level.
- Enter a short trade on a bearish engulfing candle confirmation.
- Set your stop loss just a few points above the resistance zone.
- Take profit just above the horizontal support levels below.
Trading the Bearish Engulfing Pattern with Trendline Strategy
Another type of resistance traders can look for is a trendline. These are often associated with patterns such as parallel price channels, wedges, triangles, flags, or pennant patterns.
Trendlines connect the highest or lowest pivots of a price chart, creating a diagonal line that acts as a support or resistance level. In this case, we will be connecting previous pivot highs with a trendline.
Then, when price approaches the trendline, we will be looking to enter a short trade with a bearish engulfing candle confirmation.
Here’s how it works:
- As price is ascending, connect the previous highs with a trendline and extend it to the right.
- When the price approaches the trendline, look for a bearish engulfing candle confirmation.
- On a successful bearish engulfing candle formation, enter a short trade.
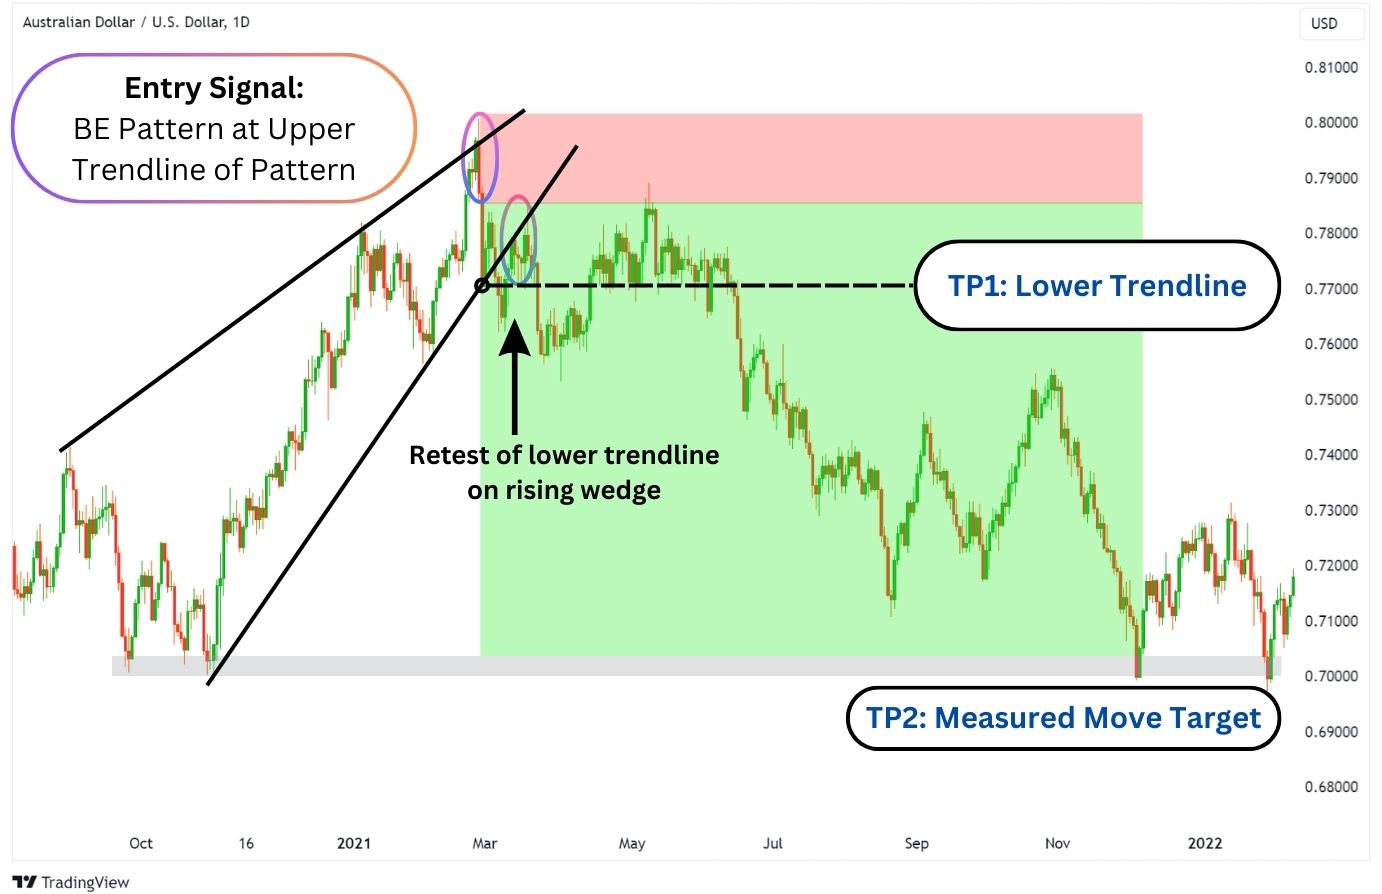
- Take profit at the pivot low or a lower trendline (if present).
- If a chart pattern is clearly visible, such as a rising wedge in our example above, set your 2nd take profit at the chart pattern’s measured move target.
It’s important to notice if any patterns are forming in the chart, as trendlines and chart patterns often go hand in hand together. You should consider taking partial profits at areas of interest, such as:
- The lower trendline of a chart pattern.
- Previous pivot lows.
- Chart pattern measured move target.
This strategy is powerful in the sense that it can get us an early entry into a bearish chart pattern trade, as illustrated in our AUDUSD chart above. A bearish engulfing pattern appeared at the top of a Rising Wedge. After taking some profits at the lower trend line, our short trade gained more in profits as the wedge broke down toward its target.
Trading the Bearish Engulfing Pattern with Moving Average
Now, let’s move on to dynamic types of support and resistances. Unlike the trendline and horizontal levels mentioned earlier, dynamic resistances change and adapt to the current price action. They are only visible when using indicators such as the moving average.
Moving averages come in many forms, such as the SMA (Simple Moving Average), EMA (Exponential Moving Average), or WMA (Weighted Moving Average). They mark out the average price of an asset within a calculation period, and often act as a hidden support/resistance level.
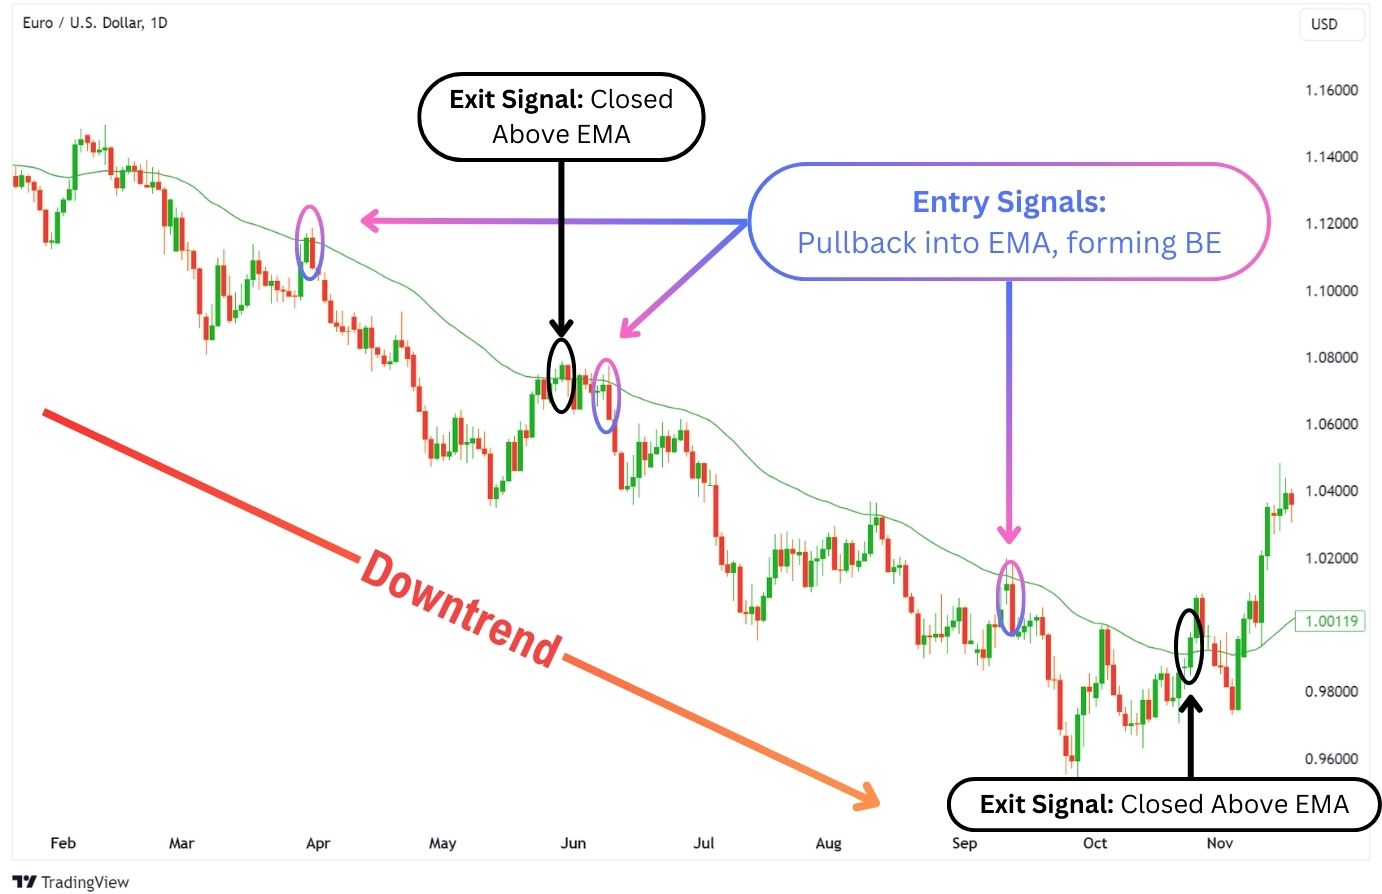
In this strategy, we’ll use the daily 50 EMA to take a bearish engulfing pattern trade. Here’s how it works:
- Monitor the price when it is in a daily downtrend, and under the 50 EMA.
- When the price pulls back to the daily 50 EMA, enter a short if a bearish engulfing pattern forms.
- Set a stop loss above the pattern.
- Take profit at key support levels, or exit the long trade when the price closes above the EMA.
It’s important to monitor horizontal support areas on the price chart to ensure you don’t open a short trade just above a support level, as the price can quickly reverse against your trade in this scenario.
Quick note: You can change the moving average type, calculation periods, and time frames to find the best fit for the specific asset you’re trading. Each asset is influenced by its unique group of traders, which affects which type of moving average is most effective for that particular market.
Trading the Bearish Engulfing Pattern with RSI
The RSI, or relative strength index, is an indicator that tells you about the momentum of an asset. This allows us to also figure out if an asset currently has a bullish or bearish divergence, which will be important to this strategy.
Divergence occurs when the price and the RSI indicator moves in the opposite directions. Normally, they should be moving in the same direction, but this divergence tells traders that something is brewing, and to stay alert. Usually, a divergence indicates a reversal signal is coming soon.
- Bullish divergence occurs when the price is dropping, creating lower lows, while the RSI is creating higher lows.
- Bearish divergence occurs when the price is rising, creating higher highs, while the RSI is creating lower highs.
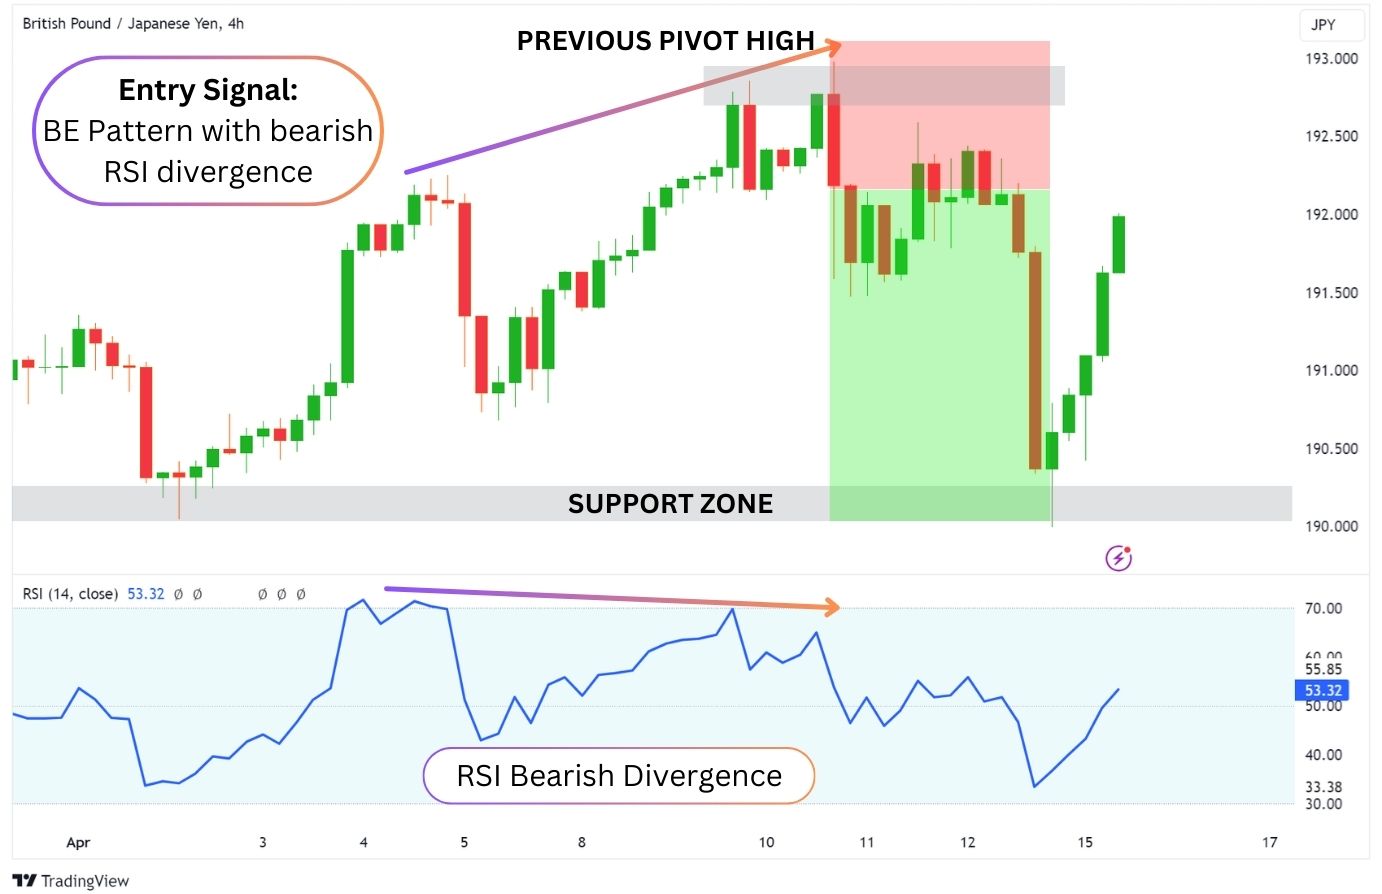
Now, to put divergence together with the strategy:
- Find an asset climbing higher with a bearish RSI divergence (RSI forming lower highs).
- Wait for the price to touch the resistance level and form a bearish engulfing pattern.
- Enter a trade when the pattern is confirmed.
- Place your stop loss above the entire pattern.
- Take profit placed at the next horizontal support level.
Trading the Bearish Engulfing Pattern with Bollinger Bands
Bollinger Bands® are a widely used trading indicator that helps identify potential price ranges by plotting three lines: the 20-period Simple Moving Average (SMA) and two bands—two standard deviations above and below the SMA.
Traders often use this setup to enter short positions when the price hits the upper band, targeting profits at the SMA or the lower band. However, it’s important to note that prices can continue their rally, despite reaching the upper band. This creates a chart where the candlesticks are “hugging” the upper band as the price continues rising.
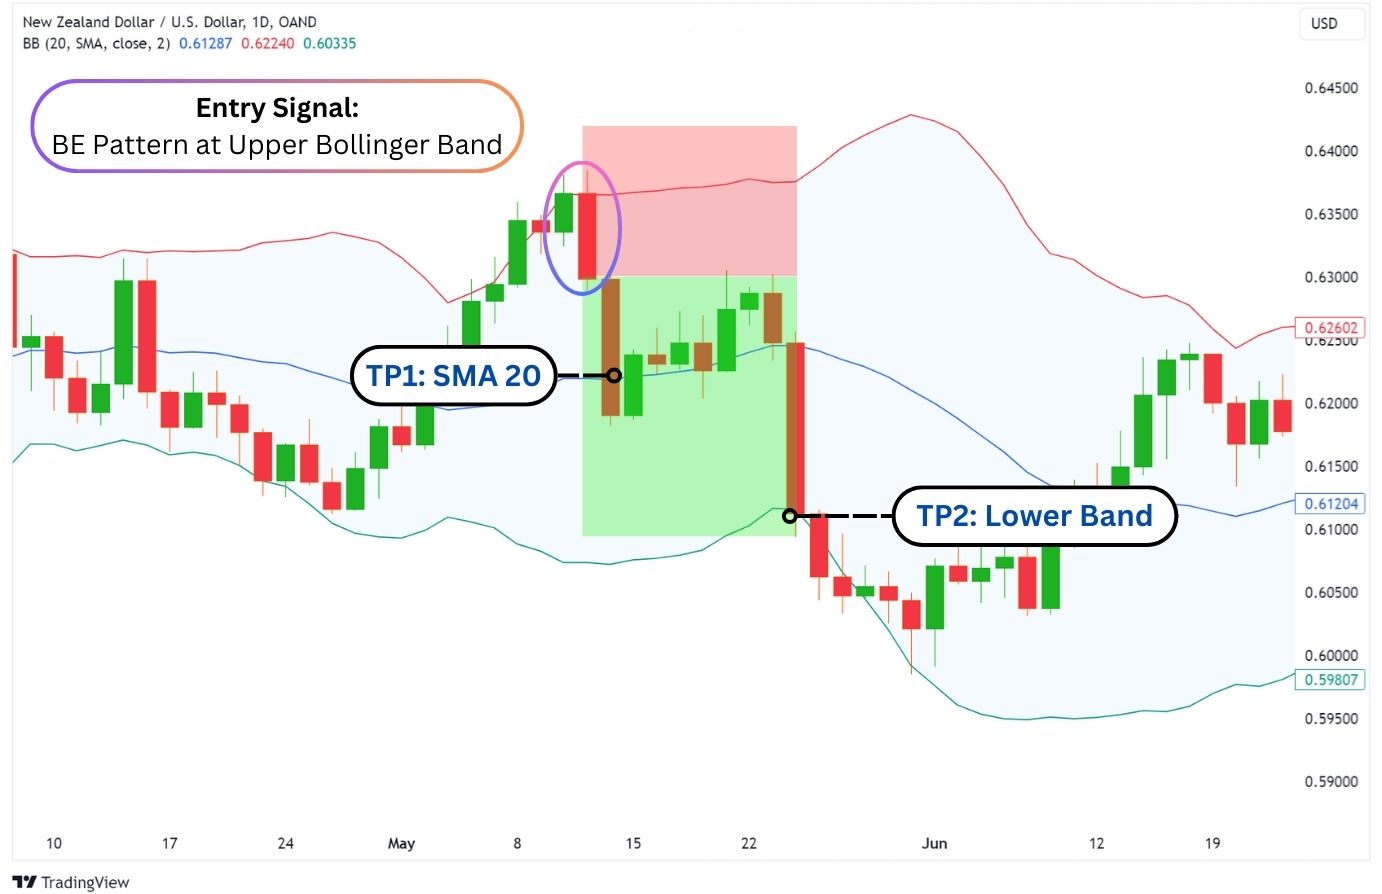
This is where we can apply the bearish engulfing pattern and RSI overbought as filters to enhance the Bollinger bands strategy. Here’s how it works:
- Enter a short trade when a bearish engulfing pattern has formed after testing the upper band.
- Place the stop loss above the pattern.
- Place your take profit target one at the 20 SMA, then the 2nd target at the lower band.
Do keep in mind that this strategy tends to struggle in upward trending environments, as the price can continuously hug the upper band.
Trading the Bearish Engulfing Pattern with MACD
The MACD is an indicator that, similarly to the RSI, provides insights on an asset’s momentum, and highlights any possible divergences brewing in the chart.a
To trade this bearish engulfing candlestick pattern with the MACD, we’ll be looking for a bearish divergence when the price is climbing. The MACD’s price line must be declining as the price is moving up, or the MACD histogram is forming a lower high while the price is forming a higher high.
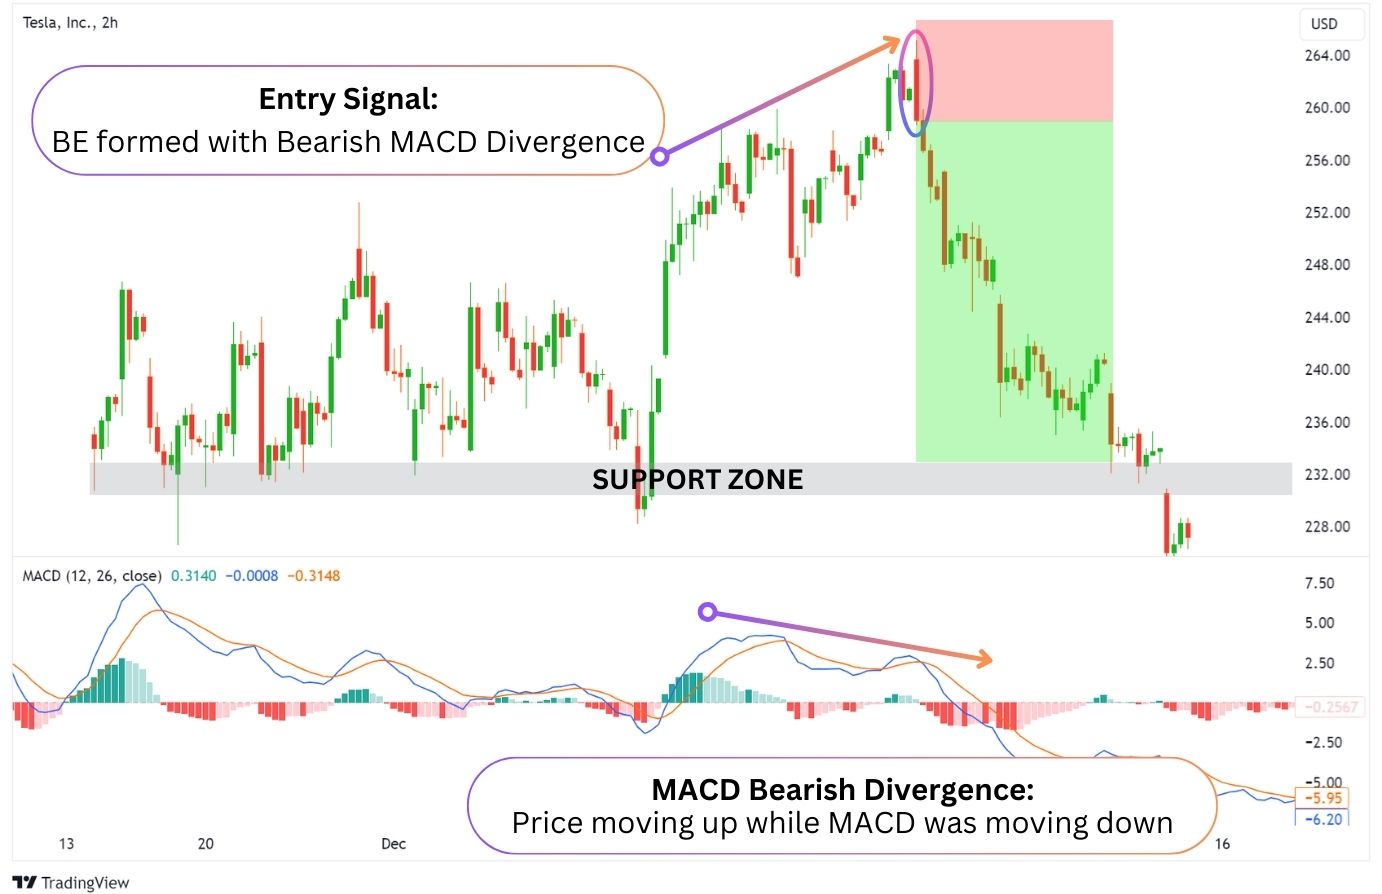
Here’s how it works:
- Monitor the price as it approaches a key support level.
- Enter a short trade if there is a bearish MACD divergence, either in the form of the histogram or EMA price lines.
- Place the stop loss above the most recent high.
- Place your take-profit targets at the next clear support level.
Risk Reward Ratio and the Bearish Engulfing Bars
Risk Reward Ratio (RRR) refers to how much you risk losing compared to how much you stand to gain in a trade. The risk reward ratio is dependent on where you place the stop loss and take profit. For example, with an RRR of 1:2, if your stop loss is 50 pips from the entry, your take profit would be 100 pips away yielding a two to one ratio..
When it comes to bearish engulfing bars, the typical risk to reward ratio is going to vary depending on your strategy. Most beginner traders will prefer using 1:2 RRR for its simplicity and insurance that in 100 trades – even with a 40% win rate, the overall strategy would likely be profitable.
The strategies we’ve outlined use higher RRRs by targeting key support or pivot levels, but this increases the risk of missing take profit targets if the reversal is weak. Therefore, understanding market structure is crucial.
For those less confident in identifying levels, a 1:2 or 1:3 RRR is a common and safer approach.
Advantages of Trading on the Bearish Engulfing Pattern
The bearish engulfing pattern is one of the most popular trading patterns out there. It acts both as an entry signal, and also as a warning to investors to exit their trades.
Here are some benefits of trading the bearish engulfing bars:
- The two-candlestick structure makes the bearish engulfing pattern one of the most easily recognisable patterns to trade.
- According to third-party research, this pattern has a reliable win rate of 57%.
- The bearish engulfing pattern can sometimes signal a major market top, especially when found on a weekly or monthly time frame.
Disadvantages of Trading on the Bearish Engulfing Pattern
Although the bearish engulfing pattern can be reliable, there are also many nuances required for trading this pattern accurately.
Here are the disadvantages of trading the bearish engulfing bars:
- In strong bullish uptrends, the pattern may produce false signals, or only generate very minor pullbacks.
- This pattern requires a good understanding of market structure – for example, support/resistance levels to trade effectively.
- This pattern does not indicate where the price decline will stop, and can sometimes mislead traders into holding a short position for too long.
Common Bearish Engulfing Pattern Mistakes to Watch Out For

Although the bearish engulfing pattern has a 57% win rate, it is not a guaranteed win and can sometimes produce very weak reversal signals. So, traders need to avoid the following mistakes:
- Not trading the bearish engulfing pattern at resistance levels – resistances can come in the form of horizontal levels, or dynamic levels like moving averages or the vWAP.
- Ignoring the overall market trend – a bearish engulfing bar can create a weak reversal signal in strong uptrends. This is why it is important to be conservative with our take profit targets or at least set multiple take profit zones.
- Risking more than 2% of your account balance per trade. Reversal trades tend to be risky, yet it’s also the type of trades many traders want to make quick gains on – don’t fall into this trap and expose your account to too much risk.
- Not using other indicators such as moving averages, RSI, trendlines, or Fibonacci levels to find additional resistances.
- Not giving enough room in the stop loss – the valid stop loss of a bearish engulfing pattern is above the entire pattern, but you still need to give it some room in case the market decides to wick up and take out your stop loss.
It’s important to remember that the bearish engulfing bar isn’t a 100% indication of a reversal signal. An asset’s price can grind even higher before truly reversing into a downtrend.
As for stop loss placement, if you want to take a more technical approach towards it, consider the Average True Range. The ATR calculates the average daily movement and can help you determine how far to set your stop loss based on the day’s volatility.
Bearish Engulfing Pattern vs Bullish Engulfing Pattern
The bearish and bullish engulfing bars are both reversal patterns that are polar opposites of each other. While both patterns have a second larger candle, the bearish engulfing pattern specifies that the second candle must be red (Bearish), while the bullish engulfing pattern specifies a green candle (Bullish).
A bearish engulfing pattern is found at the peak of an uptrend, while a bullish engulfing pattern is found at the bottom of a downtrend. These engulfing patterns are one of the easiest patterns to find in trading thanks to their simplicity.
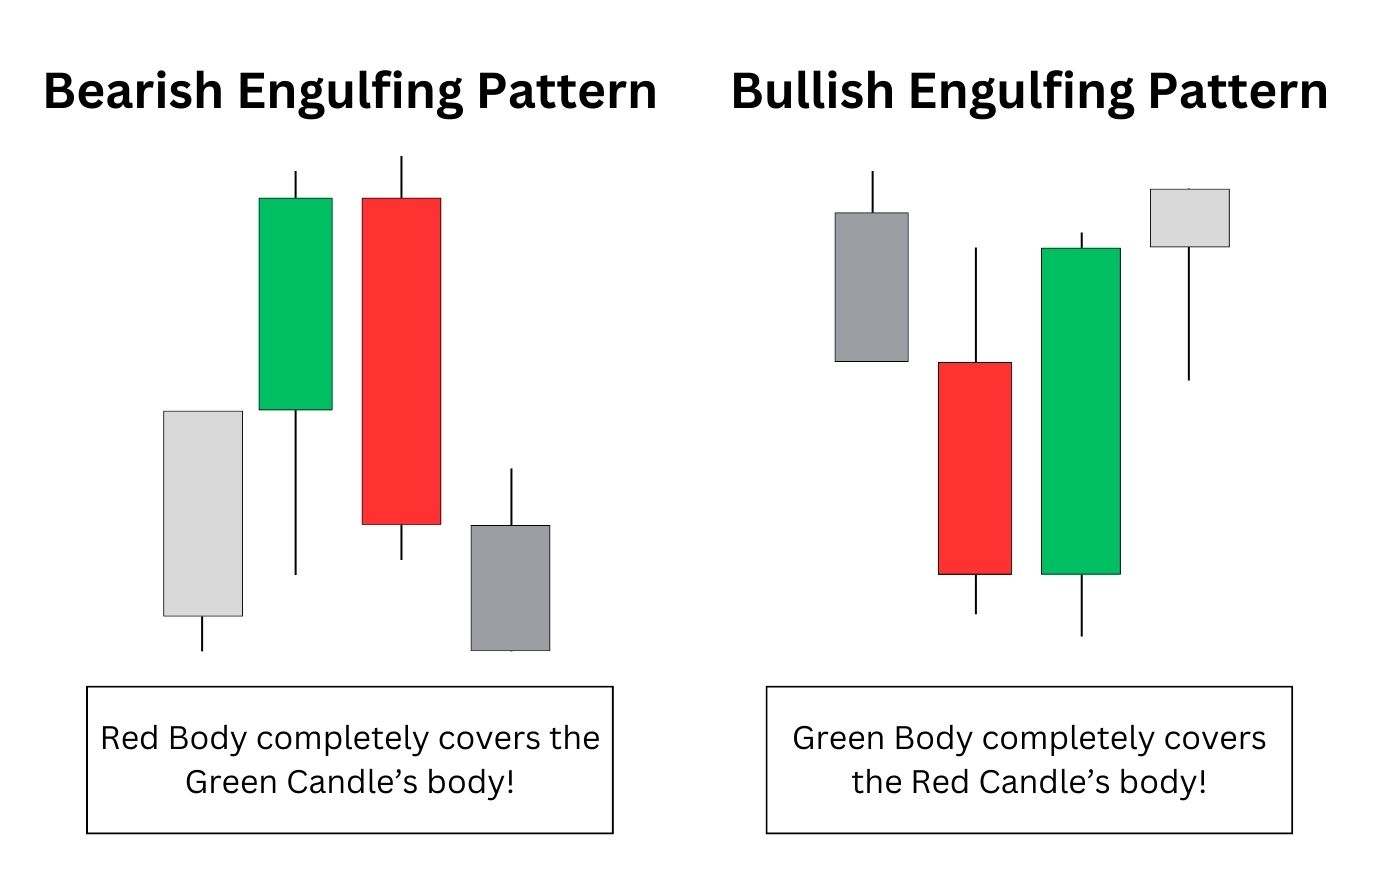
According to Liberated Stock Trader’s research, a bearish engulfing pattern has a 57% success rate in signifying an incoming price decline. Conversely, the bullish engulfing pattern signifies a price rise, and is accurate only 55% of the time.
Bearish Engulfing Pattern vs Bearish Harami Pattern
Like the bearish engulfing pattern, the bearish harami pattern is a reversal pattern that appears at the top of an uptrend. It signals an imminent price decline is also a two-candlestick pattern.
Similarly, the bearish harami pattern has an initial green candle. However, where the harami pattern differs is in its second candle – instead of a larger red candlestick that completely engulfs the first green candle, there is a red inside bar candle formed.
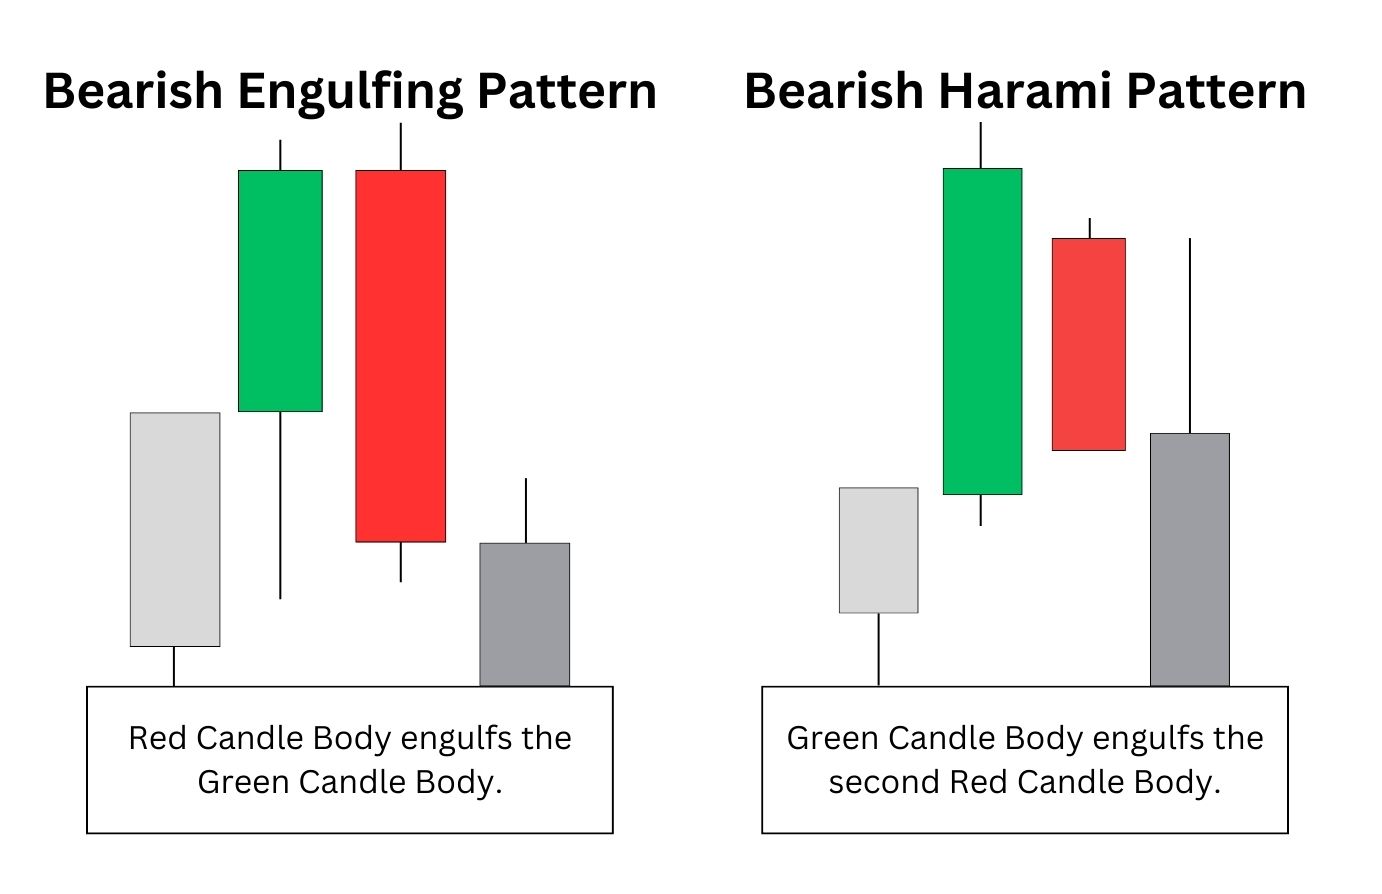
This pattern signifies that buyers have attempted to push the prices higher, but sellers have stepped in to contain the price below the first candle’s highs. When formed at a resistance, the bearish harami pattern becomes a much stronger signal, and that prices could continue to drop lower.
FAQ
How often does the bearish engulfing pattern happen?
The bearish engulfing pattern appears quite frequently in the chart, especially on lower time frames such as the 1H, 30m, and 15m or lower. However, its significance can be weaker when appearing on lower time frames, and therefore should be traded with conservative bearish targets.
According to Thomas Bulkowski, a renowned technical analysis expert, his research found the bearish engulfing pattern to be ranked #11 in frequency. This indicates that the bearish engulfing pattern occurs quite frequently.
Who first identified the bearish engulfing pattern?
The origins of candlestick charting and its patterns date back to 18th century Japan to a humble rice trader by the name of Munehisa Honma.
Honma used his ingenious charting system to time the markets, and understand the psychology of rice traders in the market. Fast forward to today, the Japanese candlestick system has become a cornerstone in technical analysis, with many patterns emerging from other traders sharing their discoveries.
It is likely the bearish engulfing pattern was discovered over time by traders, and is now adopted as a staple pattern in candlestick trading.
How reliable is the bearish engulfing pattern?
The reliability of the bearish engulfing pattern is overall ranked highly. According to Liberated Stock Trader, a technical analysis research group, this pattern has a 57% success rate on the daily time frame across 568 years of data. Thomas Bulkowski, another renowned analyst, shared that the pattern has a 79% success rate according to his findings.
No matter which data point you prefer to believe, it is still important to remember that the bearish engulfing pattern is not a 100% guaranteed signal that the markets will turn – nor is it the perfect signal in terms of timing. Traders are advised to combine other technical indicators and techniques to optimise the way they trade the bearish engulfing pattern.
How do I confirm the bearish engulfing pattern signal?
The bearish engulfing pattern is technically confirmed once the second candle has successfully closed, with a lower closing price, than the first candle’s low.
Another method is waiting for a third bearish candle to further confirm your bearish bias. This is, of course, at the cost of your entry level becomes significantly weaker, resulting in a poor risk-to-reward ratio.
Most traders instead opt to use technical indicators such as the RSI, MACD, MFI or CCI to find bearish divergences to further confirm the bearing engulfing pattern
What is the best time frame to use for the bearish engulfing pattern?
There is no ‘best time frame’ for trading the bearish engulfing pattern. However, longer time frames like the daily or weekly candles tend to produce stronger signals, These stronger signals indicate a more powerful downturn, providing a better RRR (Risk-to-reward ratio) and lower risk of a false signal.
Another factor to take into account is the general, overarching trend. If the asset is in an overarching uptrend, the bearish engulfing pattern may only be signalling a small pullback before a major continuation. However, in a downtrend, there is a much higher chance that the pattern will lead to a major continuation of the downtrend.
Does the colour of bearish engulfing candlestick patterns matter?
The colour of the bearish engulfing candlestick pattern does matter, as it is a key characteristic of the pattern to have a second, larger red candle.
Can a bearish engulfing pattern occur in both uptrends and downtrends?
The bearish engulfing pattern only appears at the end or peak of an uptrend. There must be an obvious price move up, only to have the bearish engulfing pattern emerge. If the bearish engulfing pattern appears at the end of a downtrend, it isn’t technically a bearish engulfing pattern, but can still be a bearish indication if it is breaking a significant support level.
However, it is important to understand that a bearish engulfing pattern can emerge as part of a major uptrend. This means that when you zoom out, the markets are clearly moving higher, with higher highs, and higher lows. In these instances, the bearish engulfing pattern may only produce a small pullback to support levels, only for the overarching bullish trend to continue.
Can the bearish engulfing pattern be used in scalping or short-term trading strategies?
Yes, the bearish engulfing candlestick pattern can be used in scalping or short-term trading strategies. However, it’s true efficacy lies in reading the price action on a higher time frame, like the Daily or Weekly.
A scalp strategy could function like the Bollinger Bands strategy, where traders would take a trade from the upper bands and scalp back to the SMA 20, or to the lower bands. The bearish engulfing pattern in this case, would act as an entry signal for the short trade.
Is bearish engulfing candlestick profitable?
With the right risk management and good take profit placement, the bearish engulfing candlestick can be profitable. If you took trades simply with the formation of the bearish engulfing pattern itself, even with a 1:1 risk-to-reward ratio, you should generally be profitable as the win rate is over 50%.
Is bearish engulfing candlestick a double candlestick pattern?
Yes, the bearish engulfing candlestick is a double candlestick pattern. A double candlestick pattern is typically when two candlesticks emerge, but have opposing price action.
The first candlestick is typically in the opposite direction of the second candlestick, creating a scenario where a trend reversal is hinted at. By combining this signal with other technical indicators, traders can determine how likely the reversal is to happen.


