


Written by:

Reviewed by:

Bearish
Bullish
- February 20, 2026
- 17 min read
14 Continuation Patterns Traders Use to Ride Strong Trends
“Winners keep winning, losers keep losing.”
While to some this phrase might be a simple motivational line or a lament for a losing streak, it describes a powerful phenomenon that repeats itself in the financial markets.
Even now, it’s commonly taught to beginner and veteran traders alike to trade with the trend — The trend is your friend, until the end.
But is this market wisdom simply a cherry-picked observation? No!
Thomas Bulkowski, the legendary technical analyst, answered that question by transforming this subjective insight into a rigorous, evidence-based science. He used a massive database of historical market data and backtested the success of chart patterns, ranking them and providing empirical evidence to quantify their success.
Bulkowski’s extensive research proves that continuation patterns like flags, pennants, and triangles have a statistically significant tendency to continue a prior trend, helping traders enter moves with greater confidence.
In this article, you will learn how to spot 14 of these powerful patterns across stocks, forex, and commodities. These patterns apply well in forex, when trends can persist for an extended period of time.
What is a Continuation Pattern?
A continuation pattern indicates that a price trend is expected to maintain its direction following a brief interruption. Rather than reversing, the market pauses briefly before continuing along its earlier trajectory. Such patterns occur when traders solidify their positions, resulting in a temporary slowdown of price movement before momentum resumes.
How to Identify the Continuation Pattern?
Look for a temporary price stall that doesn’t break the existing trend structure. The pattern often appears in the middle of a trend, with price moving sideways or slightly against the trend before picking up in the original direction. Volume often decreases during this pause and increases when the pattern completes.
Key Elements In A Continuation Pattern
- Existing Trend – The pattern must form within an ongoing trend.
- Consolidation Phase – Price moves within a defined range instead of making strong directional moves.
- Breakout Confirmation – The trend resumes once price breaks out of the pattern with increased volume.
Continuation Pattern Example

As mentioned above, a continuation pattern suits the following parameters: follows the existing trend, has a consolidation phase, and then a breakout — which confirms the continuation.
Notice in our example here, a consolidation period occurs after an impulsive uptrend. This is a bull flag, one of the many continuation patterns you can spot in trading. The continuation is confirmed when the price shifts out of the pattern, in the original direction of the existing trend — in this case, a bullish uptrend.
Continuation Patterns Cheat Sheet
Stay in sync with the trend using our Continuation Patterns PDF, a quick-reference guide that highlights the setups to keep you trading with momentum. From flags and pennants to triangles, this resource shows you how to recognize when price is likely to push further in the same direction.
Download the Continuation Candlestick Patterns PDF free and level up your ability to ride trends with confidence.
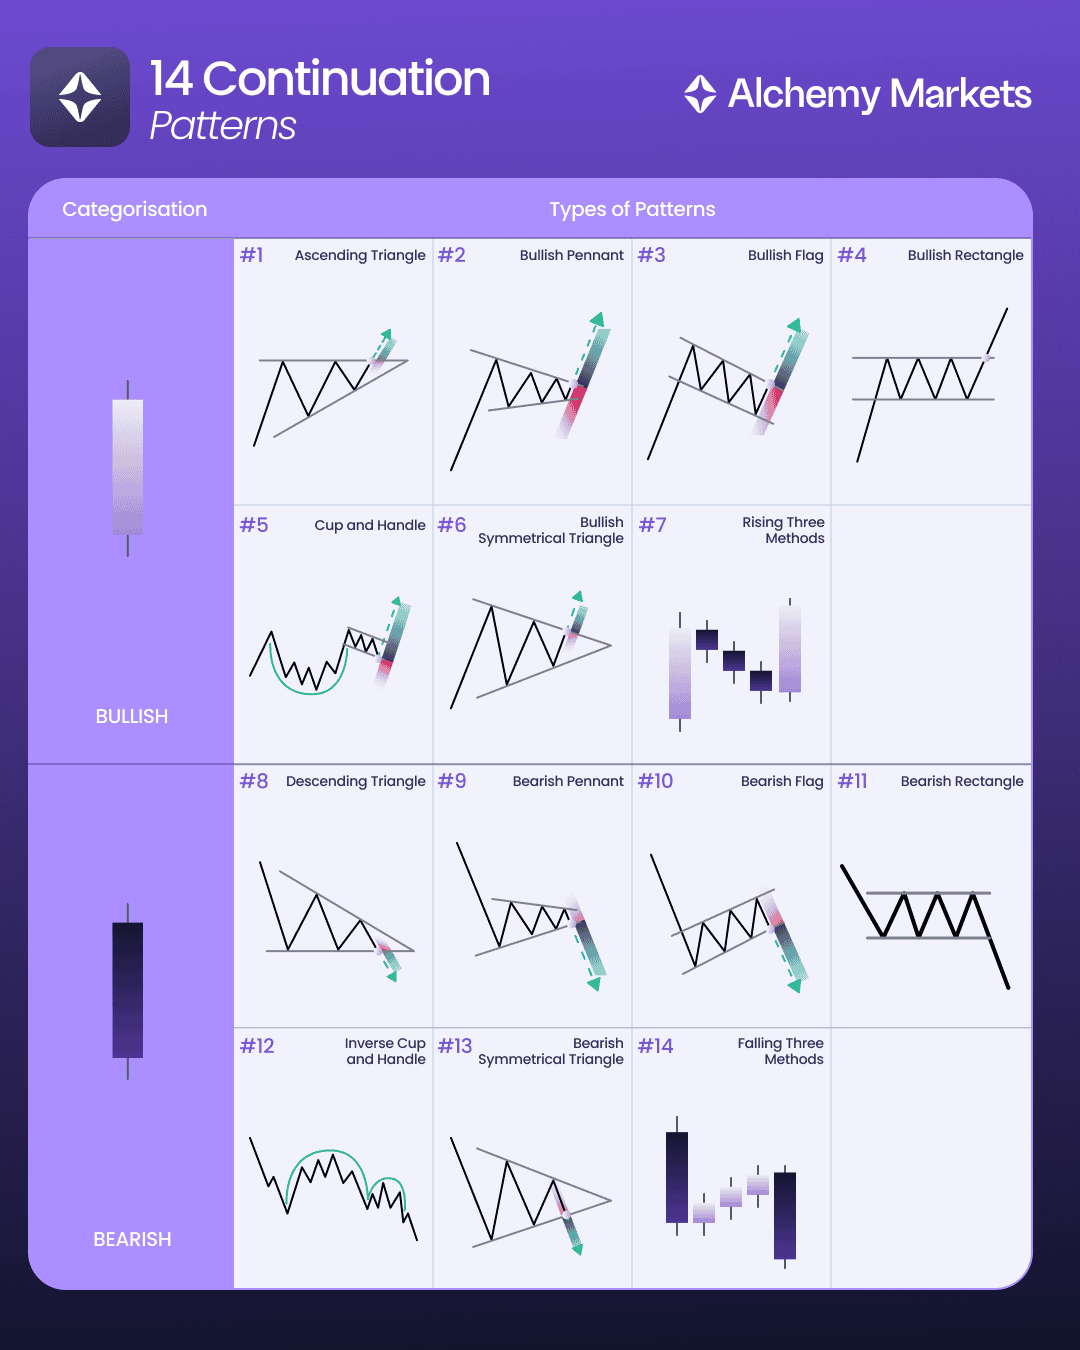
Bullish Continuation Patterns
Here are 7 bullish continuation patterns to add to your playbook with real historical examples. Notice how they span from various asset classes and timeframes; this highlights the versatility of these patterns.
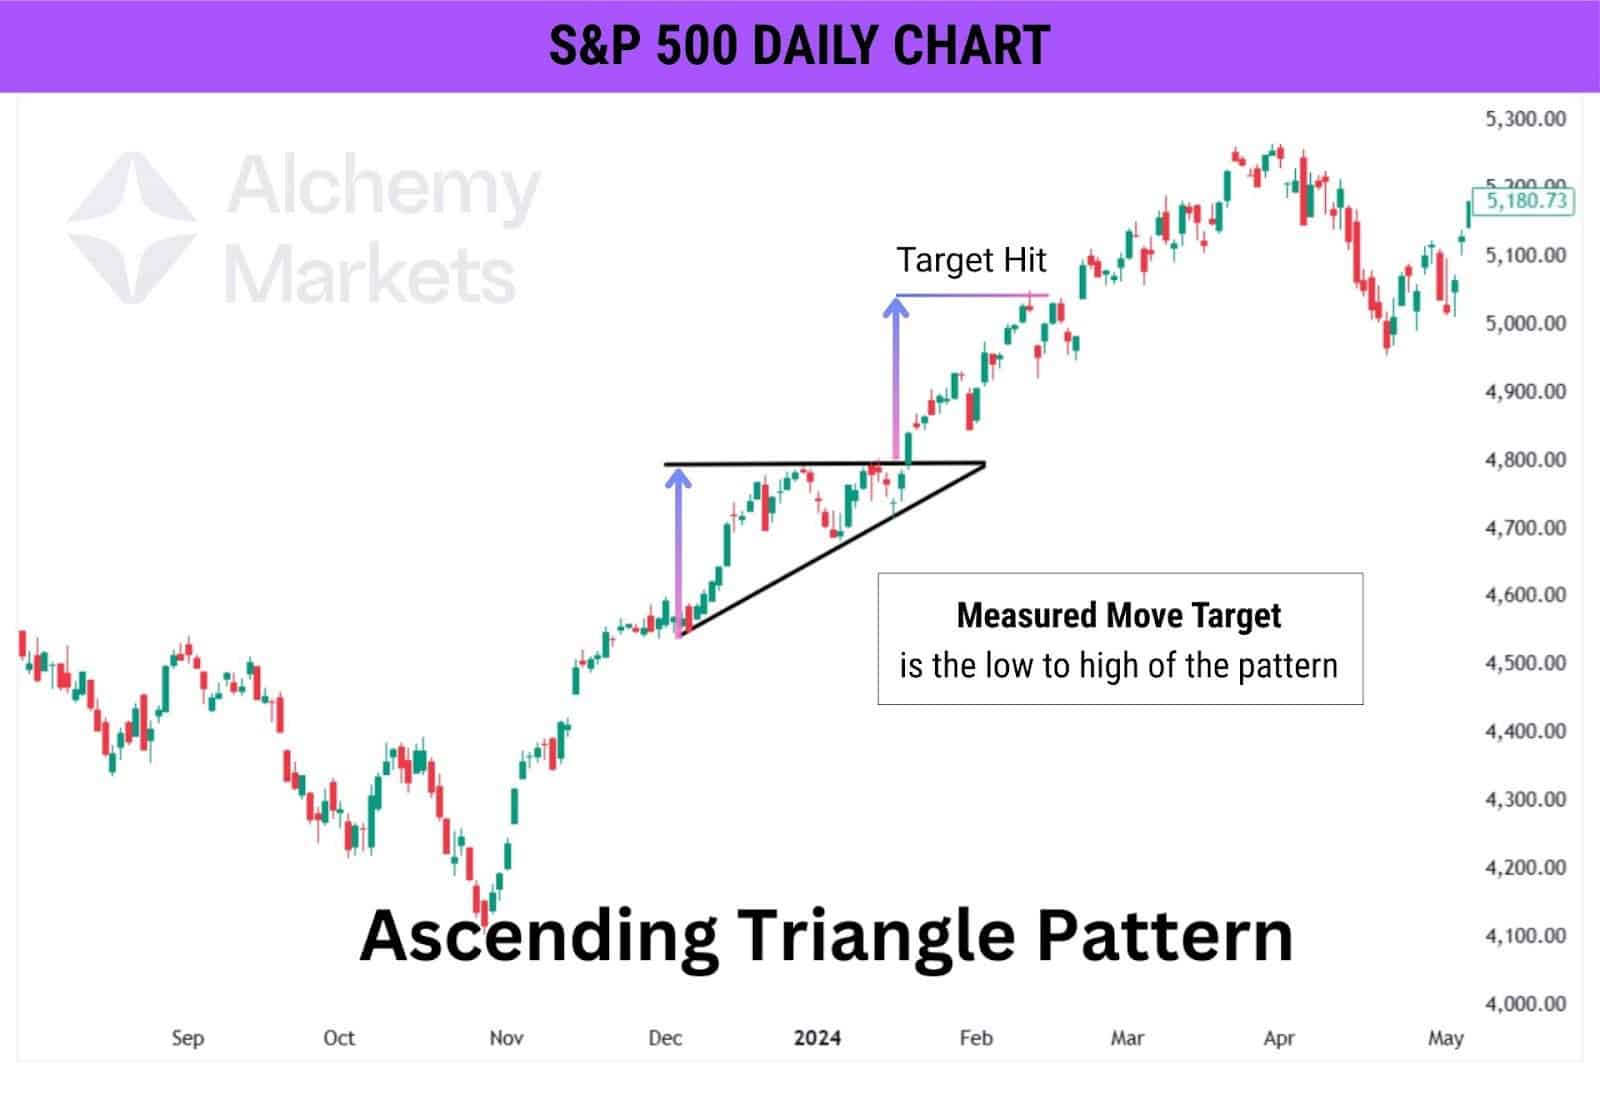
1. Ascending Triangle Continuation Pattern
What is the pattern about?
When the price repeatedly tests a specific resistance level while forming higher lows, an ascending triangle pattern emerges. This pattern, characterised by a flat top and a rising bottom, signals that buyers are steadily pushing prices upward. Typically, a substantial uptrend follows a breakout above the resistance level.
The expected target is known as the measured move target (MMT). For an ascending triangle, the MMT is equal to the height (from low to high) of the pattern. We then project this distance from the breakout point to estimate the breakout target.
When to use it?
During an uptrend, the price struggling with a clear resistance may revisit it while creating higher lows. When this happens, traders should be alerted to not look for a double top, but rather begin to consider a continued breakout.
Stop Loss Placement
Stop loss is placed below the upward sloping support trend line of the triangle.
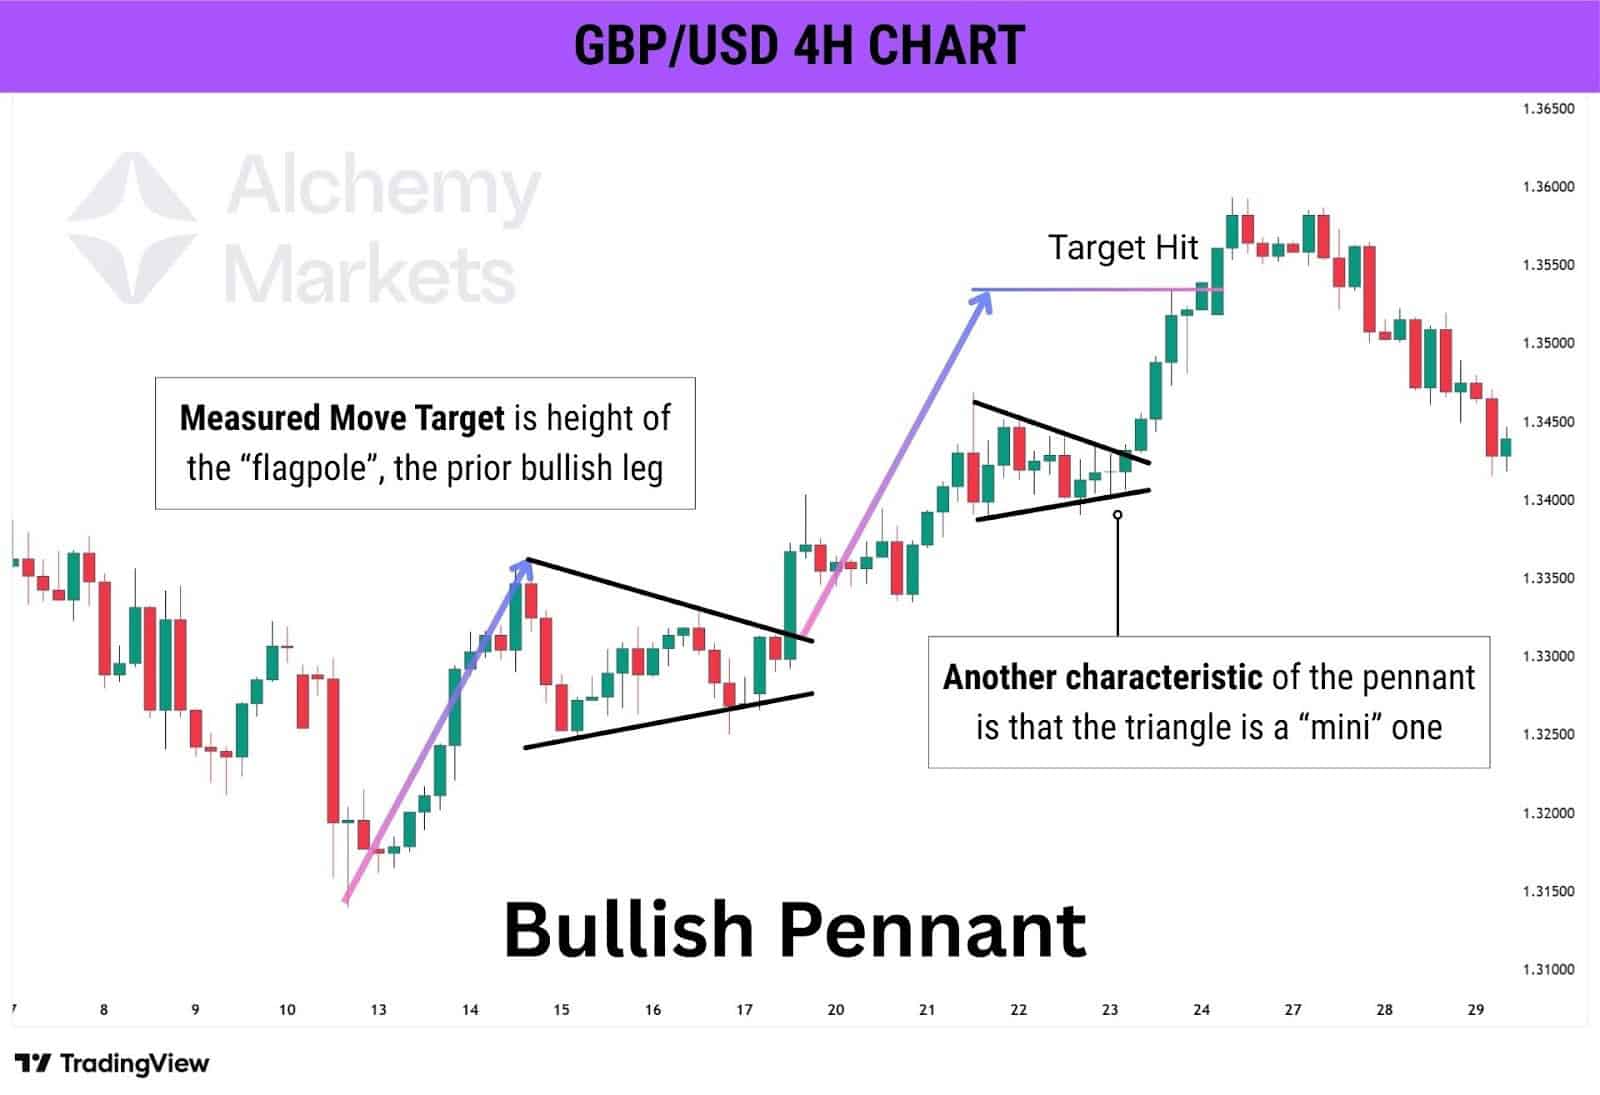
2. Bullish Pennant Continuation Pattern
What is the pattern about?
A bullish pennant appears after a strong upward move that pushes price into a new high. At the top of this impulse, price consolidates into a small symmetrical triangle, where lower highs and higher lows form.
If the trendlines are extended, they converge, showing compression before the next move. Once the pennant breaks, price typically continues in the direction of the prior impulse.
For a pennant, the MMT equals the height of the “flagpole” — the initial bullish impulse’s height.
When to use it?
Traders employ this pattern after the price experiences a significant upward movement, succeeded by a short pause characterised by low volatility. The breakout, usually aligned with the previous trend, indicates that the trend is continuing.
Stop Loss Placement
Stop loss is placed below the higher low of the pennant pattern prior to when the price breaks higher.
3. Bull Flag Continuation Pattern
What is the pattern about?
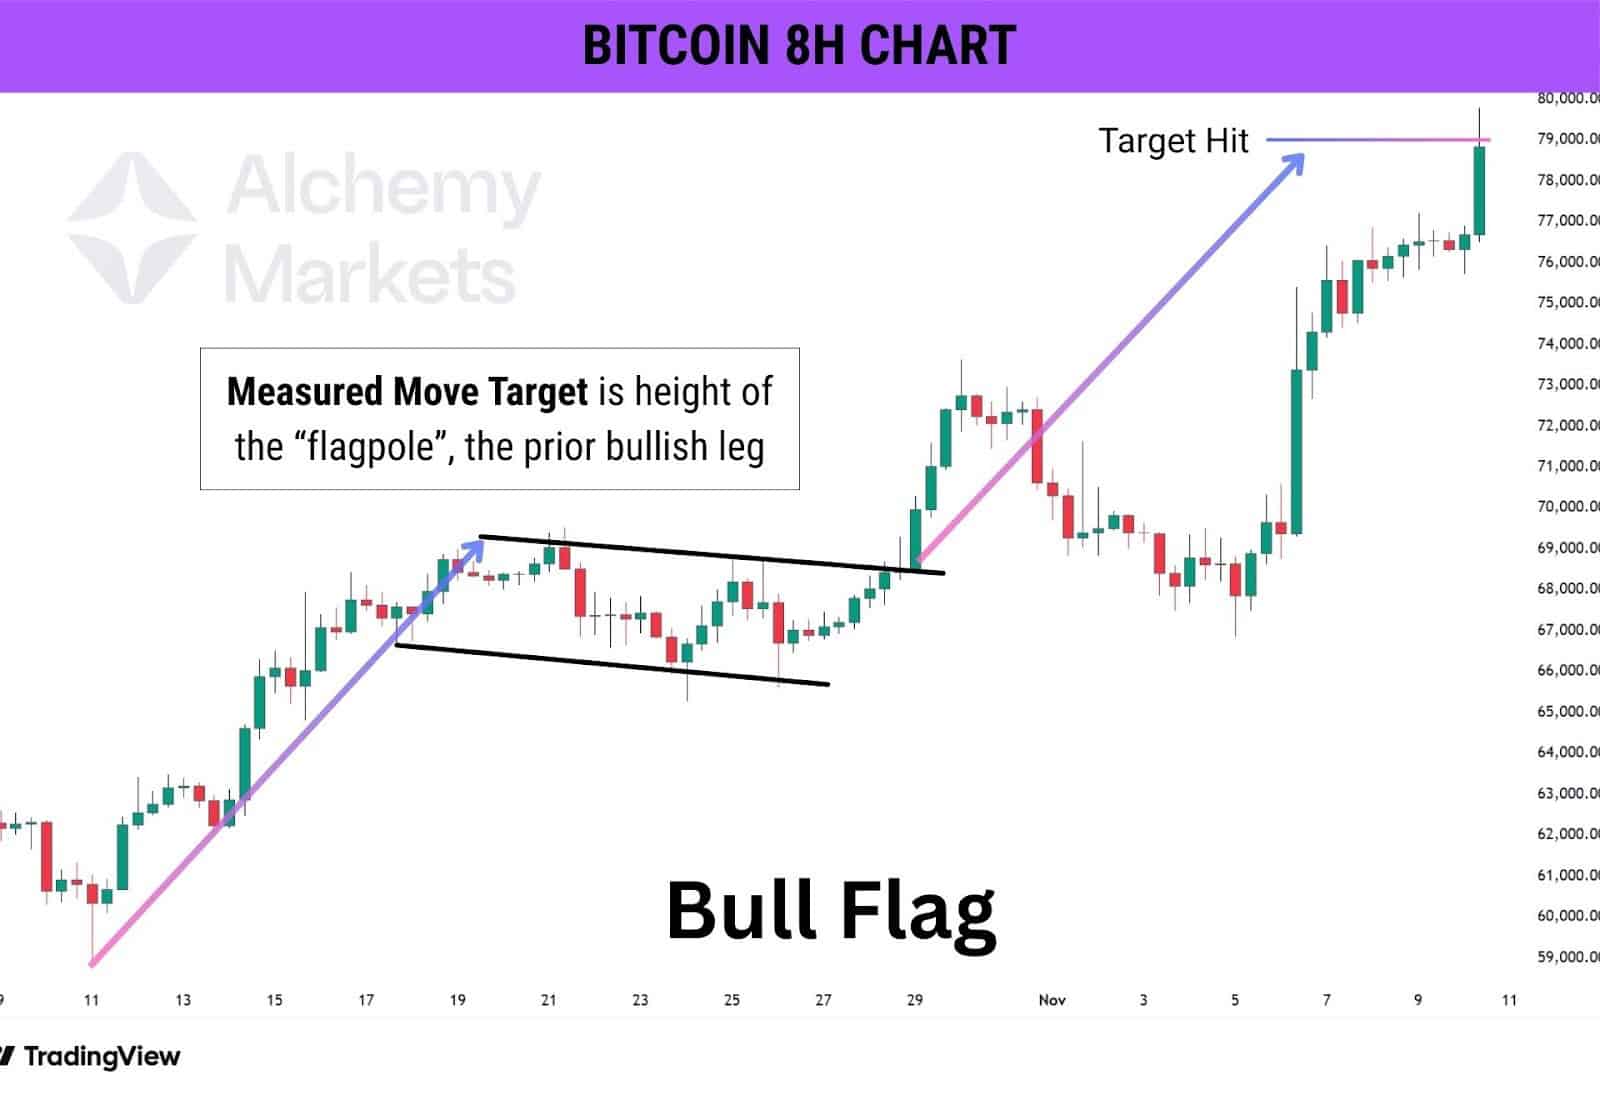
Like the pennant, a bull flag develops after a significant price surge, succeeded by a slight retracement that either declines or moves horizontally (creating the “flag”).
This pattern indicates a pause before the price continues its upward ascent. The flag shape shows temporary selling pressure, but as long as it stays within a controlled range, the breakout often leads to another rally.
For a bull flag, the MMT is equal to the flagpole, which is the impulse of the previous bullish leg.
When to use it?
Traders monitor this pattern when a brief consolidation occurs after a swift price rise. A move above the flag’s upper limit indicates that the trend is persisting, presenting a possible entry opportunity for long positions.
Stop Loss Placement
Stop loss is placed below the low point of the flag’s entire consolidation, or below the breakout candle (more risky but higher R:R).
4. Bullish Rectangle Continuation Pattern
What is the pattern about?
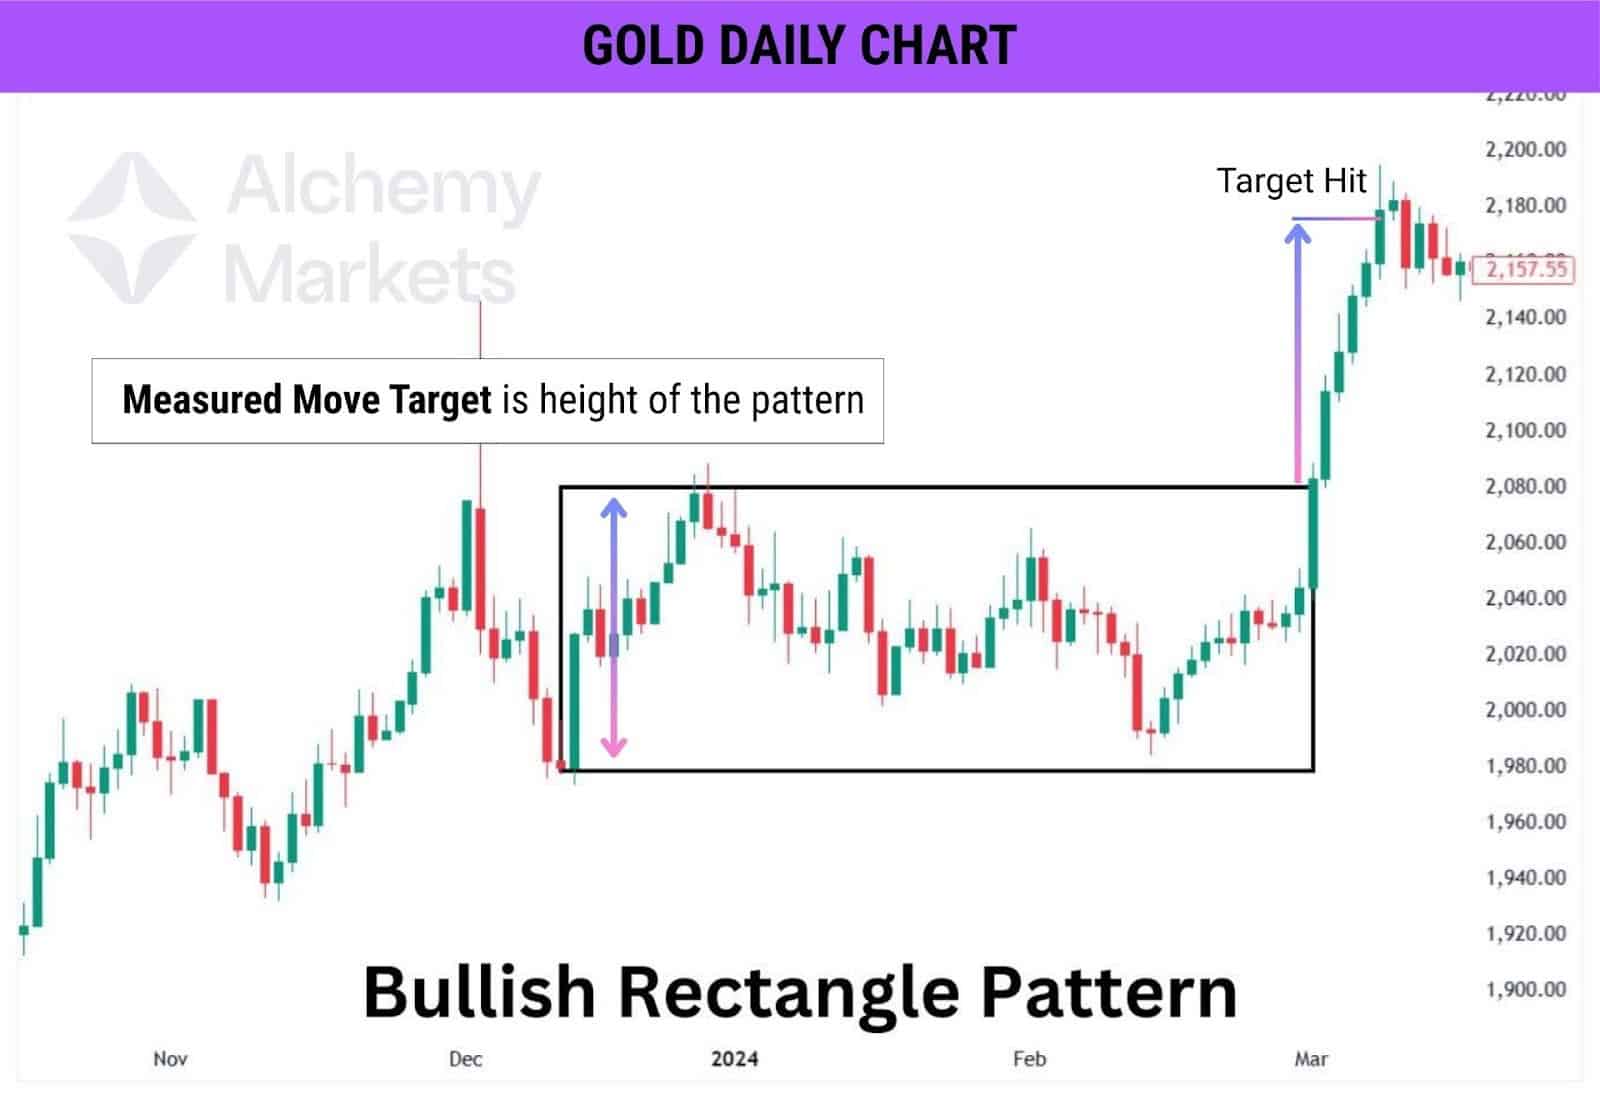
A bullish rectangle forms when price moves within a horizontal range between a fixed support and resistance level. It signals that buyers and sellers are temporarily balanced before the trend resumes.
The key feature is that price doesn’t make new lows, suggesting that bulls are maintaining control.
For a bullish rectangle, the MMT is equal to the height of the pattern.
When to use it?
Traders use this pattern when price consolidates in a tight range after an uptrend. A breakout above resistance, backed by strong volume, confirms that the trend is continuing.
Stop Loss Placement
Stop loss is placed below the recent swing low of the entire pattern’s consolidation.
5. Cup and Handle
What is the pattern about?
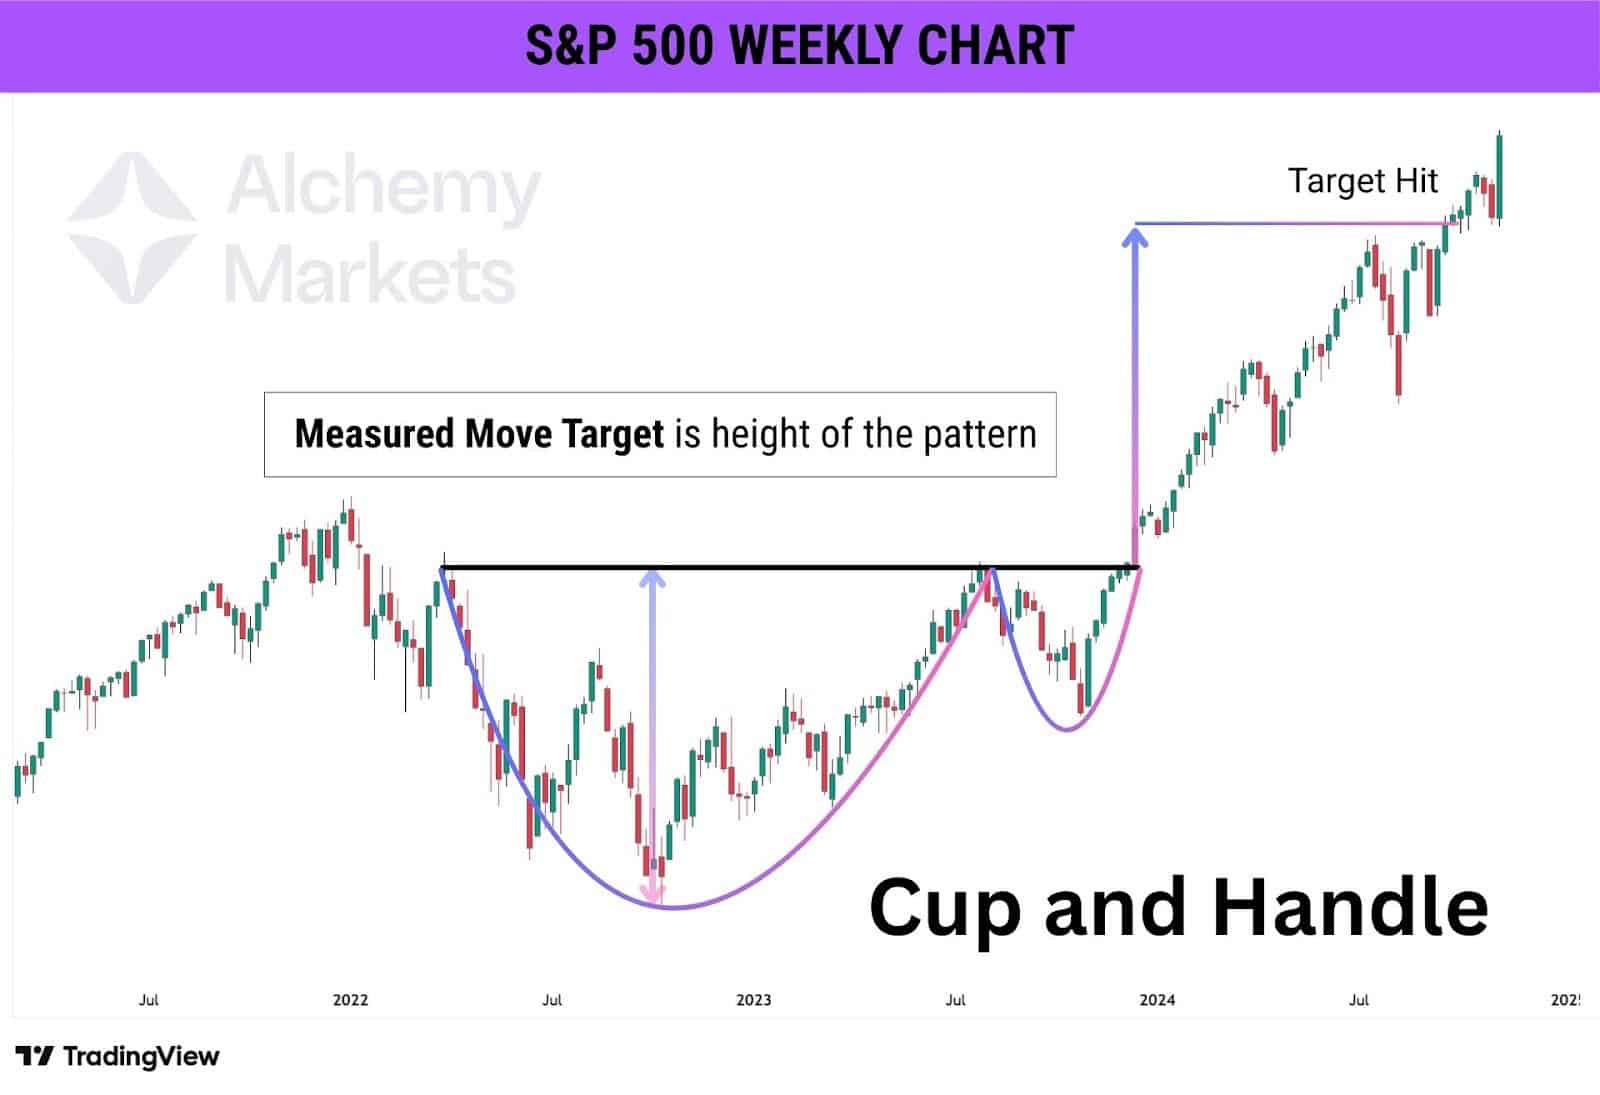
A cup and handle chart pattern looks like a rounded bottom (the cup) followed by a small dip (the handle). This cup handle pattern signals that the market is gathering strength before breaking out higher. The curved base shows buyers gradually taking control, while the handle represents a short pullback before the next upward move.
For a cup and handle pattern, the measured move target (MMT) is equal to the full height of the pattern. This isn’t measured from the resistance down to the curve of the cup, but rather from the resistance to the lowest low within the pattern.
When to use it?
Traders look for the cup handle pattern when the price is recovering from a significant downtrend and forming a smooth rounding bottom. The breakout above the handle confirms a strong buying signal.
Stop Loss Placement
Stop loss is placed below the low of the handle.
6. Bullish Symmetrical Triangle
What is the pattern about?
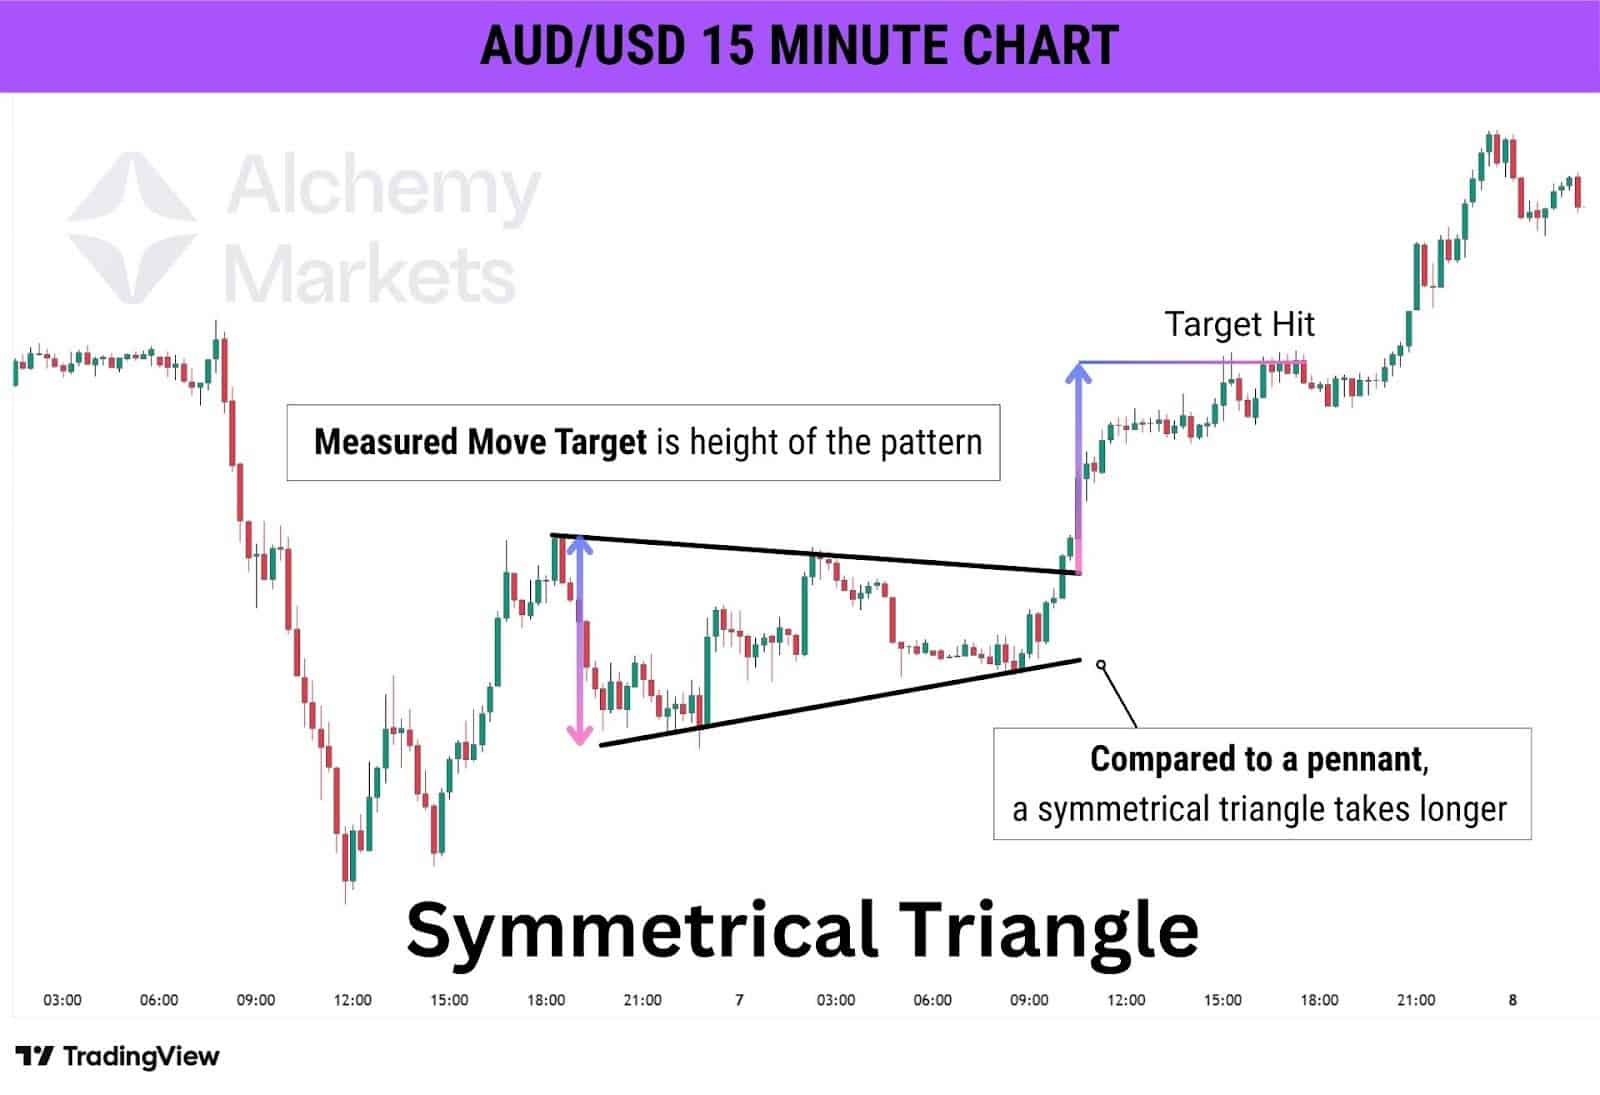
A bullish symmetrical triangle is a formation that occurs when the price has lower highs and higher lows to form a triangular shape with converging lines. This trend is a sign of a brief stalemate in the market, where nobody is clearly in control of the market. Eventually, the price breaks out in the direction of the prevailing trend—often upward in a bullish scenario.
A symmetrical triangle differs from a bullish pennant in both size and structure. The triangle is larger, with price retracing deeper into the prior impulse and showing greater volatility. It also takes longer to form before the eventual breakout, unlike the tighter, shorter pennant.
For a symmetrical triangle, the measured move target (MMT) is based on the height of the consolidation pattern itself, rather than the distance of the flagpole.
When to use it?
Traders observe this pattern in an uptrend when the price settles without creating lower lows. A surge above the triangle verifies the persistence of the upward trend.
Stop Loss Placement
Stop loss is placed below the last low of the upward sloping support trend line of the triangle.
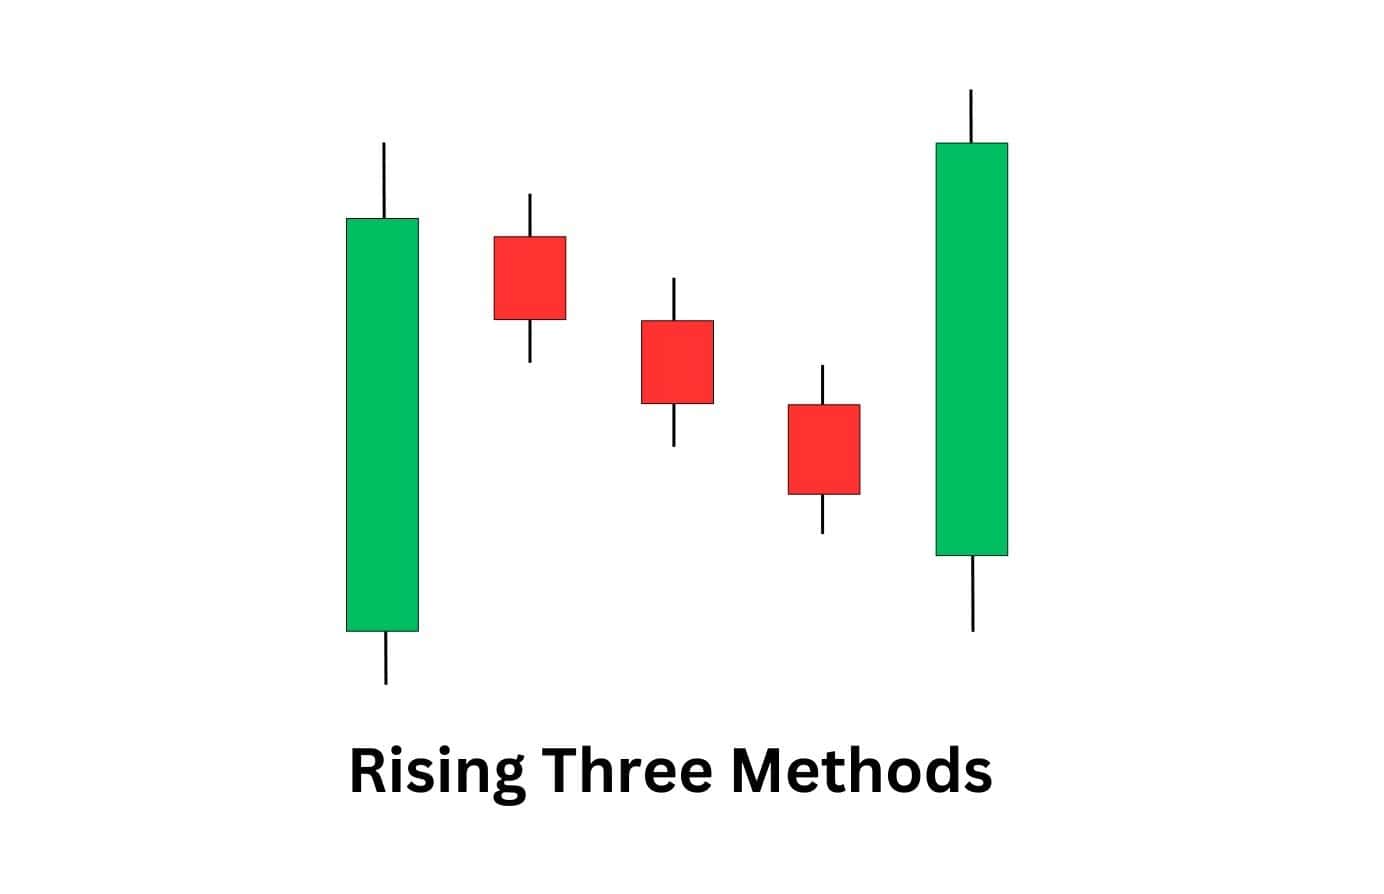
7. Rising Three Methods
What is the pattern about?
The rising three methods is a candlestick formation that features a robust bullish candle, succeeded by three or more smaller bearish candles, and concludes with another strong bullish candle. The tiny candles signify a managed retracement, whereas the last bullish candle validates the continuation of the trend.
When to use it?
Traders apply this pattern when a robust uptrend temporarily halts before resuming. The breakout of the last bullish candle above the prior high verifies that buyers are still in command.
Stop Loss Placement
Stop loss is placed below the low of the breakout candle, or the low of the consolidation within the pattern.
What is the Best Bullish Continuation Pattern?
The Bull Flag is regarded as one of the most dependable bullish continuation patterns. It emerges following a significant price surge (flagpole), succeeded by a short period of consolidation where the price shifts slightly down or sideways (flag). This pause allows the market to gather strength before the trend resumes.
Why It’s the Best
- Strong Prior Trend – A prior trend shows strength in the markets (in a particular direction), a continuation trades on that idea. Generally, it’s safer to trade with the trend, rather than against.
- Healthy Consolidation – Bullish continuation patterns typically move sideways or even a little lower. This tells us that despite multiple times to shift prices lower, the sell orders are constantly being bought up — eventually, breaking higher.
- Clear Entry and Risk Levels – Bullish flags, or pennants give us a clear entry and exit model. These aren’t hard rules, and they’re usually more of a help than a hindrance.
- Mid-Trend Positioning – Flags often appear near the halfway point of the move, giving traders confidence there’s still room left in the trend.
Traders watch for volume spikes at the breakout to confirm conviction in the continuation.
Bearish Continuation Patterns
Bearish continuation patterns signal that a downtrend is likely to continue after a temporary pause. These formations appear when sellers take a breather, allowing price action to consolidate before resuming its downward move. Traders use them to find re-entry points in an existing downtrend.
1. Descending Triangle Continuation Pattern
What is the pattern about?
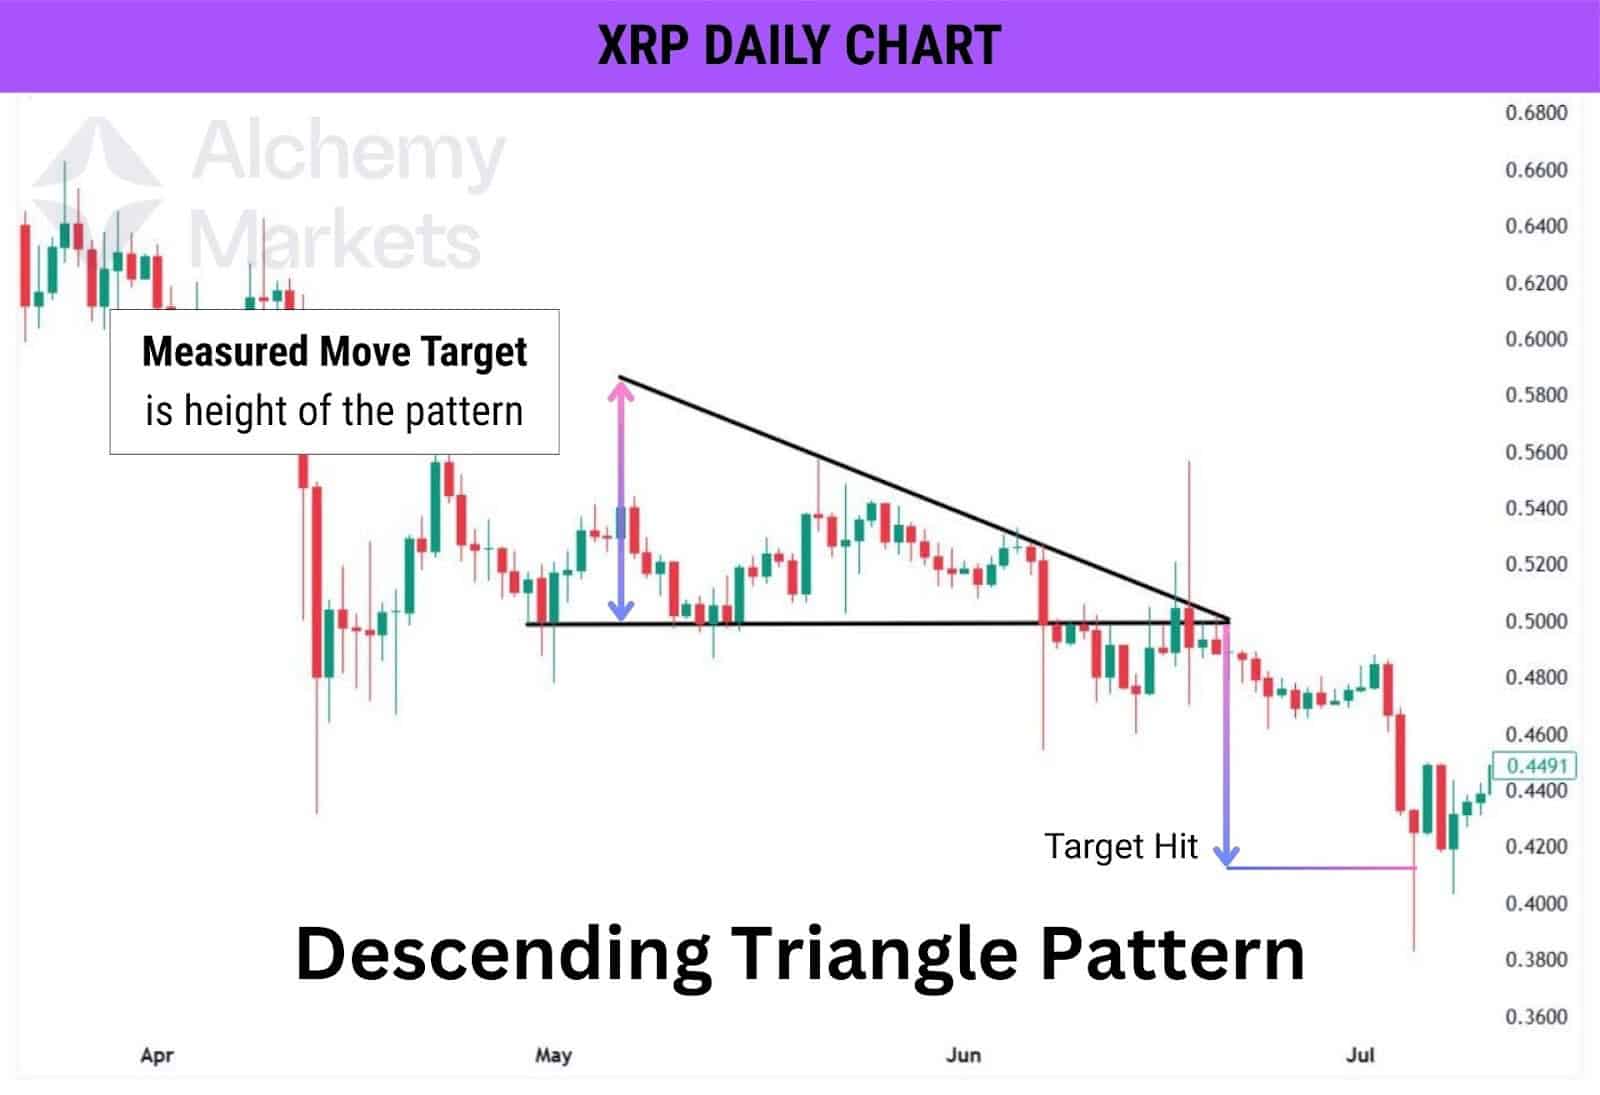
This setup signals that sellers are gaining control. Price forms lower highs while hitting the same support level multiple times, creating a triangle shape sloping downward. The consistent pressure near support suggests an eventual breakdown, confirming bearish momentum.
The breakout target (or MMT) of a descending triangle is measured by taking the highest high within the pattern, and minusing its lowest low. Then, apply that same distance at the support level to get a profit-taking zone.
When to use it?
It’s best applied in downtrends when price consolidates but struggles to bounce higher. A breakdown below support, especially with increased volume, validates the continuation of selling pressure. Traders often enter short positions once the support level is breached and retested.
Stop Loss Placement
Stop loss is placed just above the downward sloping resistance trend line of the triangle portion of the pattern.
2. Bearish Pennant Continuation Pattern
What is the pattern about?
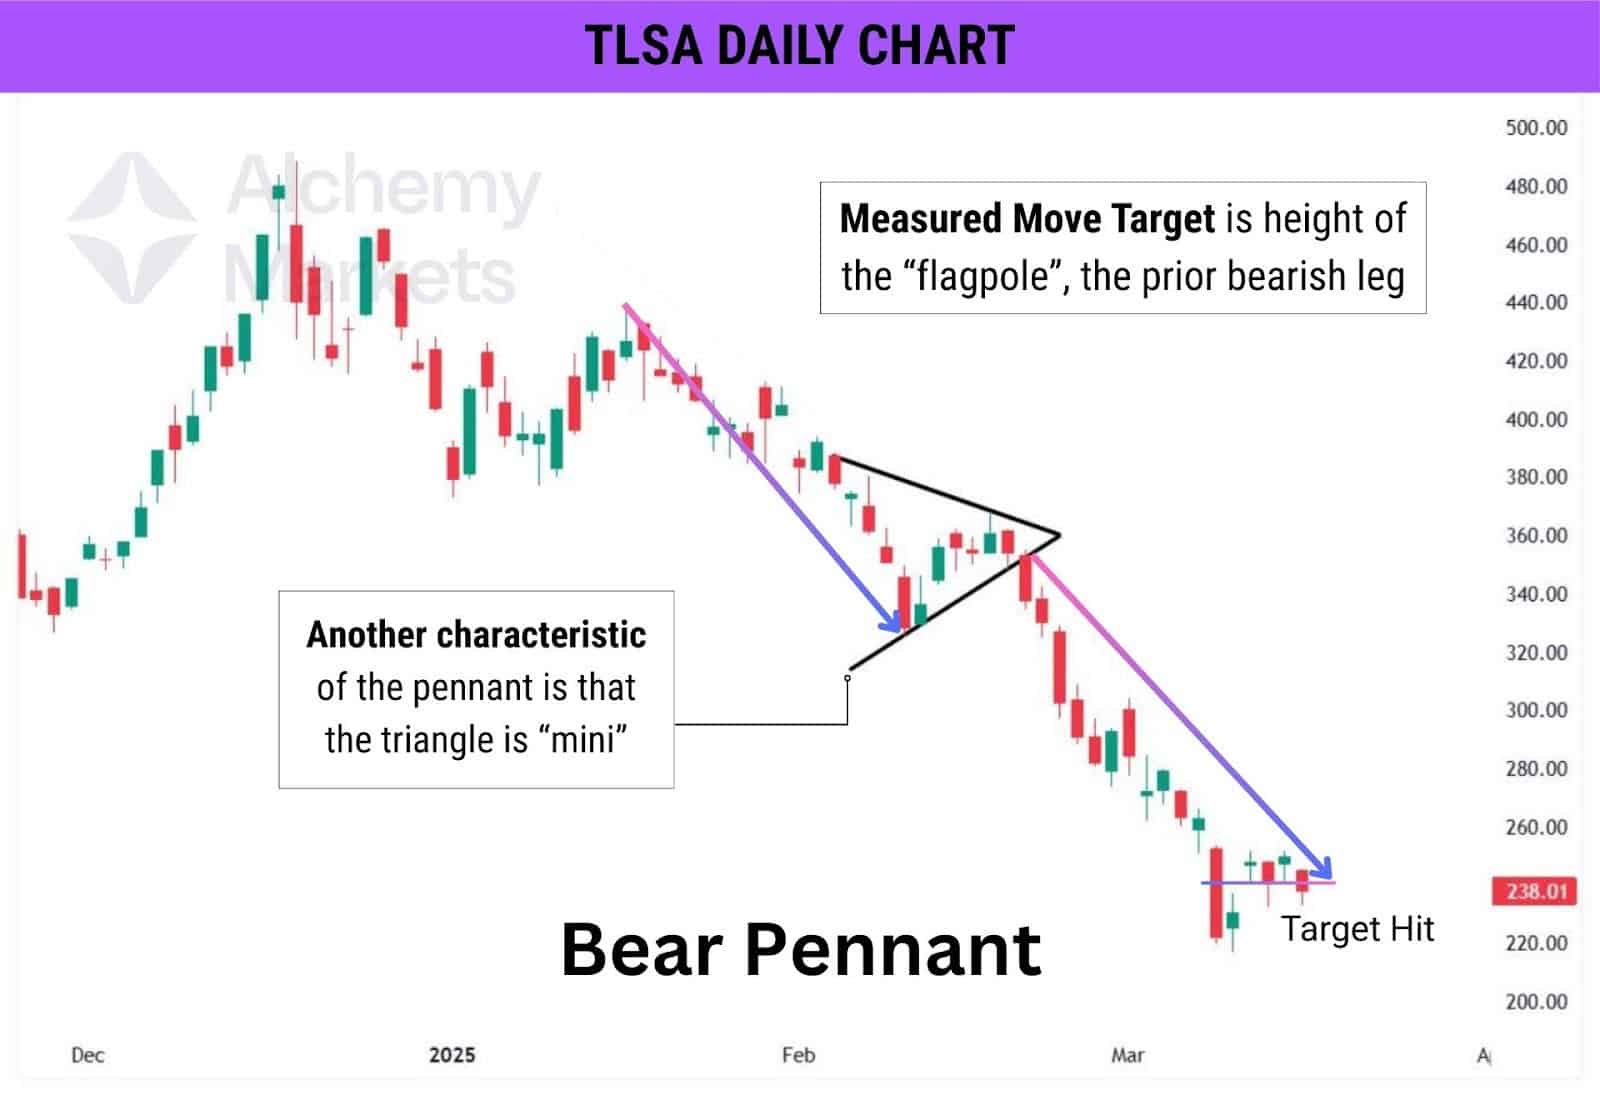
The bearish pennant is a brief pause before the next drop. After a sharp decline, price forms a small triangular consolidation where highs and lows converge shaping the pennant portion of the pattern. The bearish pennant reflects temporary indecision before momentum resumes in the same downward direction.
A bearish pennant’s breakout target is equal to its prior bearish impulse; also known as the flagpole in this instance.
When to use it?
The bear pennant is useful during strong downtrends when price takes a breather. A breakout below the pennant signals fresh selling interest, making it an ideal moment to consider short trades. The stronger the prior drop, the more reliable the pattern.
Stop Loss Placement
Above the entire pattern’s consolidation, or the most recent high.
3. Bear Flag Continuation Pattern
What is the pattern about?
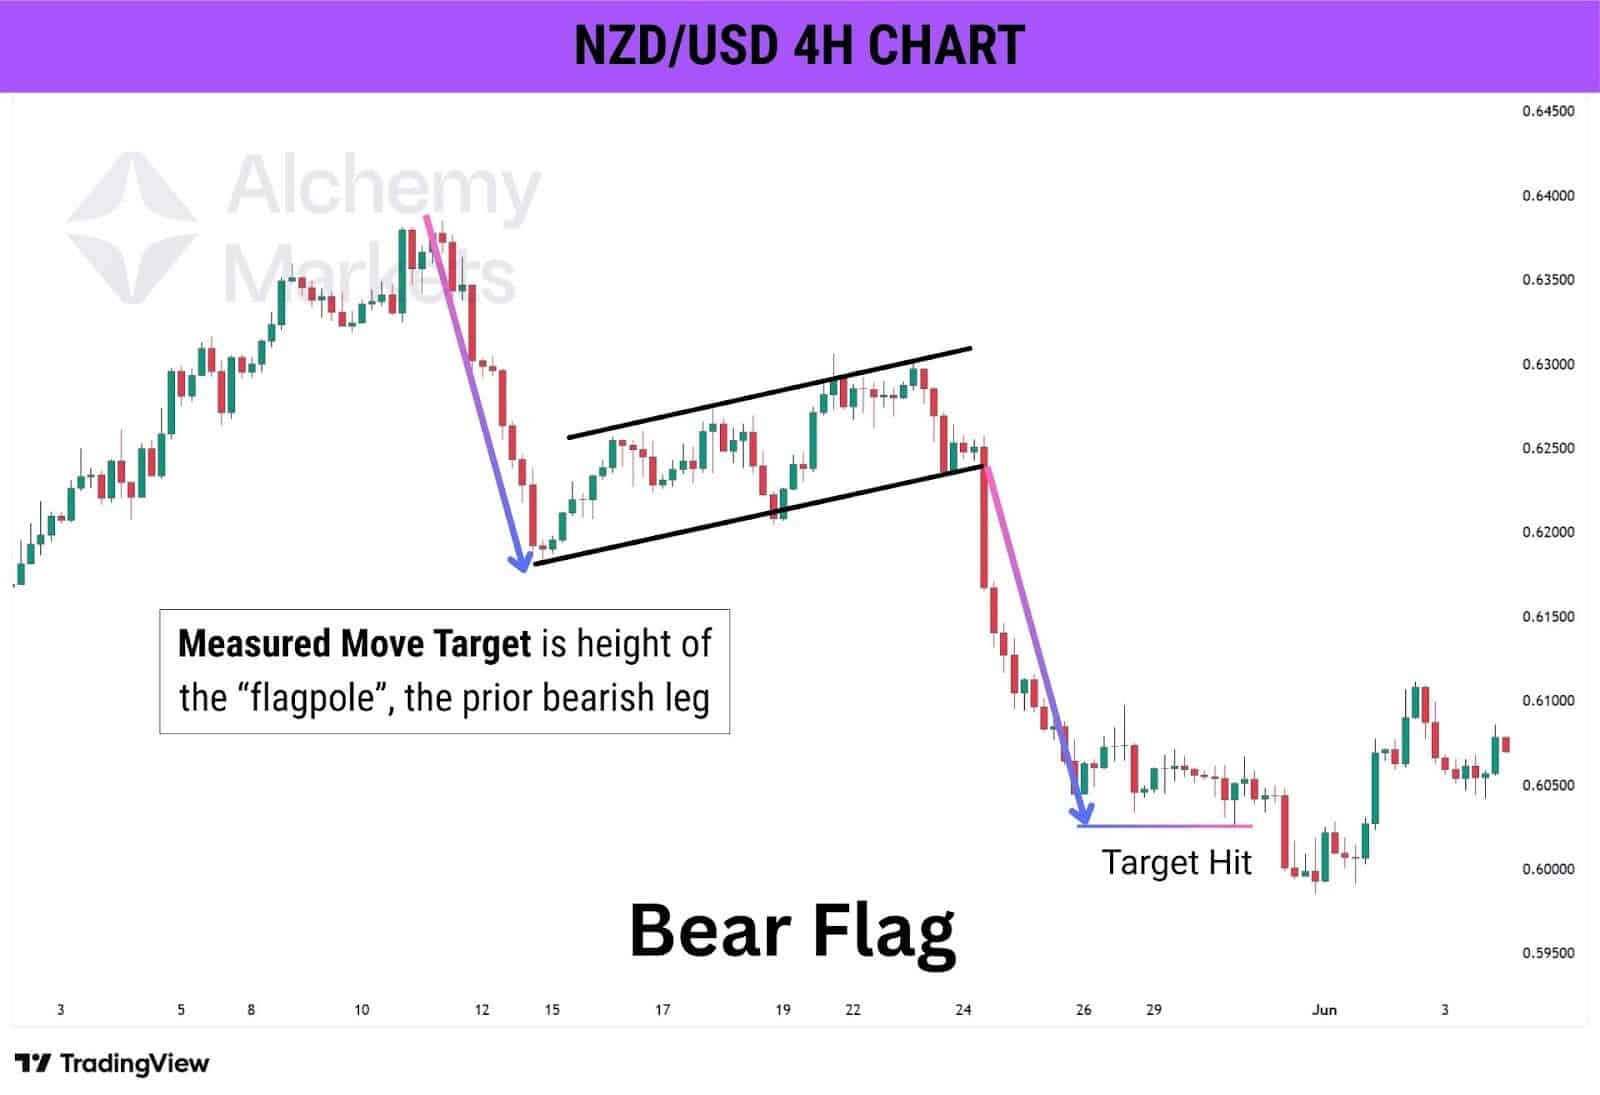
The bearish flag formation looks like a downward staircase. A sharp decline (flagpole) is followed by a slight upward slanting channel (flag), where price moves against the trend but lacks strength. The bear flag pattern signals a controlled rally before the next leg down.
For a bear flag, the MMT is equal to the “flagpole”, the prior bearish impulse leading up to the flag formation.
When to use it?
The bear flag is effective in established downtrends when price temporarily moves higher but stays within a defined range. A breakdown below the flag portion of the pattern confirms sellers are back in charge, often leading to another significant drop.
Stop Loss Placement
Stop loss is placed above the flag portion of the pattern prior to breakdown of price.
4. Bearish Rectangle Continuation Pattern
What is the pattern about?
This setup shows a tug-of-war between buyers and sellers, but with a bearish tilt. Price moves sideways between a horizontal resistance and support level, creating a rectangular shape. The lack of higher highs indicates that selling pressure is still dominant.
A bearish rectangle’s MMT is equal to the height of the pattern, suggesting a modest decline, but often leading up to more downside.
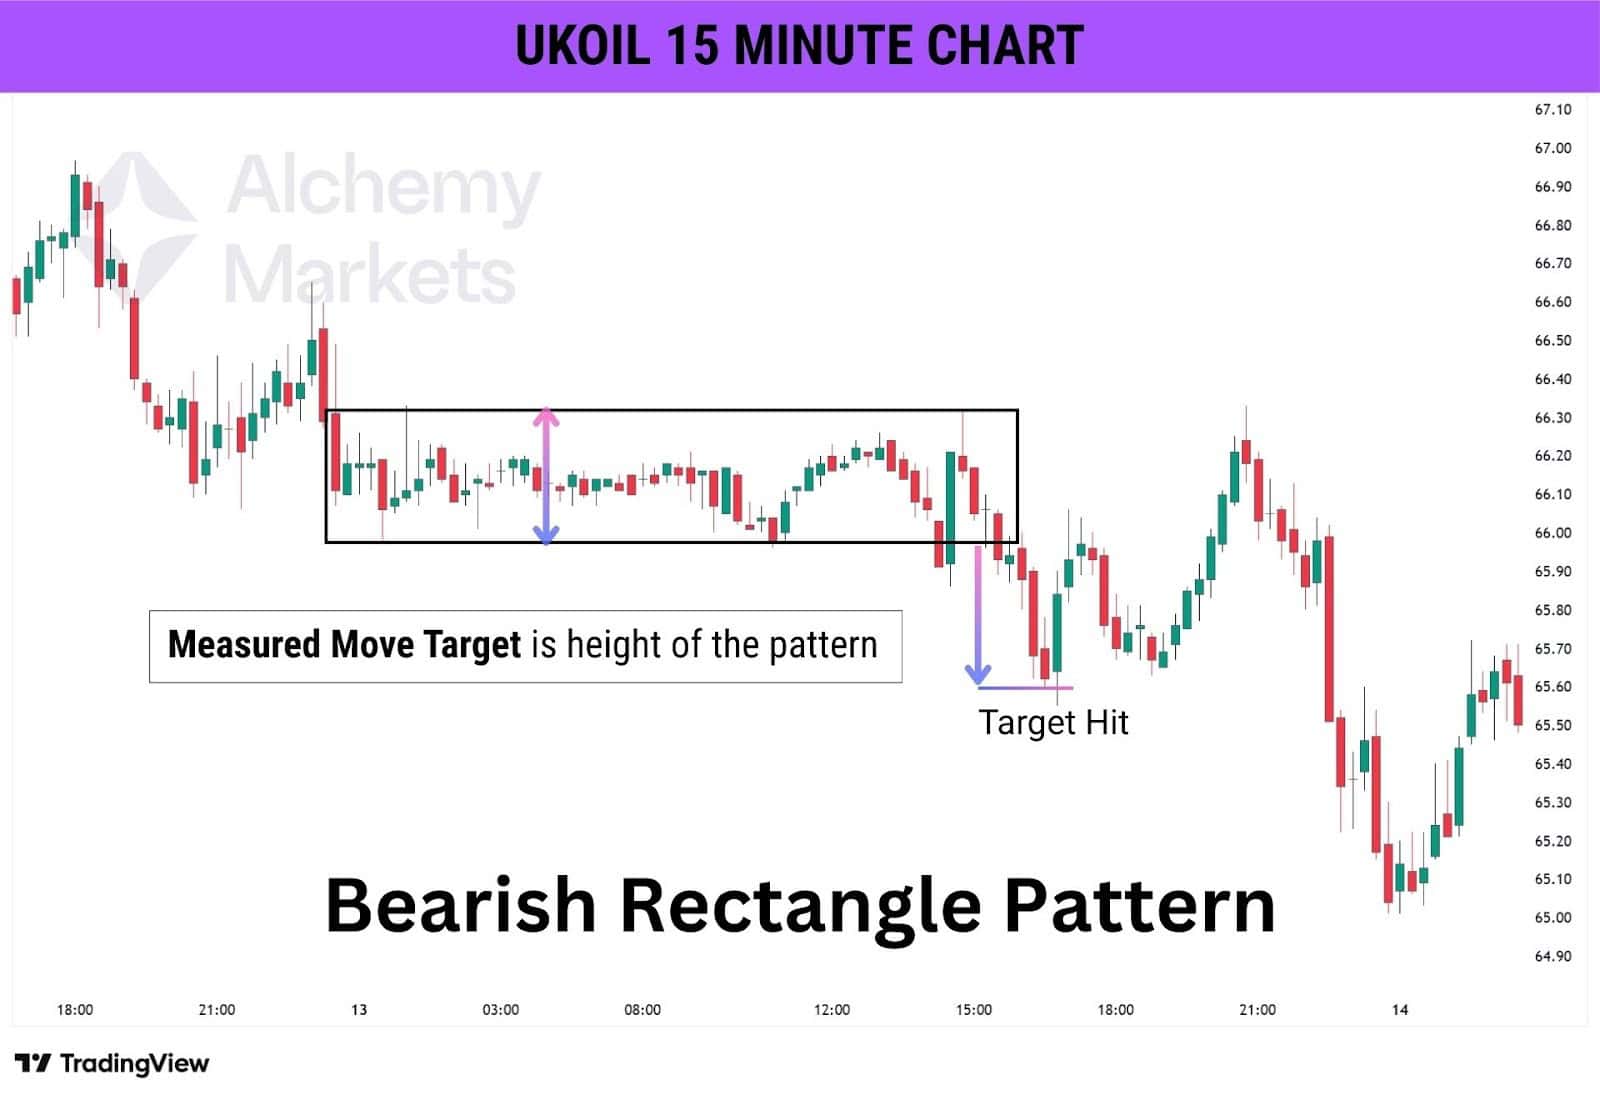
When to use it?
It’s most effective in an existing downtrend when price moves sideways before another leg lower. A breakout below the support level confirms sellers are ready to push price further down, making it an entry point for short trades.
Stop Loss Placement
Stop loss is placed above the entire pattern’s consolidation, or the most recent high.
5. Inverse Cup and handle
What is the pattern about?
This is a topping pattern that hints at a prolonged downturn. Price forms a rounded top (the cup), followed by a weak bounce (the handle), which fails to gain momentum. The handle represents a last-ditch effort by buyers before price collapses.
The inverse, or inverted cup and handle, suggests a larger decline if the support breaks. The MMT is typically taken from the cup’s highest high minus the lowest low, then subtracted from the support level.
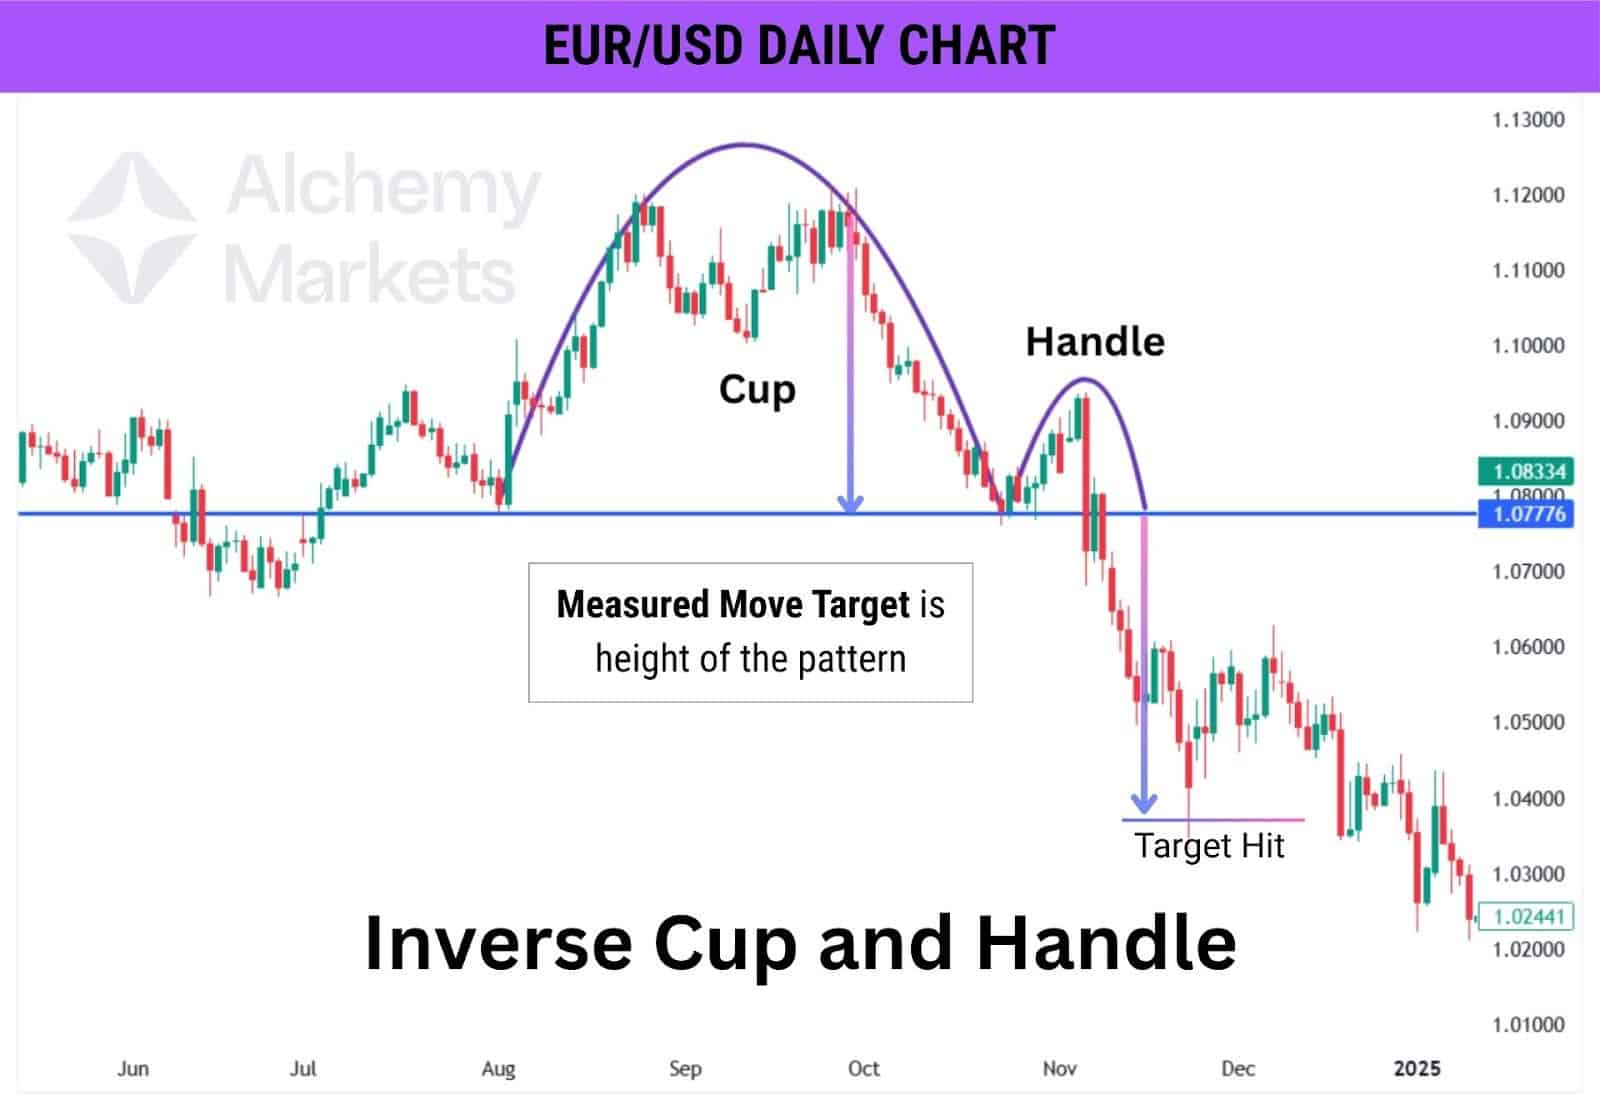
When to use it?
The inverse cup handle pattern is useful when identifying trend reversals or bearish continuation setups. A breakdown below the handle confirms bearish momentum, making it a strong signal to short. The deeper the cup, the stronger the potential decline.
Stop Loss Placement
Stop loss is placed above the high of the inverted handle of the pattern..
6. Bearish Symmetrical Triangle
What is the pattern about?
This pattern shows shrinking price movement, with lower highs and higher lows squeezing into a tightening range. The consolidation eventually resolves in the direction of the prevailing trend, which in a bearish scenario means a breakdown.
A bearish symmetrical triangle’s MMT is equal to the highest high, minus the lowest low, within the consolidation period.
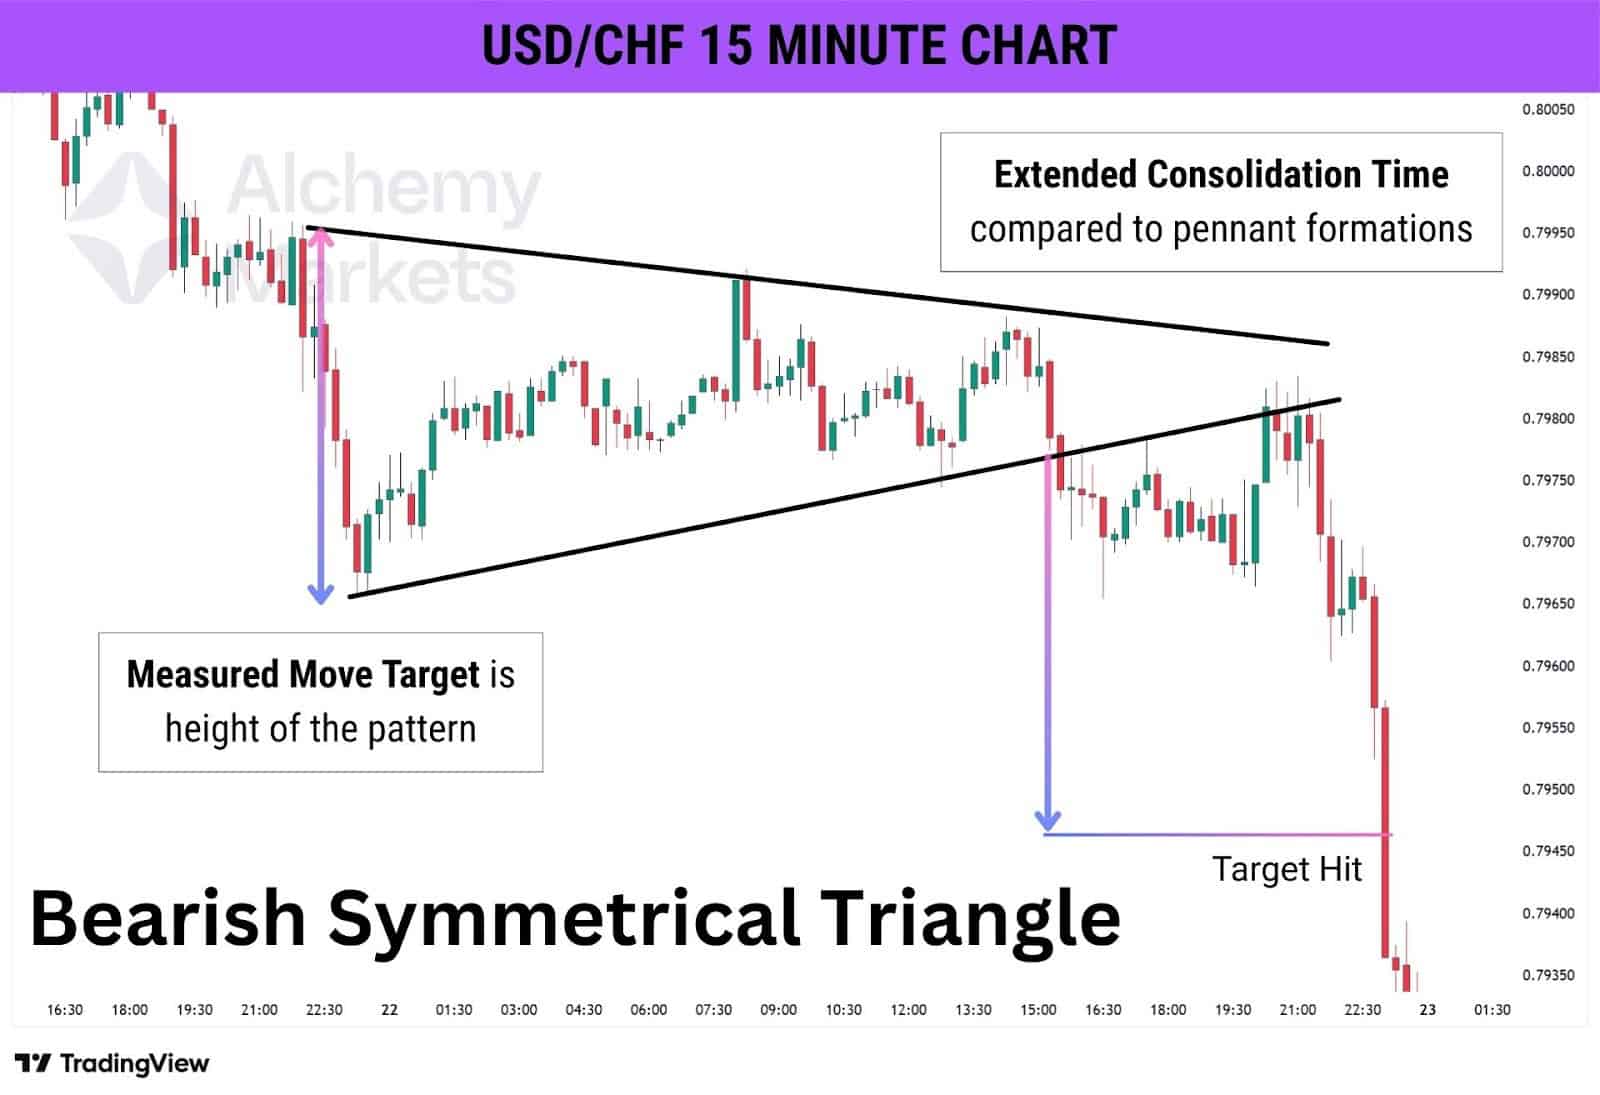
When to use it?
It’s ideal when price is stuck in a narrowing range within a downtrend. A breakout below the triangle’s lower boundary signals a continuation of selling pressure, making it a good entry point for short positions.
Stop Loss Placement
Stop loss is placed above the downward sloping resistance trend line of the triangle portion of the pattern.
7. Falling Three Methods
What is the pattern about?
This candlestick formation represents a controlled pause before further decline. It starts with a strong bearish candle, followed by three smaller candles that move slightly upward but stay within the first candle’s range. The pattern concludes with another strong bearish candle that confirms continuation.
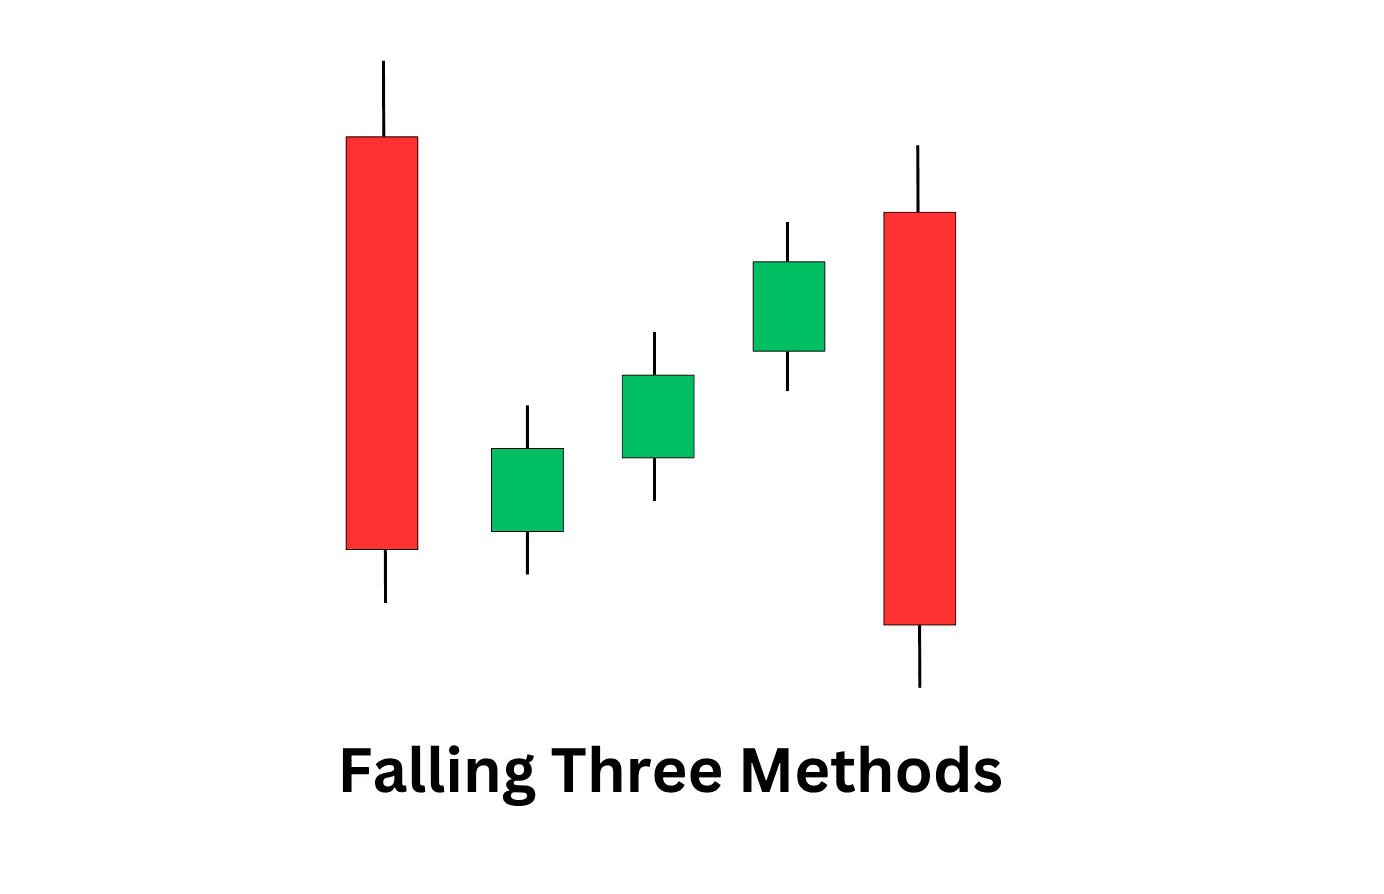
When to use it?
It’s a reliable signal in established downtrends, showing a temporary pullback before sellers regain control. The breakdown candle after the small retracement confirms the continuation, making it a solid point to enter short trades.
Stop Loss Placement
Stop loss is placed above the entire pattern’s consolidation, or the breakdown candle’s high.
Advantages of Using Continuation Patterns in your Trades
- Enhanced Trade Timing – These patterns assist traders in aligning their entries with the current trend, lowering the chances of poorly timed positions.
- Clear Risk Management – Defined breakout points allow for precise stop-loss placement, facilitating the efficient handling of downside risk and offering clear risk-reward ratio levels.
- Reliable Trend Confirmation – When a continuation pattern breaks as expected, it strengthens the ongoing trend, enhancing trading assurance.
- Functions Across Different Markets – These patterns are effective in forex, equities, commodities, and cryptocurrencies, making them versatile for various asset classes.
- Numerous Trading Opportunities – As trends may persist for long durations, continuation patterns offer various re-entry chances before the trend concludes.
Disadvantages of Using Continuation Patterns in your Trades
- False Breakouts – Price can break in the expected direction but quickly reverse, leading to losses if stop-loss levels aren’t well-placed.
- Long Consolidation Periods – Some patterns take time to develop, causing traders to wait longer before a confirmed breakout.
- Context Matters – Not all continuation patterns work equally well in all market conditions; high volatility or low liquidity can distort them.
- Requires Additional Confirmation – Relying solely on pattern recognition can be risky; volume analysis or indicators like RSI or MACD improve accuracy.
- Psychological Bias – Traders may become too fixated on a pattern and ignore signs that the market is shifting, leading to poor decision-making.
What is the Strongest Bullish Continuation Pattern?
The ascending triangle is regarded as the strongest bullish continuation pattern. It forms when price repeatedly tests a horizontal resistance level while making higher lows. This suggests that buyers are gaining influence, pushing prices closer to a breakout. Once resistance finally gives way, it typically results in significant upward movement, forming a high-likelihood bullish situation.
What is the Strongest Bearish Continuation Pattern?
The descending triangle holds the reputation as the strongest bearish continuation pattern. Price forms lower highs while bouncing off a flat support level, showing sellers are gradually overpowering buyers. Once support breaks, the resulting downtrend often accelerates with high volume, confirming strong bearish momentum.
Continuation Pattern vs. Reversal Pattern
- Continuation Patterns suggest the current trend will persist after a temporary pause. Examples include flags, pennants, and triangles. Traders use them to join an existing trend at an optimal entry point.
- Reversal Patterns suggest that the market is expected to alter its direction. Patterns such as head and shoulders, double tops/bottoms, and wedges indicate the conclusion of a trend and the beginning of a new one. Traders utilize them to predict changes in trends and adjust their positions accordingly.
FAQ
What is the best time frame to use for any continuation pattern?
The perfect time period varies based on the trading approach. Short-term traders typically utilise 5-minute to 1-hour charts to seize quick breakouts, whereas swing traders favour 4-hour to daily charts for more reliable setups. Longer time frames, such as daily or weekly charts, provide more dependable signals since they eliminate market noise and false breakouts.
How reliable are continuation patterns?
Continuation patterns are highly effective when used correctly, but they work best when confirmed by technical indicators. Relying on just the pattern can lead to false breakouts and losses.
To improve accuracy, traders combine them with:
- Volume indicators (such as OBV and Volume Profile) – An uptick in volume at breakout levels indicates robust momentum.
- Moving Averages (e.g., 50 EMA, 200 EMA) – When the price remains beneath a significant moving average in a bearish scenario, it validates the downtrend.
- Momentum indicators (such as RSI and MACD) – An increasing RSI in a bullish flag supports continuation, and MACD crossovers provide additional confirmation.
When continuation patterns align with indicator signals, they become far more reliable for trade execution.


