Bearish
- October 24, 2024
- 20 min read
Descending Triangle Trading Guide
What is a Descending Triangle?
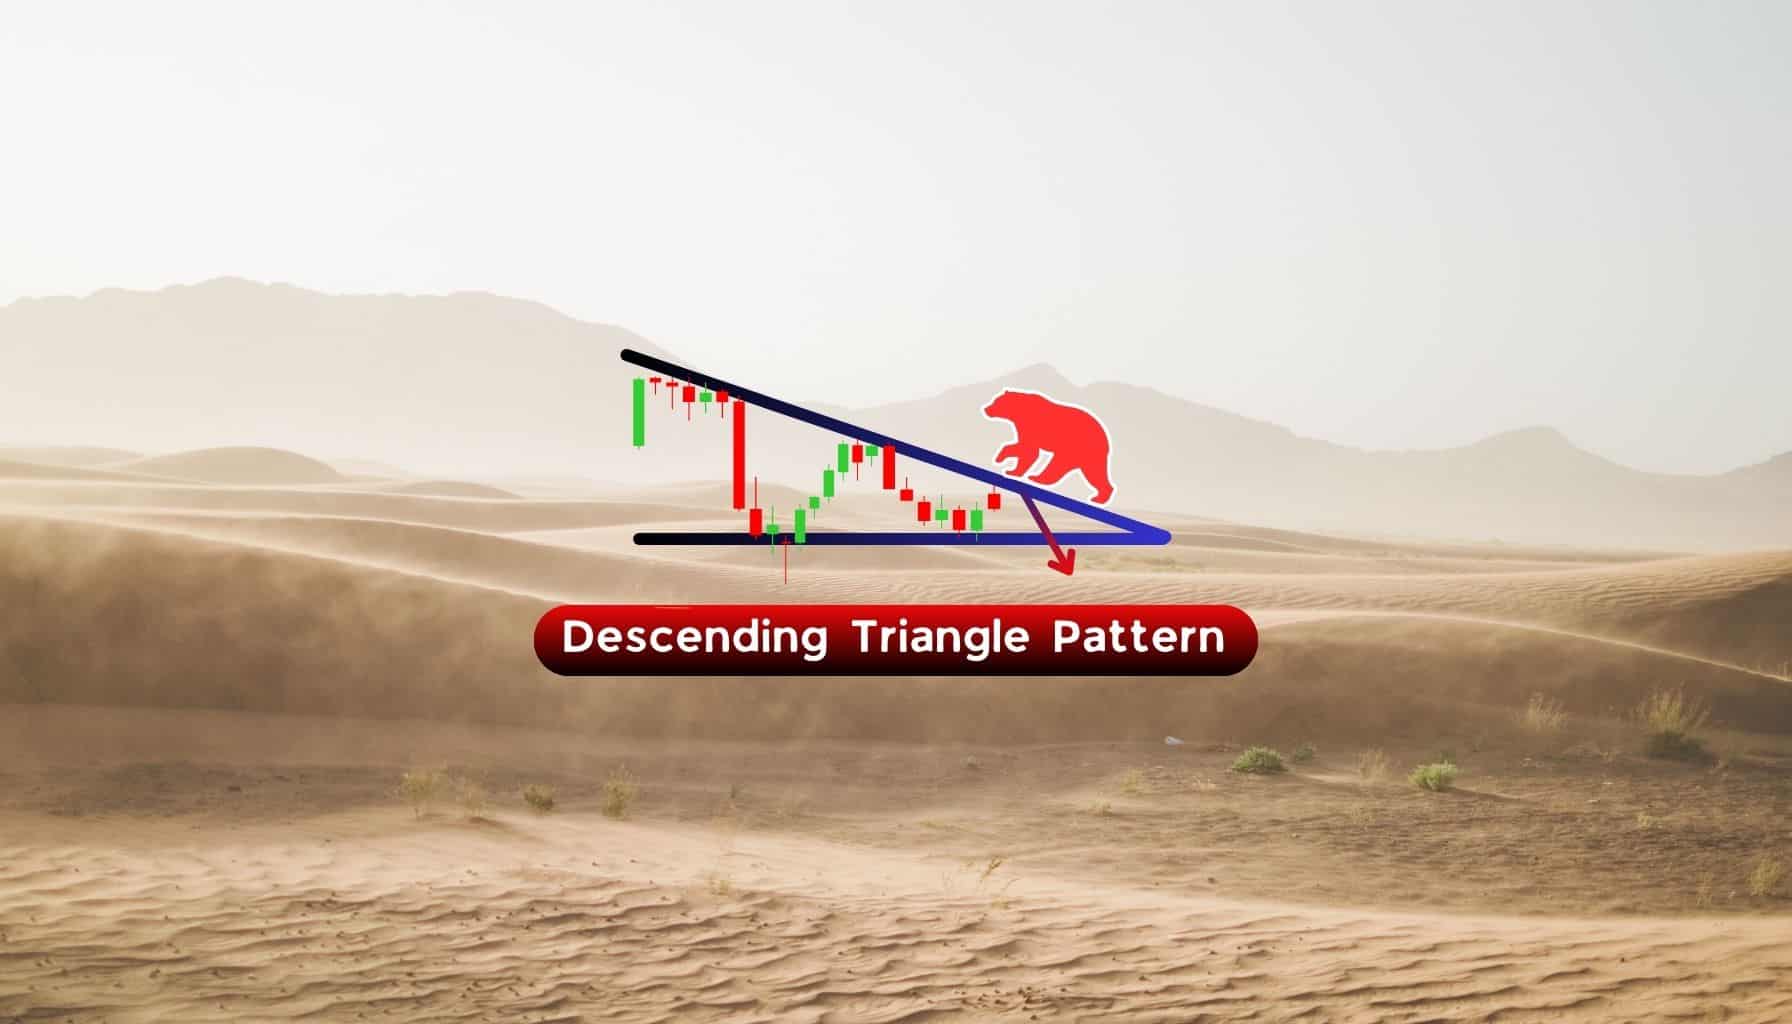
A descending triangle pattern is a bearish chart pattern used in technical analysis to forecast a potential breakdown in the asset’s price following a period of consolidation. This triangle pattern features a horizontal support line and a downward-sloping resistance line, reflecting decreasing highs and consistent lows. The descending triangle indicates a buildup of selling pressure, suggesting potential bearish sentiment in the market and the likelihood of a continued downward trend.
Key Characteristic of Descending Triangle Pattern
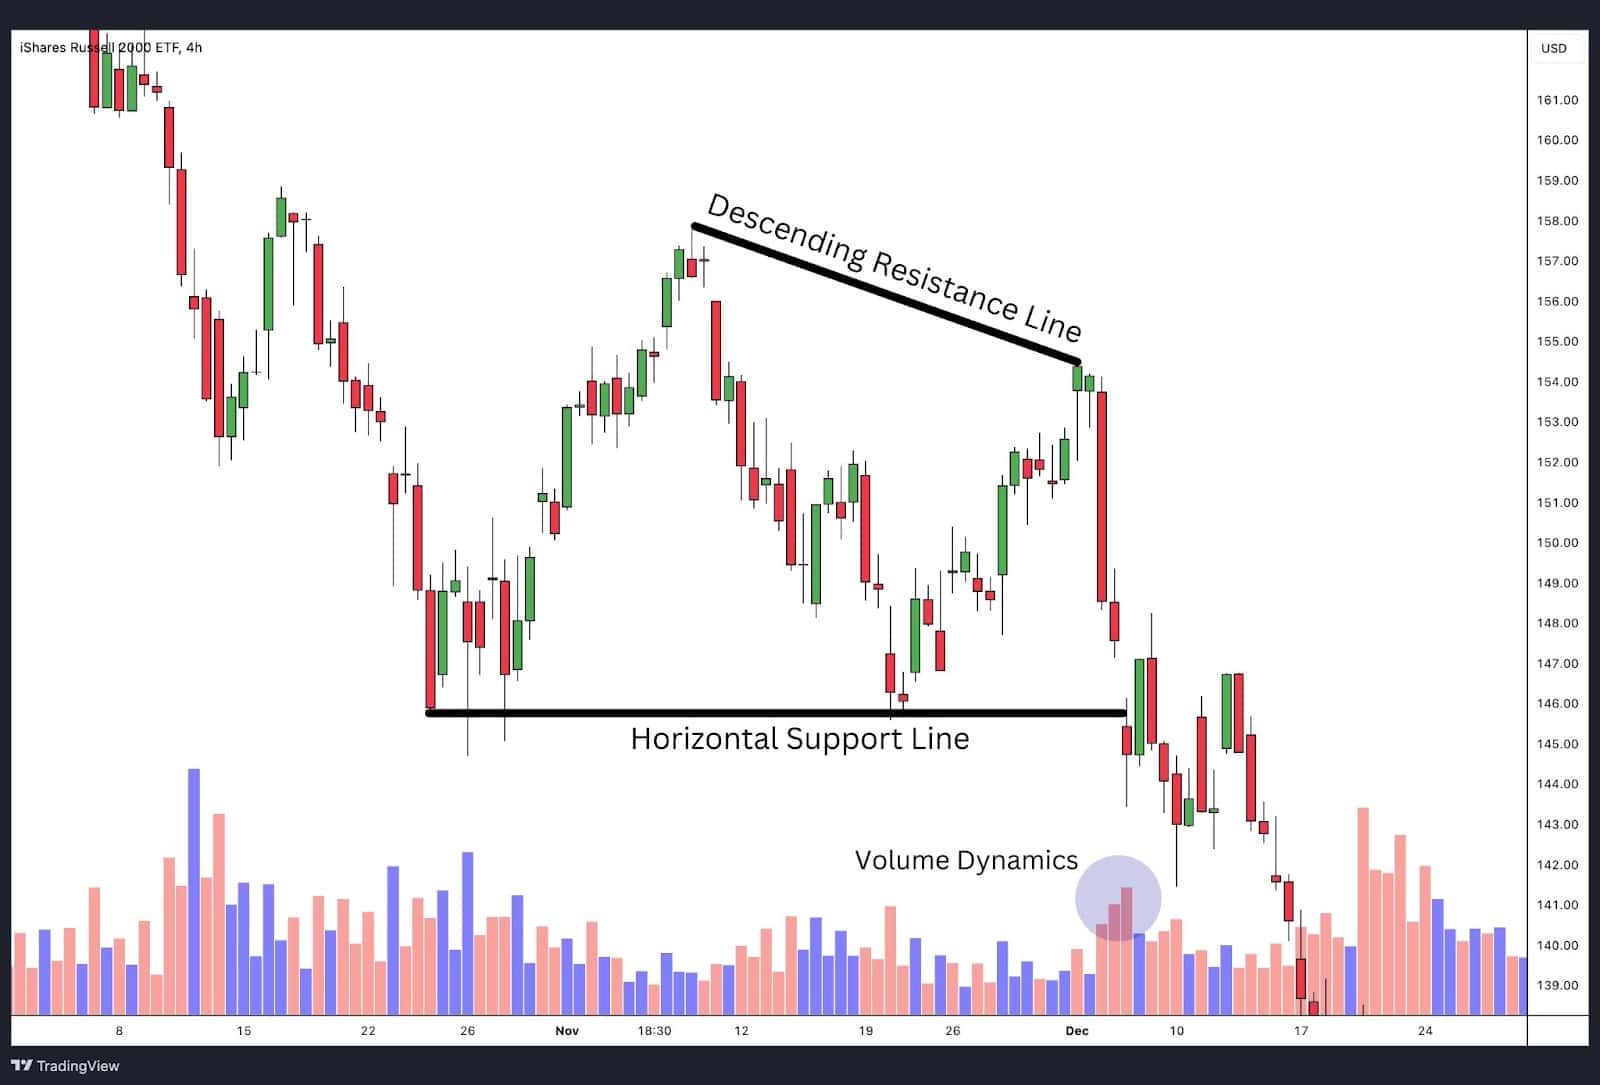
The Descending Triangle Pattern is a bearish formation marked by:
- Descending Resistance Line: This line connects the series of lower highs, indicating increasing selling pressure.
- Horizontal Support Line: It forms a flat line at the bottom, showing consistent support where buying interest temporarily halts price declines.
- Consolidation: The price moves within a narrowing range, showing a balance between buyers and sellers before a potential breakout.
- Volume Dynamics: Volume generally tapers off during the formation, but a sharp increase often accompanies the breakdown, validating the pattern.
What Does a Descending Triangle Pattern Tell You?
A descending triangle pattern typically signals a bearish continuation in a downtrend. This pattern forms as sellers consistently lower their asking prices, forming a descending resistance line, while the support level remains flat. The pattern indicates decreasing buying pressure and a potential breakdown below the support line. A breakdown, often confirmed by a surge in volume, suggests a further decline in price. Traders commonly use this pattern to identify entry points for short positions.
How to Identify the Descending Triangle Pattern?
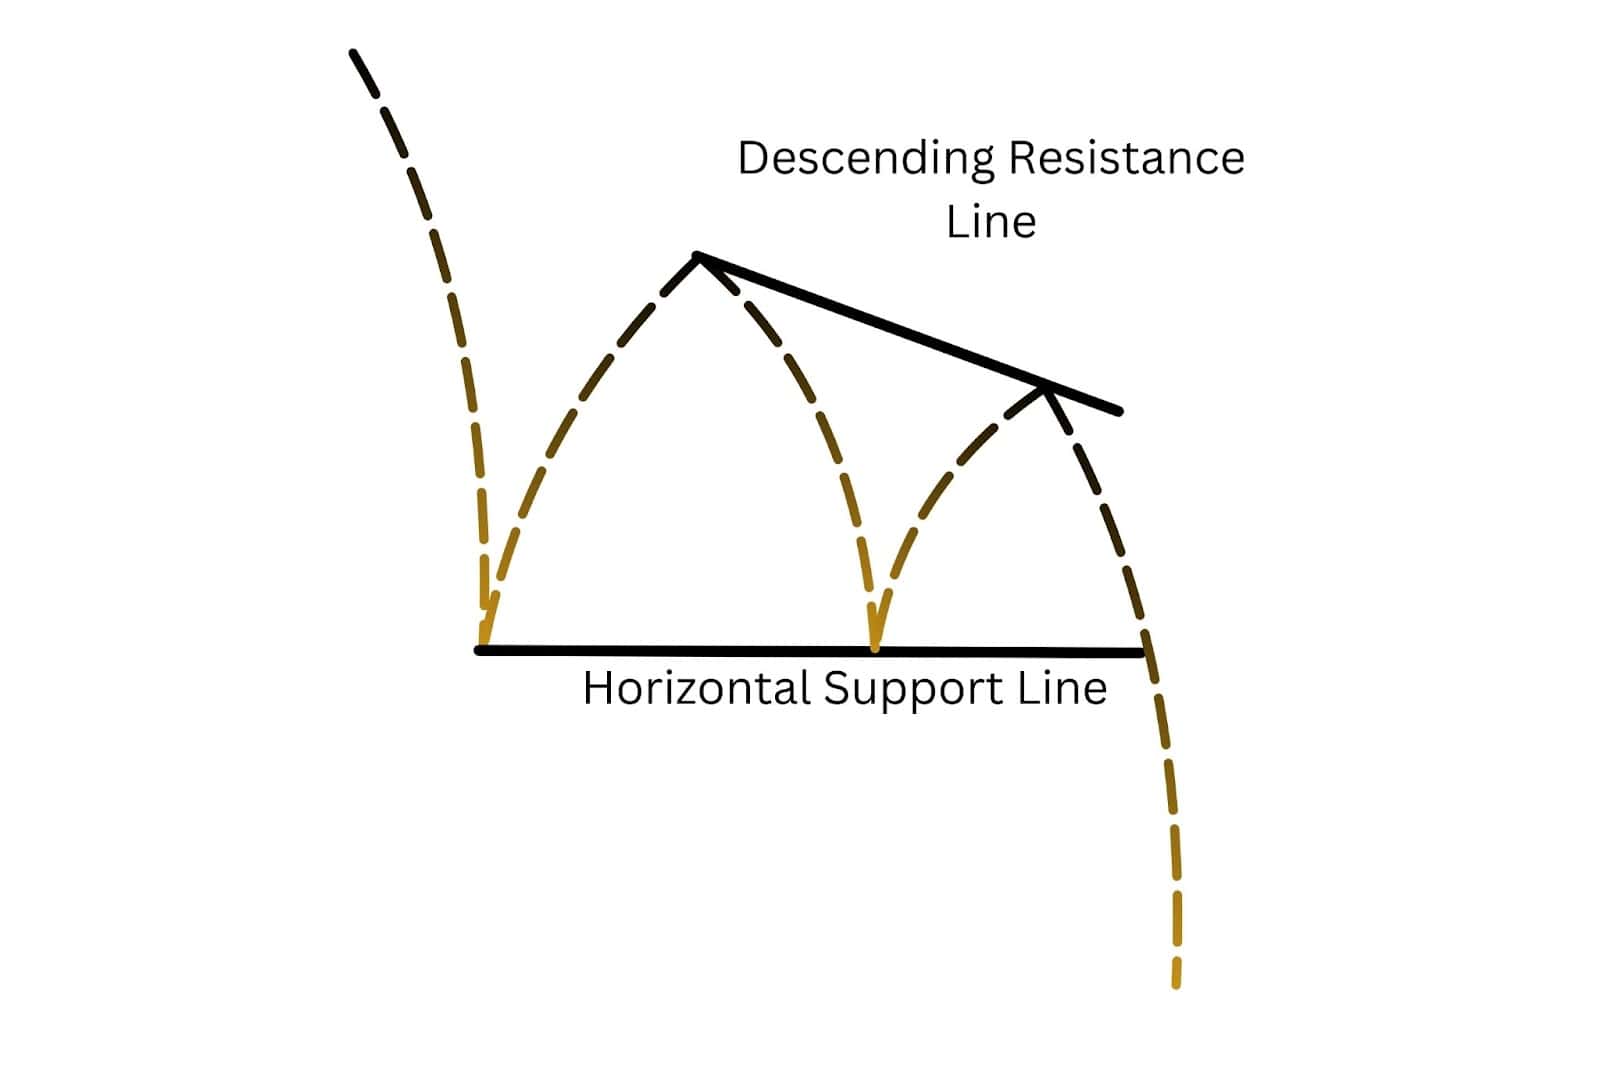
A descending triangle pattern is a bearish continuation chart pattern that typically emerges following a previous downtrend. It is identified by the following features:
- Horizontal Support Line: This flat lower boundary is created by connecting a series of lows at approximately the same price level, forming a horizontal support level. This line indicates where buying pressure is temporarily stabilising, despite the overall downward trend.
- Descending Resistance Line: The descending upper trendline connects a series of lower highs, showing that sellers are gradually pushing prices downward as they are willing to sell at progressively lower levels. This forms a downward sloping trendline.
- Convergence Point: As the descending resistance and horizontal support lines converge, the triangle pattern forms. The pattern completes when a breakout occurs below the support line, indicating that selling pressure has overtaken buying support, often leading to a downward trend continuation.
This descending triangle pattern formation suggests that the downward trend is likely to continue, making it a key signal in technical analysis for traders considering a short position.
Importance of Descending Triangle Pattern in Trading
The descending triangle pattern plays a crucial role in technical analysis by signalling potential bearish continuations and helping traders identify entry points for short positions. The regular descending triangle pattern is characterised by a horizontal support line and a descending resistance line, indicating a bearish market sentiment.
This chart pattern often forms during market corrections, providing a clear visual cue that sellers are gaining control as the price repeatedly tests a horizontal support level while forming lower highs. By recognizing this triangle pattern, traders can position themselves to benefit from a likely downward breakout, minimising risks associated with premature entries in an existing downtrend.
What Conditions Must Be Met For a Formation To Be Classified As Descending Triangle?
A descending triangle pattern is characterised by:
- Established Downtrend: It must appear during an existing downtrend, signalling a continuation pattern.
- Flat Support Line: A horizontal support line formed by at least two lows at the same level, indicating a strong support area.
- Descending Resistance Line: A downward-sloping trendline connecting at least two lower highs, showing decreasing bullish strength.
- Breakout Confirmation: The pattern completes with a breakout below the support line, ideally confirmed by increased volume, signalling a strong bearish chart pattern.
Descending Triangle Pattern Examples
Example 1: Zoom Video Communications, Inc. (ZM)
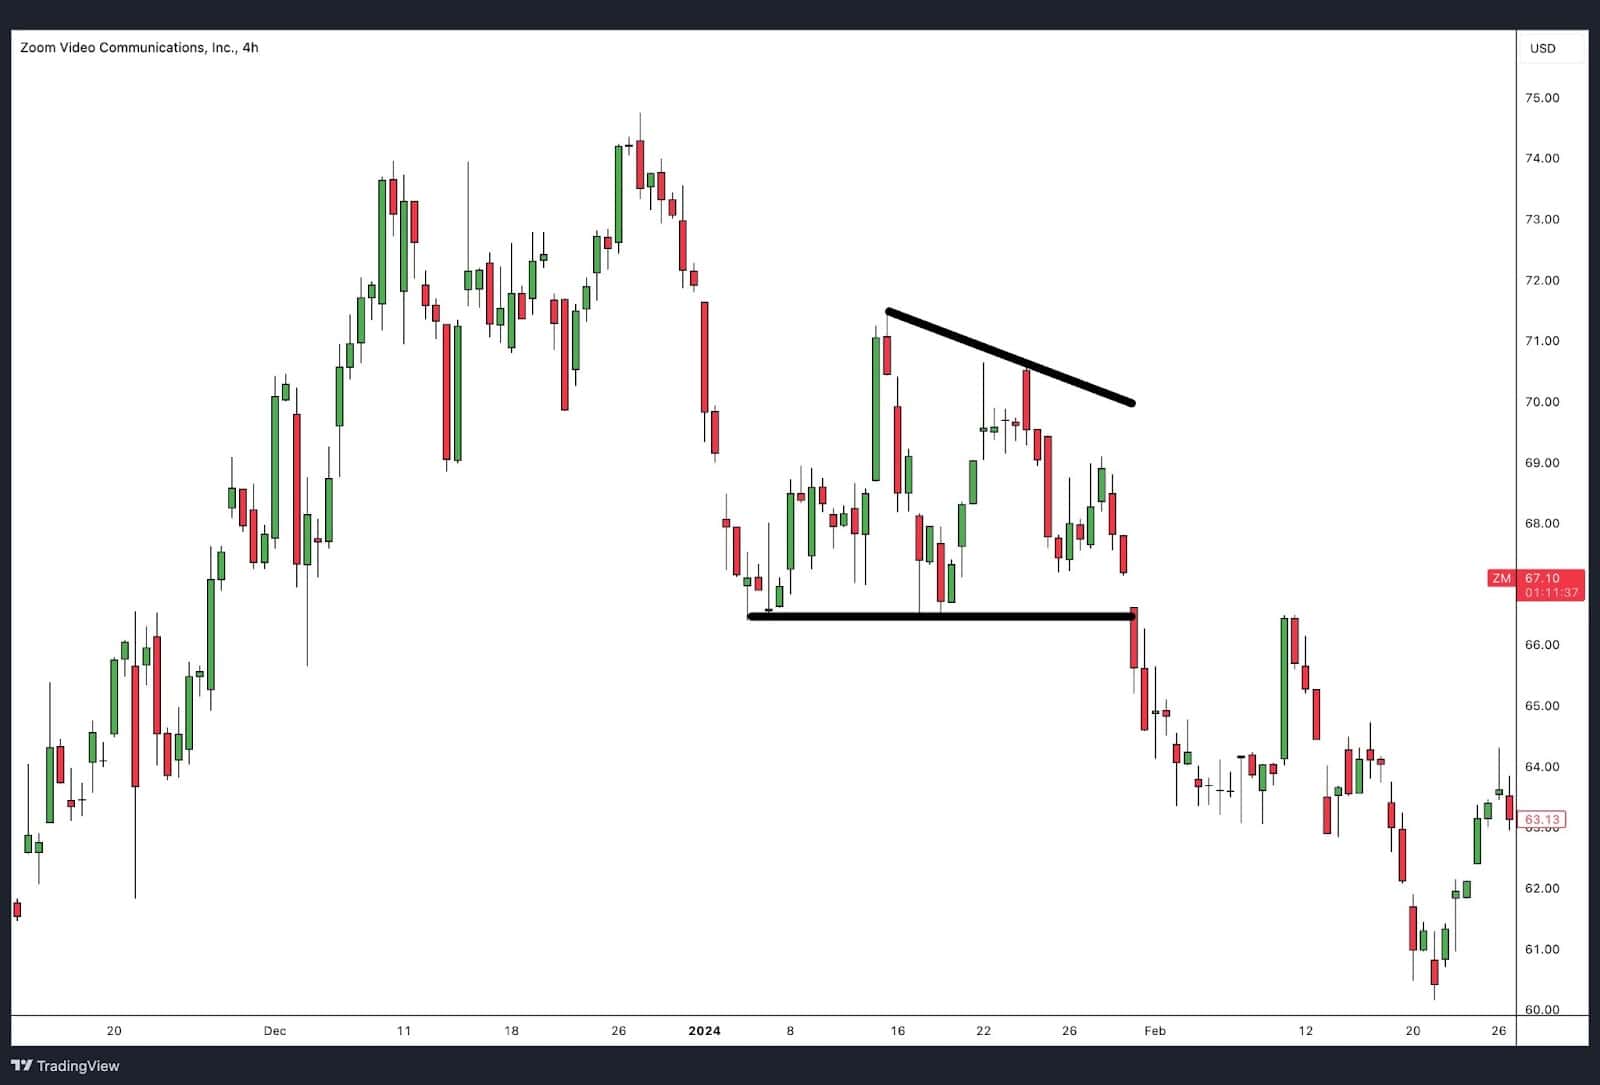
Chart Overview: This chart shows Zoom Video Communications forming a descending triangle pattern. The horizontal support line is established around $66, while the descending resistance line gradually pushes prices lower.
Key Features:
- Horizontal Support: The $66 level forms the flat support line, which is tested multiple times.
- Descending Resistance: Lower highs indicate sellers are gaining control, creating a downward sloping trendline.
- Breakout Confirmation: After several tests, the price breaks below the horizontal support line, confirming a bearish continuation.
This descending triangle breakout resulted in further price declines, consistent with a continuation of the downward trend.
Example 2: AUD/USD
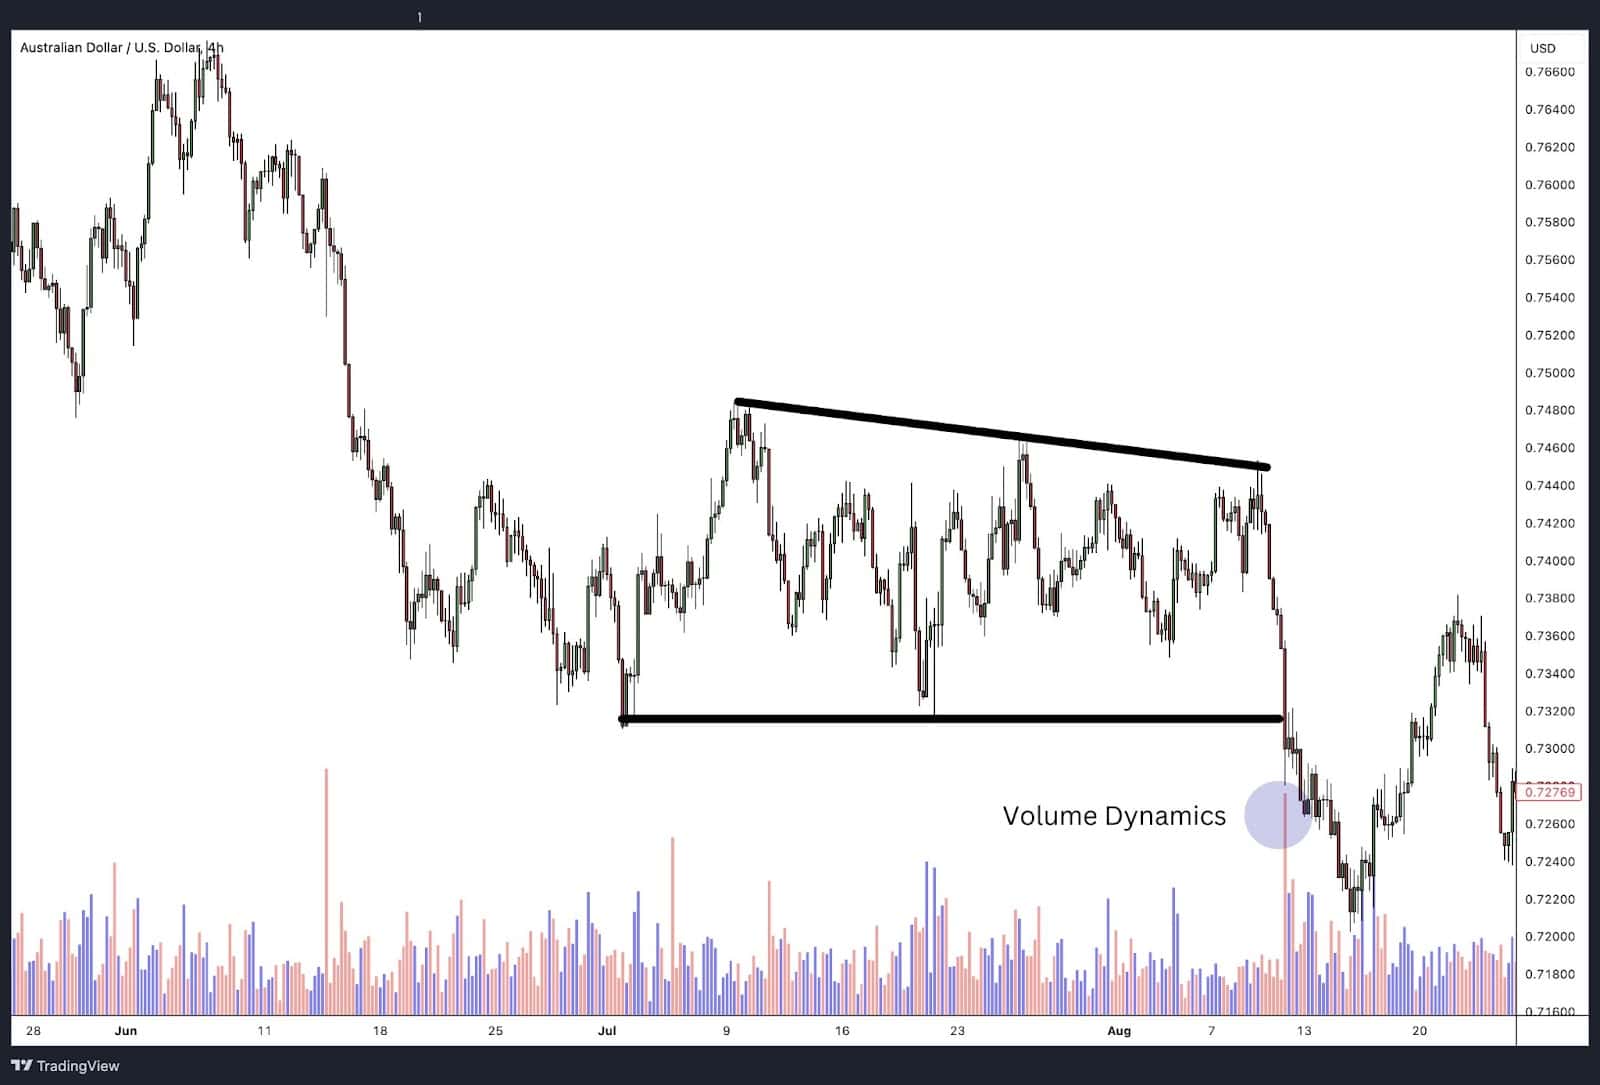
Chart Overview: The Australian Dollar/U.S. Dollar currency pair chart shows a descending triangle with support around 0.732 and resistance descending from 0.748.
Key Features:
- Horizontal Support: Consistent support at 0.732 marks a strong price floor.
- Descending Resistance: A series of lower highs, highlighting persistent selling pressure.
- Volume Dynamics: Volume declines during the triangle’s formation and spikes on the breakdown, validating the bearish signal.
This pattern indicates a bearish market sentiment, confirmed by a downward breakout, leading to a continuation of the downtrend.
Example 3: PayPal Holdings, Inc. (PYPL)
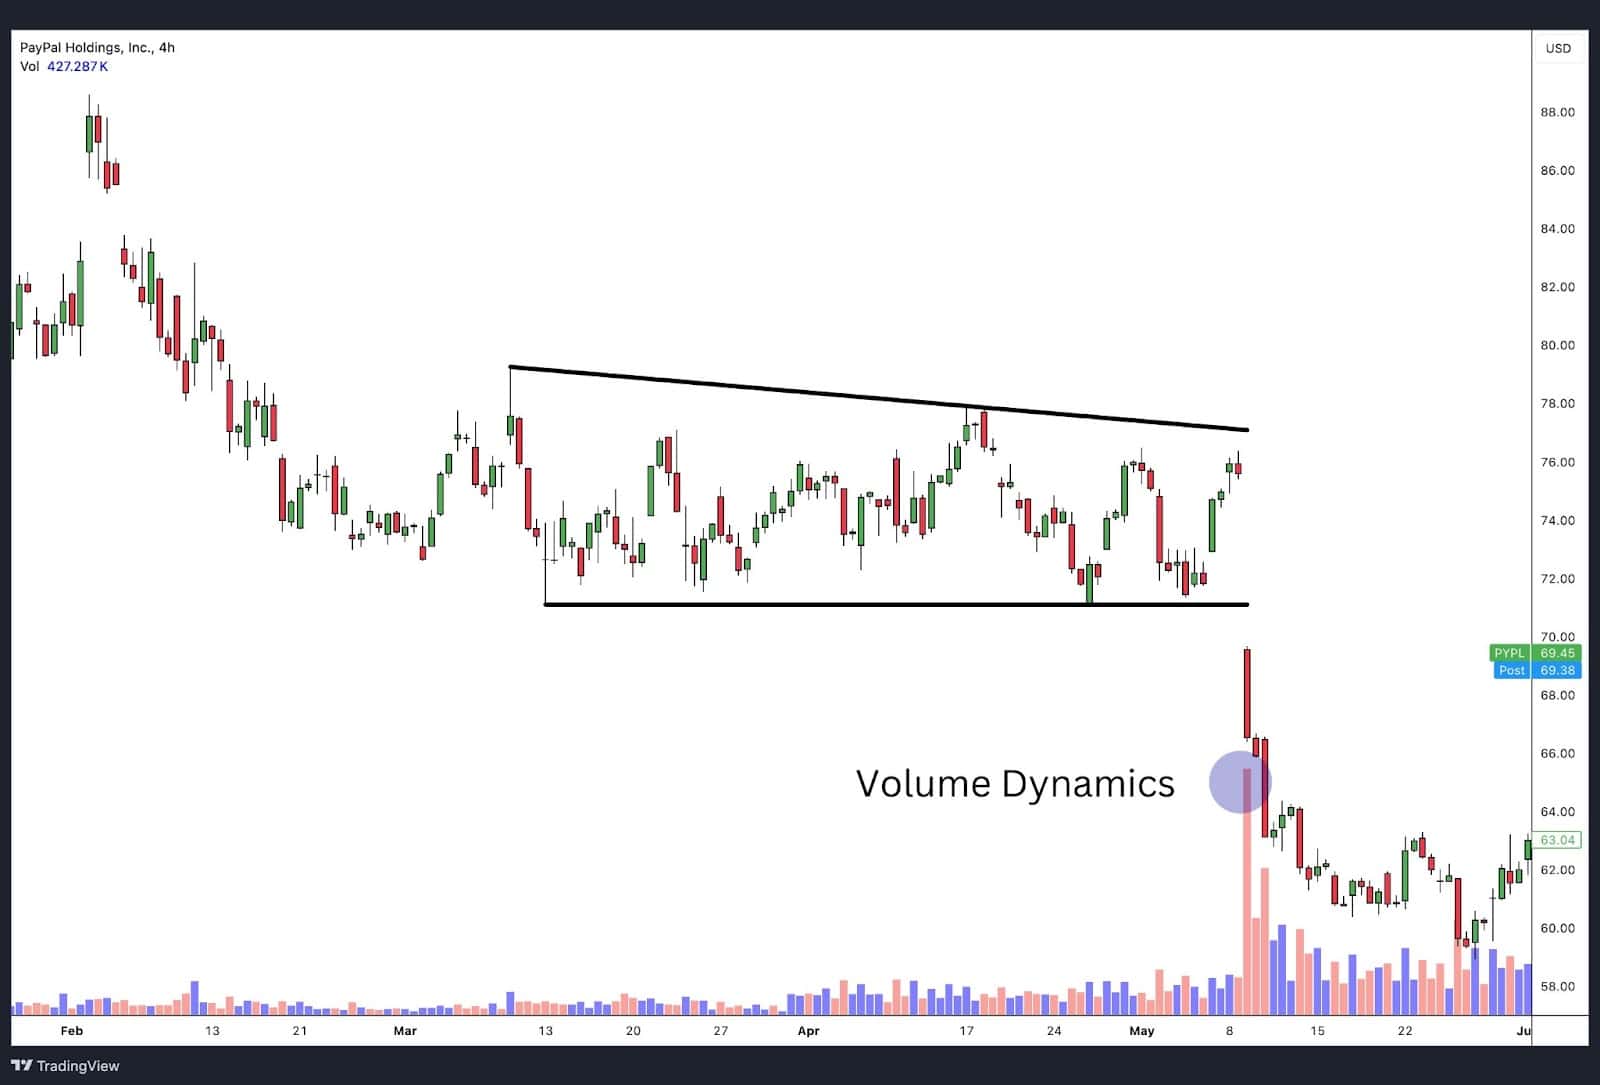
Chart Overview: The chart illustrates PayPal’s price action forming a descending triangle pattern. The horizontal support line is at approximately $70, while the descending resistance line compresses the price over time.
Key Features:
- Horizontal Support: The $70 level acts as strong support, with multiple tests showing buyers temporarily holding the price.
- Descending Resistance: The pattern shows a series of lower highs, reflecting increasing selling pressure as the price moves lower.
- Volume Dynamics: A decrease in volume during the pattern’s formation followed by a significant surge at the breakout, confirming the continuation of the downtrend.
This breakout indicates a continuation of the bearish trend, leading to a sharp decline in the stock’s price.
Example 4: Shake Shack, Inc. (SHAK)
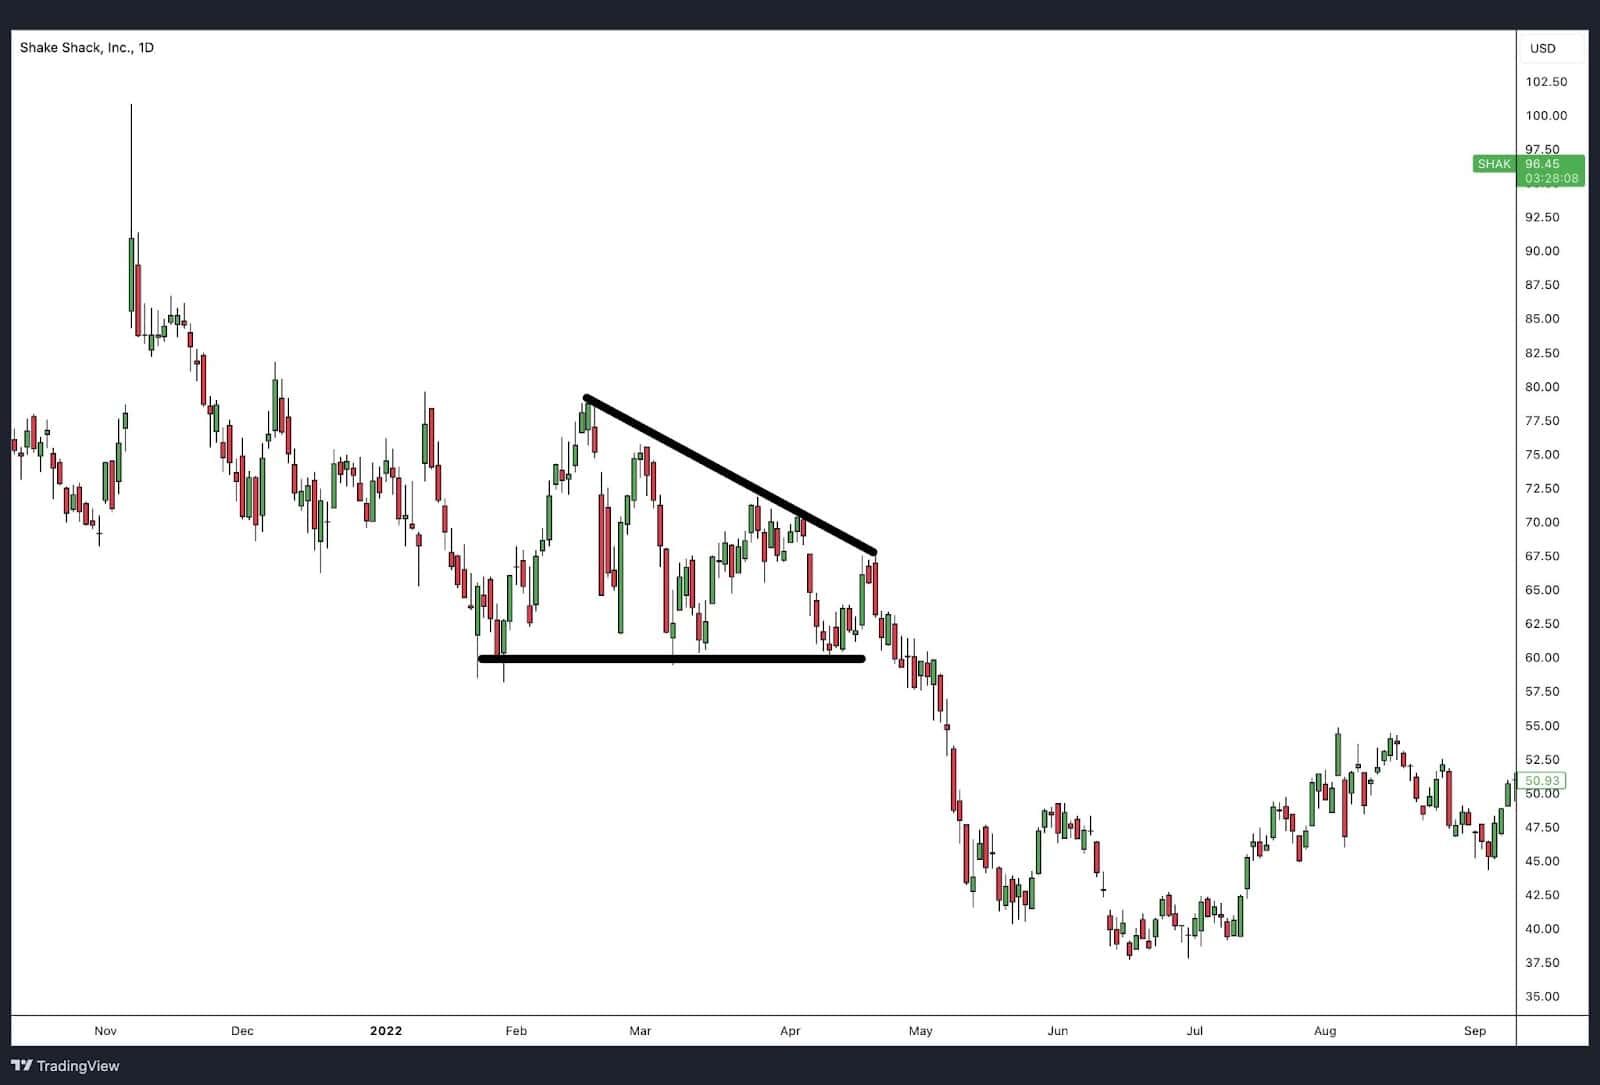
Chart Overview: The chart of Shake Shack shows the formation of a descending triangle pattern. The horizontal support line is formed around $60, while the descending resistance line pushes the price lower over time.
Key Features:
- Horizontal Support: The $60 level serves as the flat support line, repeatedly tested during the consolidation phase.
- Descending Resistance: The series of lower highs highlights increasing selling pressure, creating a downward-sloping trendline.
- Breakout Confirmation: The price eventually breaks below the horizontal support level, confirming a bearish continuation.
This descending triangle breakout led to a significant decline, following the downward trend.
Descending Triangle Pattern Entry and Exit Strategy
The descending triangle pattern is a powerful bearish continuation pattern that can be traded effectively using various strategies and indicators. To trade a descending triangle effectively, traders should focus on key entry, take profit, and stop loss levels. Below is a strategy focusing on key entry, take profit, and stop loss levels, considering you will discuss indicators in detail later.
Entry Point
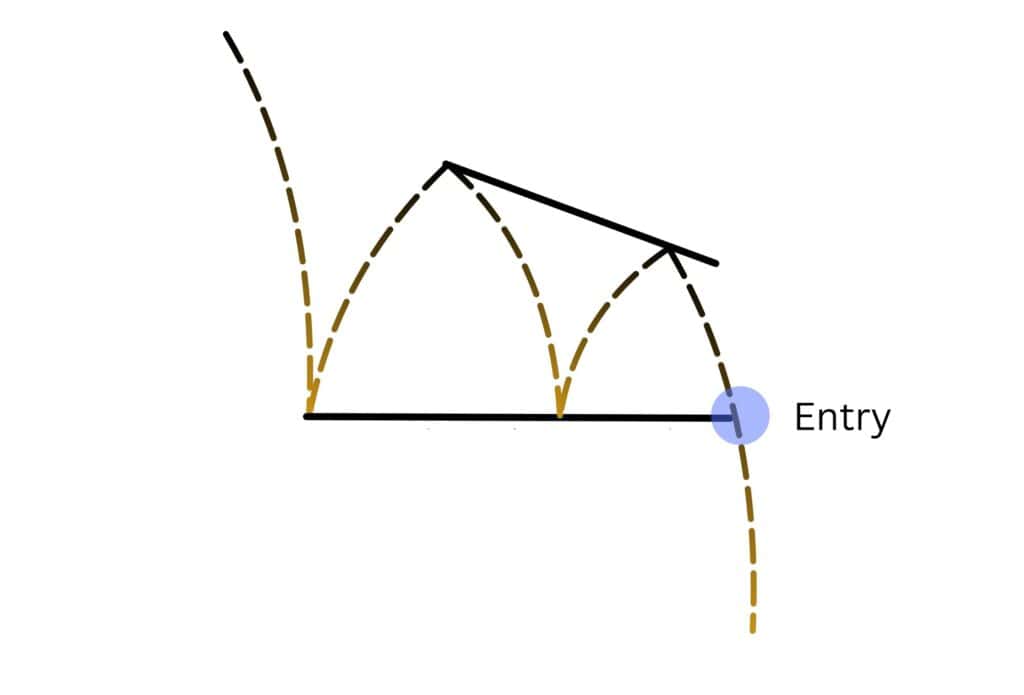
- Entry: Enter the trade when the price breaks below the horizontal support line. Ensure the breakout is confirmed by increased volume, signalling strong bearish momentum.
Take Profit
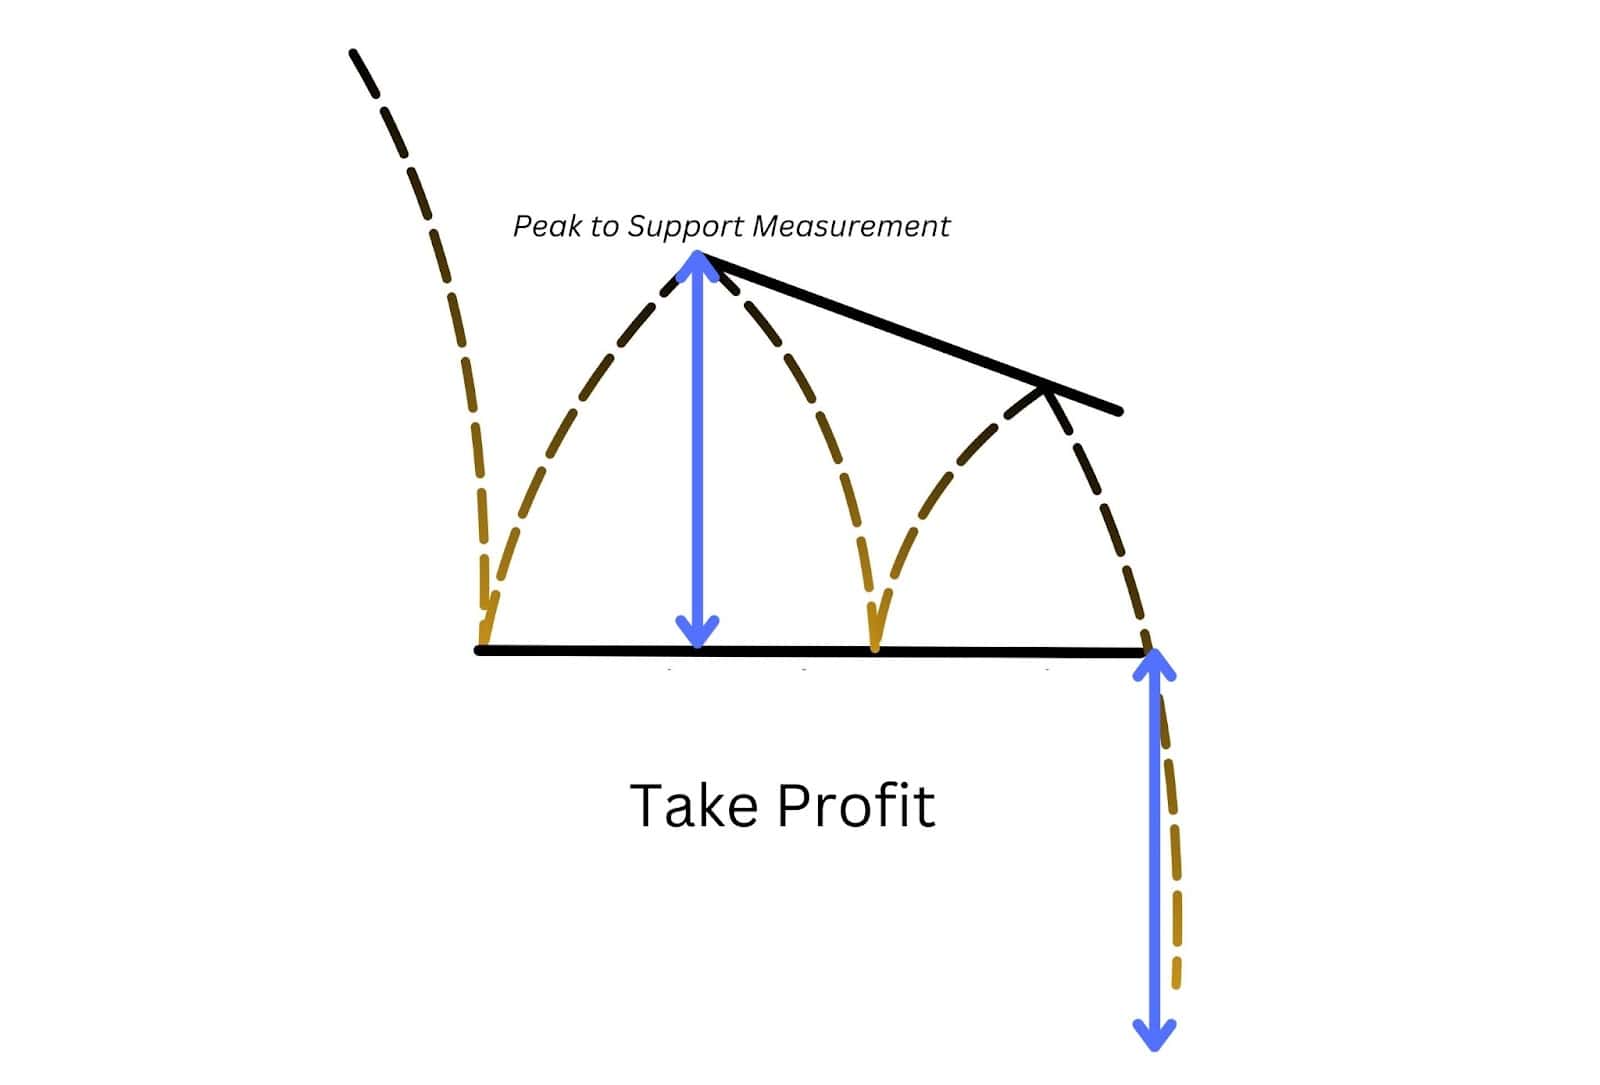
- Take Profit: Measure the height of the triangle from the first peak to the support line and project this distance downward from the breakout point. This gives a target price level for exiting the trade.
Stop Loss
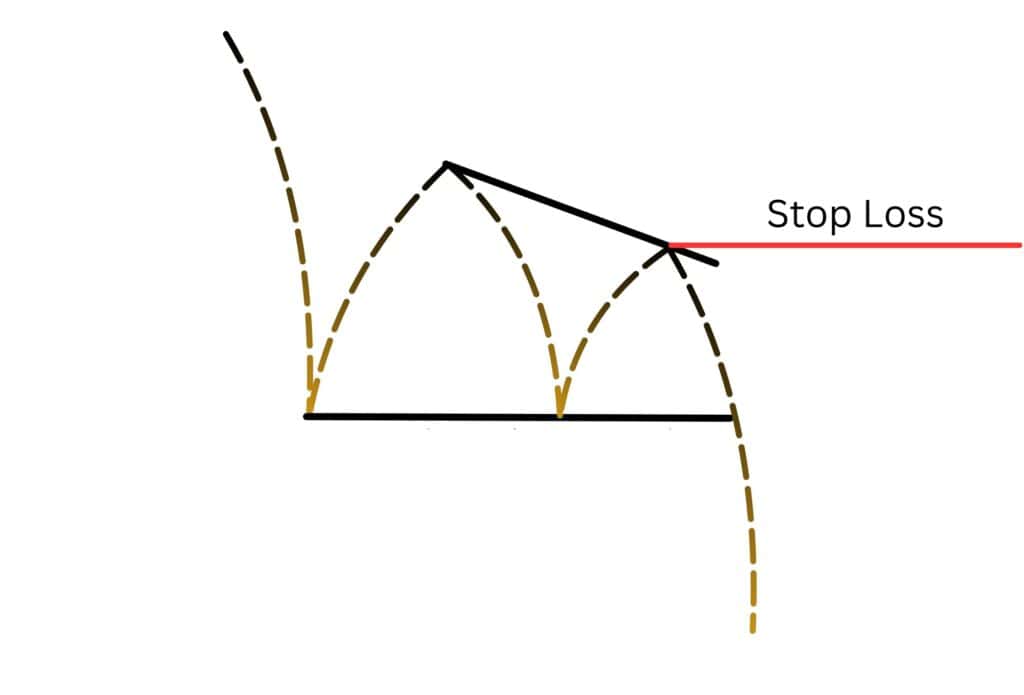
- Stop Loss: Place the stop loss just above the last swing high within the triangle. This limits potential losses if the price reverses.
Risk-Reward Ratio
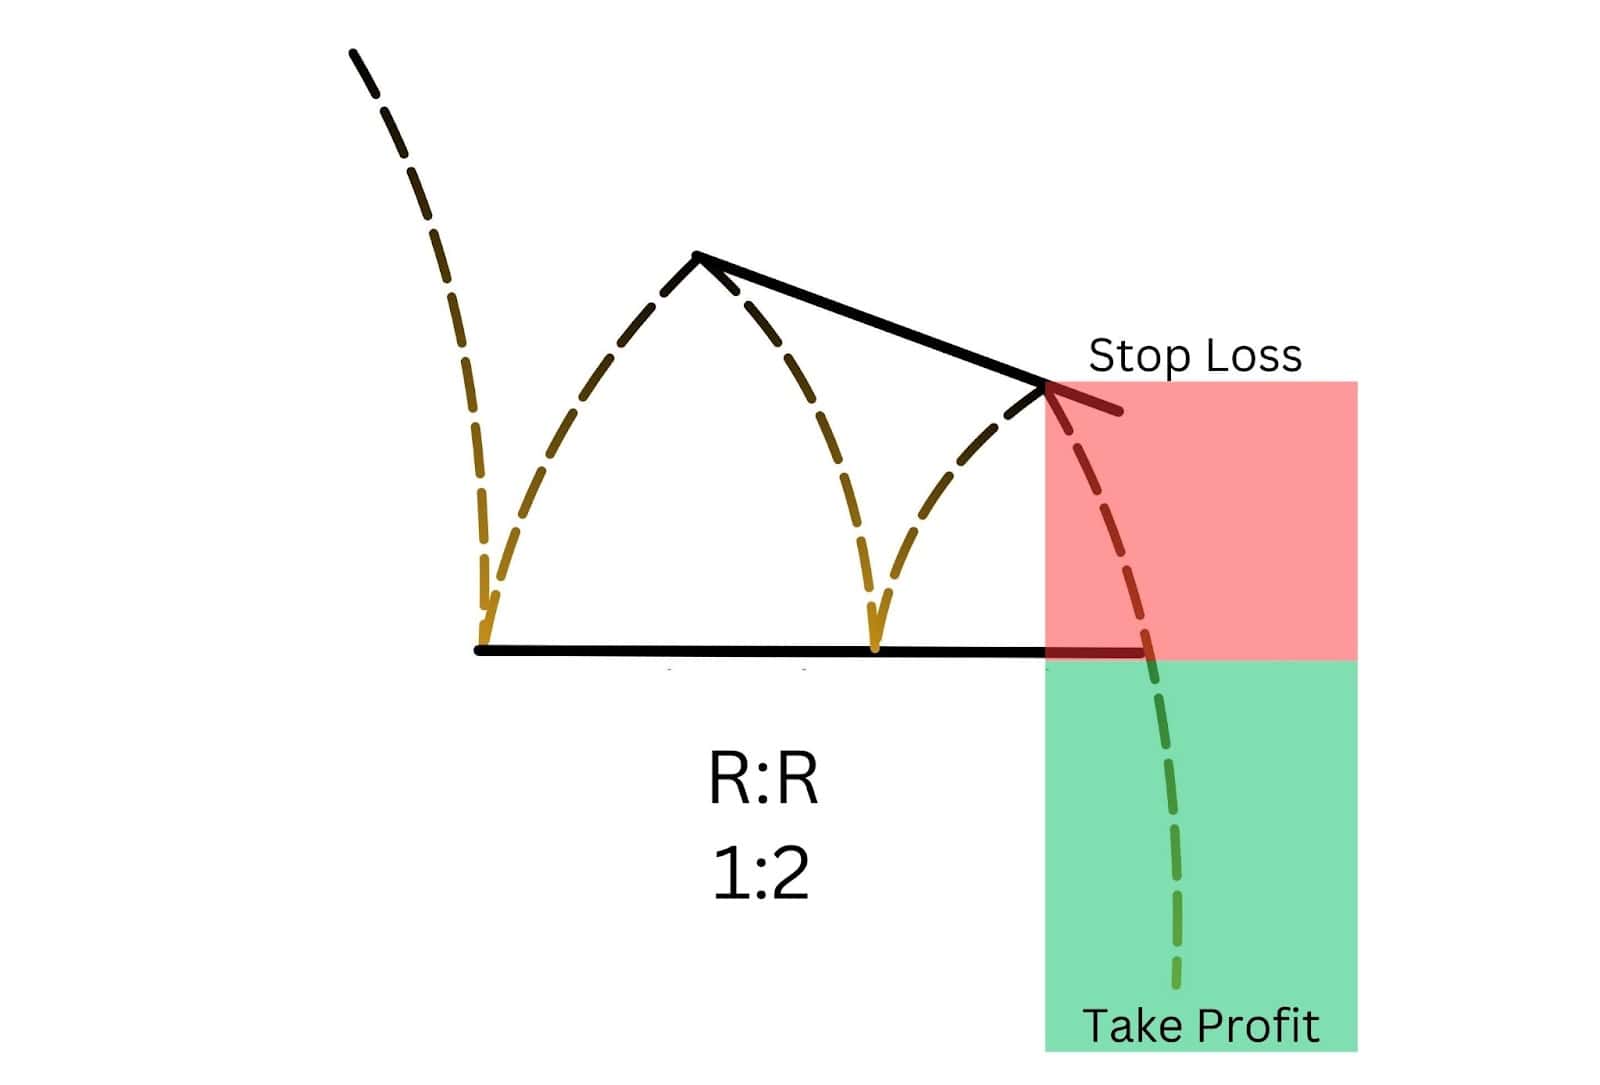
- Risk-Reward Ratio: Aim for a minimum ratio of 1:2 to ensure that the potential reward outweighs the risk. This means that for every point of risk, you are seeking at least 2 points of profit potential. By targeting at least a 1:2 risk to reward ratio or better, that means you don’t have to be ‘right’ on all of your trades to grow your account. Your winners would be much larger and cover up multiple losing trades.
Descending Triangle Pattern Trading Strategies
There are several ways and with many different tools you can trade the descending triangle chart pattern. Let’s explore a few of them here.
Descending Triangle Pattern Breakout Strategy
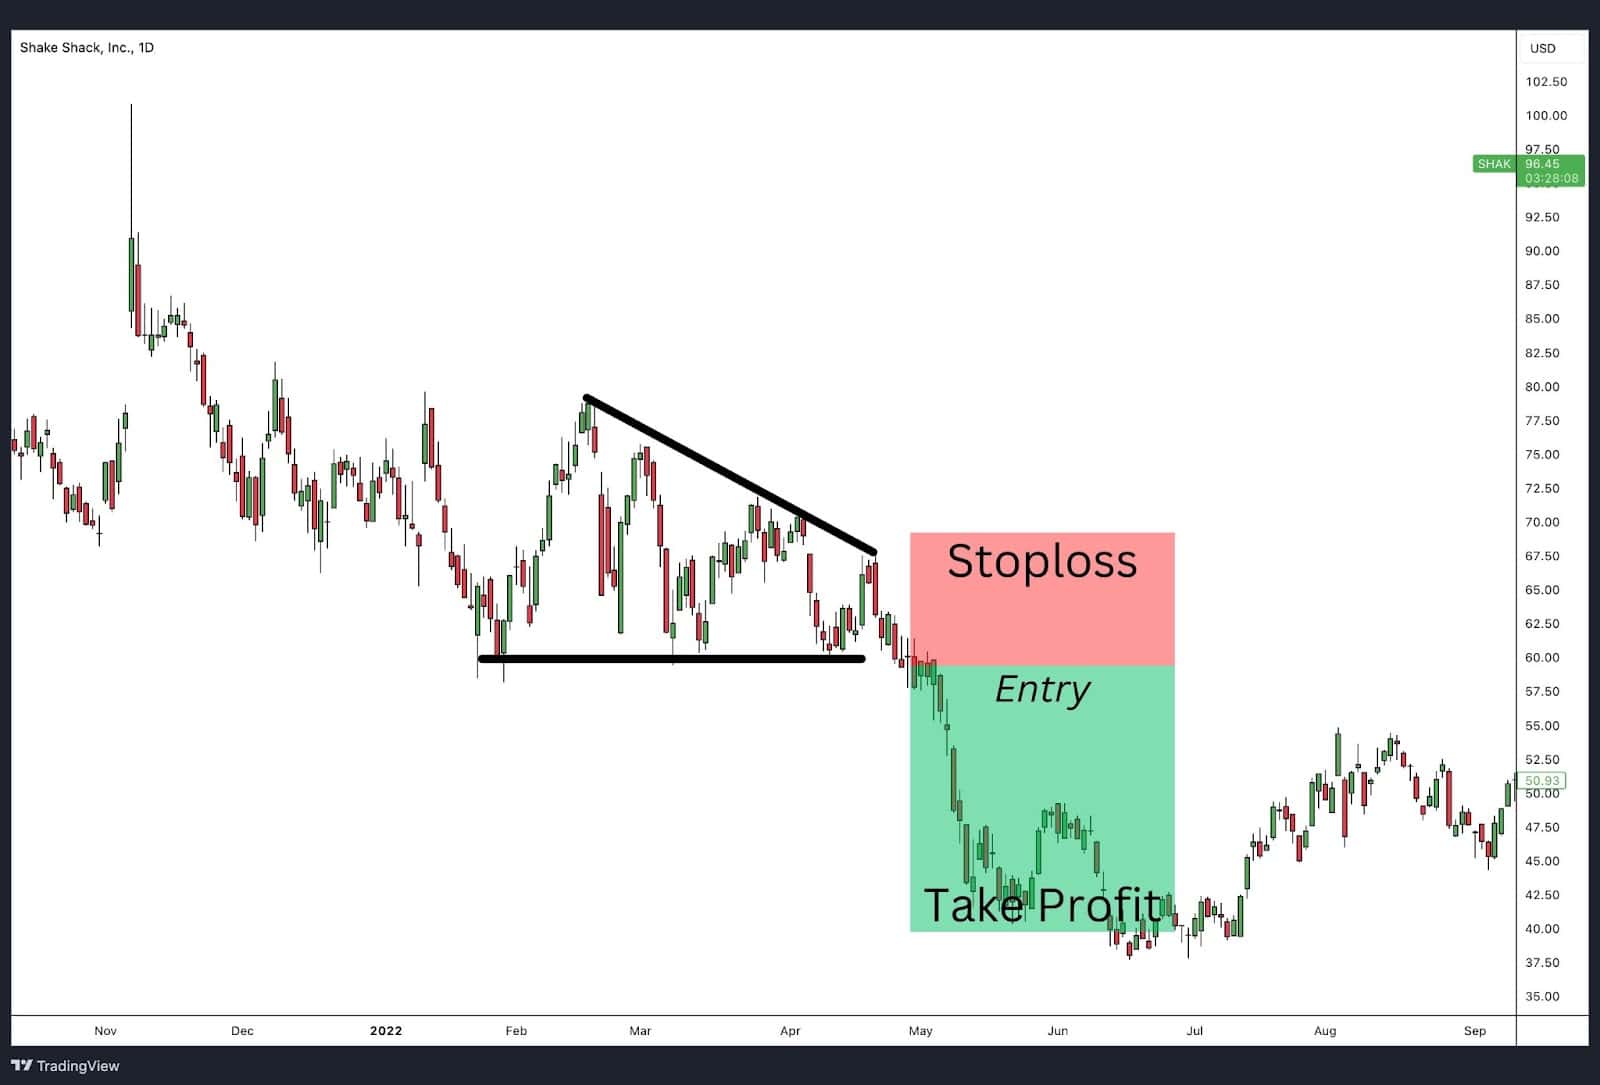
The descending triangle pattern breakout strategy focuses on identifying and trading the breakout below the horizontal support line. The key is to wait for a confirmed breakout with strong volume, signalling the continuation of the downtrend.
Descending Triangles With Heikin-Ashi Charts
Using Heikin-Ashi charts with descending triangle patterns can smooth out price action, making it easier to identify trends and breakout points. Heikin-Ashi differs from traditional candlestick charts by using averages to calculate price bars, creating a clearer visual representation of trends. This method filters out market noise, allowing traders to better spot a descending triangle breakout below the support line. The candlestick pattern can offer additional confirmation, especially when the candles turn predominantly bearish before the breakout.
Descending Triangle With Moving Averages
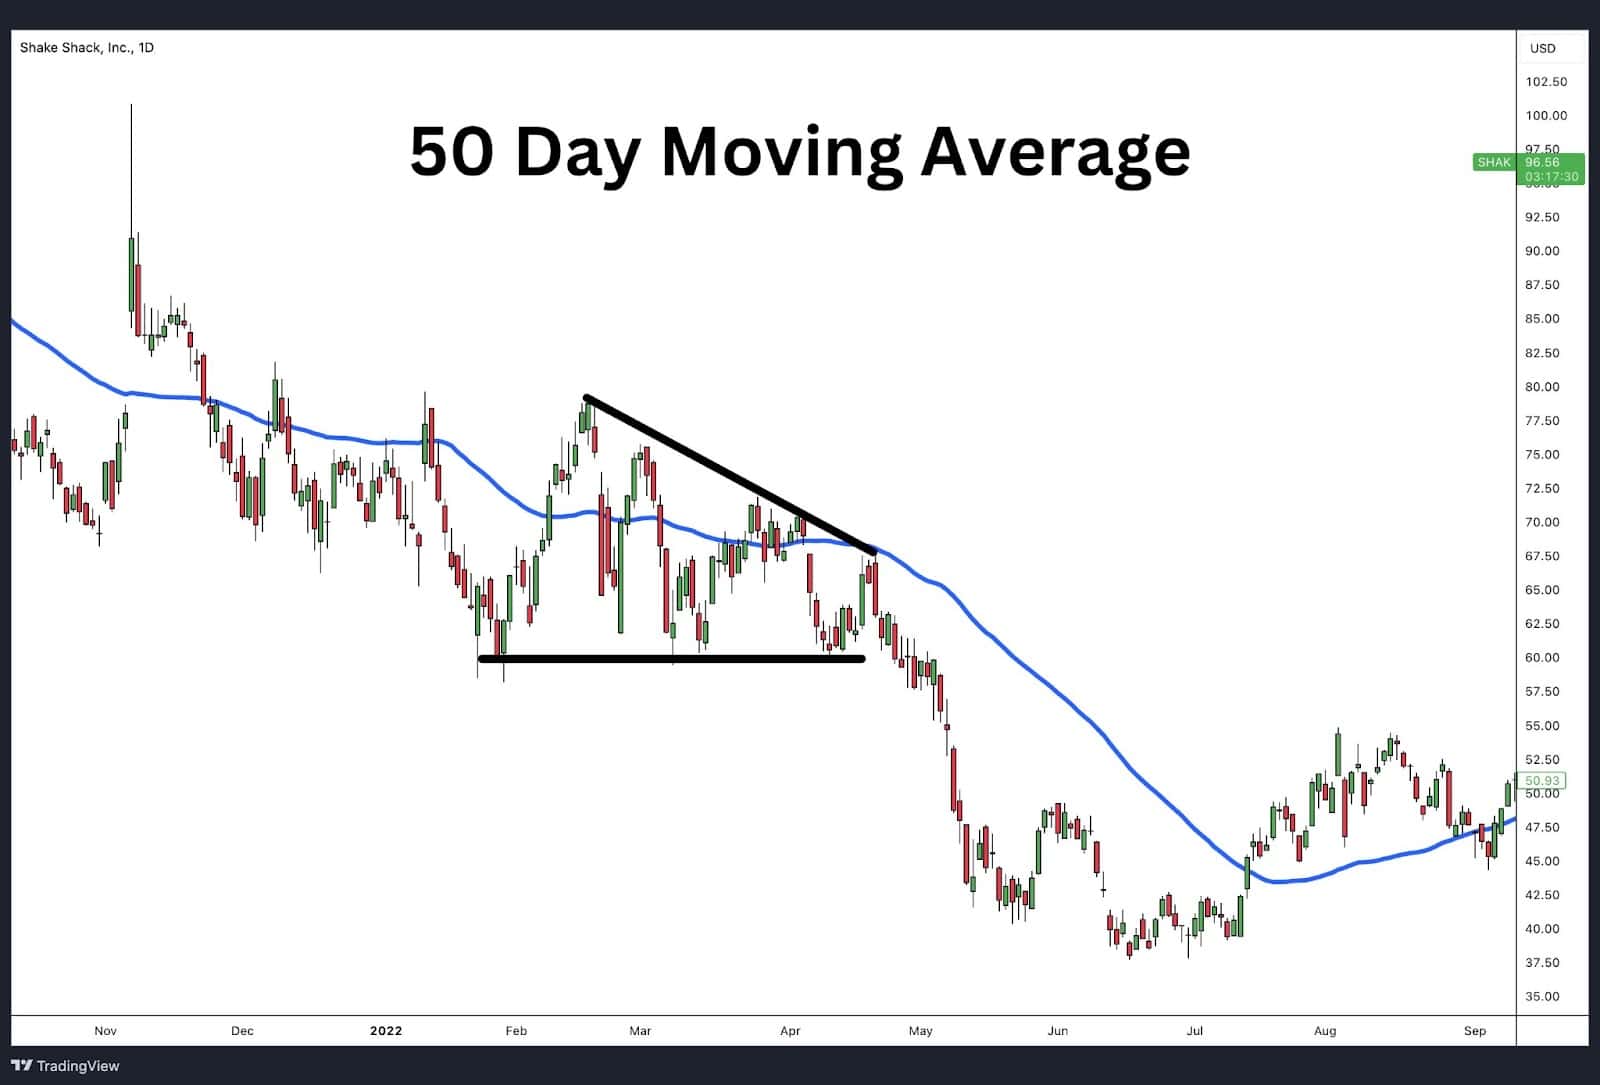
Incorporating moving averages into the analysis of a descending triangle pattern can provide additional confirmation of the breakout direction. In the attached example, the descending triangle breakout occurred while the price was already below the 50-day simple moving average. This positioning below the moving average highlights the bearish sentiment and reinforces the expectation of a downward continuation.
When the price remains consistently below the 50-day moving average during the formation of the descending triangle pattern, it indicates sustained selling pressure. The subsequent breakout below the horizontal support line further confirms that the downward trend continues. This scenario is a strong indicator that the descending triangle pattern is likely to result in a significant price decline, making it an effective signal for traders to consider short positions.
Using moving averages alongside the descending triangle pattern helps traders to validate the bearish chart pattern and make more informed decisions, particularly when the price action and moving averages align with the overall downward sloping trendline of the triangle pattern.
Descending Triangle With RSI

The Relative Strength Index (RSI) is valuable in confirming the strength of a breakout from a descending triangle pattern. An RSI value below 50 during the pattern’s formation and subsequent breakout indicates strong bearish momentum. A downward crossover of the RSI through the 50 level would indicate the pressure is shifting to the downside and that a bearish breakdown may be beginning.
Descending Triangle With MACD
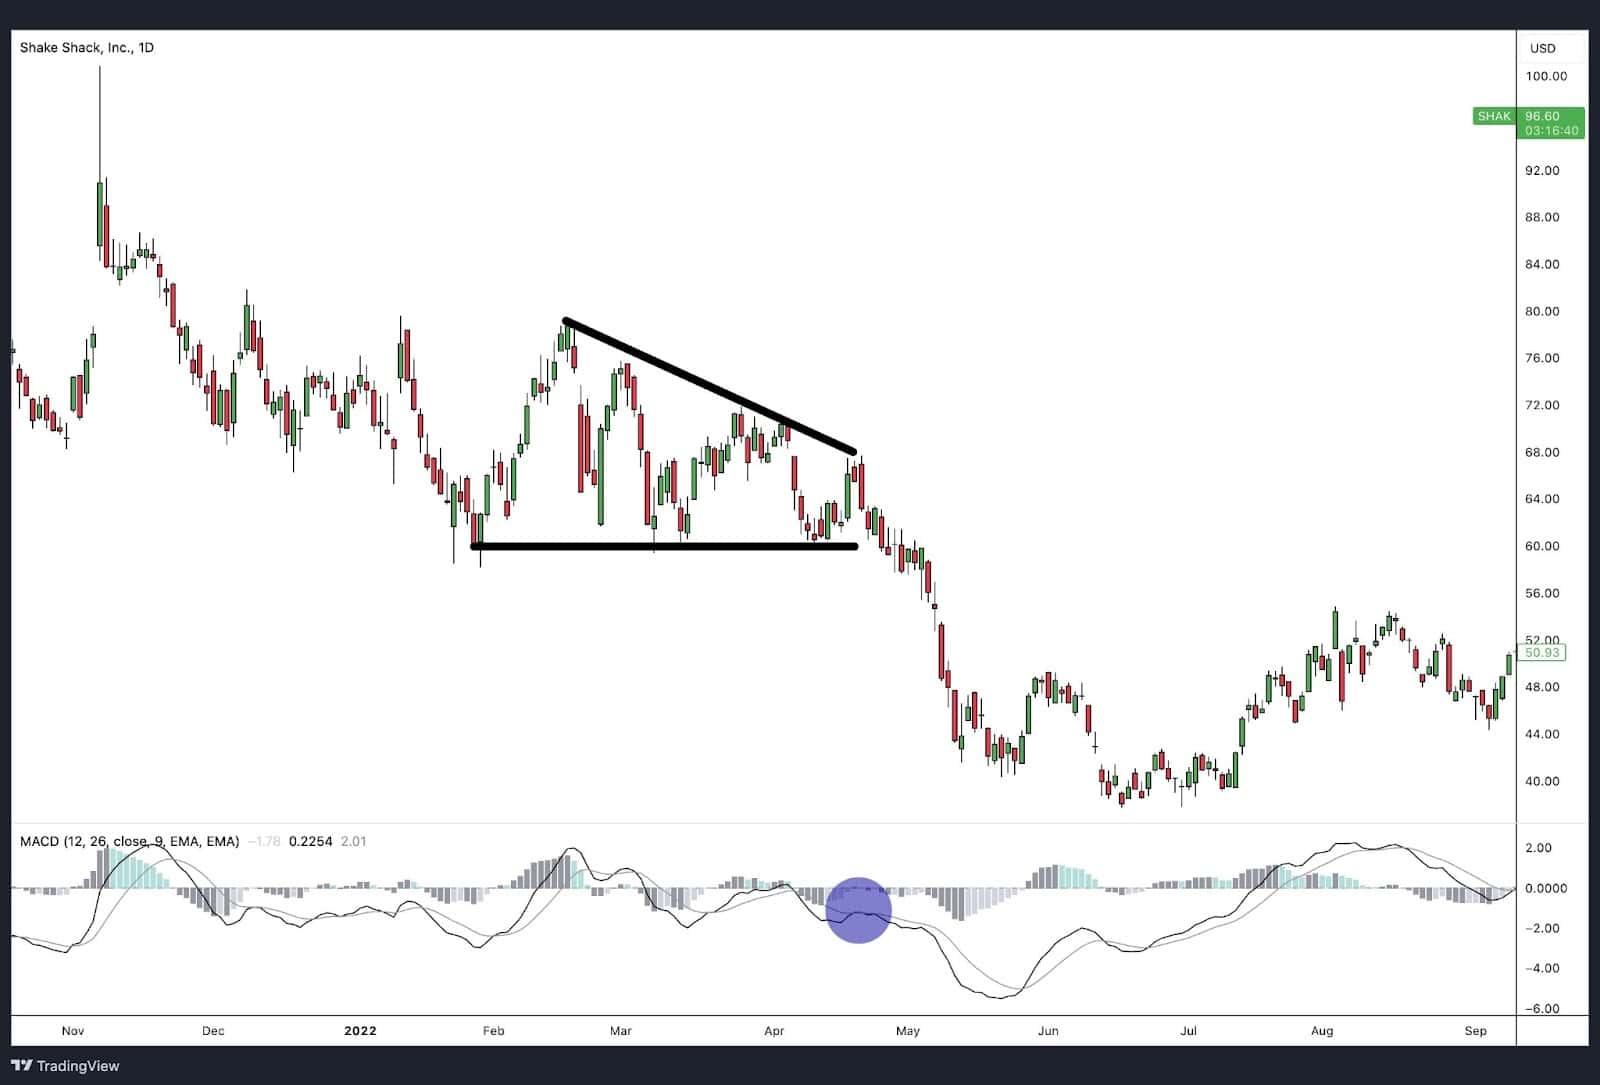
The Moving Average Convergence Divergence (MACD) is another powerful tool when used with a descending triangle pattern. A bearish MACD crossover, where the MACD line crosses below the signal line during the triangle’s formation or just before the breakout, can confirm the continuation of the downtrend. Additionally, the widening of the MACD histogram bars can indicate increasing bearish momentum.
Descending Triangle With Bollinger Bands
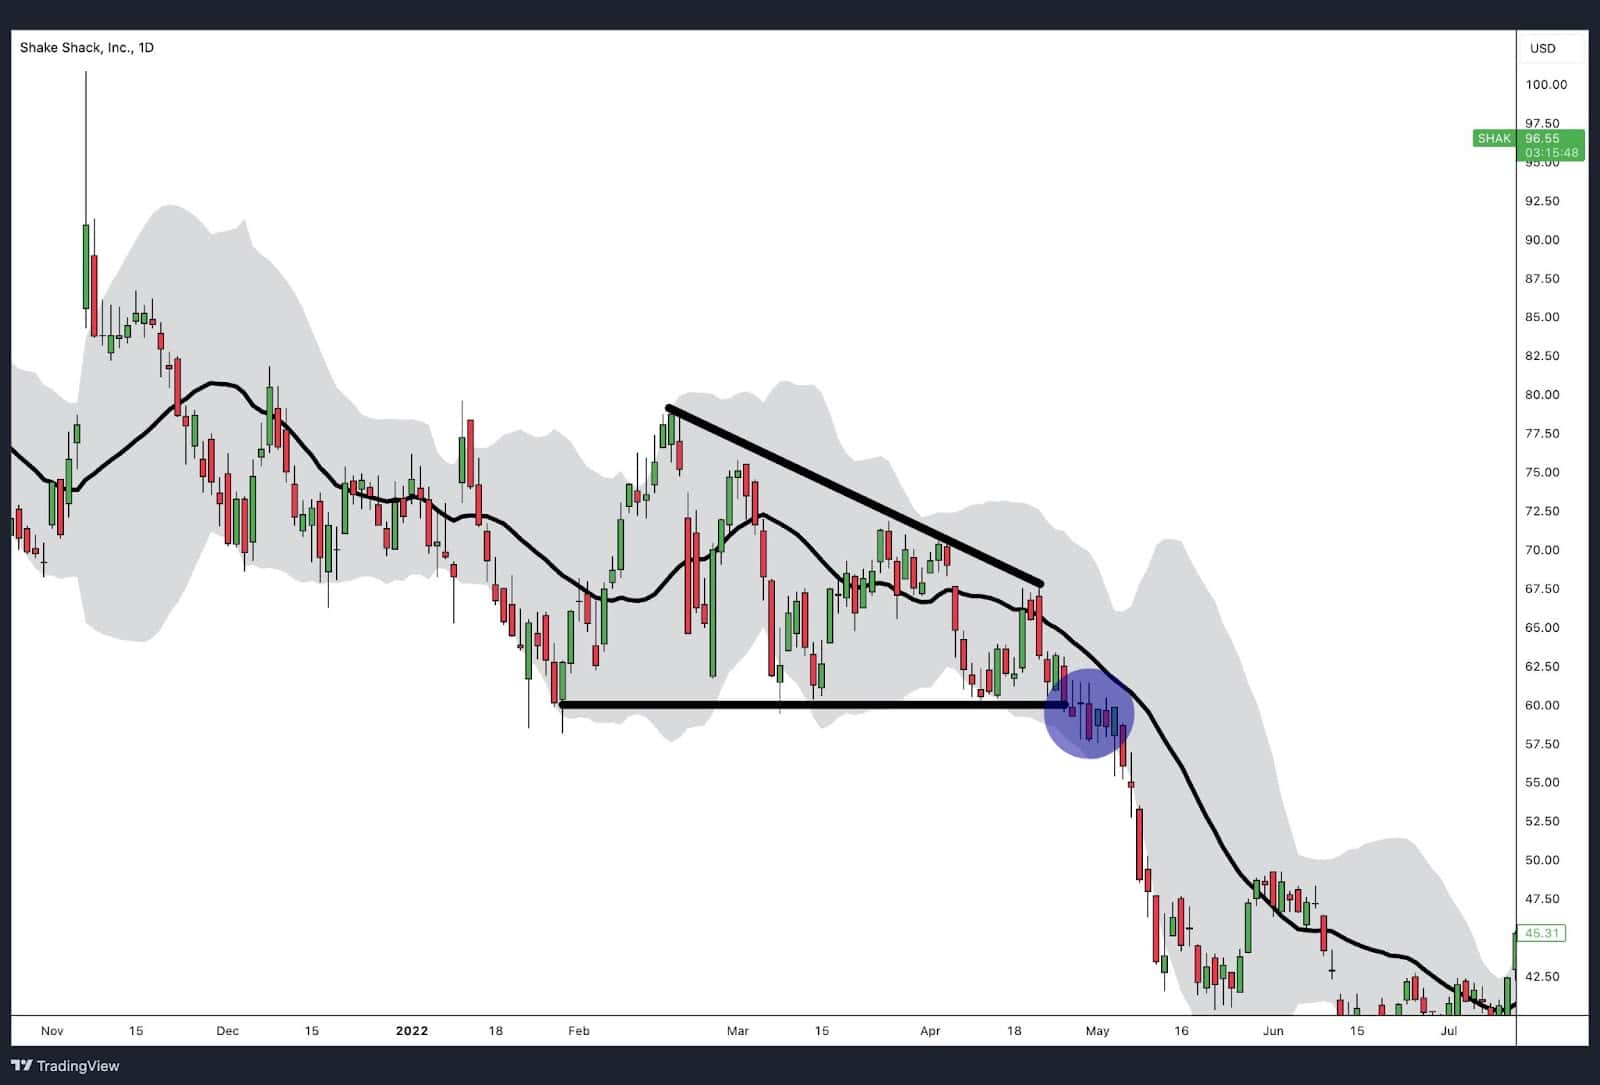
Bollinger Bands® can help identify potential breakouts from a descending triangle pattern. When the price nears the lower band during the triangle formation and then breaks below the support line, it typically signals a strong bearish move.
Additionally, during a consolidation phase, like the descending triangle, the width of the bands should contract and become smaller. This is the market trying to lull the market participants to sleep. As the price approaches the lower support zone, be on alert of a bearish breakout. The bearish break should also see the width of the Bollinger Bands increase as the bands expand due to increased volatility.
Descending Triangle Reversal Pattern in an Uptrend
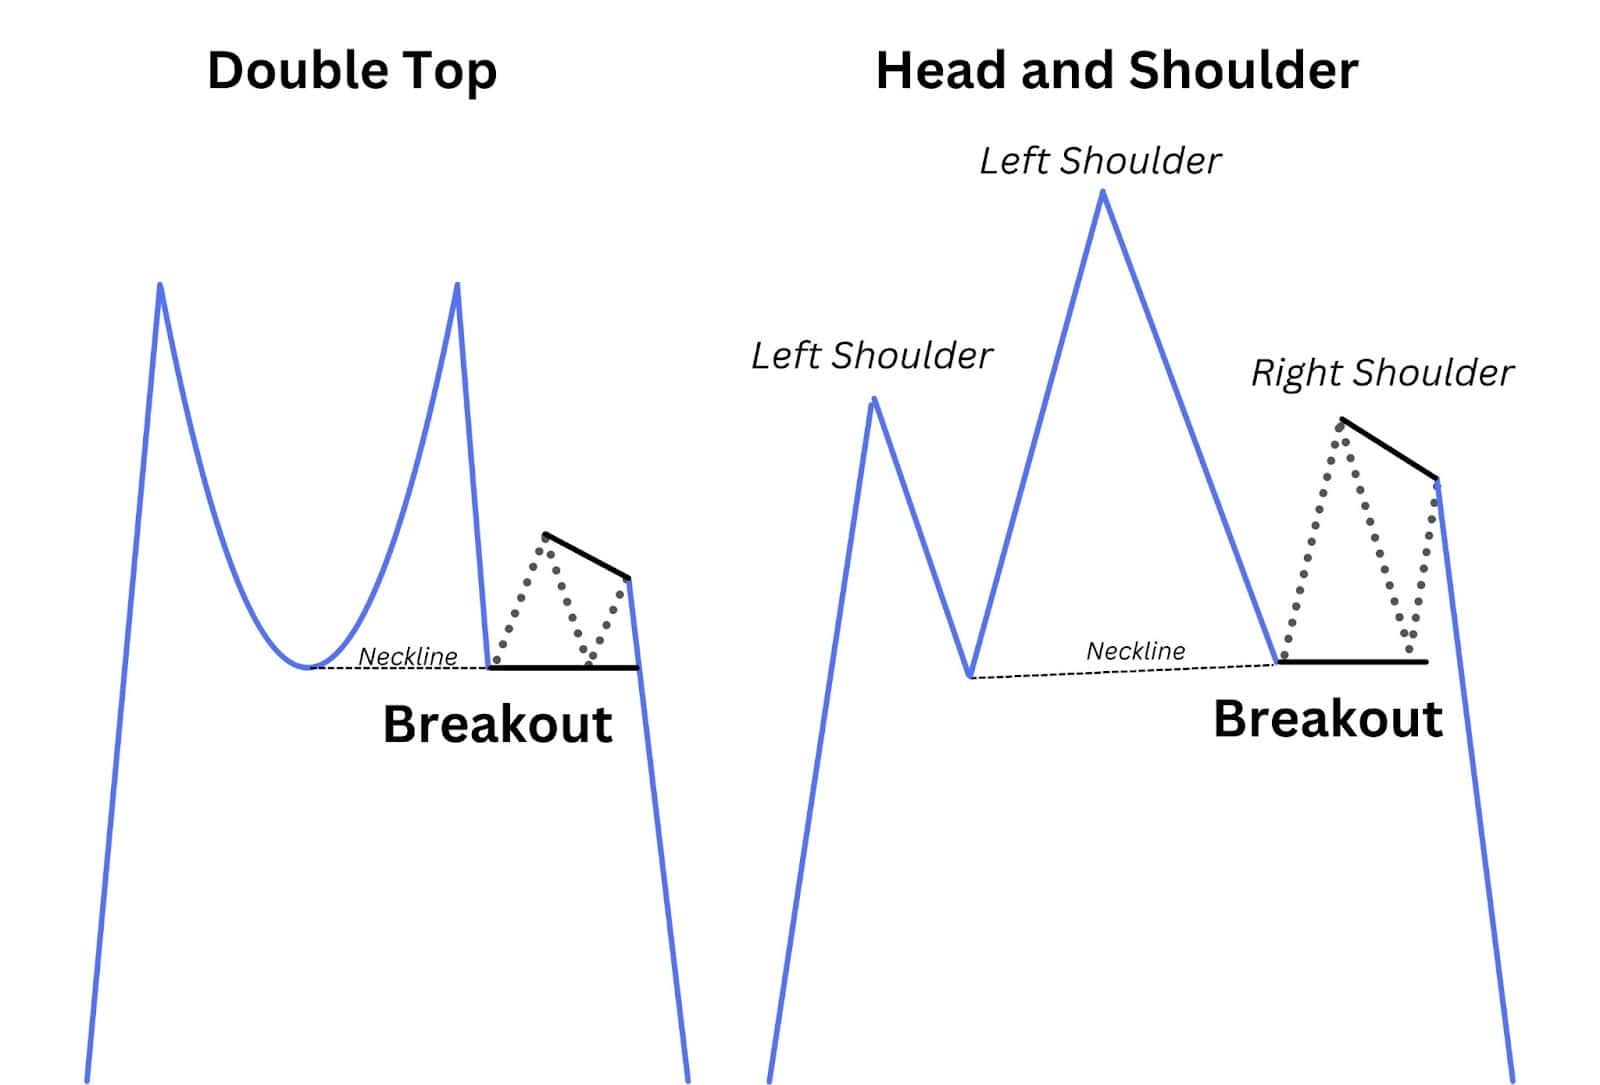
While typically a continuation pattern, the descending triangle pattern can also signal a reversal when it appears after an uptrend. In this context, the price action may indicate a shift from bullish to bearish sentiment, particularly if the breakout occurs with increased volume, confirming the reversal.
Interestingly, when a descending triangle pattern appears after an uptrend, it might also resemble other bearish reversal patterns, such as a double top or a head and shoulders pattern. For instance:
- Double Top: The descending triangle could form in the second peak in a double top, with the flat support line acting as the neckline. A breakout below this line would confirm the reversal.
- Head and Shoulders: The descending triangle might also represent the right shoulder in a head and shoulders pattern, where the breakdown below the neckline (also a horizontal support level) signals a trend change.
Regardless of the exact pattern name, the implications are the same: lower highs, flat support, and a breakdown to new lows indicate that a bearish trend is likely to follow.
Busted Descending Triangle
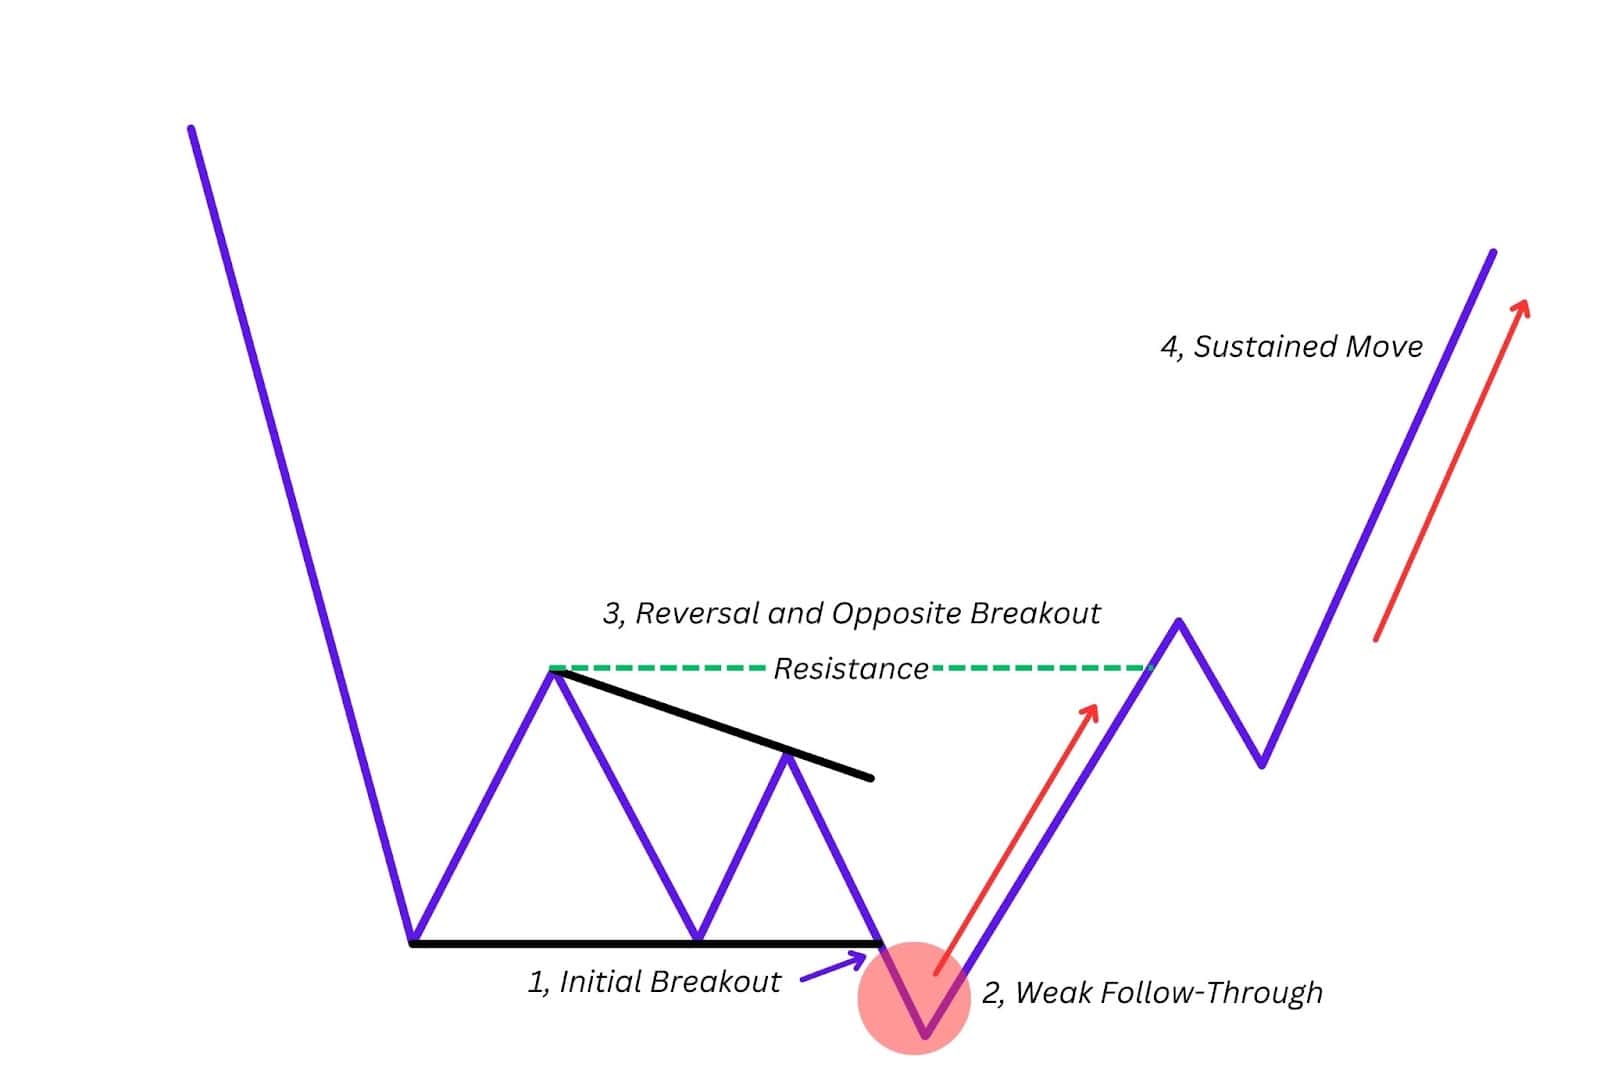
A busted descending triangle occurs when the price initially breaks out of a descending triangle in one direction but fails to follow through and quickly reverses. This reversal, leading to a breakout in the opposite direction, invalidates the original breakout, turning the pattern into a powerful reversal signal.
Theoretical Explanation of a Busted Descending Triangle
- Initial Breakout: The price initially breaks out of the triangle by closing below the horizontal support level of the triangle. This signals the possibility of further bearish movement.
- Weak Follow-Through: After the breakout, if the price moves only a small distance from the point of breakout and fails to reach the price target which is typically the width of the mouth of the triangle. This indicates that the market may not have enough strength to continue the downward trend.
- Reversal and Opposite Breakout: If the price reversal is significant and moves in the opposite direction beyond the original breakout point, it signals the failure of the pattern. For example, after an initial downward breakout, if the price climbs back up and breaks above the resistance of the triangle, the pattern busts.
Note: According to Bulkowski, this reversal is complete when the price moves more than 10% in the new direction. However, it’s important to note that Bulkowski’s findings were primarily based on stocks, and this percentage may vary across different asset classes, such as forex, crypto, or commodities. - Sustained Move in the New Direction: Once the pattern busts, the price often moves strongly in the reversal direction, leading to significant gains. This new trend can be confirmed by spotting a series of higher highs and higher lows.
Practical Considerations
- Target Price and Failure to Reach It: In a normal descending triangle breakout, the target price is calculated by measuring the width of the mouth of the triangle and projecting that distance from the breakout point. If the price fails to reach this target, it often sets the stage for a busted triangle. A busted triangle is one where the original breakout direction (upward or downward) fails to hit the price target and then reverses.
Example: McDonald’s Corporation (4H Chart)
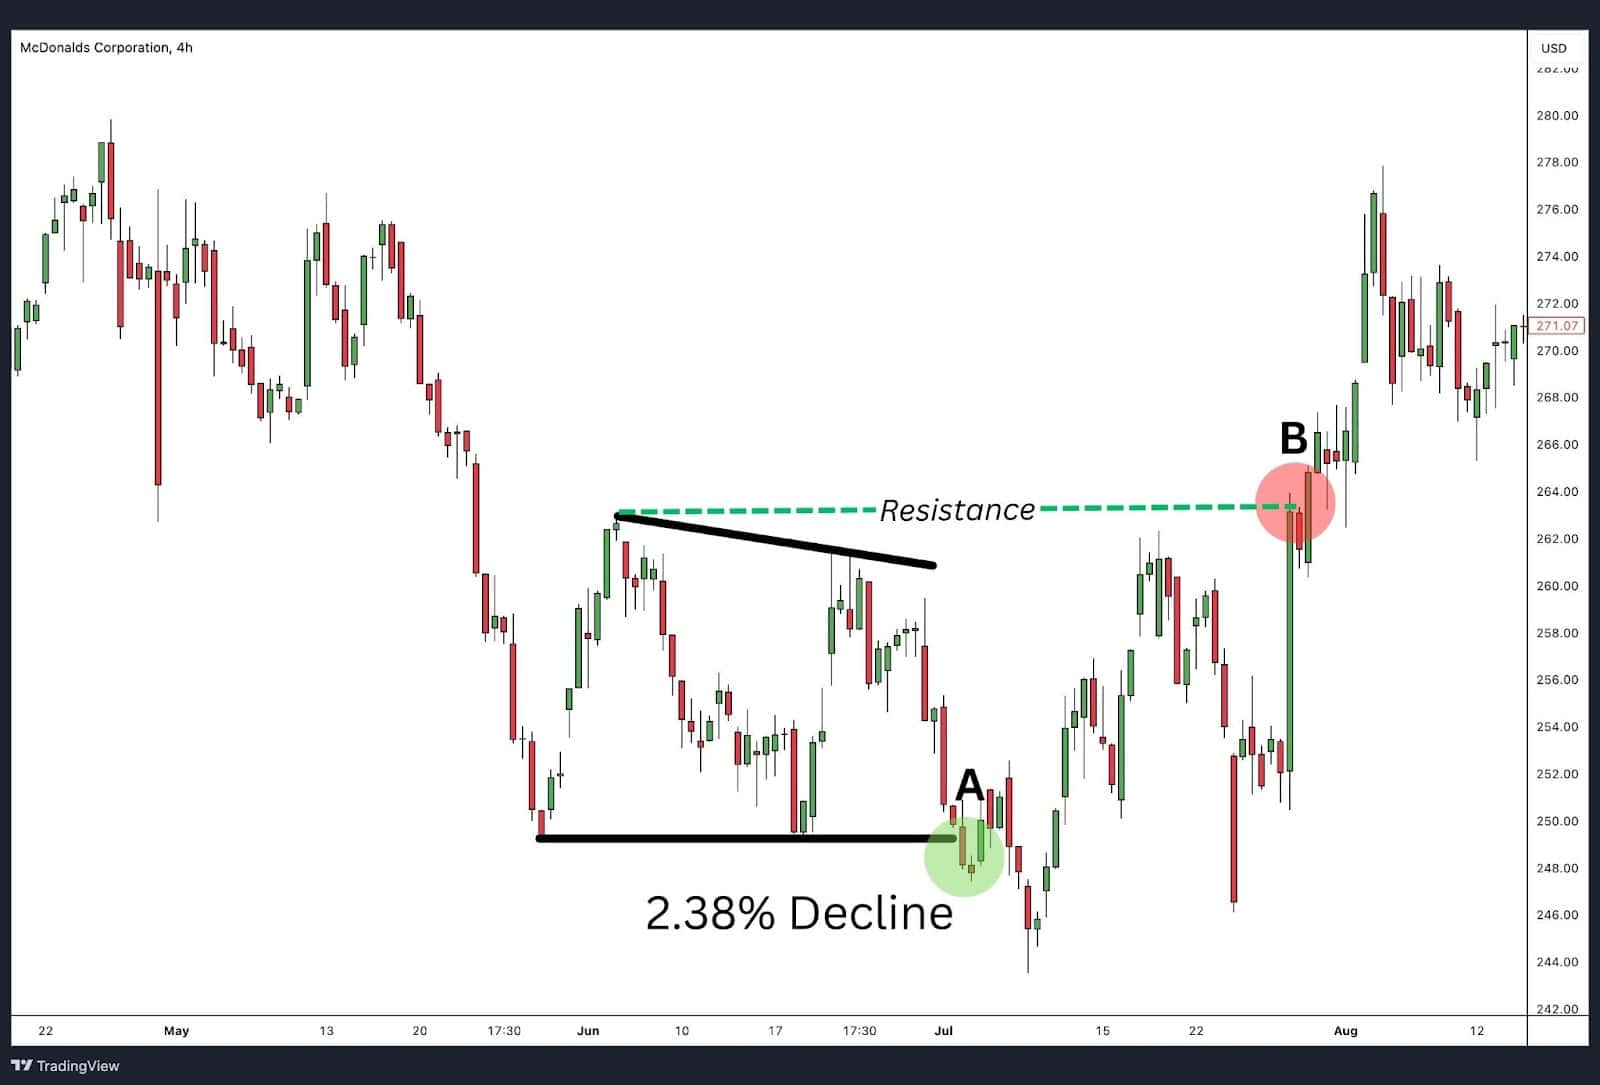
In the McDonald’s 4-hour chart shown above, a descending triangle formed between June and early July. Here’s how the busted pattern unfolded:
- Breakout to the Downside (Point A): Initially, the price broke downward from the triangle’s lower boundary, signalling a bearish move. However, this downward breakout only resulted in a 2.38% decline, far below the profit target, indicating weak follow-through.
- Reversal and Breakout (Point B): Shortly after the small decline, the price reversed sharply, closing above the upper boundary of the descending triangle. This invalidated the initial bearish breakout, confirming a busted descending triangle.
- Bullish Continuation: Following the bust, the price continued moving upward, as traders who were expecting a sustained bearish move were forced to close their positions.
In the McDonald’s example, the breakout to the downside was minimal, and the eventual bullish reversal created a strong upward trend, making this a classic example of a busted descending triangle in action.
Advantages of Trading on the Descending Triangle Pattern
Clear Entry and Exit Points
The descending triangle pattern provides well-defined entry and exit points, making it easier for traders to plan their trades. The horizontal support line offers a clear level for a breakout entry, while the descending resistance line helps identify stop-loss levels.
High Probability of Continuation
As a bearish continuation pattern, it often indicates that the prevailing downtrend is likely to persist. This aligns traders with the dominant market trend, increasing the chances of a successful trade.
Risk Management
The pattern allows for effective risk management. Traders can place stop losses just above the descending resistance line or the last swing high, minimising potential losses if the trade does not perform as expected.
Volume Confirmation
Volume dynamics during the breakout provide additional confirmation, helping traders distinguish between real and false breakouts. A surge in volume when the price breaks below support indicates strong selling pressure and a high probability of trend continuation.
Flexibility Across Markets
The descending triangle pattern is versatile and can be applied across various financial markets, including stocks, forex, and commodities. Its principles remain consistent, making it a valuable tool for traders in different asset classes.
Disadvantages of Trading on the Descending Triangle Pattern
Risk of False Breakouts
One of the major drawbacks is the potential for false breakouts. The price might initially break below the support line but then quickly reverse, trapping traders in losing positions.
Requires Confirmation
This pattern often needs confirmation from other technical indicators, such as volume or MACD, to avoid false signals, making it more complex to trade.
Timeframe Sensitivity
The effectiveness of the descending triangle pattern can vary across different timeframes, with longer timeframes generally providing more reliable signals. Shorter timeframes may produce more noise, leading to increased risk.
Market Context Dependency
The pattern is most effective in strongly trending markets. In choppy or sideways markets, it can produce misleading signals, increasing the risk of entering trades prematurely.
Descending Triangles vs Ascending Triangles
Descending Triangle
- Pattern Type: Bearish continuation pattern.
- Formation: Horizontal support line and descending resistance line.
- Breakout: Typically occurs below the support line, confirmed by increased volume.
- Market Sentiment: Reflects increasing selling pressure, indicating a potential continuation of a downtrend.
Ascending Triangle
- Pattern Type: Bullish continuation pattern.
- Formation: Horizontal resistance line and rising support line.
- Breakout: Typically occurs above the resistance line, confirmed by increased volume.
- Market Sentiment: Reflects increasing buying pressure, suggesting a continuation of an uptrend.
Key Differences
The primary difference between these two patterns is their breakout direction and implication for market sentiment. The ascending triangle typically results in a bullish breakout, while the descending triangle pattern generally signals a bearish continuation. The position of the horizontal line is also a key distinction—at the top for the ascending triangle (resistance) and at the bottom for the descending triangle (support).
Descending Triangles vs Symmetrical Triangles
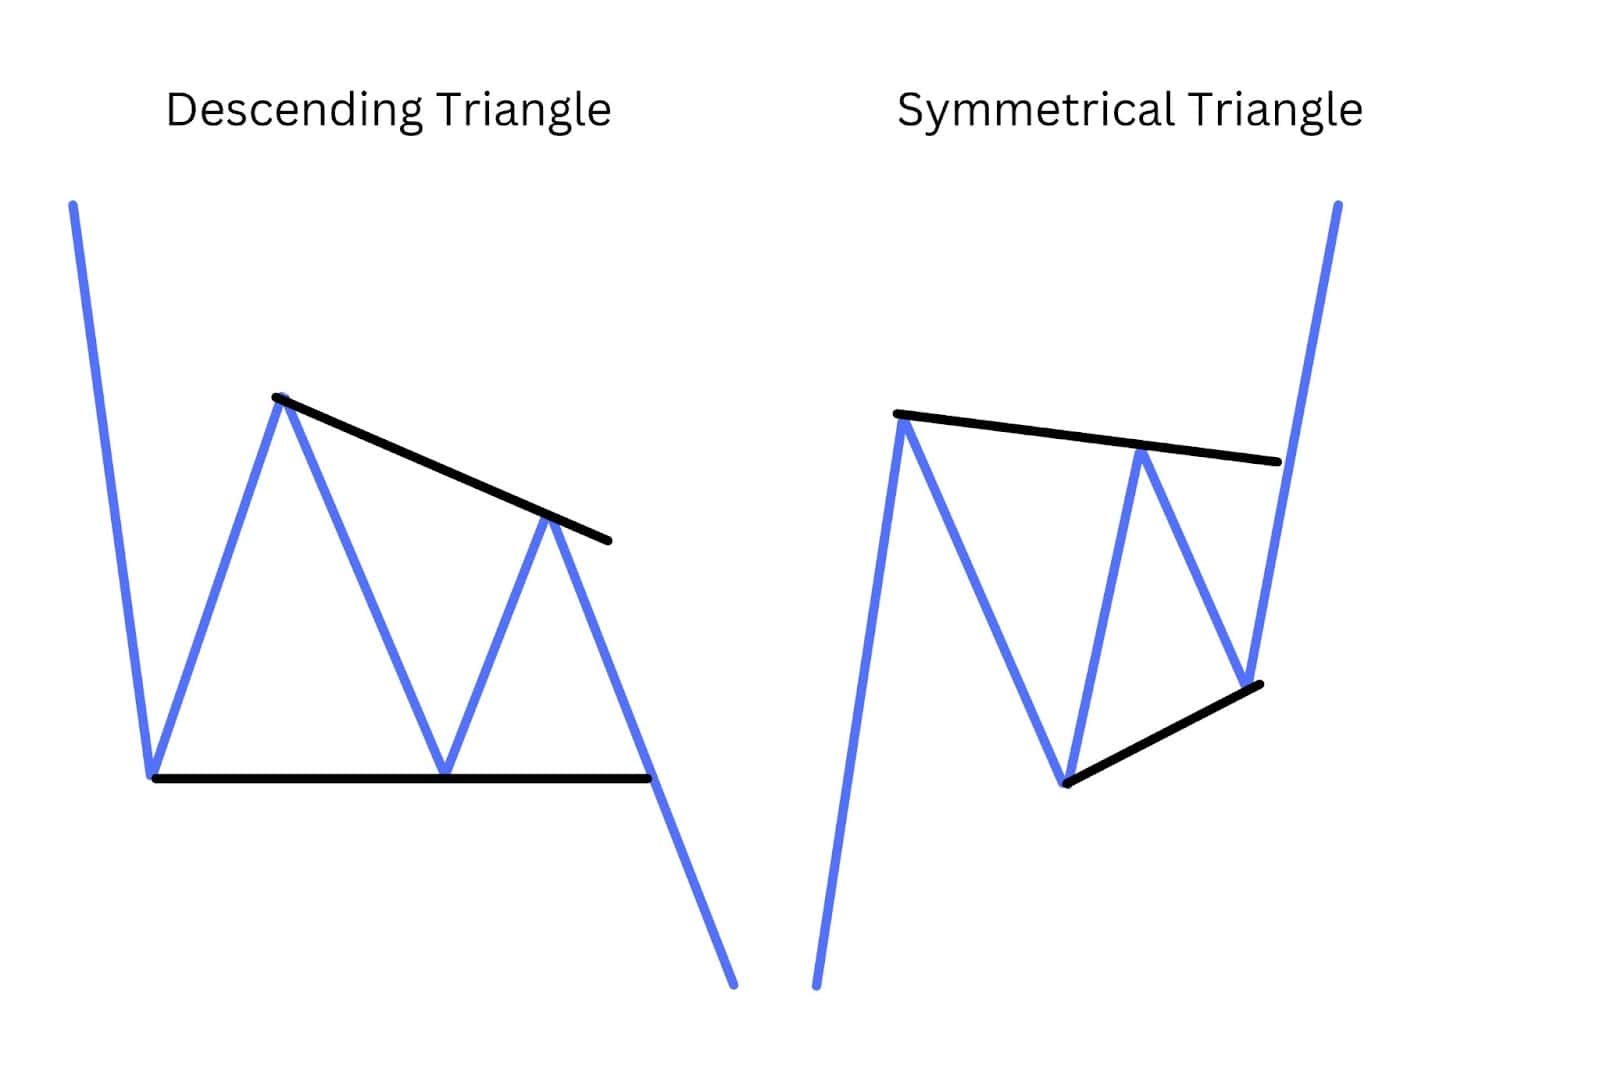
Descending Triangle
- Pattern Type: Bearish continuation pattern.
- Formation: Horizontal support line with a descending resistance line.
- Breakout: Typically occurs below the support line, suggesting a continuation of the downtrend.
- Market Sentiment: Reflects increasing selling pressure, signaling further downside potential.
Symmetrical Triangle
- Pattern Type: Neutral pattern that can indicate either continuation or reversal.
- Formation: Converging trendlines of higher lows and lower highs.
- Breakout: Can occur in either direction, requiring volume confirmation to validate the breakout direction.
- Market Sentiment: Reflects a period of consolidation, with no clear bias until the breakout occurs.
Key Differences
The main difference between these two patterns is the directional bias. The descending triangle pattern typically signals a bearish breakout, while the symmetrical triangle is neutral, with breakouts possible in either direction depending on market conditions. The descending triangle pattern’s horizontal support and downward-sloping resistance contrast with the symmetrical triangle’s sloped trendlines, making each pattern unique in its implications for future price action.
Descending Triangle vs Falling Wedge
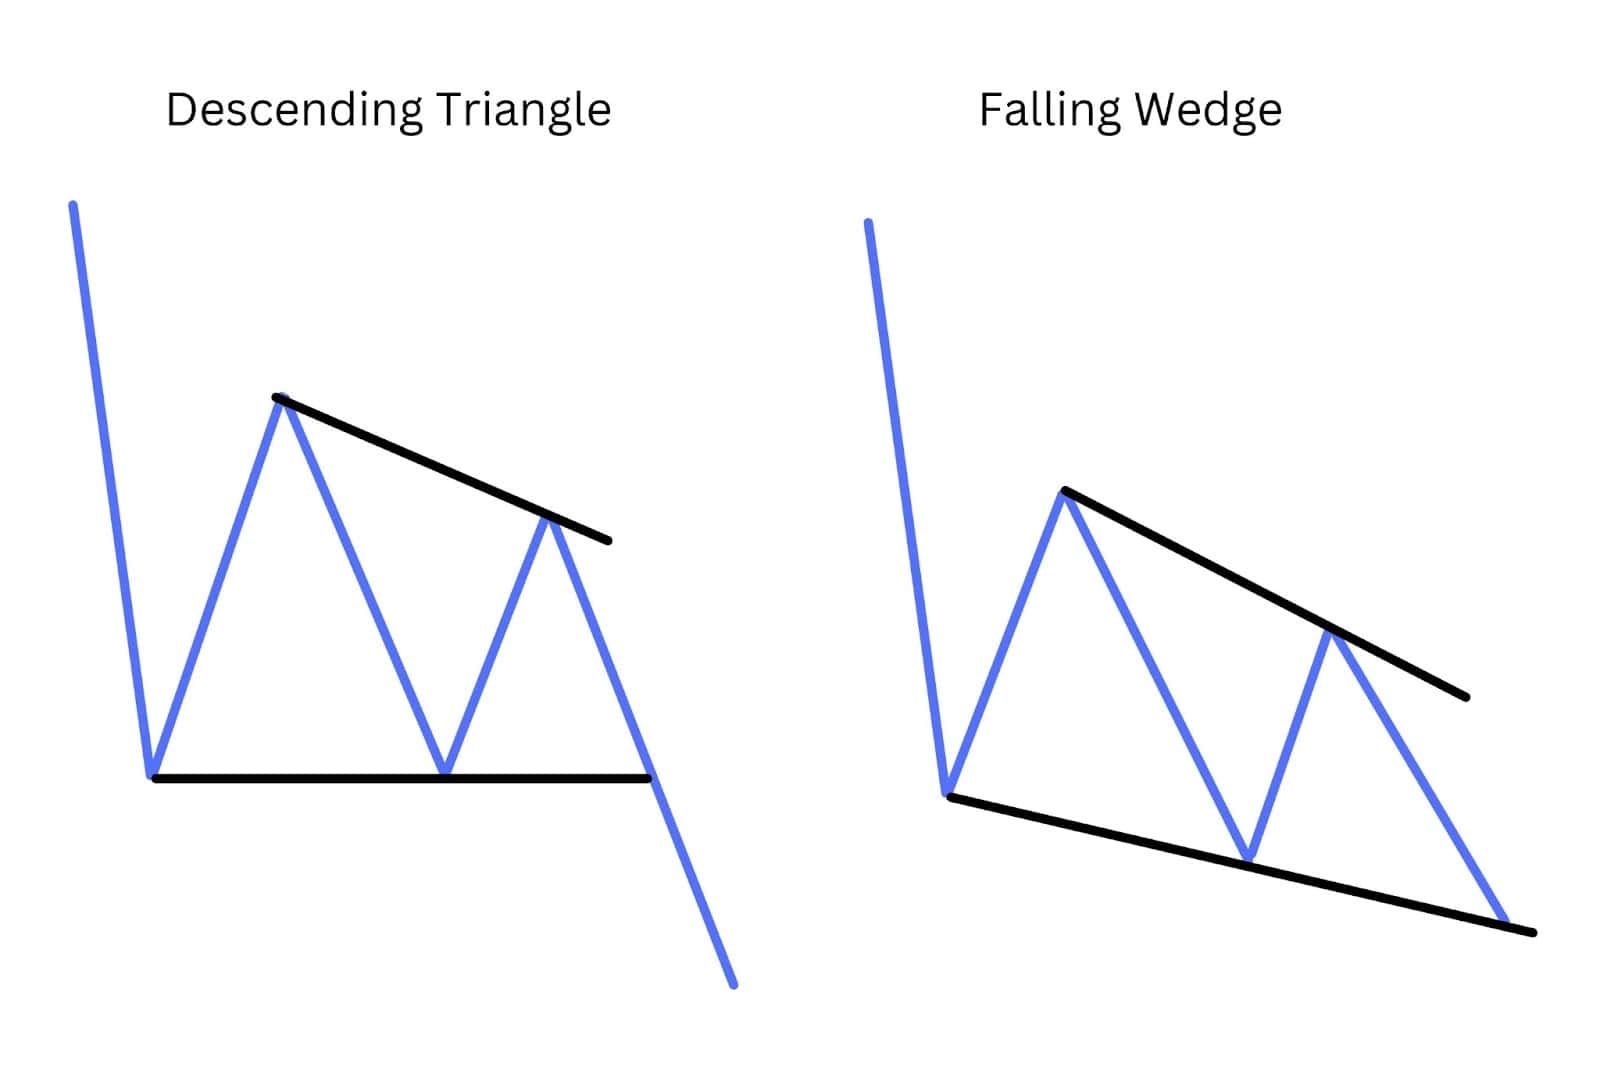
Descending Triangle
- Pattern Type: Bearish continuation pattern.
- Formation: Horizontal support line with a descending resistance line.
- Breakout: Typically occurs below the support line, signalling a continuation of the downtrend.
- Market Sentiment: Reflects increasing selling pressure, suggesting further downside potential.
Falling Wedge
- Pattern Type: Typically a bullish reversal pattern, though it can also act as a continuation pattern in a downtrend.
- Formation: Both the resistance and support lines are sloping downward, but the resistance line falls more steeply, creating a narrowing pattern.
- Breakout: Usually occurs above the resistance line, indicating a potential reversal or continuation to the upside.
- Market Sentiment: Suggests that selling pressure is waning, and a bullish reversal may be imminent.
Key Differences
The primary difference lies in their implications: the descending triangle pattern is usually bearish, signalling a continuation of a downtrend, while the falling wedge often indicates a bullish reversal, even if it forms within a downtrend. The descending triangle pattern features a flat support line, while the falling wedge has two downward-sloping lines that converge.
Descending Triangle vs Triple Bottom
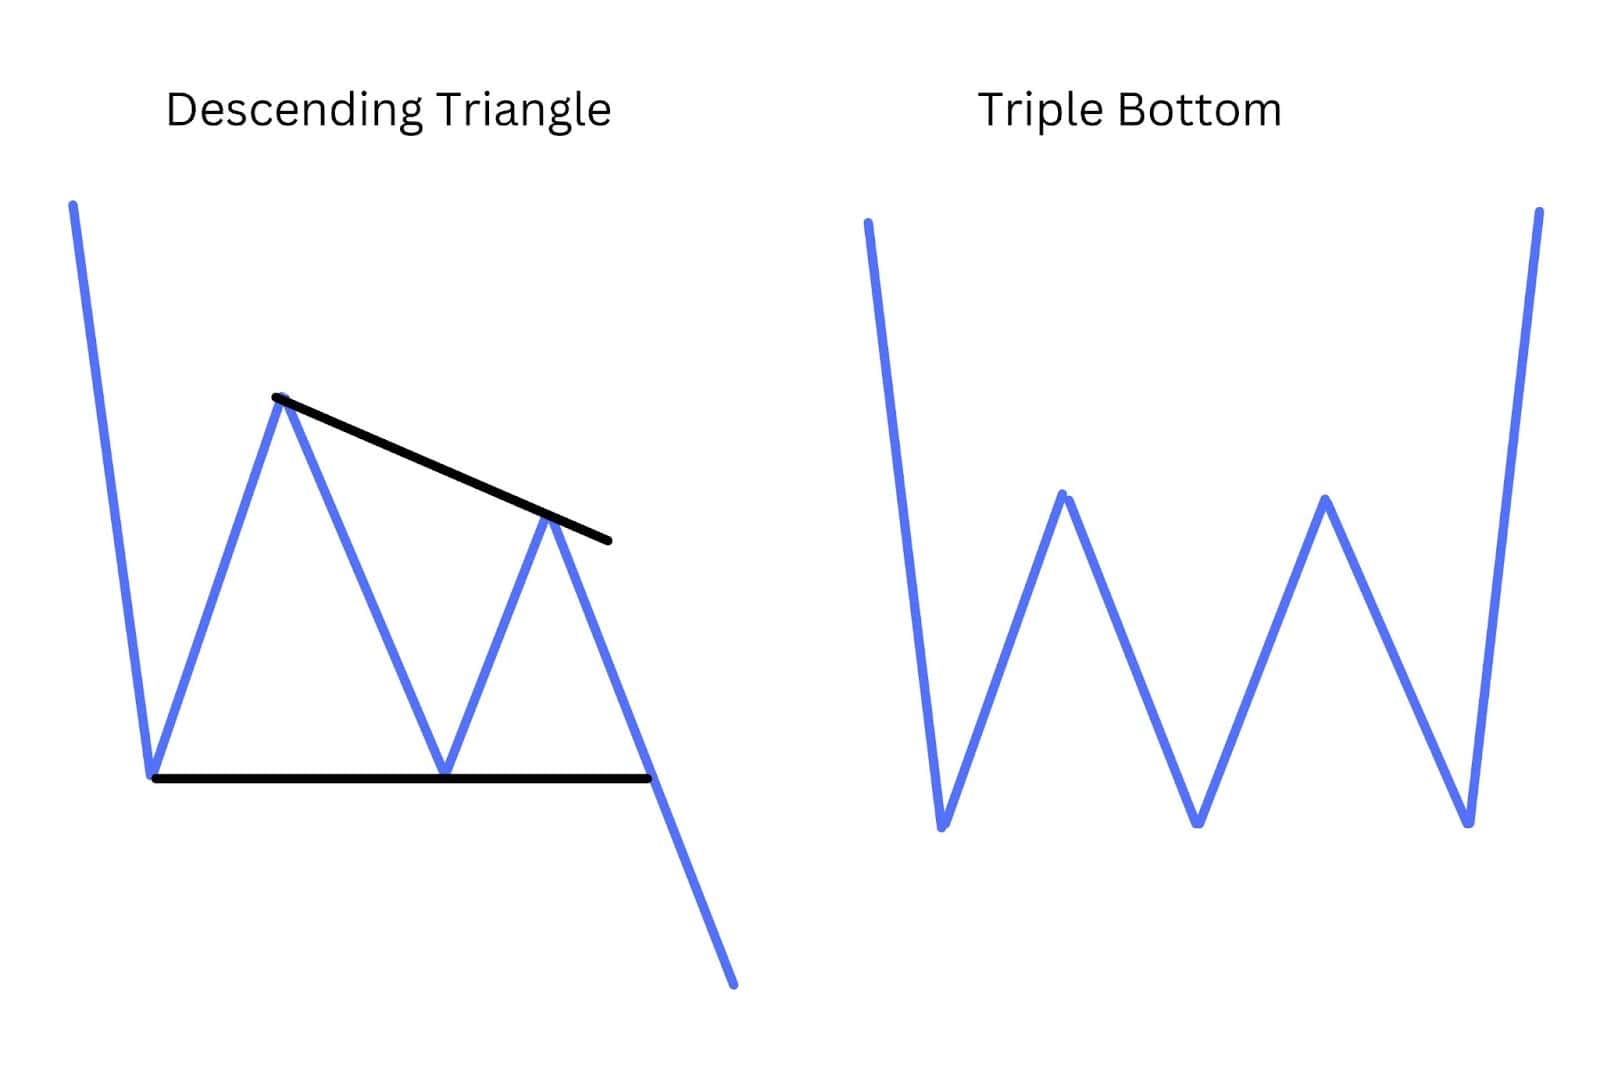
Descending Triangle
- Pattern Type: Bearish continuation pattern.
- Formation: Horizontal support line with a descending resistance line.
- Breakout: Typically occurs below the support line, indicating the continuation of a downtrend.
- Market Sentiment: Reflects increasing selling pressure, signalling further downside potential.
Triple Bottom
- Pattern Type: Bullish reversal pattern.
- Formation: Three distinct lows at approximately the same level, indicating strong support.
- Breakout: Occurs above the resistance formed by the highs between the lows, signalling a potential reversal to the upside.
- Market Sentiment: Suggests the end of a downtrend and the potential for a bullish reversal.
Key Differences
The descending triangle pattern generally signals a bearish continuation, with price expected to break downwards, while the triple bottom indicates a bullish reversal after testing support three times. The descending triangle pattern has a descending resistance line, whereas the triple bottom features three equal lows, reflecting strong support.
Descending Triangle in Elliott Wave Theory
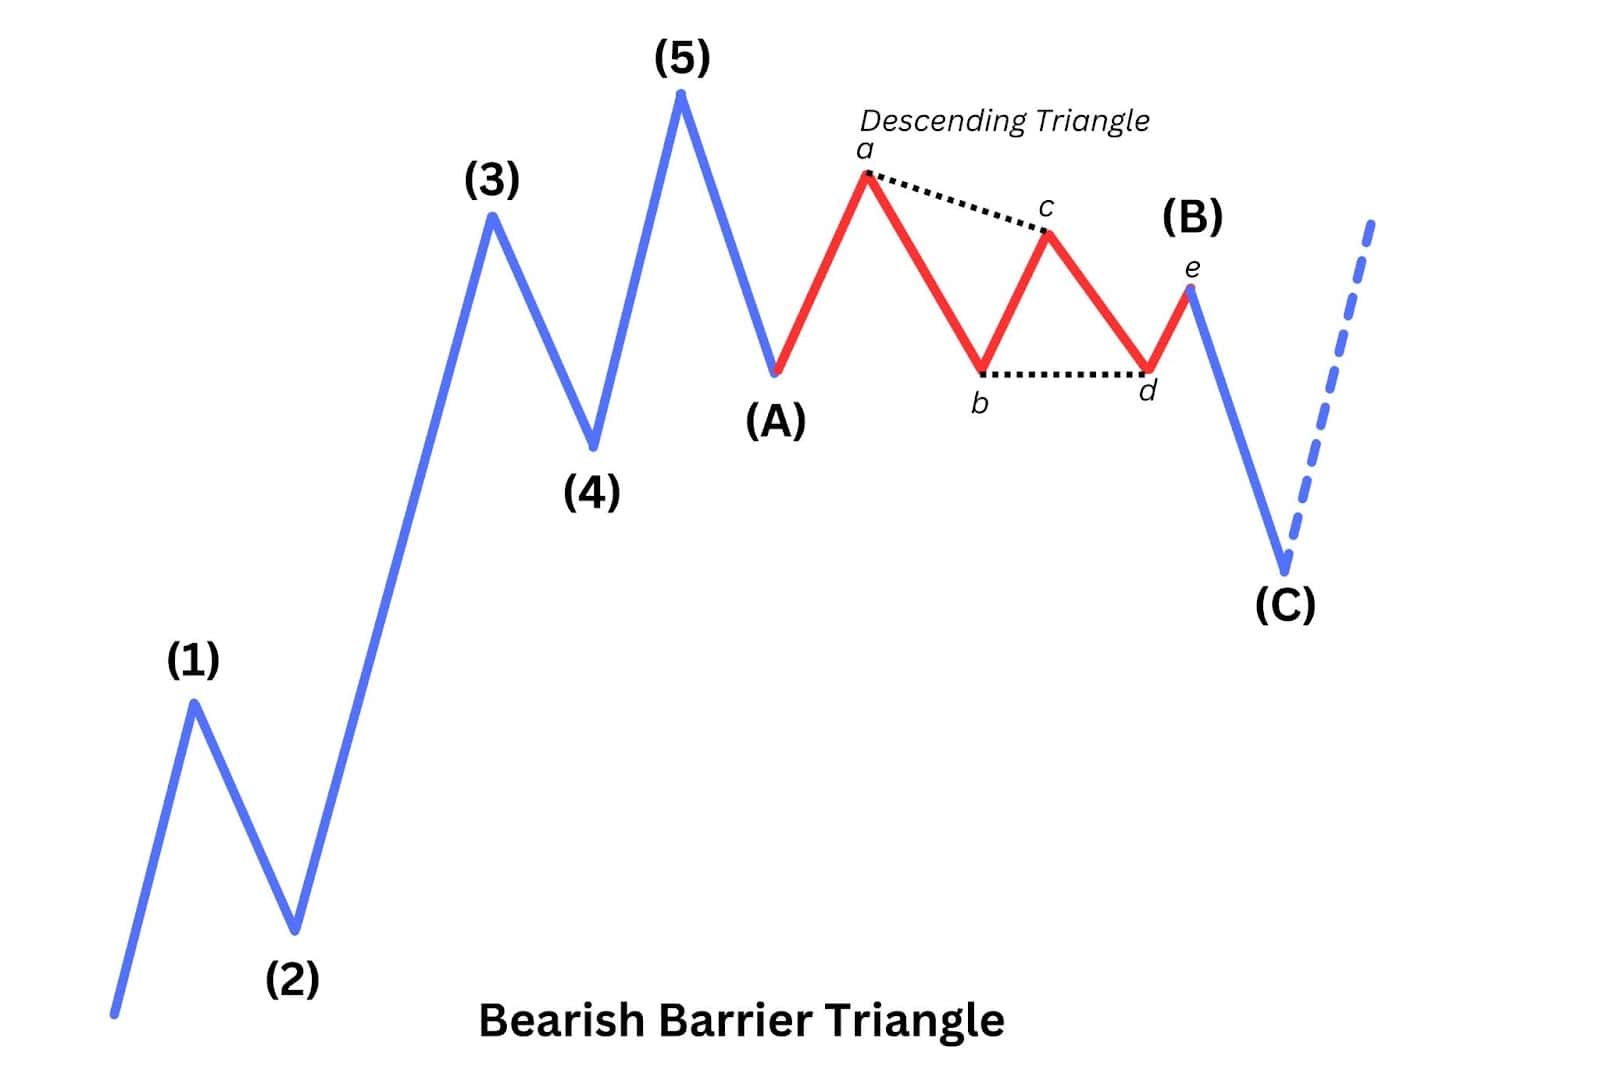
Example: Wave B of a Bearish Zig Zag
In Elliott Wave Theory (EWT), the descending triangle, plays a significant role as a corrective pattern. It typically appears in specific wave positions within larger bearish structures:
- Wave B of a Bearish Zigzag: The descending triangle pattern can form as Wave B in a bearish zigzag correction, where the triangle represents a consolidation before the final downward move in Wave C.
- Wave X of a Bearish Double Zigzag: In more complex corrections, the descending triangle may appear as Wave X, connecting two zigzags. This triangle pattern acts as a pause before the second zigzag resumes the downtrend.
- Wave 4 of a Bearish Impulse Pattern: The descending triangle can also form in Wave 4 of a bearish impulse wave, signalling the final consolidation before the fifth and final wave drives the market lower.
In each case, the descending triangle serves as a continuation pattern within the broader Elliott Wave structure, indicating that the downward trend continues after the triangle completes. This pattern is integral to EWT as it helps traders anticipate the next move within a larger wave sequence.
FAQ
What happens when a descending triangle pattern breaks out?
When a descending triangle breaks out, it typically does so below the support line, signalling a continuation of the downtrend with strong selling pressure.
How often does the descending triangle pattern occur?
The descending triangle pattern occurs relatively frequently, especially during established downtrends.
How long does a descending triangle pattern last?
The duration of a descending triangle pattern can vary, lasting from a few hours to several months.
Common descending triangle pattern mistakes to watch out for?
Common mistakes include misidentifying the pattern, entering without volume confirmation, and falling for false breakouts.
What is the best time frame to use for the descending triangle pattern?
Daily charts are commonly used, though the pattern can be effective across various timeframes from minutes to months.
What is the psychology behind the descending triangle pattern?
The pattern reflects increasing bearish sentiment, with sellers gradually pushing prices lower until support breaks.
How reliable is the descending triangle pattern?
The descending triangle pattern is generally reliable, especially when confirmed by volume and other indicators.
Is the descending triangle pattern bullish or bearish?
The descending triangle pattern is typically a bearish pattern, signalling a continuation of the downtrend.


