


Written by:

Reviewed by:

- March 30, 2026
- 24 min read
Trendline in Trading: Uptrend Line and Downtrend Line
When you start trading, you probably hear about trendlines very early on. But did you know they are one of the oldest tools in technical analysis, used for over a hundred years?
Long before modern indicators, early market analysts used trendlines to study price movement and market direction.
They are still used today because they help organise price action and make market direction easier to understand across different financial markets.
In this guide, you’ll learn how trendlines work, understand what they really tell us, how to draw and validate them correctly, and how to use them on different trading strategies.
What is a Trendline?
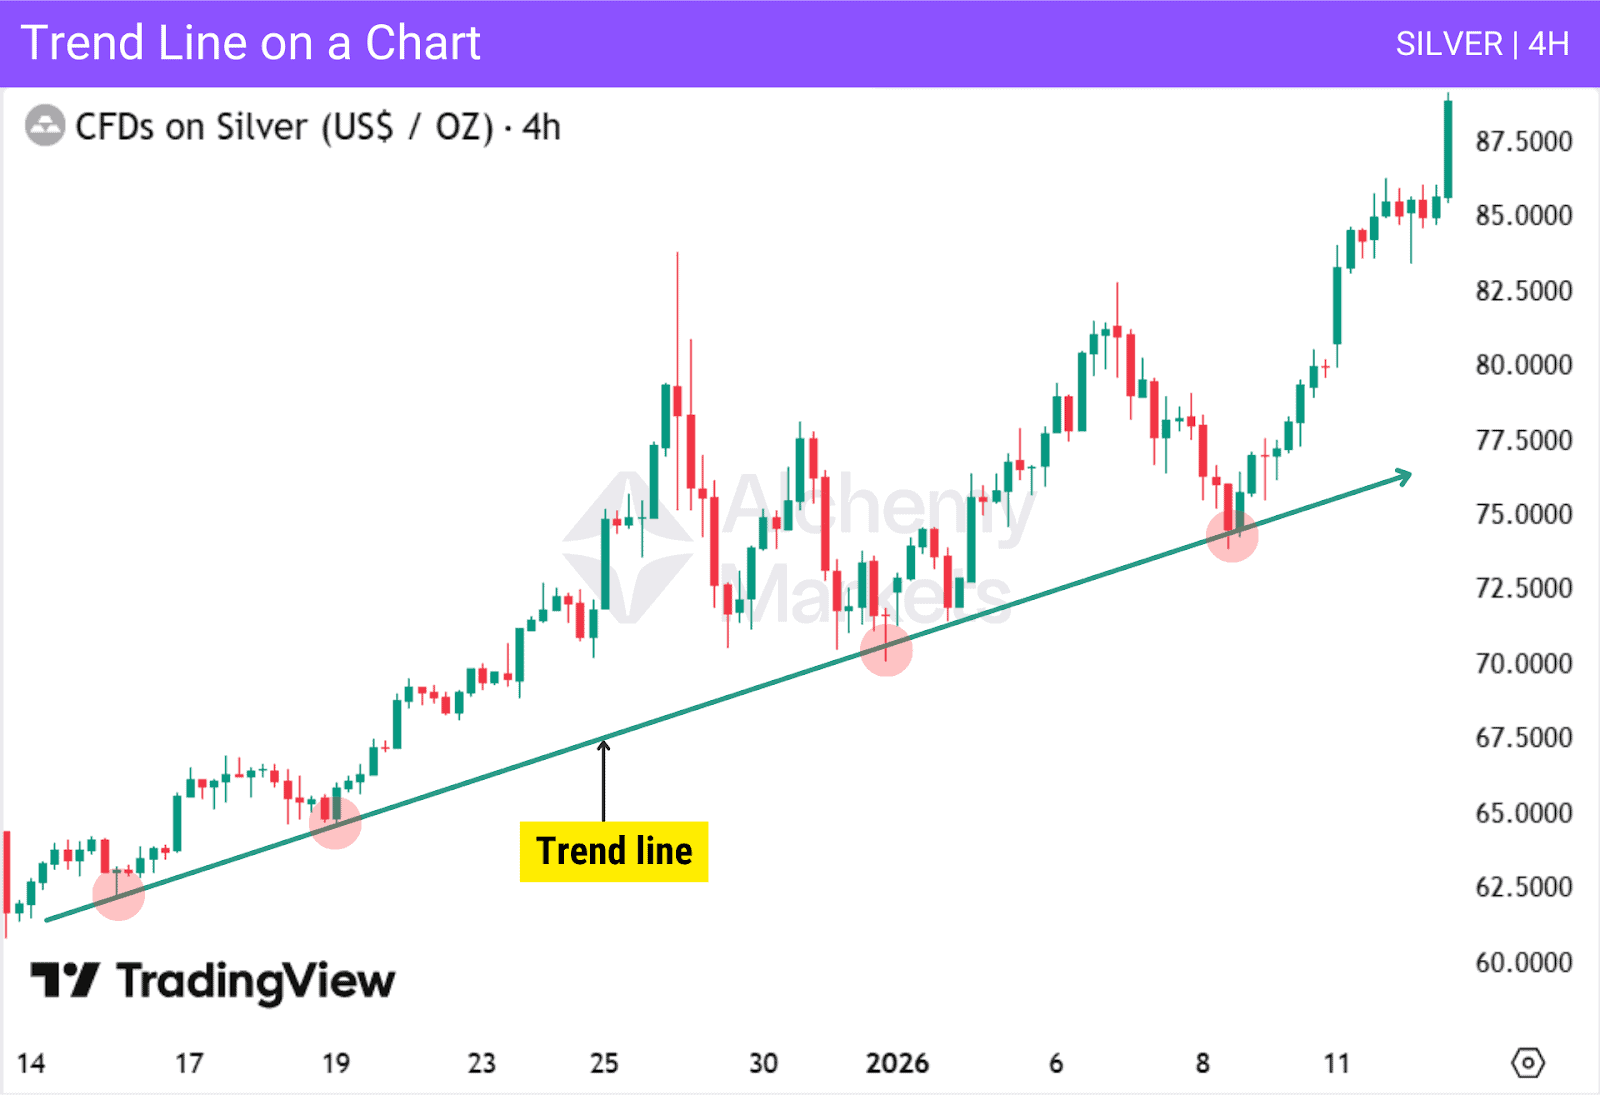
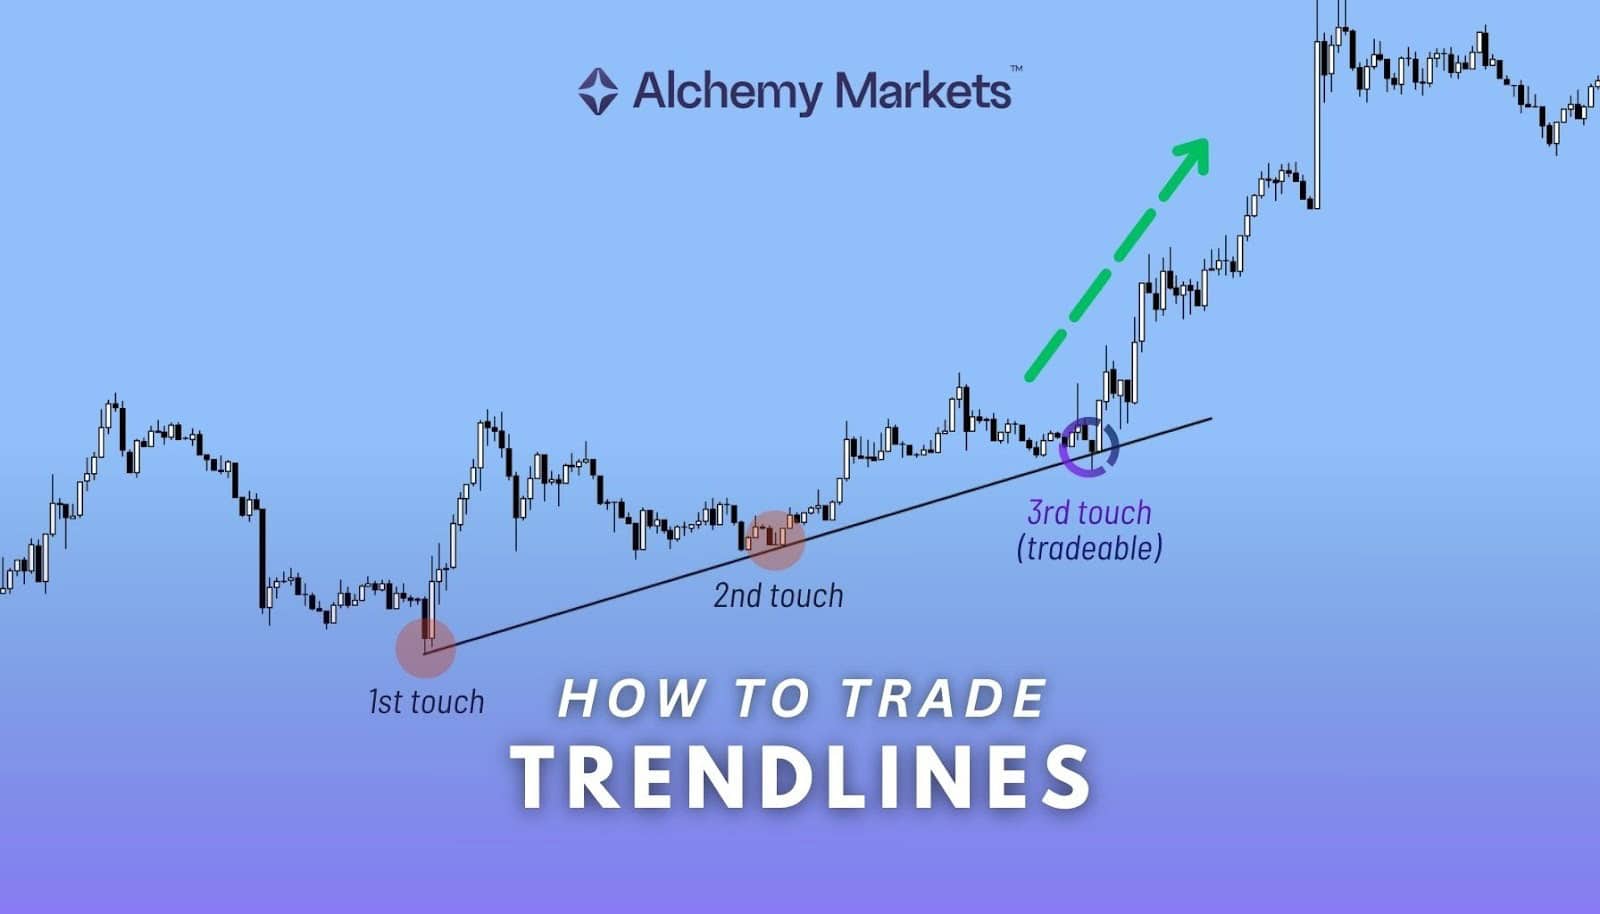
Trendline definition: A trendline is a straight line drawn on a price chart to show the primary direction of a market over time. It is created by connecting two or more significant price points, helping traders see whether price is trending upward, downward, or moving sideways.
In technical analysis, trendlines are primarily used to identify market direction and determine who is in control, buyers or sellers, allowing traders to align their trades with the prevailing trend.
Trendlines can also help identify potential entries when combined with tools such as candlestick patterns, volume, or common technical indicators.
What Is an Uptrend Line?
An uptrend line, or an ascending trendline, is drawn in a rising market and represents a bullish support area.
These types of trendlines are formed by connecting at least two significant lows, with the second low higher than the first, creating a line with a positive slope.
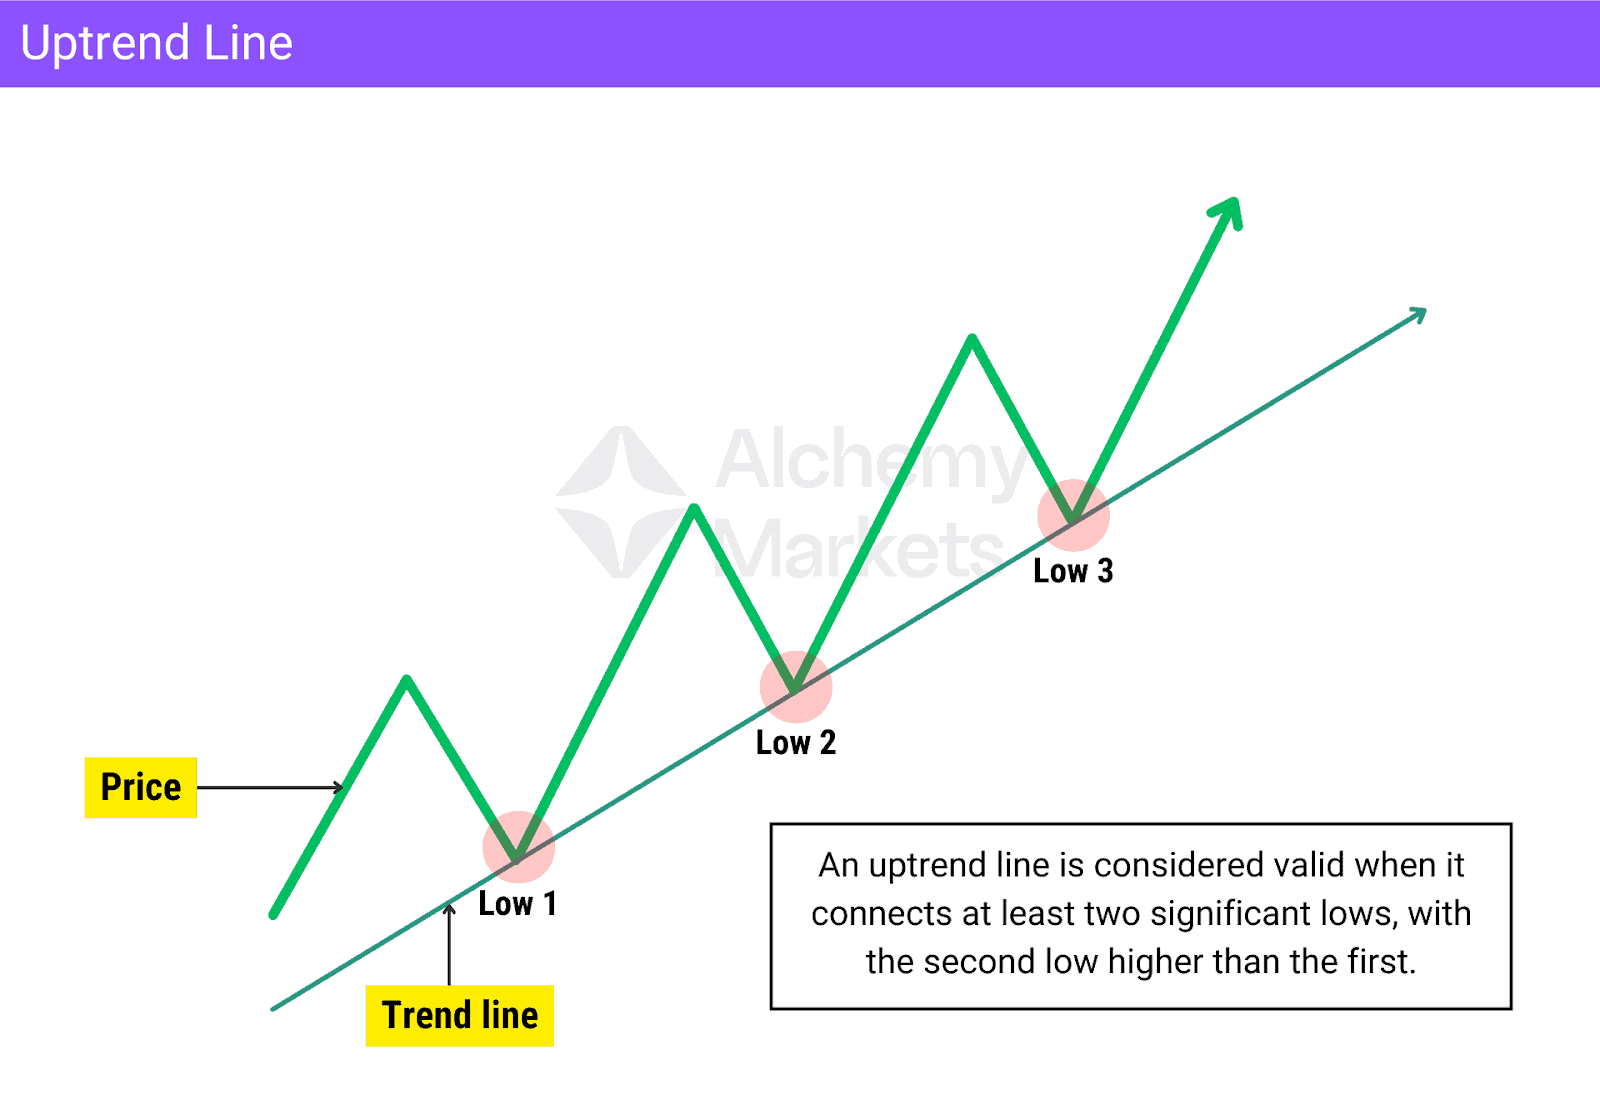
In an uptrend, price often pulls back before continuing higher. The uptrend line helps identify where these pullbacks may find support, showing that buyers are still in control when price stays above the line.
Traders use uptrend lines to:
- Confirm bullish market direction
- Identify potential buying opportunities during pullbacks
A break of an uptrend line can indicate weakening buying pressure, especially when it occurs with wicks or small candles, and price may still respect the trendline.
A decisive move below the line, marked by large bearish candles closing below it, carries more weight and suggests the trendline may no longer be valid for buying opportunities.
What Is a Downtrend Line?
A downtrend line, or a descending trendline, is drawn in a declining market and represents a bearish resistance area.
These types of trendlines are formed by connecting at least two significant highs, with the second high lower than the first, creating a line with a negative slope.
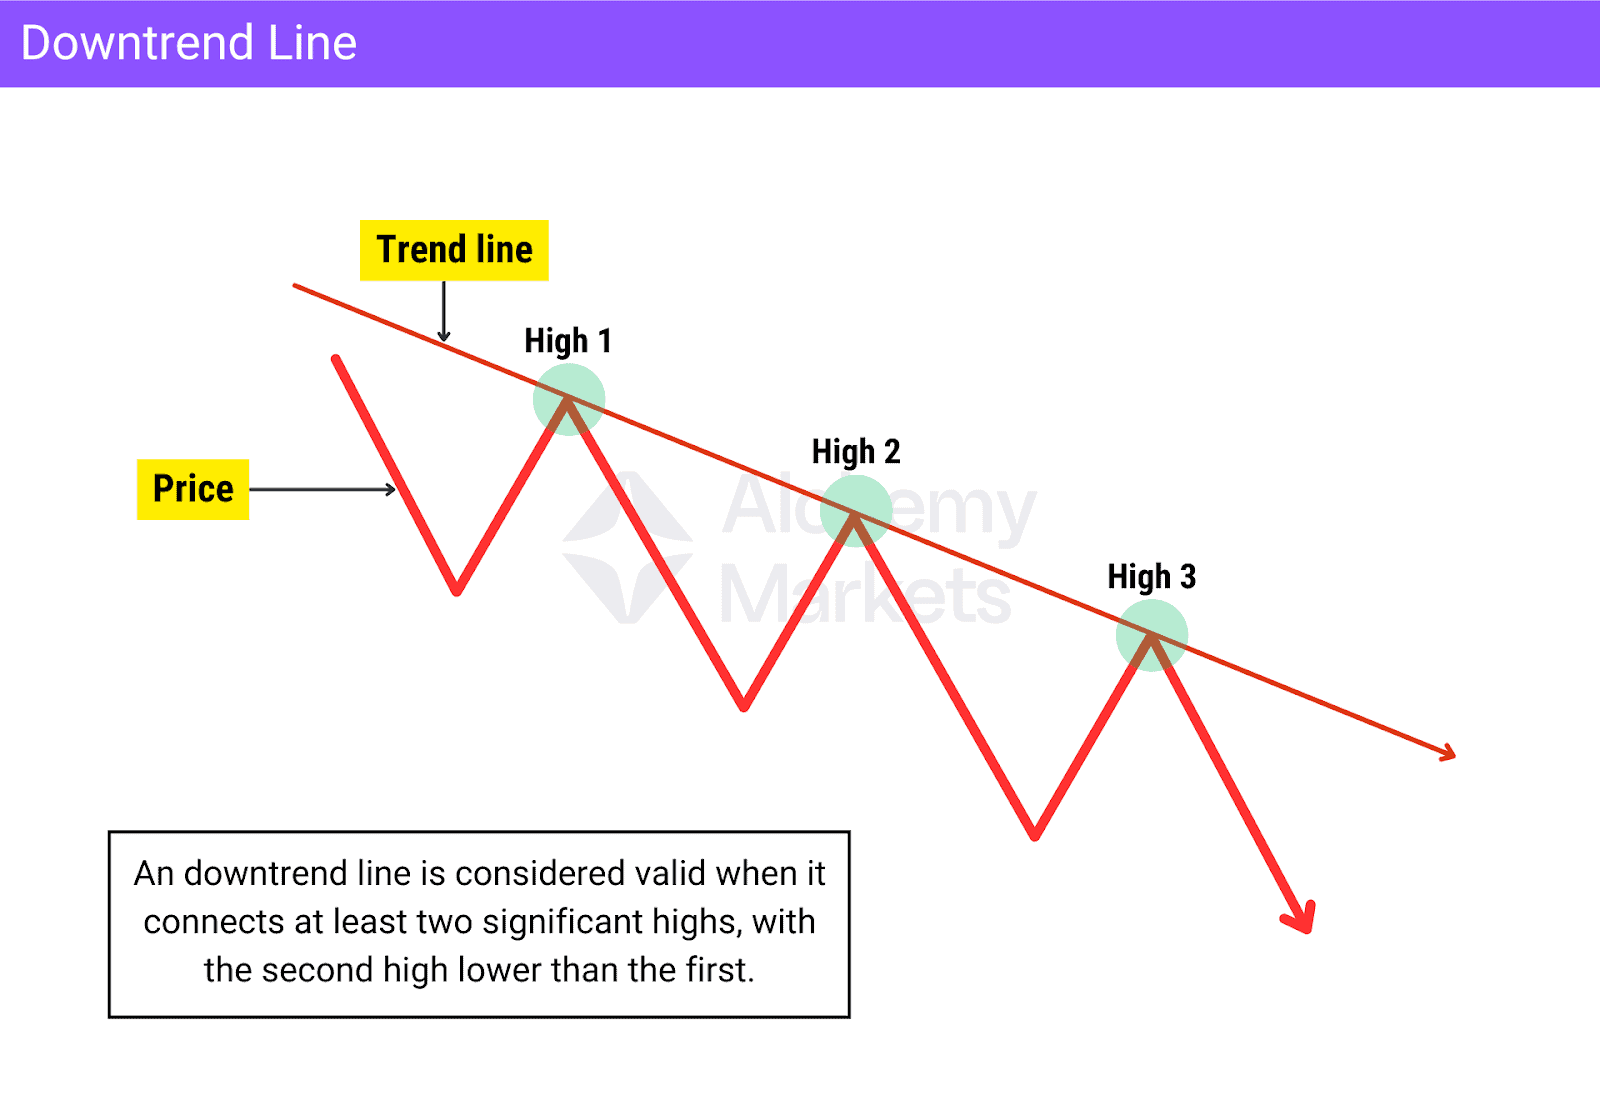
In a downtrend, price typically forms lower highs and lower lows, with temporary retracements before continuing lower. The downtrend line helps identify where these retracements may face resistance, showing that sellers remain in control as long as price stays below the line.
Traders use downtrend lines to:
- Confirm bearish market direction
- Identify potential selling opportunities during pullbacks
A break of a downtrend line can indicate weakening selling pressure, especially when it occurs with wicks or small candles, and price may still respect the broader bearish structure.
When price breaks a downtrend line with strong bullish candles closing above it, it may signal that the downtrend line is no longer valid for selling opportunities.
What Is a Sideway Line?
A sideway line is a horizontal line drawn on a price chart by connecting at least two equal or similar highs or lows.
It marks a level where price has repeatedly struggled to move beyond, reacting from the same area multiple times.
A single sideway line does not define a full range market on its own. It simply highlights a horizontal support or resistance level where price tends to stall and reverse.
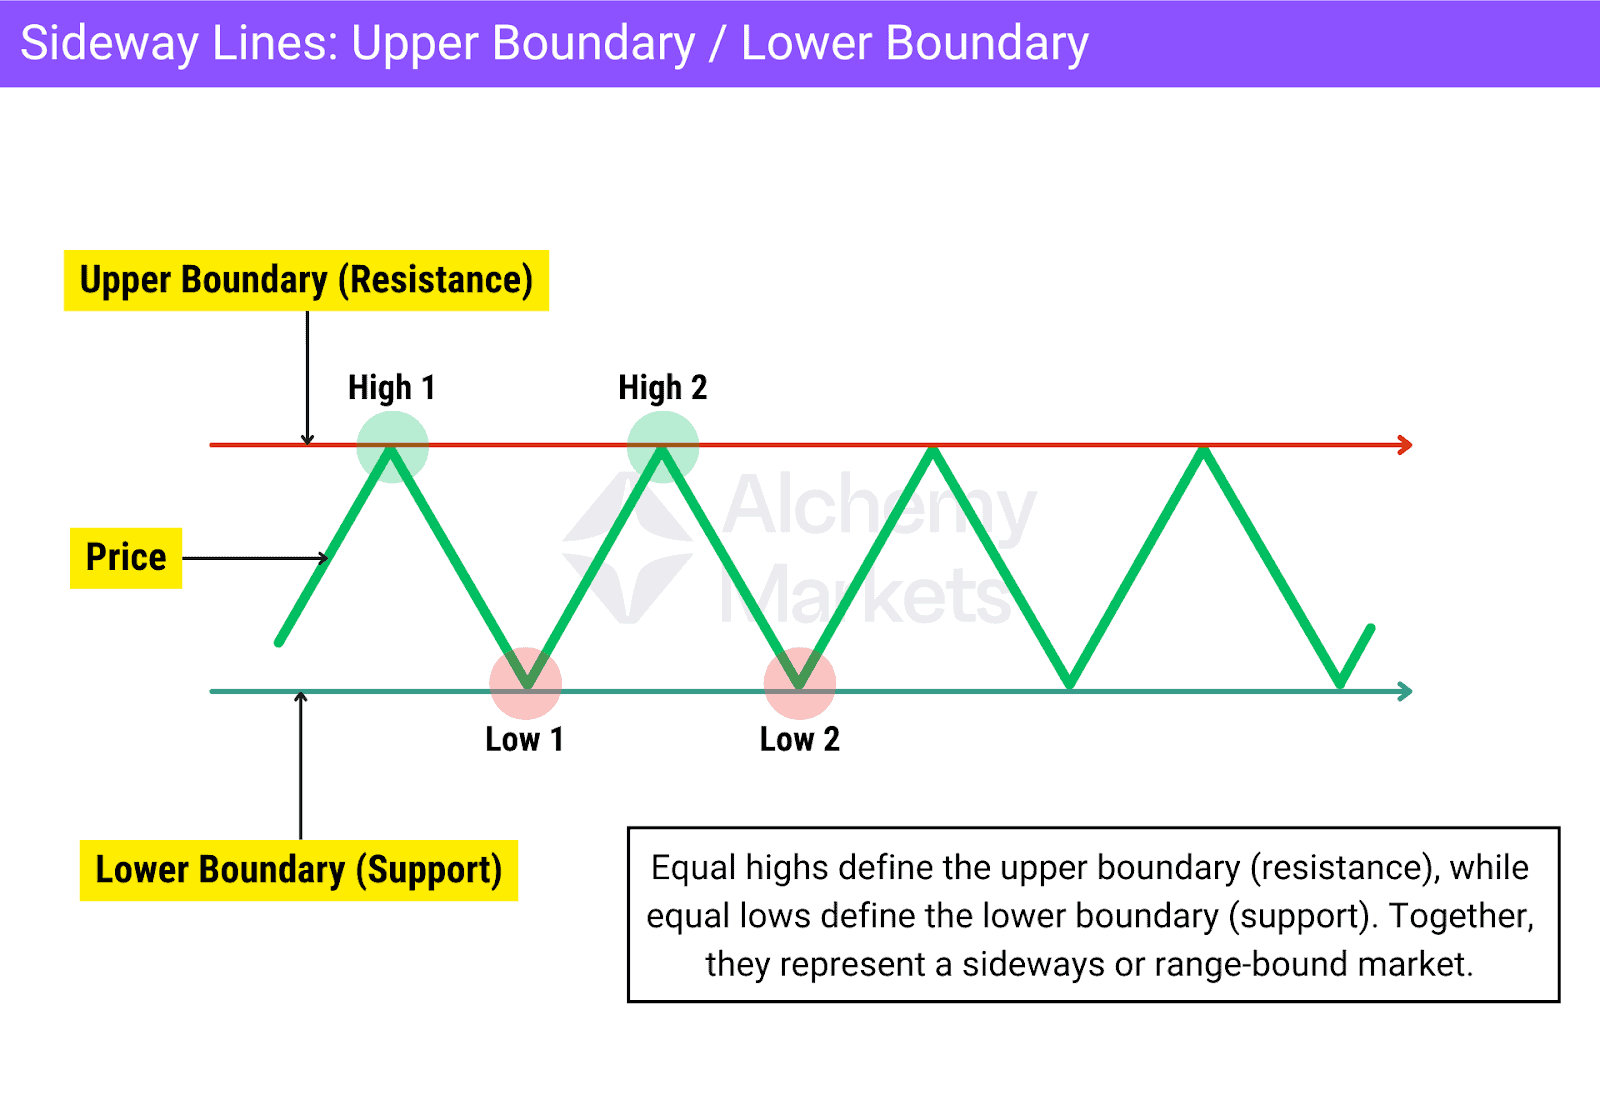
Sideway Lines Can Take Two Forms:
- Upper Boundary (Resistance): Formed by at least two highs (equal highs) at the same level. Price repeatedly fails to move higher from this area, showing selling pressure.
- Lower Boundary (Support): Formed by at least two similar lows (equal lows) at the same level. Price repeatedly fails to move lower, showing buying pressure.
When both an upper boundary (resistance) and a lower boundary (support) are present in the same market, price often moves back and forth between them. This behaviour defines a sideways, or range-bound, market.
In such conditions, buyers and sellers are relatively balanced, and the market lacks a clear directional trend.
What Are Internal Trend Lines?
Internal trend lines are secondary trend lines drawn within the high–low range of a larger external trend. They are formed by connecting smaller swing points that appear as price moves between the external trend’s highs and lows.
A single internal trend line does not define the overall trend. It describes shorter-term price movement while the main external trend remains unchanged.
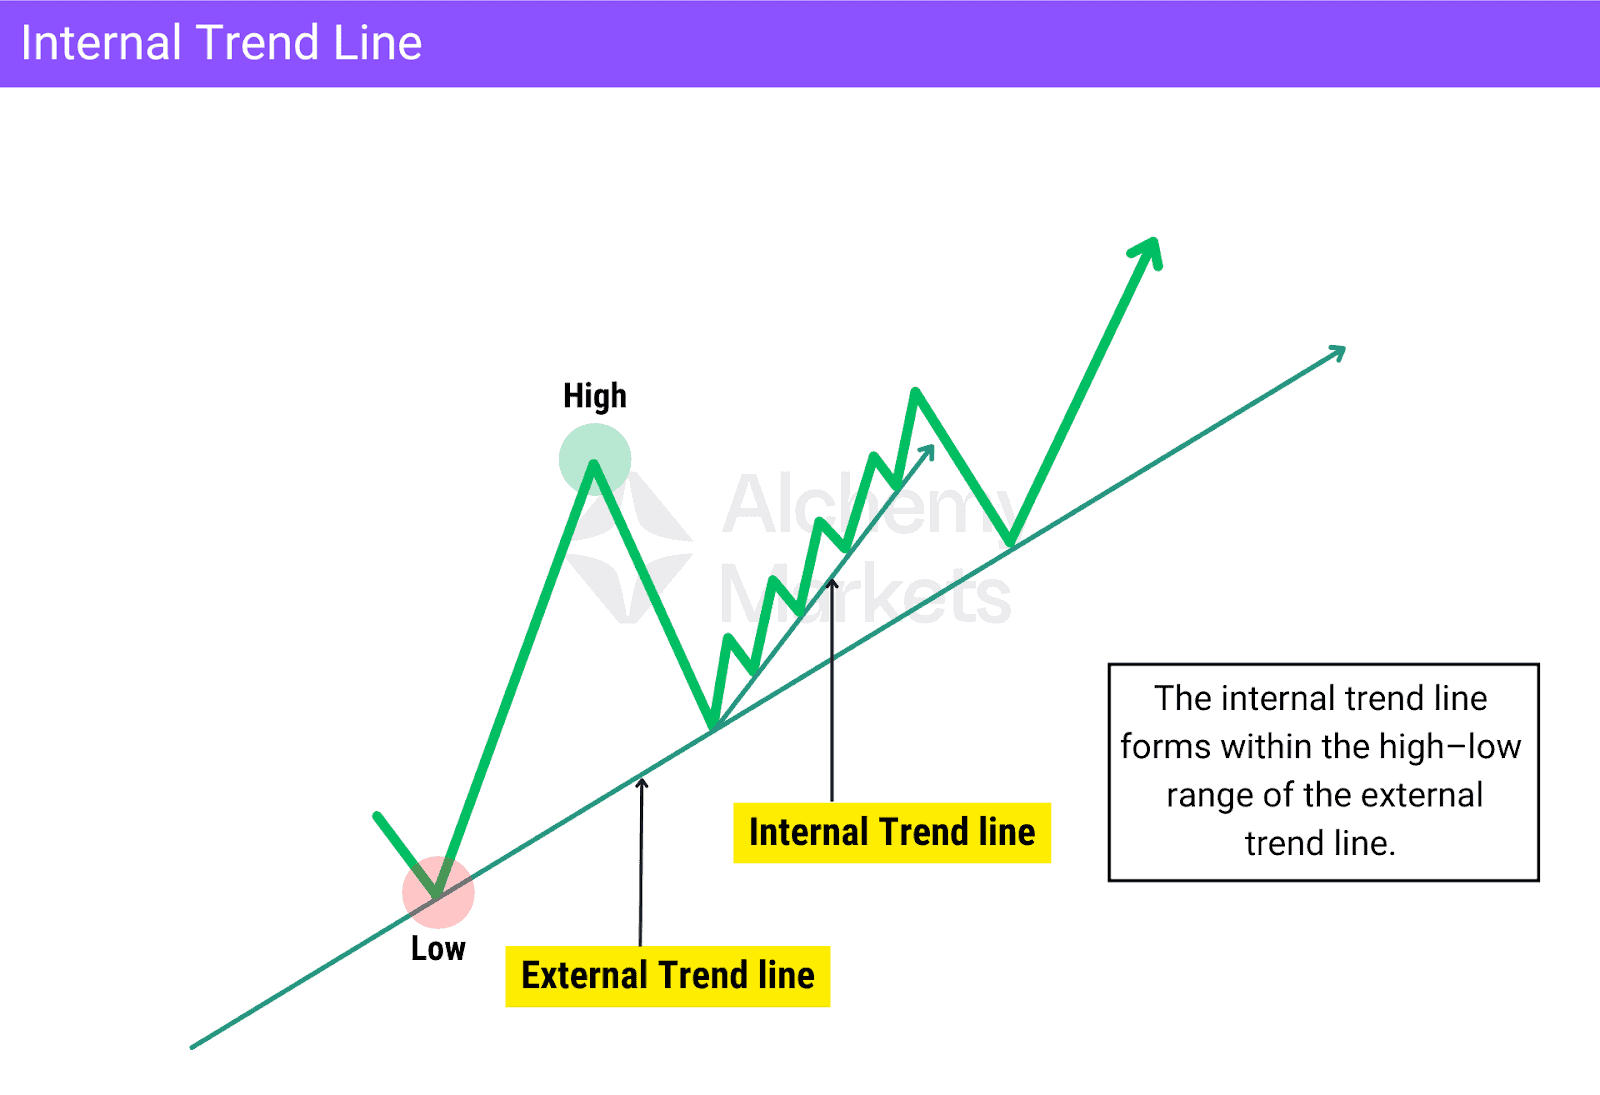
An internal trend line remains relevant as long as price stays within the high–low range of the external trend. If price moves beyond that range, the internal trend line may no longer be useful as a refinement reference.
Internal trend lines are easier to identify on lower timeframes. For example, an uptrend visible on the 4H timeframe may reveal clearer internal swings on the 2H or 1H timeframe, without changing the overall trend direction.
They are mainly used to:
- Refine short-term price movement within an existing trend
- Identify more precise areas of interest while remaining aligned with the main trend
In addition, they may offer more aggressive entries for smaller scale trades.
How Do You Validate a Trend Line?
Trendline validation is not based on a single rule.
It depends on a combination of structure, price behaviour, and context, which together help determine whether a trendline is meaningful and worth paying attention to.
For example, some traders consider two touches sufficient to draw and validate a trendline, while others prefer to see three or more touches before considering it valid.
Neither approach is wrong, as validation criteria vary by trader. What matters is that these criteria are built on backtesting results and supported by data.
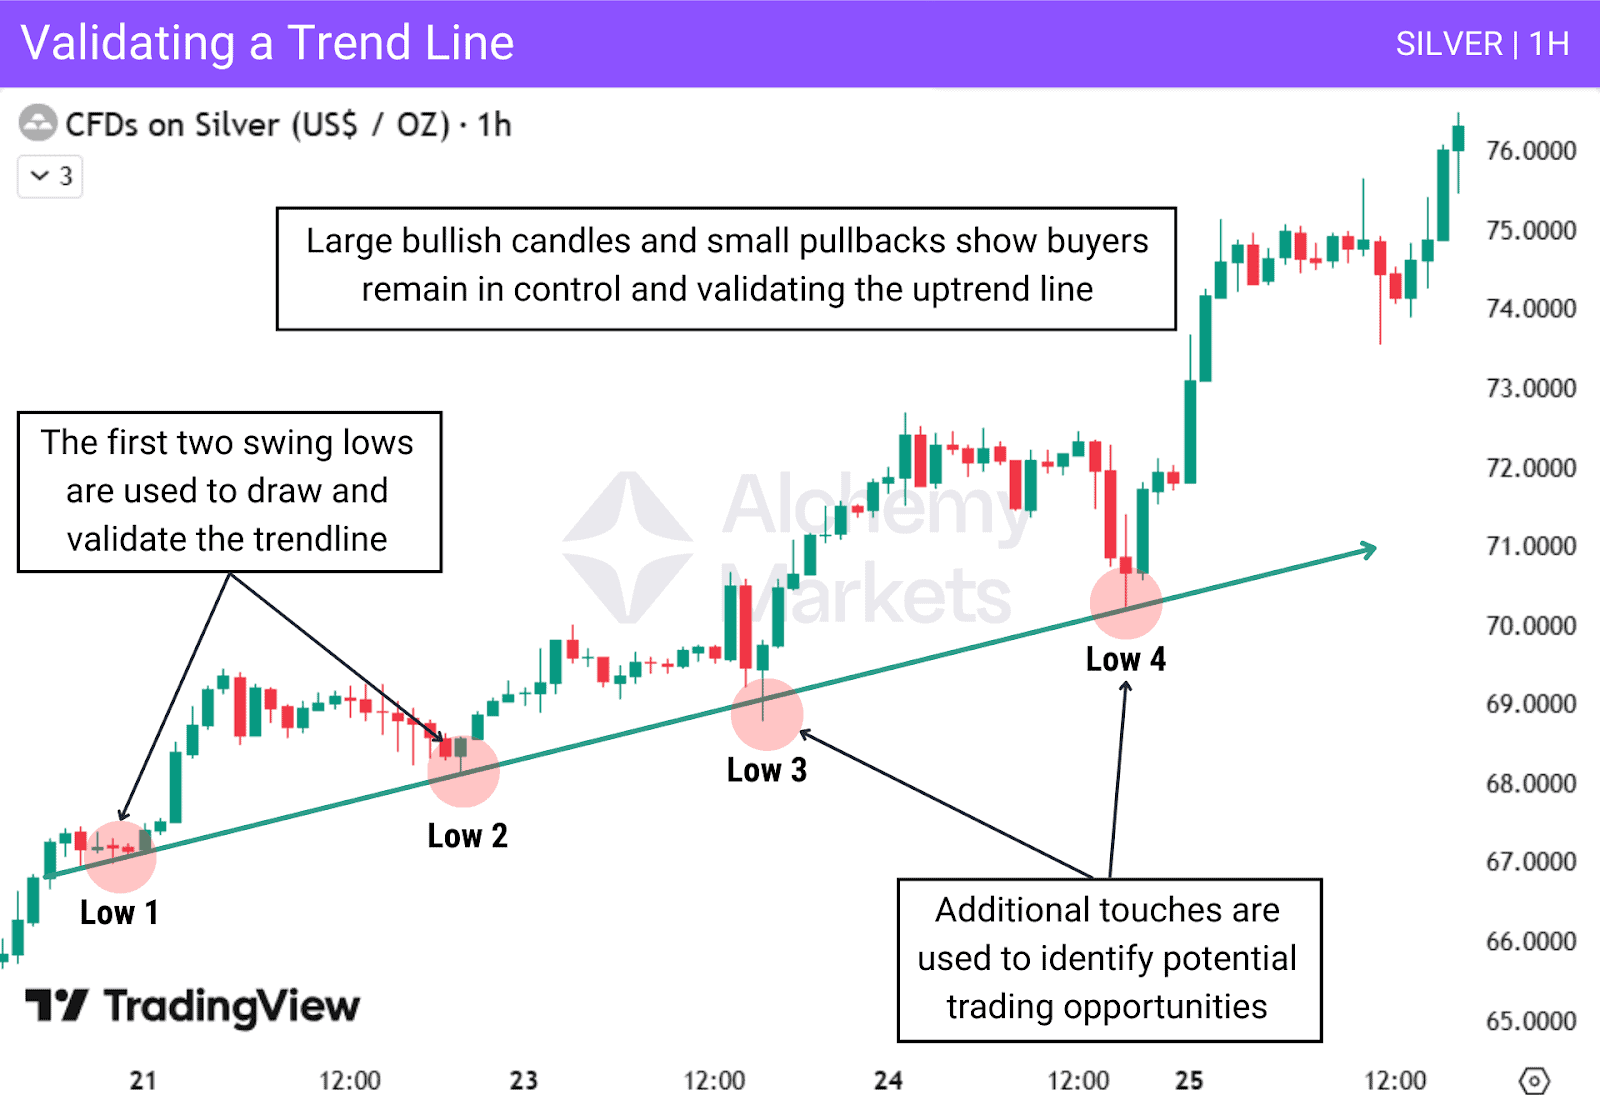
Swing Highs and Swing Lows
A valid trendline should be drawn using clear swing highs or swing lows, not minor price fluctuations. In an uptrend, the first two swing lows define the trendline structure. Later touches help assess whether price continues to respect the line but do not redefine it.
Price Behaviour, Candle Strength, and Touches
Validation depends on how price reacts when it returns to the trendline. Clean reactions such as pauses, rejections, or continuation moves, combined with strong candles in the trend direction and smaller pullbacks, suggest the line is being respected. Repeated cuts through the line weaken its relevance.
Later touches should be treated as areas of interest, not automatic trade signals. The quality of the reaction matters more than the number of touches.
Proportionality and Structure Fit
A valid trendline should fit the price chart naturally without being forced. Trendlines that require frequent adjustment often reflect hindsight bias rather than meaningful structure.
Effective trendlines should simplify price behaviour instead of trying to explain every movement.
Context and Timeframe Reliability
Trendlines tend to carry more weight when they align with the broader or higher-timeframe trend. Higher-timeframe trendlines are generally more reliable due to stronger participation and reduced noise. Lower-timeframe trendlines can still be useful, but they require more caution.
How Does Trendline Trading Work?
Trendlines act as dynamic support and resistance, marking areas where price tends to react during a trend. Traders use them as reference lines to observe price behaviour rather than as exact entry signals.
One common approach is to wait for price to retrace into the trendline and show a reaction, allowing participation in the ongoing trend. Another approach focuses on trendline breaks, which may suggest weakening or change in trend, but these setups require confirmation and careful handling.
Not all trendlines are equal. Some are respected clearly, while others fail quickly. Traders often assess trendline quality using factors such as angle and spacing between touches to judge whether a trend is strong or weak.
What Are Trend Angles?
The angle of a trendline shows how fast price is moving and whether the trend is sustainable. Moderate slopes usually reflect healthier price behaviour, where price advances and pulls back in a controlled way.
In practice, trendlines with angles around 20° to 45° are often easier to follow. Very shallow angles below this range tend to signal weak momentum, while very steep angles above it often lead to quick breaks or shallow pullbacks with limited opportunity.
What Are the Spacing Rules for Trend Lines?
Spacing refers to the distance between swing points used to draw a trendline, both in time and price. Stronger trendlines usually form when price moves away from the line, builds structure, and then returns.
Spacing should always be judged relative to the timeframe. When touches occur too close together with little price movement in between, the trendline is generally weaker and more prone to breaking.
Now let’s look at how angle and spacing appear in practice:
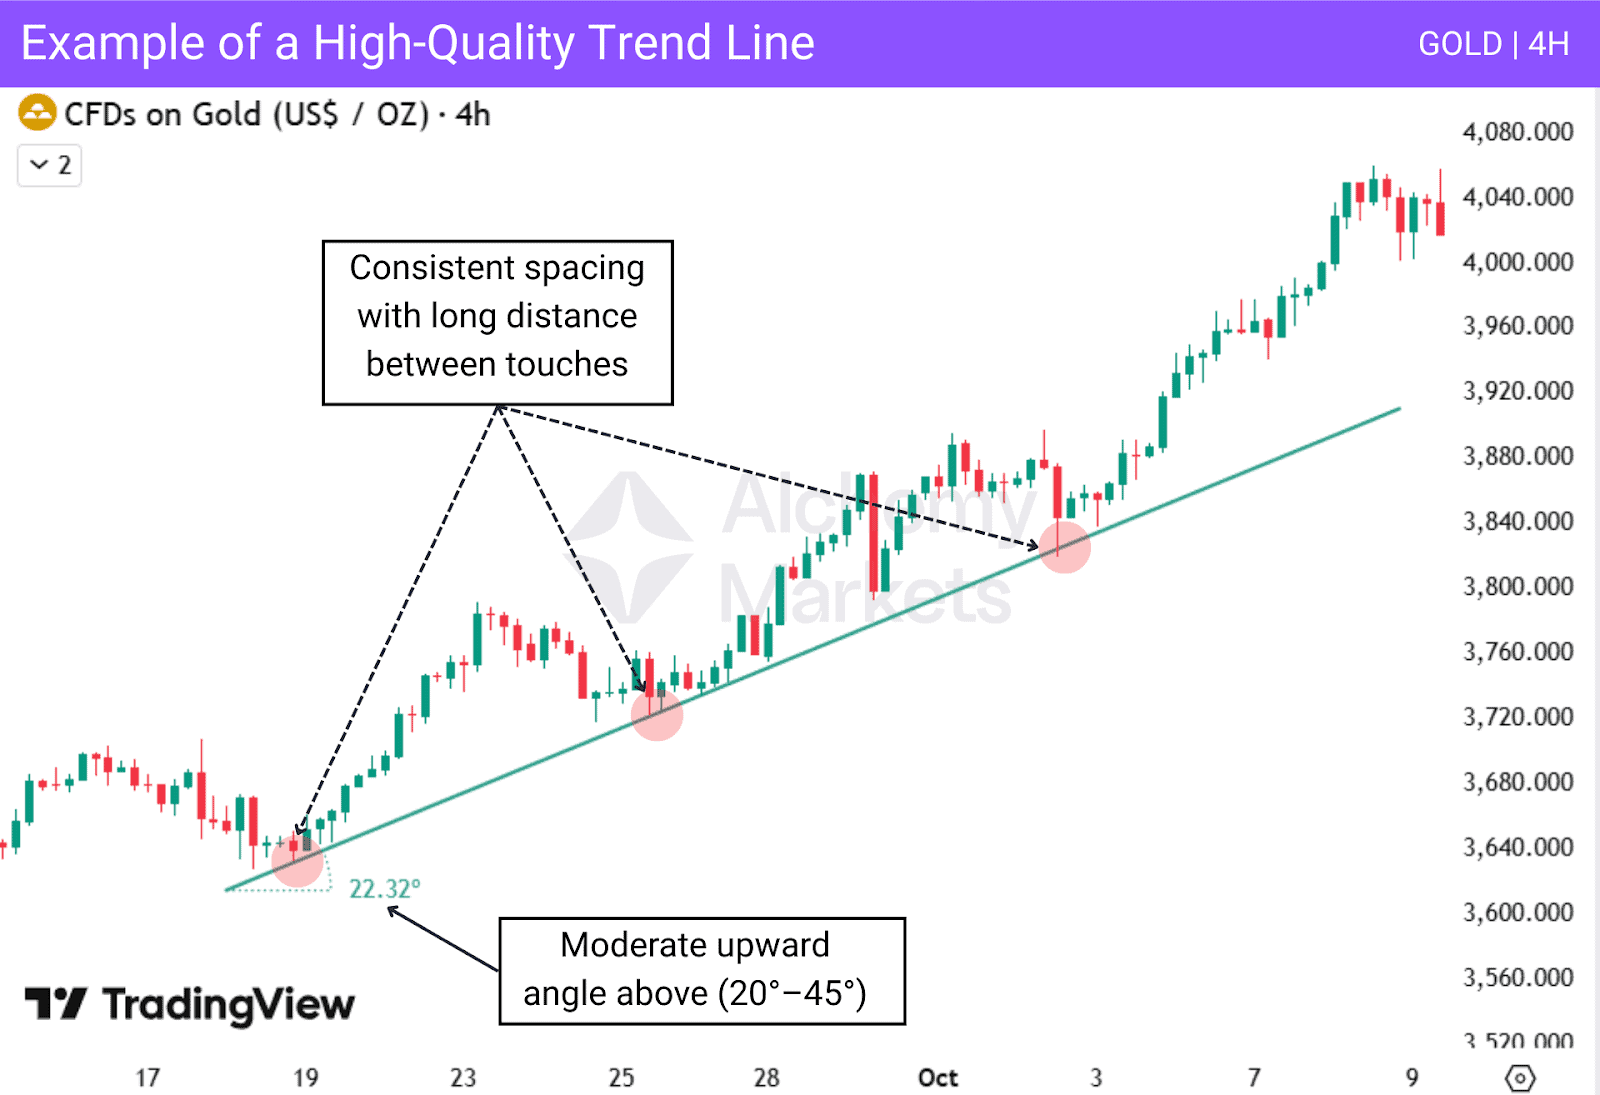
This example shows a high-quality trendline, where the angle remains within the 20°–45° range and the spacing between touches is consistent, with price leaving a clear distance before each touch reaction. This combination makes the trendline easy to identify, and more reliable.
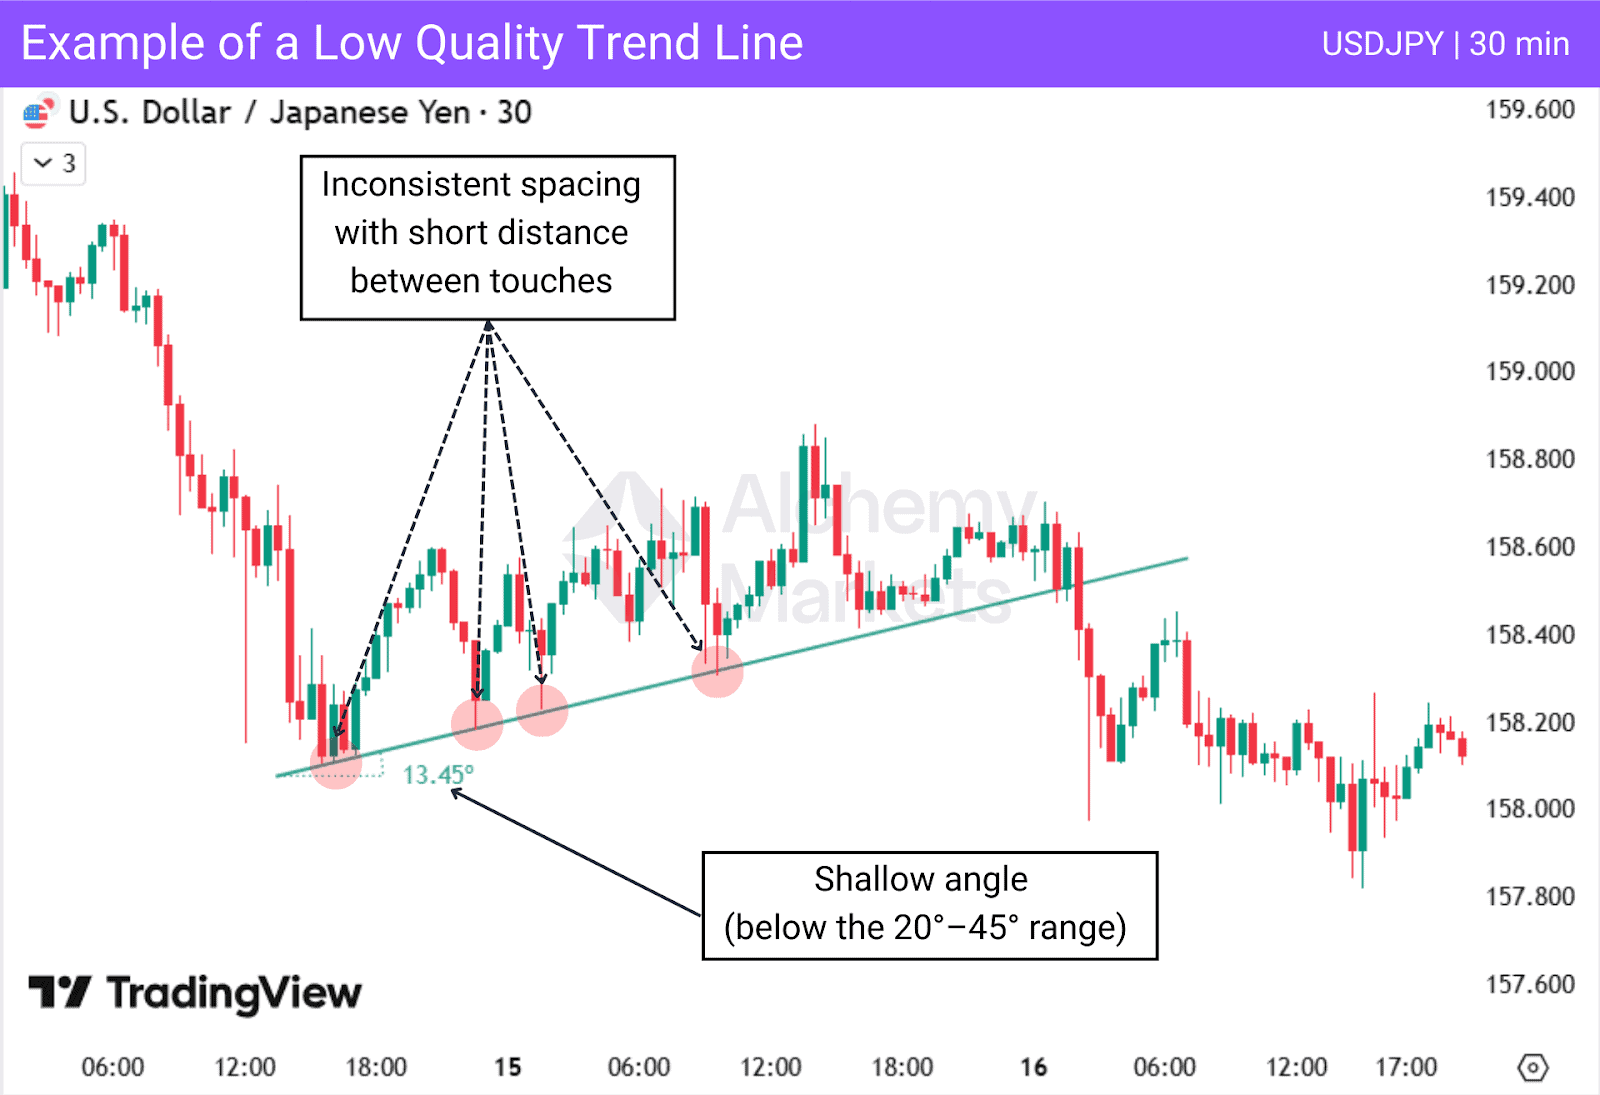
This currency pair (USDJPY) example highlights a low-quality trendline, where the line shows a shallow angle below the 20°–45° range and touches occur too close together and inconsistently. The shallow angle and compressed spacing make the trendline weak and easier to break.
Types of Trend Lines
Not all trendlines are drawn or interpreted in the same way. Different types of trend lines serve different analytical purposes, depending on how market data is processed and displayed.
Linear Trend Line
The linear trend line is the most common trendline used in trading.It is applied on standard price charts and works best when price moves in a clear, steady direction.
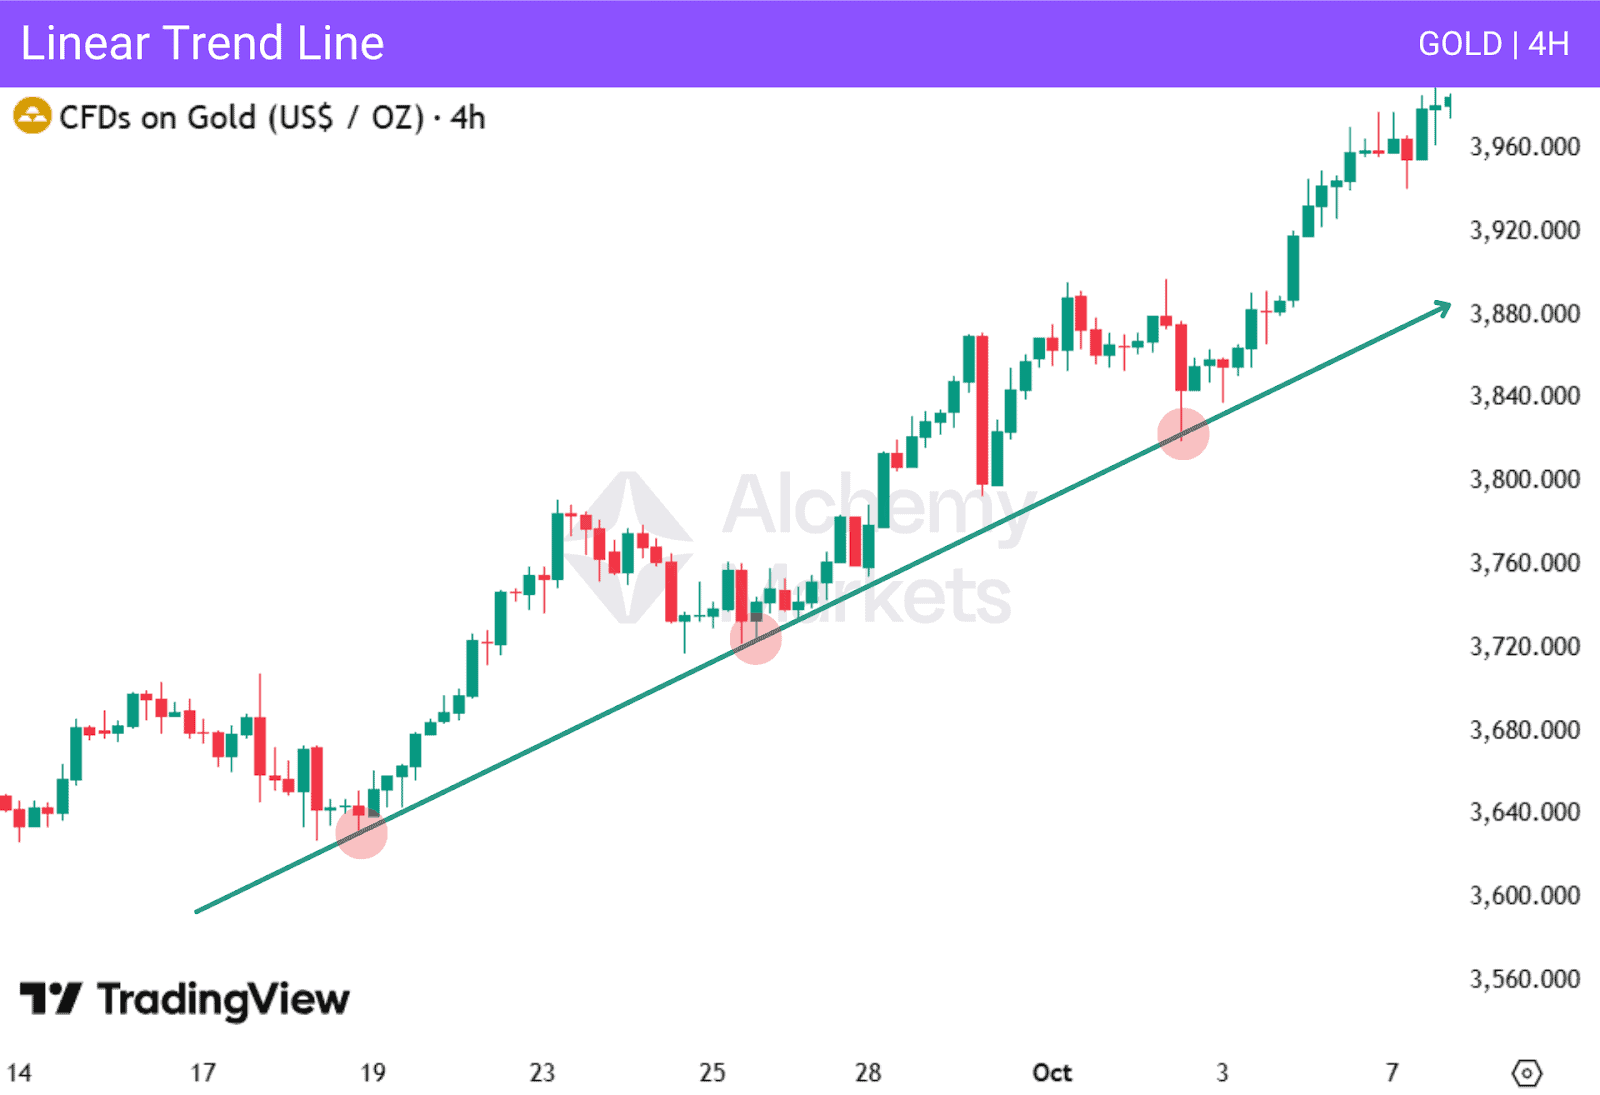
In an uptrend, the line connects rising swing lows and acts as dynamic support, pushing price higher on pullbacks.
In a downtrend, the line connects falling swing highs and acts as dynamic resistance, pushing price lower on retests.
Logarithmic Trend Line
Logarithmic trendlines help keep trend analysis accurate when price grows exponentially rather than in equal steps. In markets like crypto, price movement is better understood as percentage growth, not absolute price distance.
When price expands by multiples over time, a linear scale can visually compress early price action. This makes trendlines appear flatter or misaligned with real market structure.
To avoid this distortion, trendlines should be drawn on a logarithmic scale, which represents price movement proportionally.
Scale comparison:
- Linear scale → equal price units
- Logarithmic scale → equal percentage change
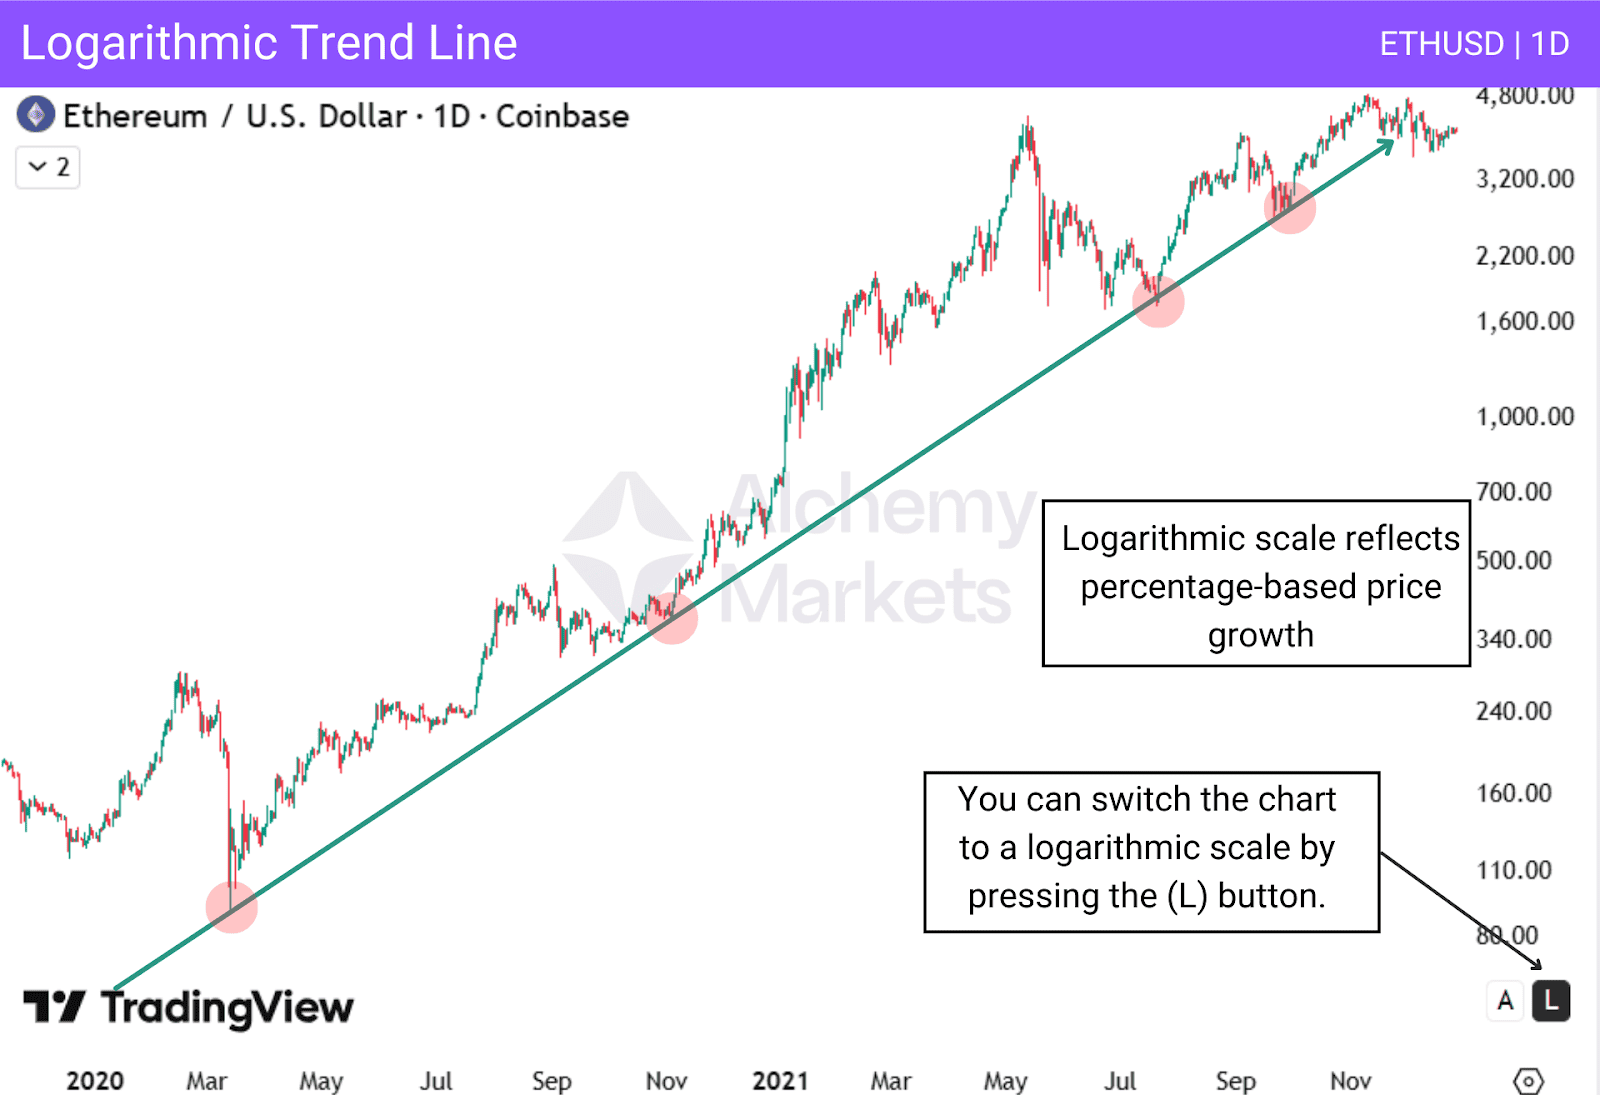
In this example on TradingView, the logarithmic scale allows the trendline to align with proportional price growth, helping it connect swing lows more accurately, even when a linear scale displays exponential price expansion.
Each touch aligns along the same proportional price path, resulting in a visually consistent trendline. This results in a clearer and more reliable trendline.
Exponential Trend Line
In markets that move in an exponential way, such as crypto, price does not grow in equal steps.
Each new swing low forms significantly higher than the previous one, which makes a normal straight trendline difficult to fit. In these conditions, linear trendlines fail to connect structure properly.
In these situations, switching to a logarithmic scale is generally more suitable for drawing straight trendlines, as it aligns better with percentage-based price growth and is more practical for trading decisions.
Exponential (curved) trendlines, on the other hand, should be viewed as visual and explanatory tools for analysing past price action, helping to illustrate how price moved in an exponential way, rather than as levels for identifying actionable support, resistance, or trade setups.
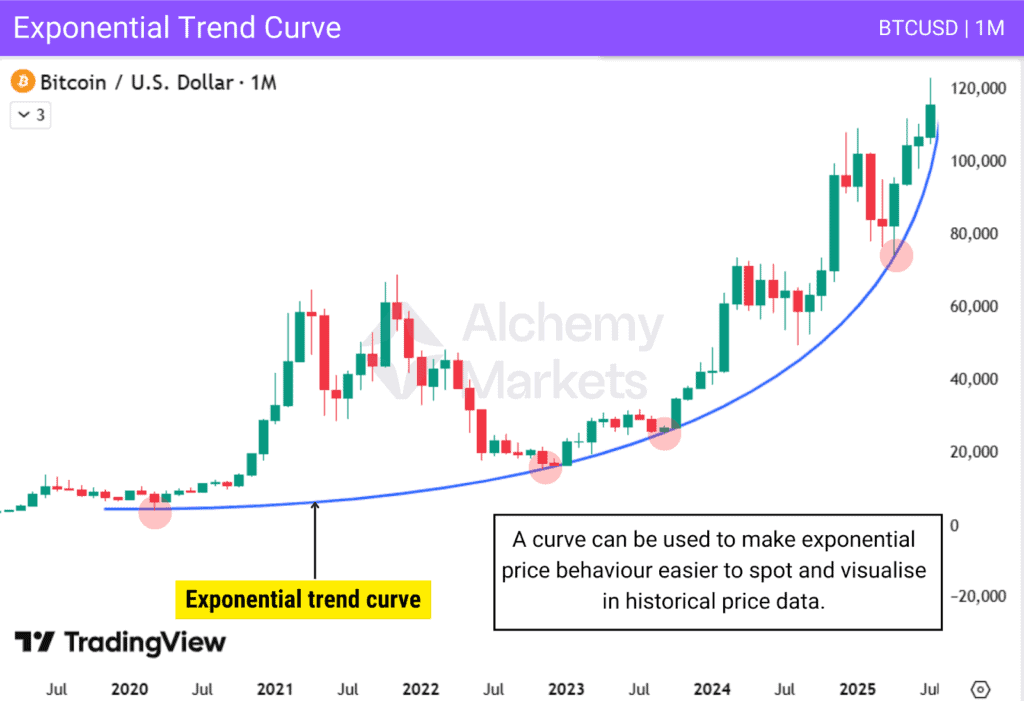
Using a curved trendline is purely a visual approach. It helps highlight exponential price behaviour in historical price data, making this type of movement easier to observe. However, curved trendlines are not intended for identifying trading opportunities or defining actionable levels.
Polynomial Trend Line
A polynomial trend line attempts to model curved price behaviour by fitting a mathematical function to historical data.
Unlike linear trendlines, it adapts to changes in slope, allowing it to follow gradual acceleration or deceleration in price.
On trading charts, polynomial trend lines are typically applied through polynomial regression indicators, which automatically calculate and plot the curve based on historical price data.
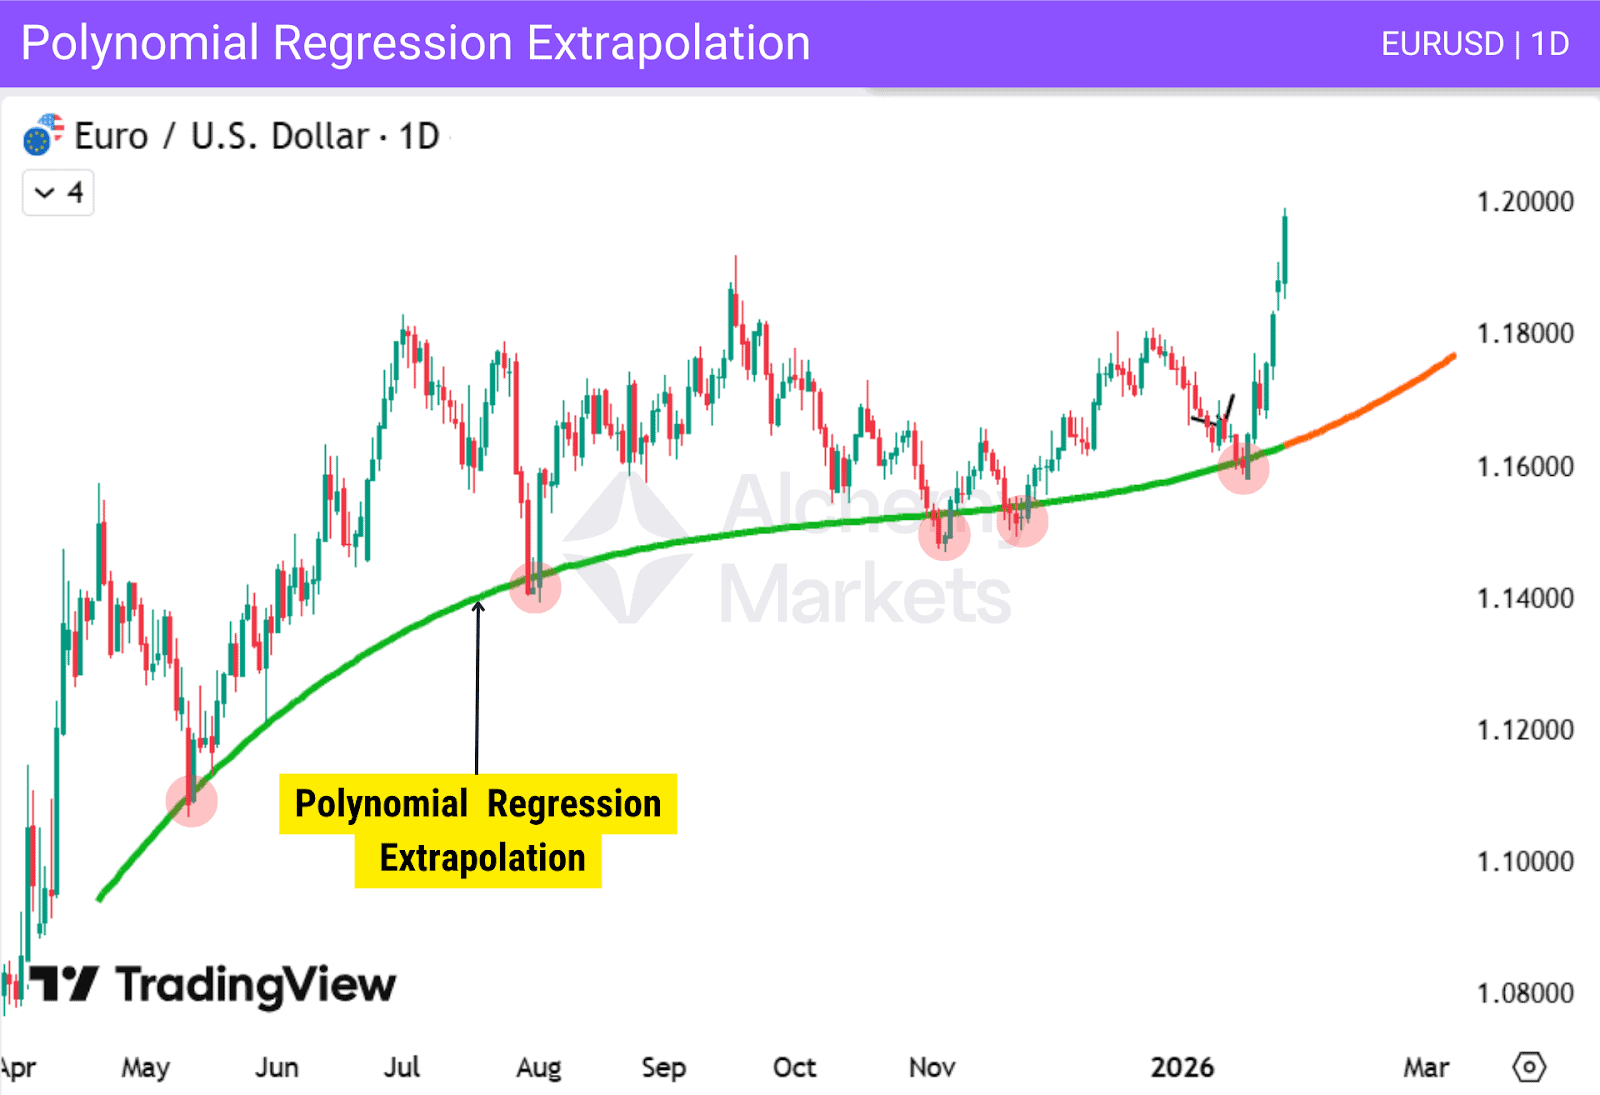
Polynomial regression extrapolation can be found on TradingView through indicator-based tools. These indicators offer configurable parameters and can display upper and lower bands, forming additional curves that price may react to.
On this EURUSD currency pair chart, the regression curve acts as a dynamic support and resistance reference, where price interacts with the curve rather than a fixed level. As long as the polynomial regression remains sloping upward (green), it suggests that the underlying uptrend is still intact.
Moving Average Trend Line
A moving average (MA) smooths price action by averaging past prices over a set period. While it is not manually drawn, it can perform a similar trend-following role to a trendline by highlighting market direction.
Both simple moving averages (SMA) and exponential moving averages (EMA) can act as dynamic support or resistance, adapting automatically as price evolves.
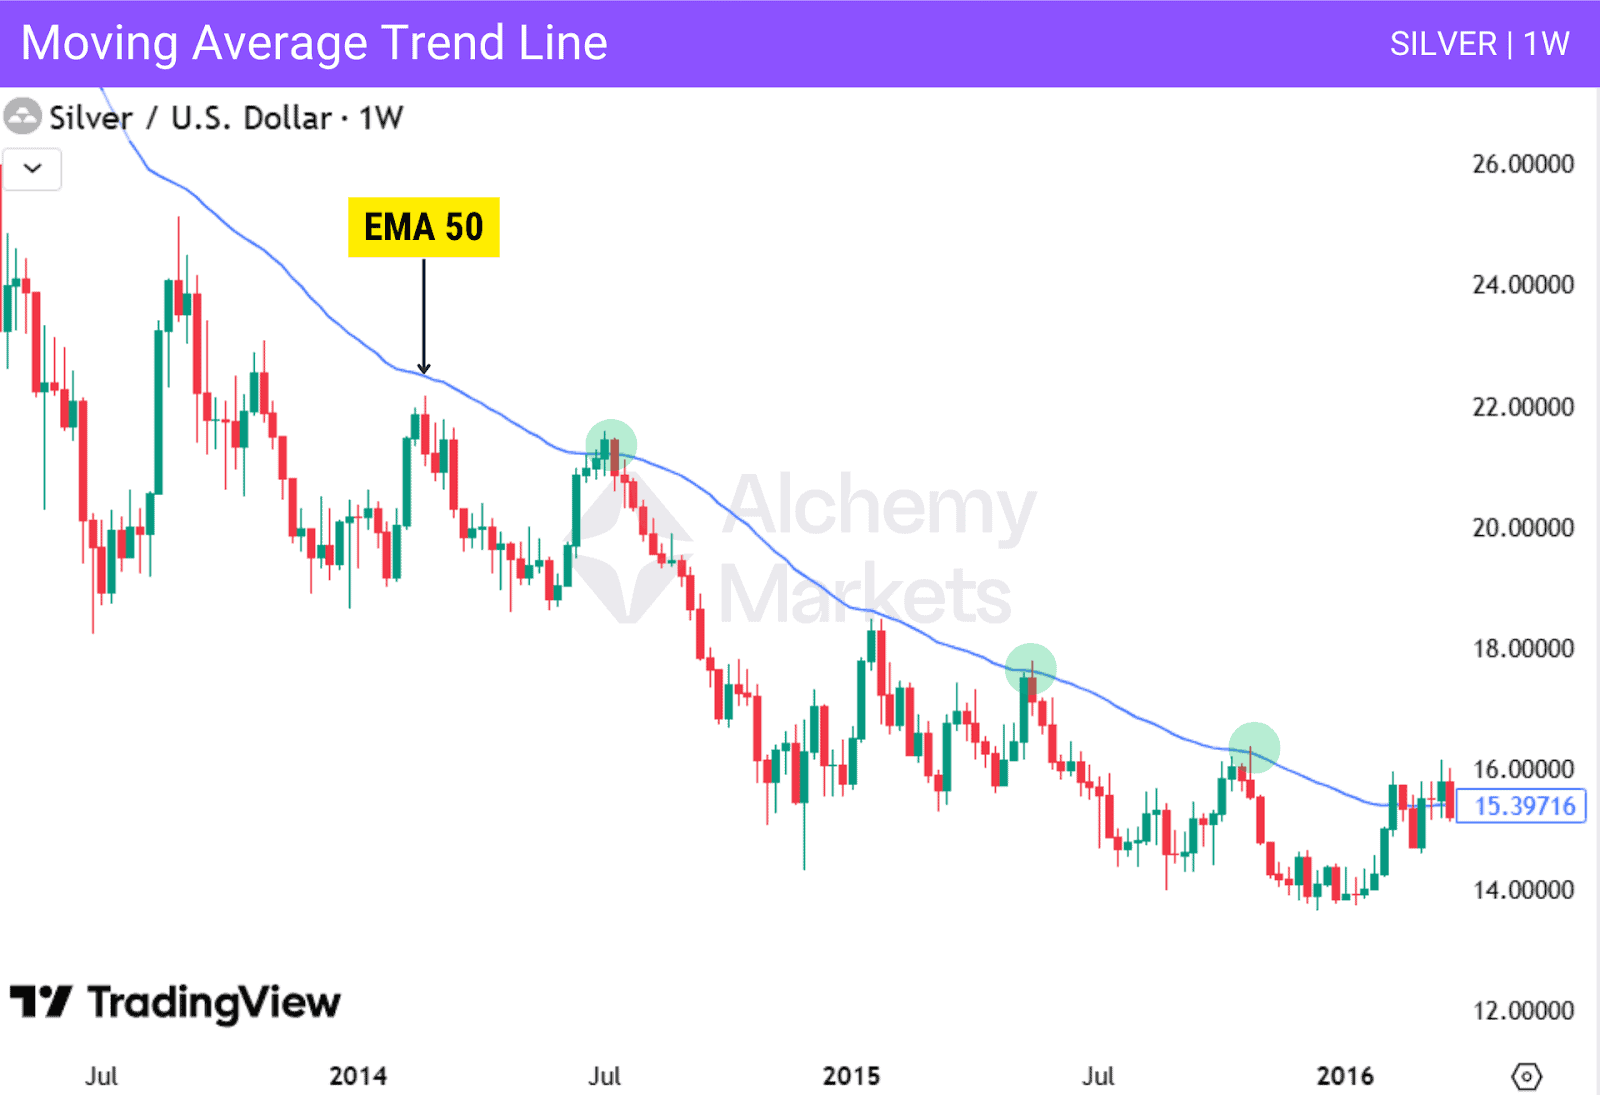
In this example, the EMA 50 acts as dynamic resistance, with price repeatedly reacting at the moving average. In certain conditions, moving averages can be better suited than trendlines, especially when clean swing points are difficult to connect or when price structure is irregular.
The most commonly used averages are EMA 20, 50, and EMA 200, which can be used together to assess trend direction and pullbacks.
Importance of the Trendline
Trendlines play an important role in helping traders organise information and interpret market structure. By simplifying complex price charts into clear directional references, they support more informed trading decisions.
They help traders stay aligned with the broader trend, avoid emotional reactions to short-term fluctuations, and maintain consistency across different time frames. When combined with other tools, trendlines contribute to a disciplined analytical process rather than acting as standalone signals.
Their true value lies not in precision, but in perspective. Trendlines help traders focus on what matters most: direction, structure, and context within the market.
How to Draw a Trend Line?
Drawing a trendline is about reflecting market structure clearly, not forcing precision. A valid trendline should simplify price behaviour and make the trend obvious at a glance.
When drawing trendlines, wicks are generally more important than candle bodies, as they better reflect price rejection and true swing extremes. In some cases, aligning the overall location of multiple pivots matters more than precision, so a trendline may pass through both wicks and bodies.
Uptrend Trendline (Ascending Trendline)
Step 1: Identify two clear swing lows where price made decisive upward moves. These should be obvious reaction points, not minor pauses.
Step 2: Connect the two swing lows with a rising straight line and extend it forward. This creates a reference for future price interaction.
Step 3: Wait for price to pull back into the trendline. A trade can be considered when price shows rejection, such as strong buying pressure, long lower wicks, or a clear bullish candle forming at the line.
Bullish Candles: Either reversal candlesticks such as hammers, bullish engulfing pattern, or just a large wick at the lower half of the candle, where it interacts with the uptrend line but closes above.
Downtrend Trendline (Descending Trendline)
Step 1: Identify two clear swing highs where price was rejected lower.
Step 2: Connect the swing highs with a descending straight line and extend it forward.
Step 3: Wait for price to retrace into the trendline. A trade can be considered when price shows rejection, such as selling pressure, long upper wicks, or a strong bearish candle forming at the line.
Bearish Candles: Either reversal candlesticks such as shooting stars, bearish engulfing pattern, or just a large wick at the upper half of the candle, where it interacts with the downtrend line but closes below.
Key Notes
- Trendlines should be extended forward and kept fixed. Constantly adjusting a line to fit new price action weakens its reliability and introduces hindsight bias.
- A trendline gains meaning from how price reacts to it over time, not from perfect placement. Clean rejections, pauses, or continuation moves strengthen its validity.
- If price breaks the trendline with a candle close beyond it, it signals that the trendline is no longer valid.
Trendline Example
Now let’s take a look at this example of trendline on Gold 4H timeframe:
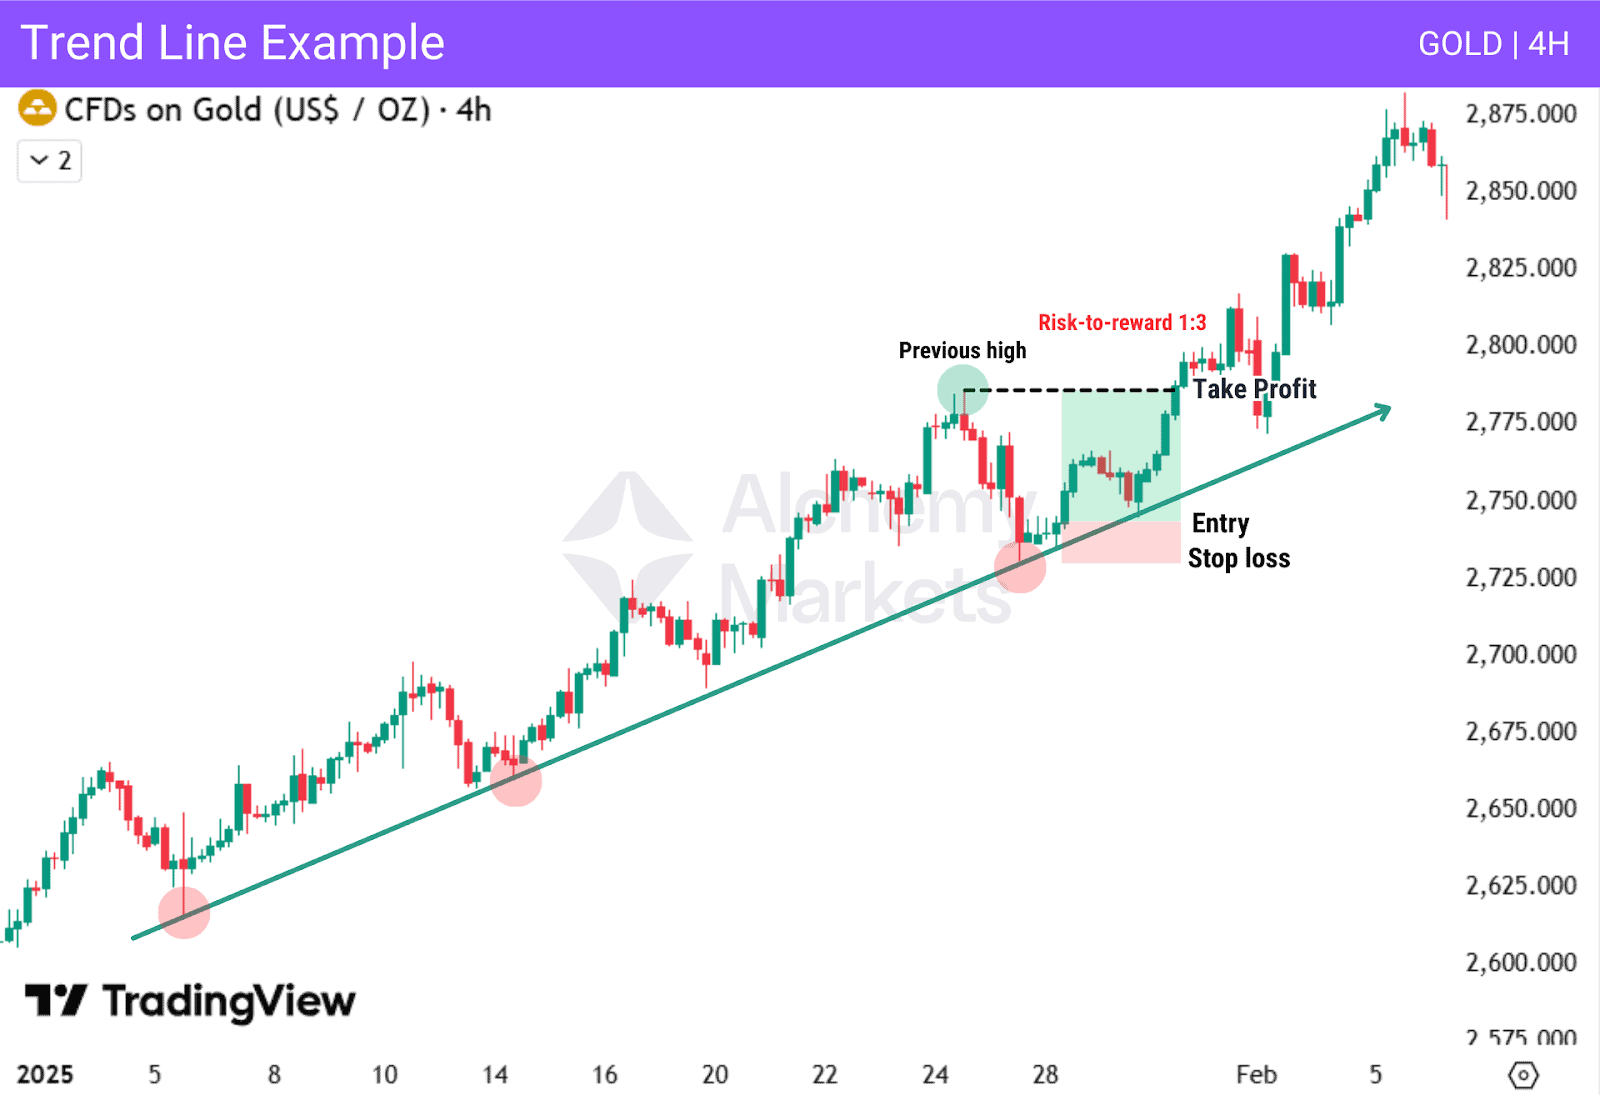
The trendline is established by connecting two clear swing lows. Later, price pulls back into the trendline and shows rejection, forming bullish candles that signal buyers are stepping in.
- Entry: After a clear bullish candle (such as a large lower wick) forms at the rising trendline
- Stop Loss: Below the rejection candle and beneath the trendline
- Take Profit: At the previous high
Trendline Trading Strategies
In this section, you’ll see how trendlines are traded in practice and how they work alongside other tools and forms of analysis.
Trendline Patterns to Create Wedges
Trendlines are the main tool for identifying wedge patterns. A wedge forms when price moves between two trendlines that either converge or diverge over time.
Converging wedges show price tightening into a smaller range, while broadening wedges show price expanding with wider ranges.
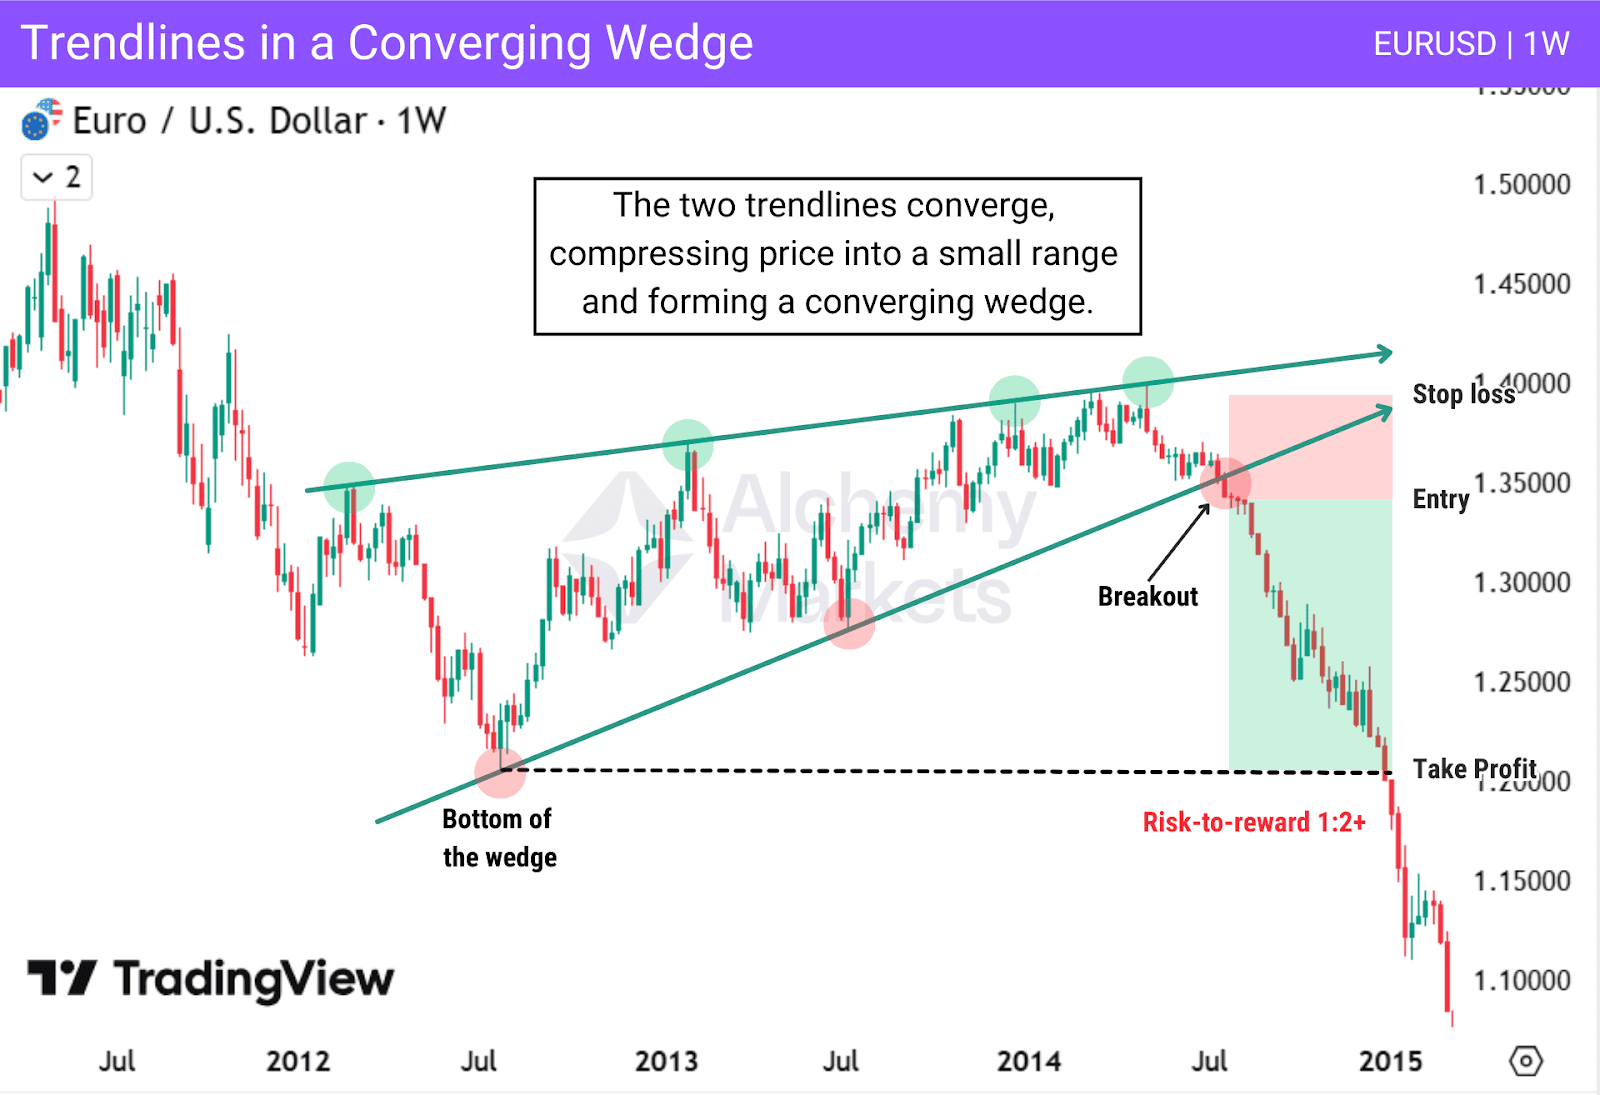
This example represents a converging wedge pattern. Two trendlines are compressing into a smaller range, and price breaks below the lower trendline, presenting a trading opportunity.
| Note: Rising Wedge and Falling Wedge are well known converging wedge patterns. |
Entry should be after breaking the lower trendline. while the bottom of the wedge works as a logical target.
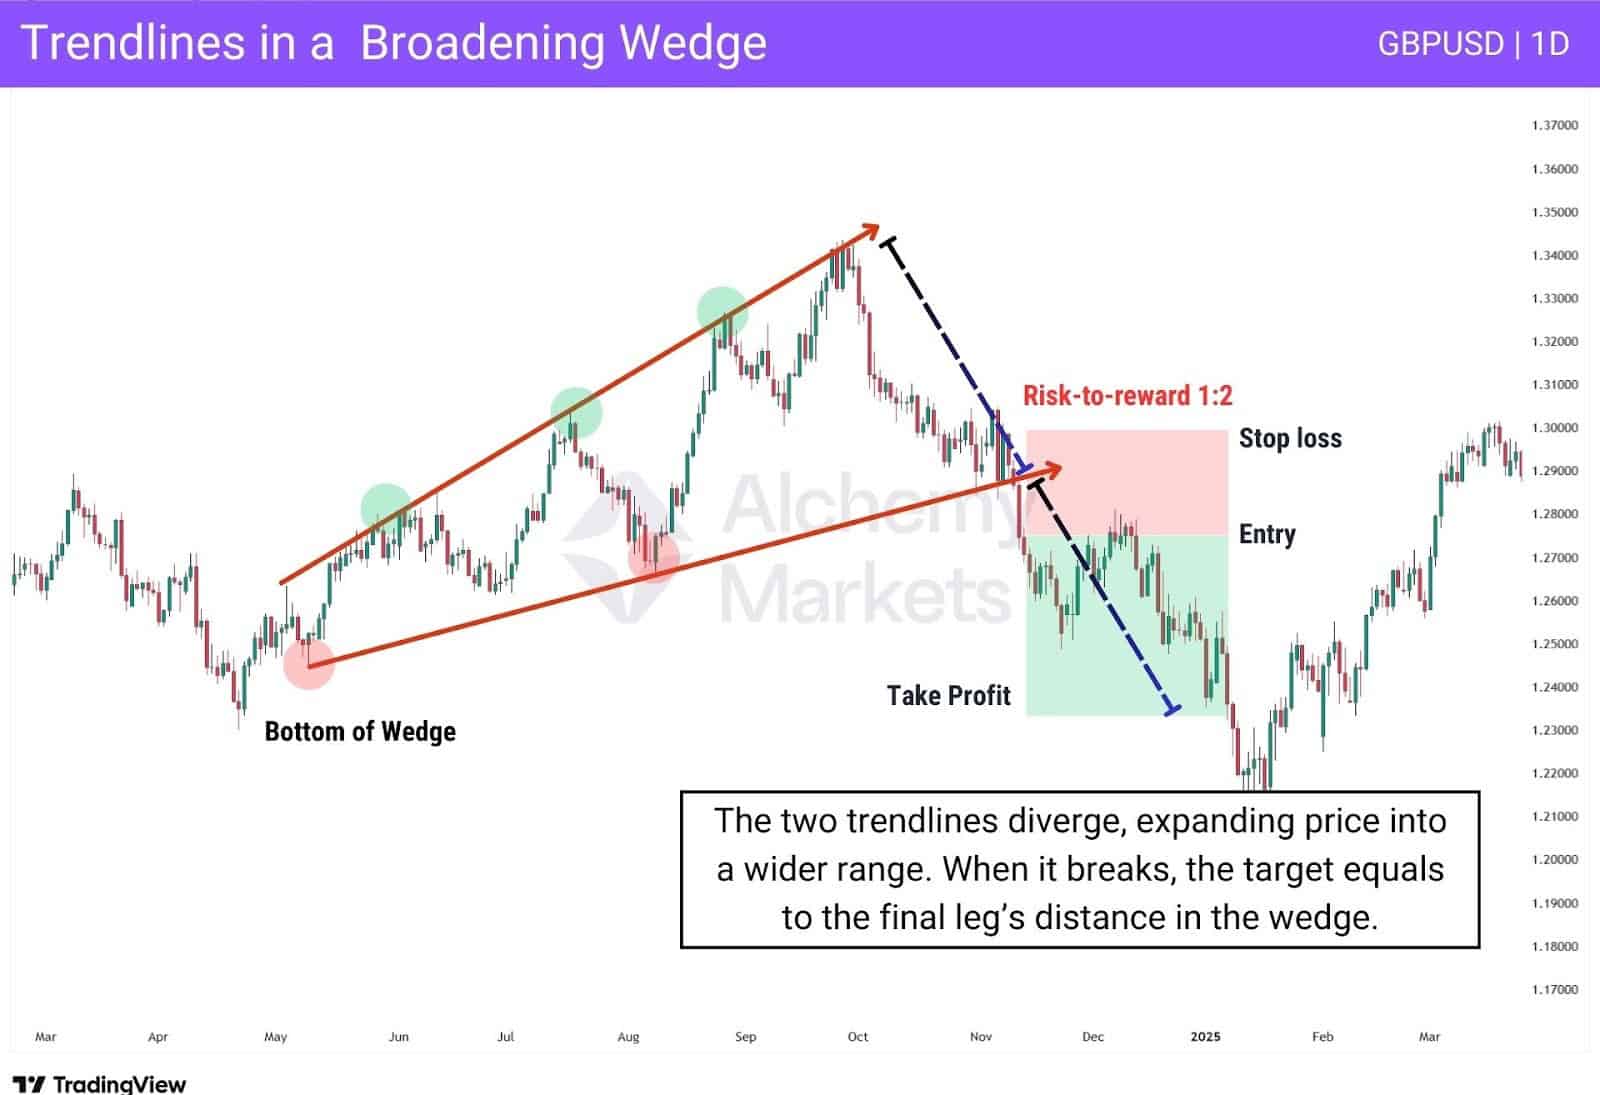
Observe this example on this GBPUSD currency pair, notice how the trendlines work together to create a broadening wedge pattern.
The two trendlines diverge over time, causing price swings to expand into a wider range. When price breaks above the upper or lower trendline, it can provide a breakout trade opportunity.
In this case, the target is equal to the final leg’s distance inside the wedge; as demonstrated above.
Support and Resistance Flip
Support and resistance flips refer to situations where a support level breaks and later acts as resistance, or where a resistance level breaks and later acts as support. This shift reflects a change in how price reacts around that level.
Support and resistance flips can be combined with trendlines and provide high-quality trade opportunities. When price breaks a trendline and a support or resistance level, then retraces back to it, the level often flips its role and can be used to enter a trade.
For extra confirmation, you can wait for the price to retest the level and show rejection before entering.
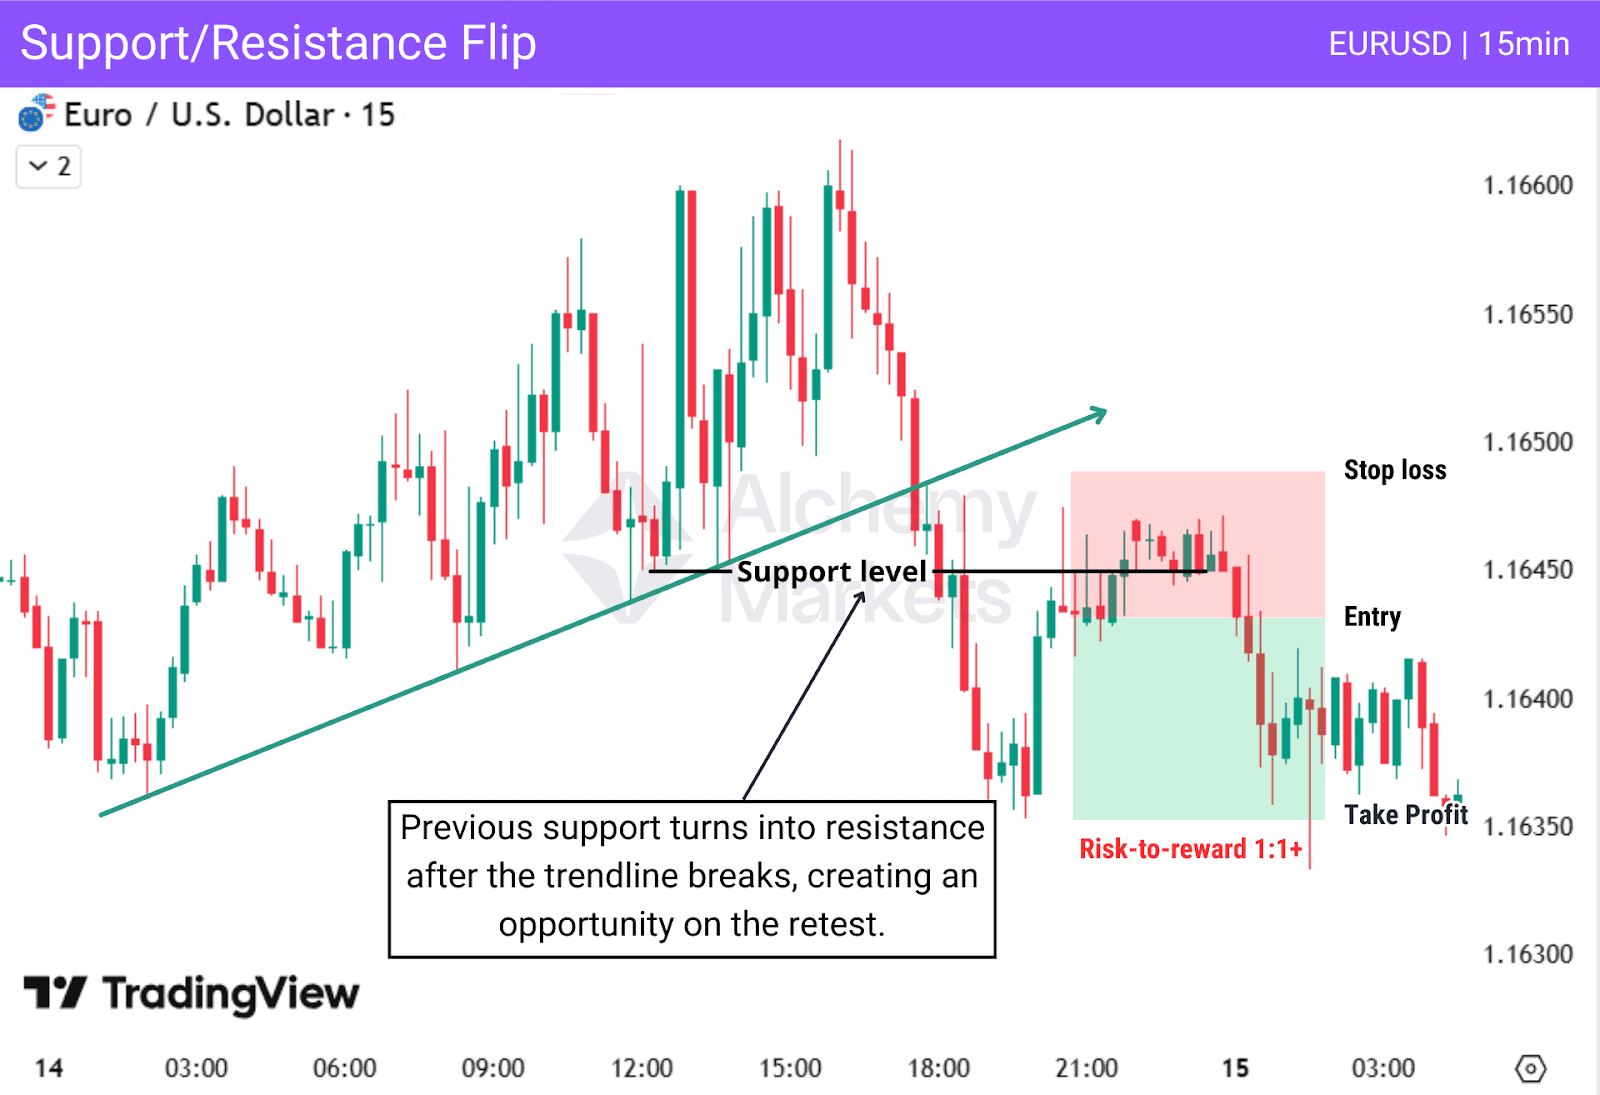
As shown in this EURUSD example, price was initially in an uptrend before breaking both the trendline and the support level, signalling a reversal.
That previous support then flips into resistance once price retraces back into it. When price reacts and rejects from this level, it provides a clear opportunity to enter in the direction of the break.
Trendline Takeoff
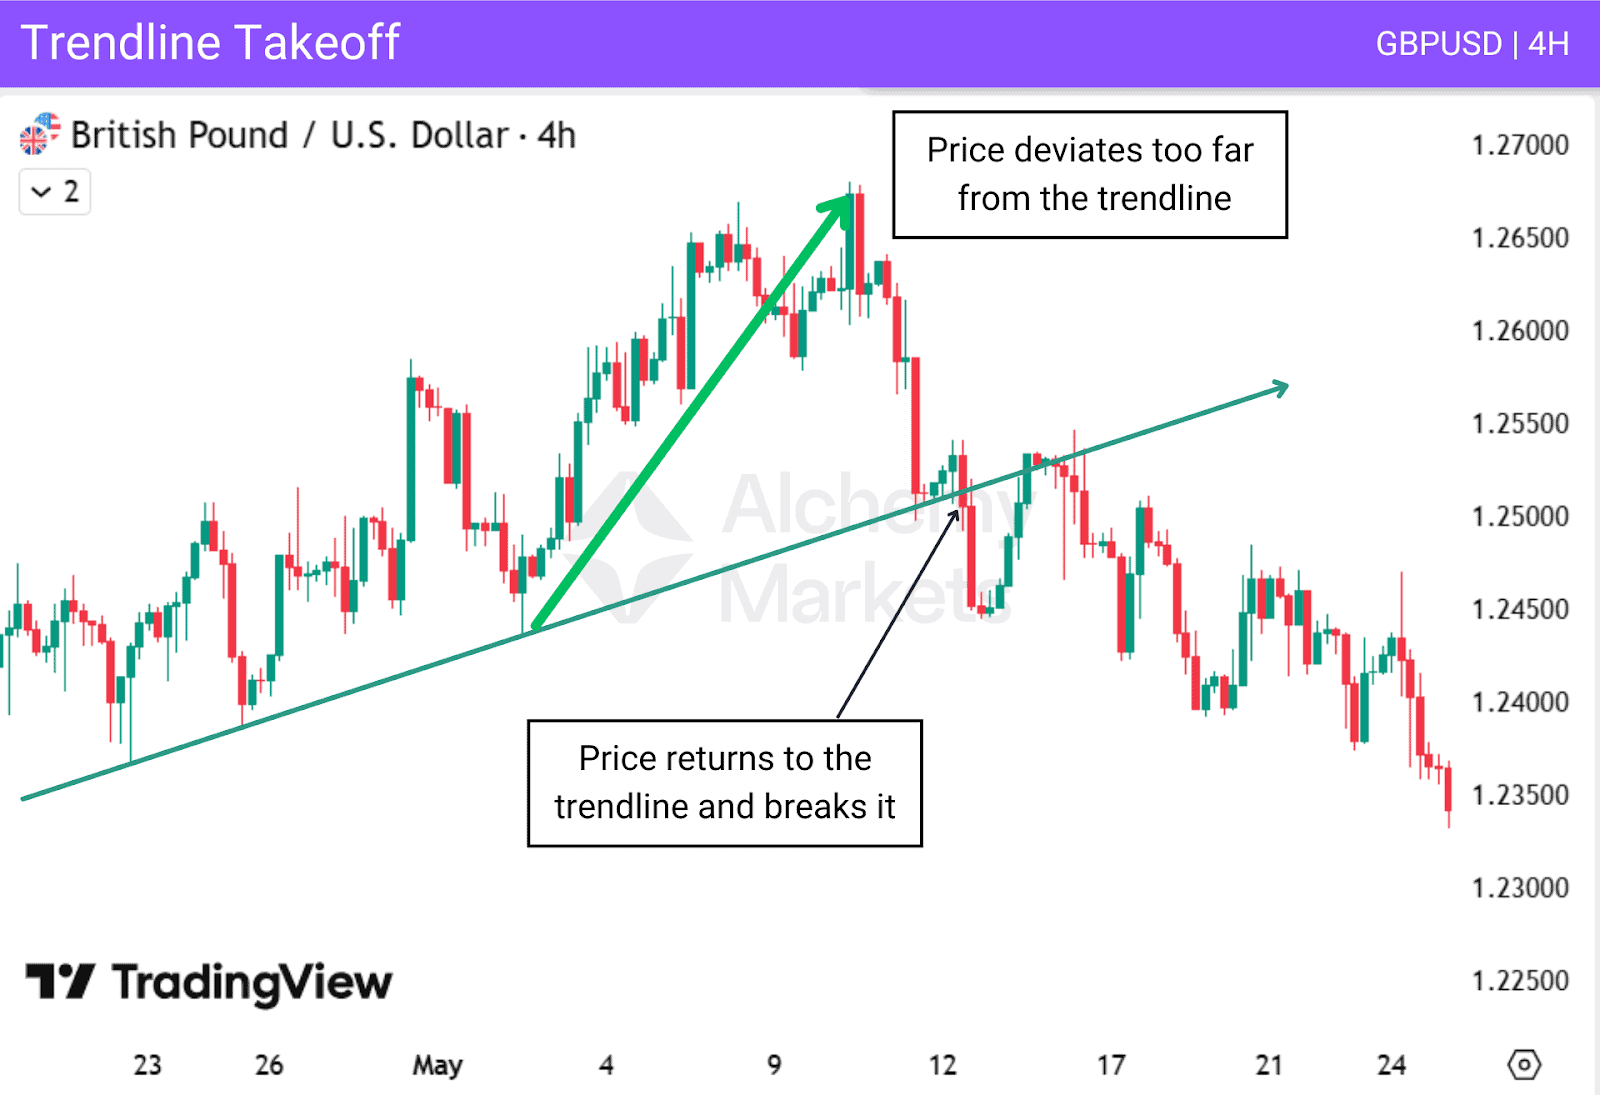
A trendline takeoff occurs when price accelerates away from a trendline instead of continuing to interact with it through consistent pullbacks. In a healthy trend, price remains relatively close to the trendline, allowing proportional reactions where earlier trendline bounces can be tradable.
Once a takeoff happens, this behaviour changes. Price separates too far from the trendline, making further bounce trades unreliable.
At this stage, traders should avoid relying on the trendline for entries and wait for clearer structure to form, such as a confirmed trendline break or the development of a new trendline.
Key points:
- Prior bounces are tradable only while price remains close to the trendline
- A takeoff signals reduced reliability of trendline-based entries
- After a takeoff, wait for another setup (e.g. a confirmed trendline break)
Trendline Bounce Setup
The trendline bounce setup focuses on price reacting to an established trendline and continuing in the same direction. This bounce remains valid as long as the trendline is not broken.
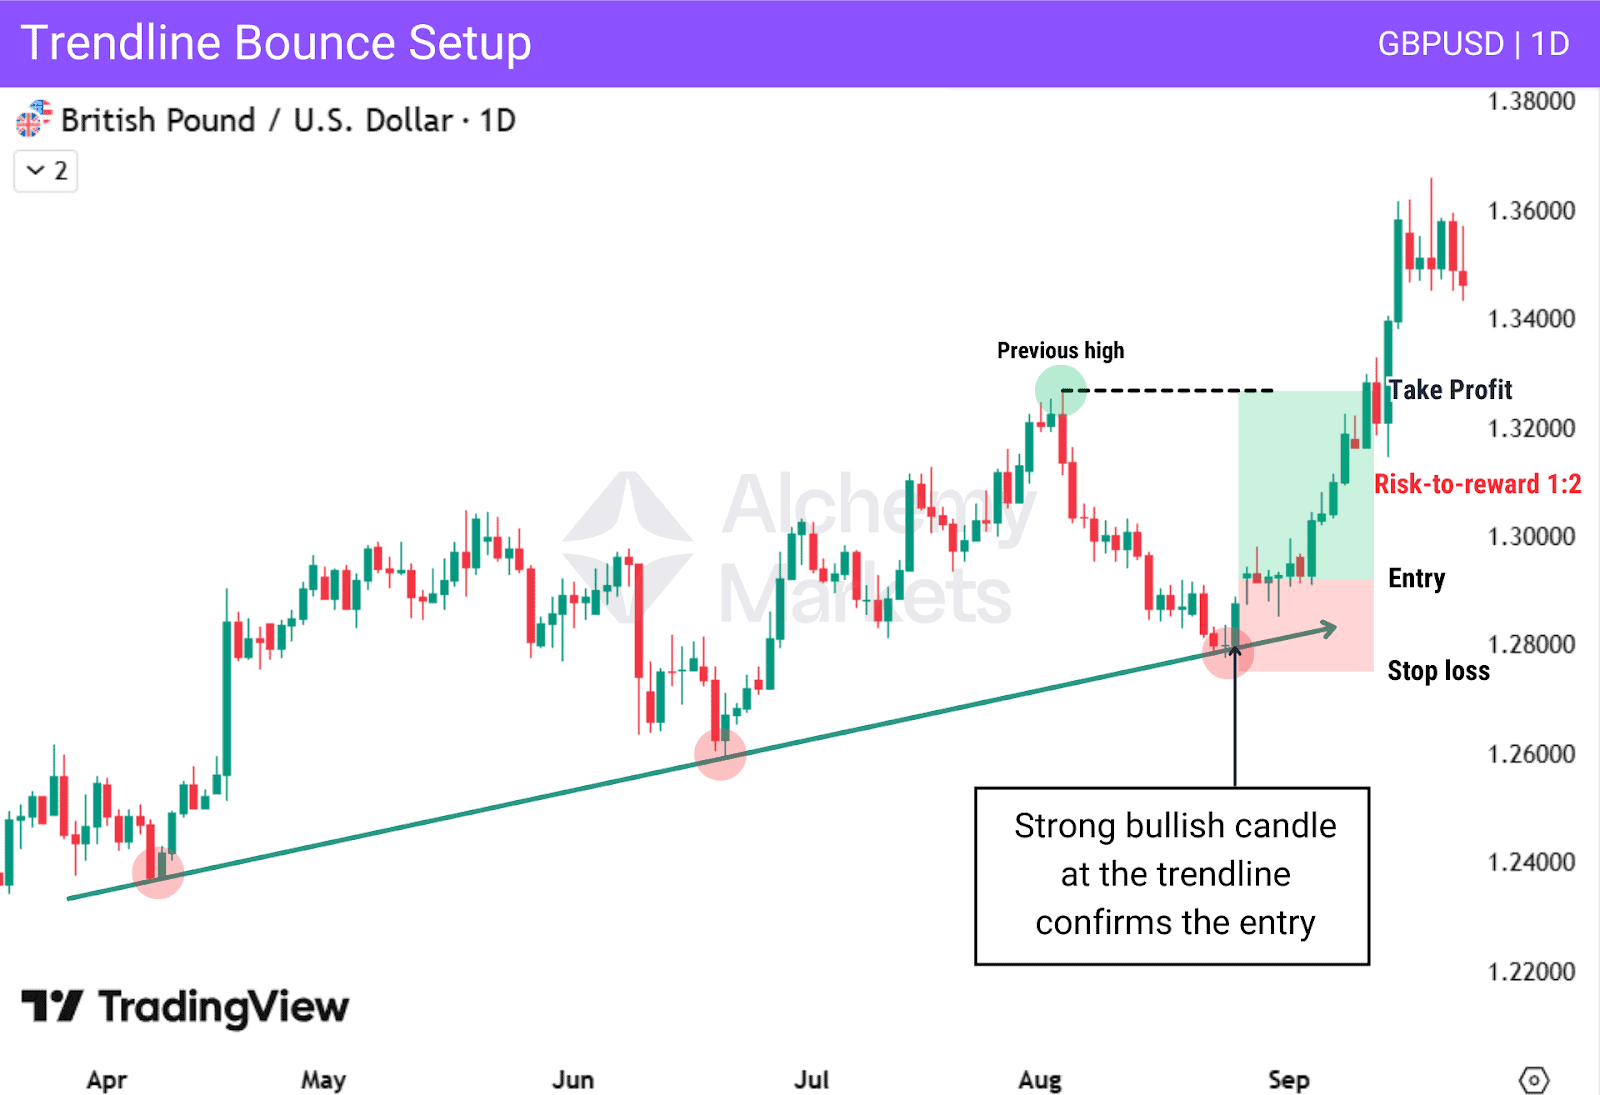
In this example, price returns to the trendline for the third time and forms a bullish engulfing pattern, a bullish reversal candlestick, showing a clear reaction. This reaction signals that buyers step in and that price is ready to move higher.
Trendline Break Setup
The trendline break setup focuses on identifying when an established trendline is broken and no longer being respected.
Because this setup often signals a reversal, entering directly after a trendline break can be risky.
To reduce false signals, you may look for additional confirmations, such as:
- A clear breakout beyond the trendline, rather than a wick or false breakouts
- A retest of the broken trendline, showing that price now respects it from the other side
- Volume or divergence signals aligning with the breakout
- Retests of Fair Value Gaps that support continuation after the break
Using these confirmations helps improve the reliability of the trendline breakout.
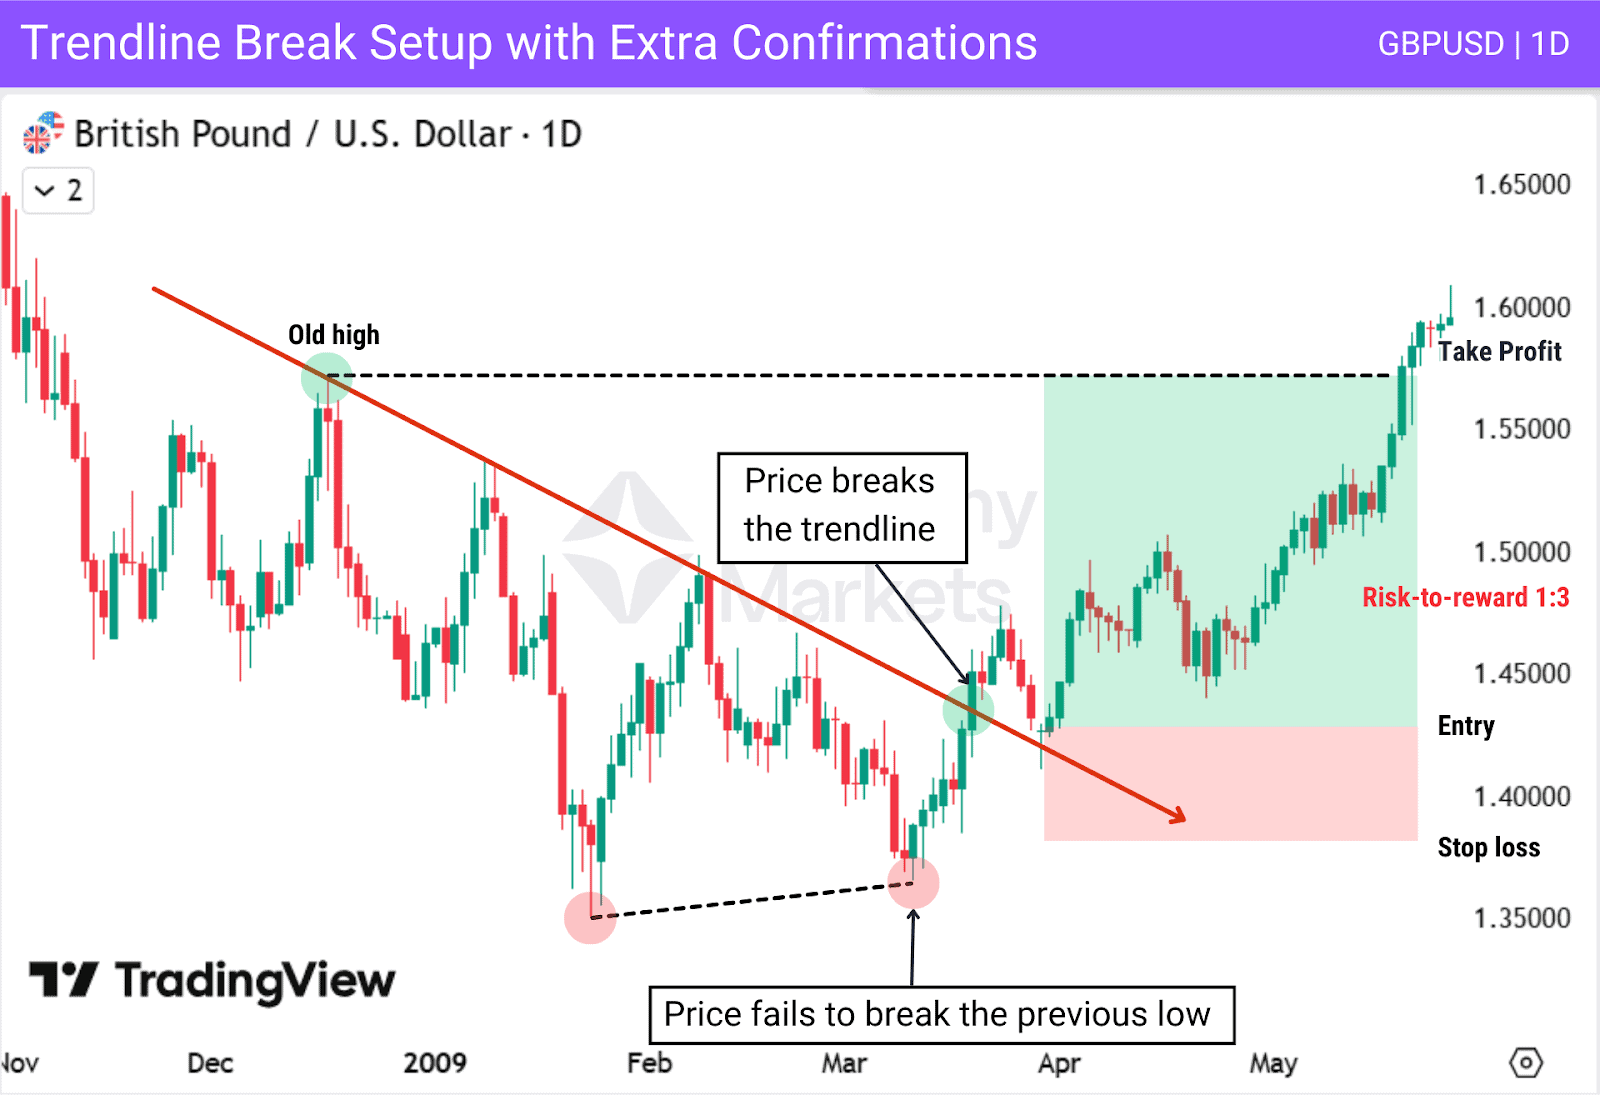
In this example, price is bearish and making lower lows, then fails to break a new lower low before breaking the trendline, which confirms that the trend has shifted.
For extra confirmation, the entry is taken after price retests the broken trendline and shows a candle rejection from it.
Trend Following Strategies
Trendlines are useful in trend-following strategies to stay aligned with the main market direction. Some traders use multiple trendlines, such as internal and external ones, or trendlines from different timeframes. Trades are only taken when they point in the same direction.
Some traders also use other methods to identify direction and use trendlines mainly for entries.
A simpler approach is to use one valid trendline and look for pullbacks into it. As long as price respects the trendline and shows rejection, trades are taken in the direction of the trend until the trendline is broken.
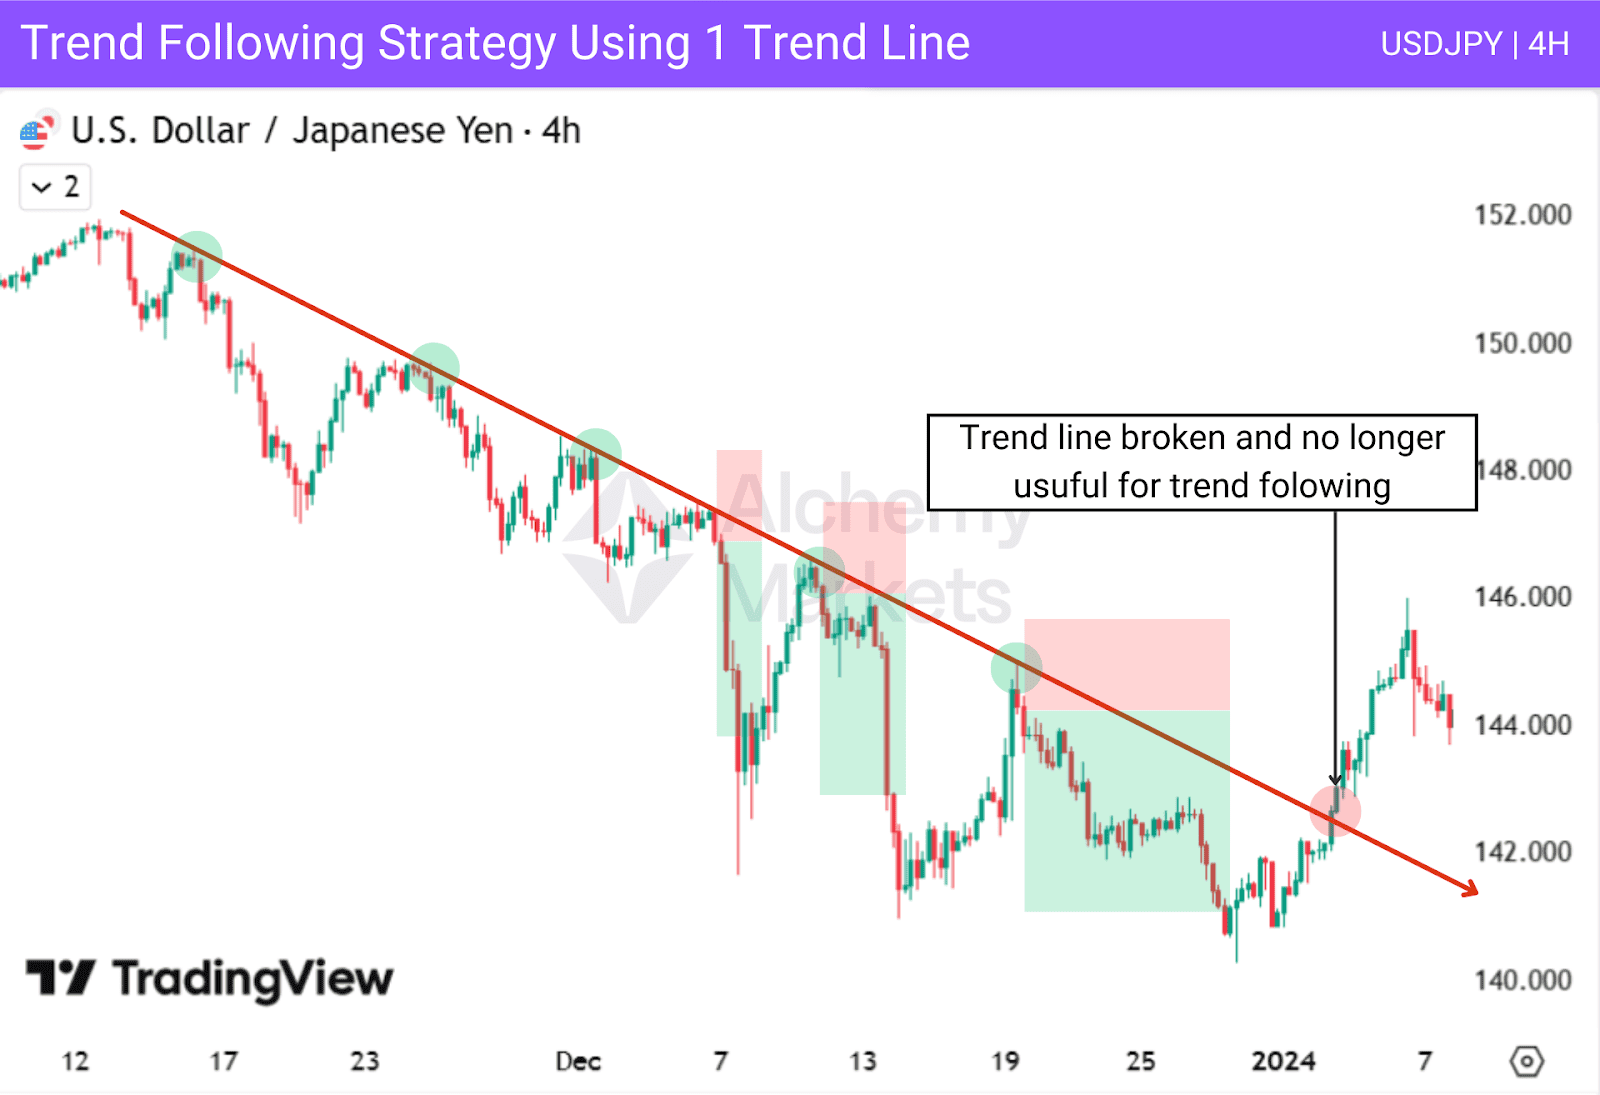
In this example, price respects the trendline several times, allowing trades to be taken on pullbacks. Once the trendline is broken, it is no longer useful for trend following and the trade is stopped.
Counter Trendline Breakout Strategy
A counter-trendline breakout strategy works best when using two trendlines: an external trendline and an internal one. When price moves away from the external trendline, it often forms a smaller internal trendline inside the move.
The idea is to wait for this internal trendline to break, then enter a trade expecting price to pull back toward the external trendline. Internal swings formed before the breakout can be used as targets, with the final target placed near the external trendline.
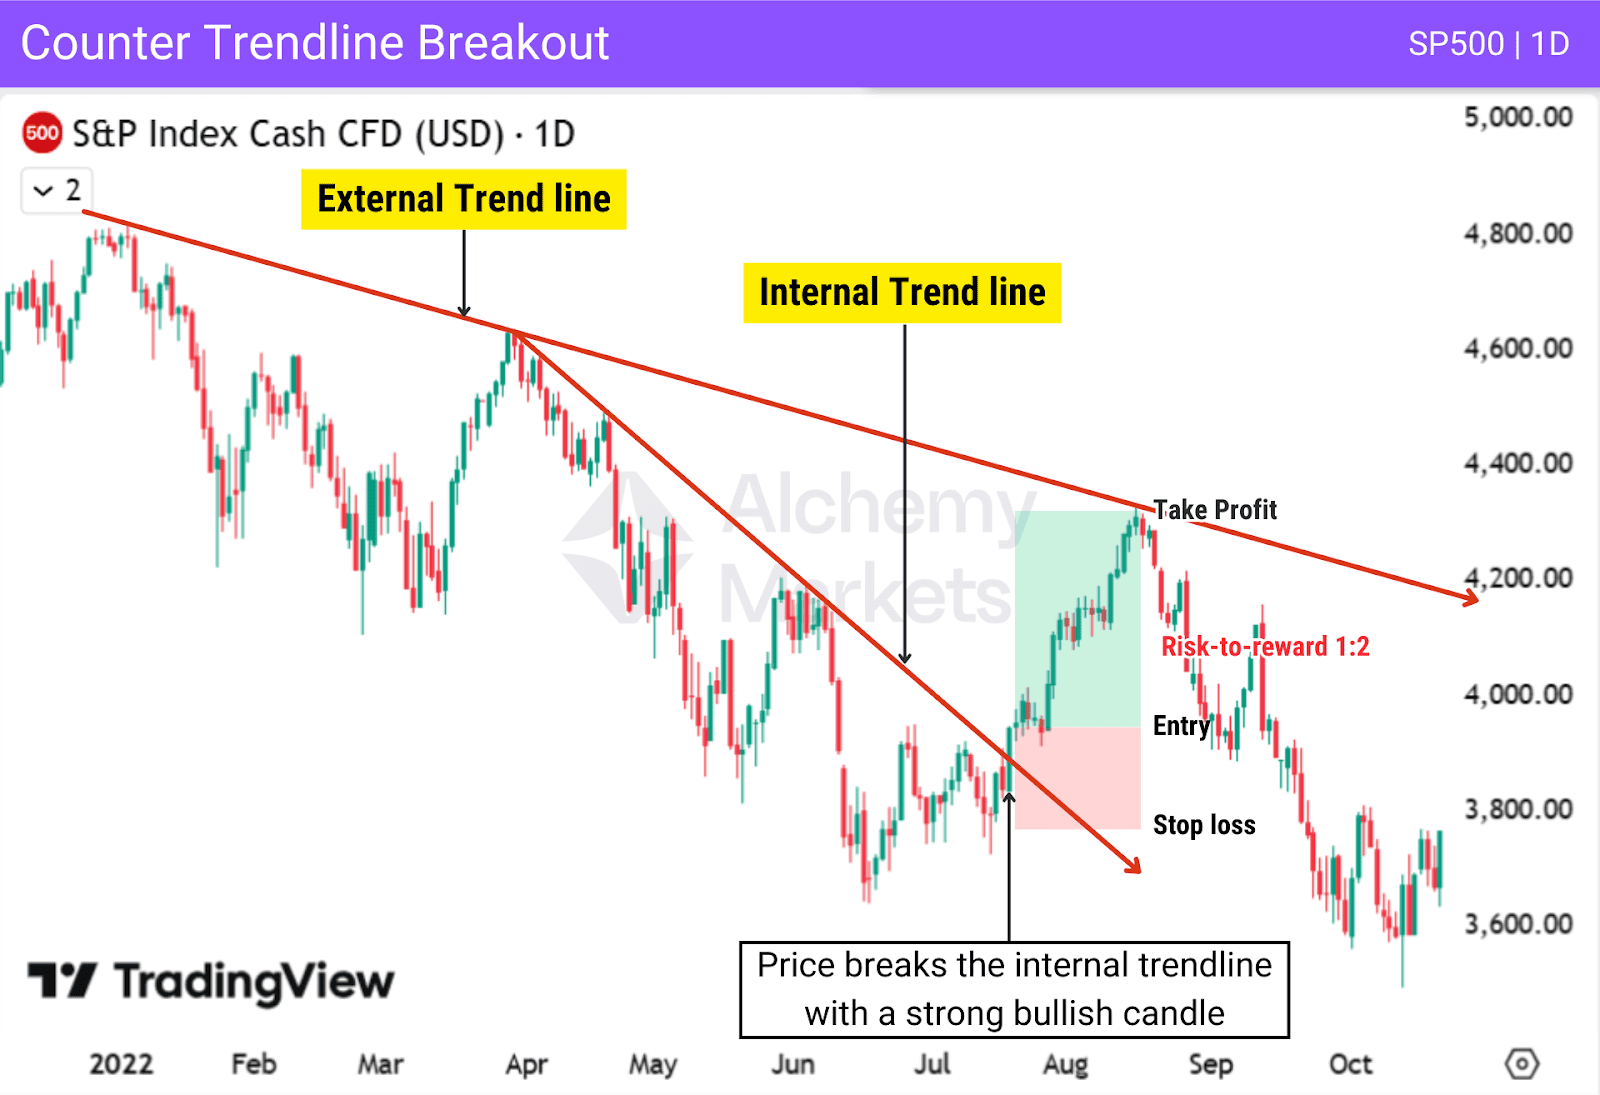
In this example, price breaks the internal trendline with a strong candle, showing that sellers are losing control and buyers are stepping in. The move that follows is treated as a correction, not a full trend change. For this reason, the target is kept below the external trendline.
Price Channel Strategy
Price channels are used to trade trends that move within clear boundaries. By drawing a trendline and extending it in parallel, traders can define both support and resistance zones. This helps set clear areas for entries, exits, and profit-taking.
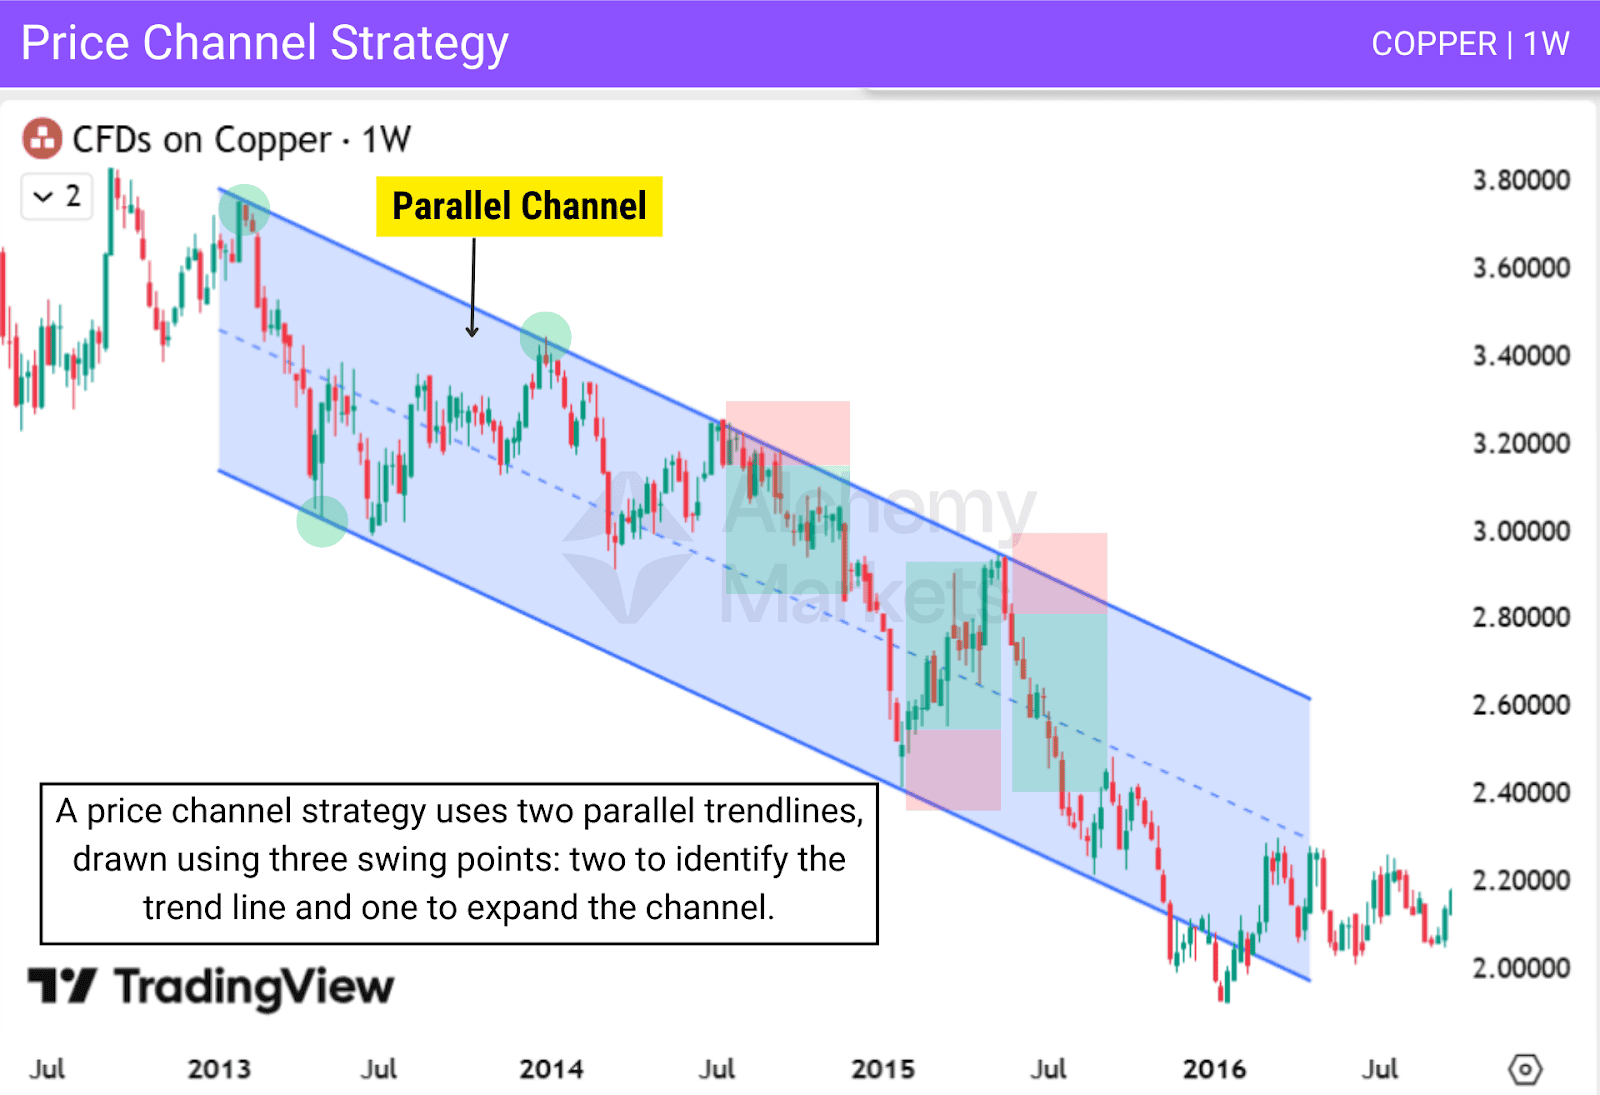
In this example, price moves inside a downward channel and reacts at both boundaries. Trades can be taken near the upper or lower edge. As long as price stays inside the channel, the structure remains valid.
Trend Reversal Breakout Strategy
A trend reversal breakout strategy focuses on moments when an existing trend starts to lose control and price begins to shift direction. This approach looks for clear reversal signals, such as a trendline break while a new trend starts to form in the opposite direction.
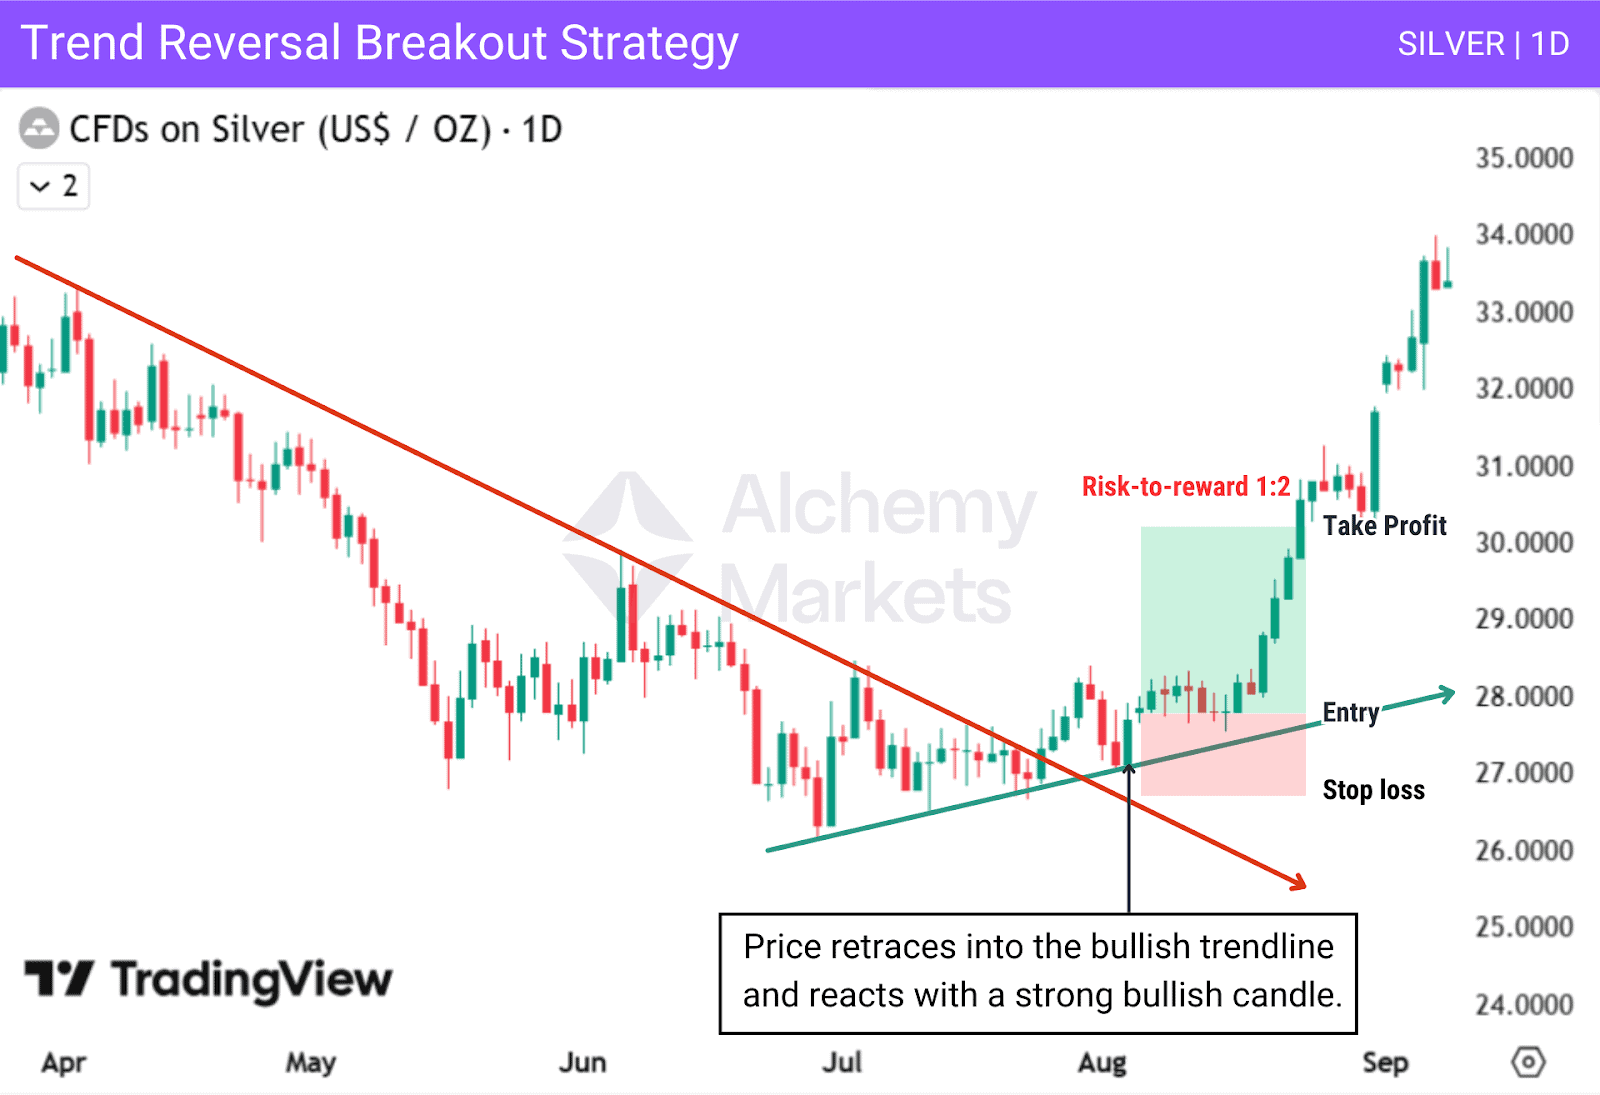
In this example, price breaks the bearish trendline, showing that selling pressure is weakening. At the same time, a new bullish trendline starts to form, suggesting a possible reversal.
When price retraces into the new trendline and reacts with a strong bullish candle, it confirms buying strength and provides an entry.
Trendlines vs Channels in Chart Analysis
Trendlines and channels are related tools, but they do not appear with the same frequency on the chart. Trendlines are more common, while channels require stricter conditions to form.
- Trendlines:
A trendline only needs swing points on one side of price to be valid. As long as higher lows or lower highs align on a single line, a trendline can be drawn. The opposite side does not need to form a matching structure, which makes trendlines frequent. - Channels:
A channel requires two parallel trendlines, meaning price must respect both support and resistance in a similar way. This parallel structure forms less often, which makes channels rarer. When present, channels allow traders to take buy and sell opportunities in the same overall direction.
Because of this difference, trendlines are usually used first to identify direction. Channels tend to appear later, once price becomes more structured and contained. Used together, trendlines define direction, while channels add boundaries for managing entries and exits.
Advantages of Trading Using Trendlines
Trendlines provide a simple way to understand market direction and structure. When used correctly, they help traders organise price behaviour and make more consistent decisions, especially when combined with other tools.
| Advantage | Explanation |
| Clear market direction | Trendlines help identify whether the market is trending up, down, or moving sideways, reducing confusion. |
| Improved structure | They organise price movement into a clear visual framework, making charts easier to read. |
| Better trade discipline | Trendlines encourage rule-based decisions instead of emotional reactions to short-term moves. |
| Versatility across markets and timeframes | Trendlines work across asset classes and remain effective on both higher and lower timeframes. |
| Supports confirmation and risk management | Trendlines work well with other tools and provide clear invalidation points when structure breaks. |
Overall, trendlines help simplify decision-making by providing clear structure and context. Used realistically, they support disciplined trading rather than acting as standalone signals.
Disadvantages of Trading Using Trendlines
While trendlines are useful, they have clear limitations and should not be treated as precise or predictive tools. Understanding these weaknesses helps traders apply trendlines more realistically and avoid false confidence.
| Disadvantage | Explanation |
| Subjective interpretation | Trendlines can be drawn differently by traders, which may lead to inconsistent analysis if clear rules are not followed. |
| False breakouts | Price may briefly break a trendline before resuming the original direction, creating misleading signals. |
| Low to medium risk-to-reward | Trendline setups often offer modest risk-to-reward ratios, commonly around 1:1 to 1:2, especially when traded in isolation or on lower timeframes. When combined with price patterns and multiple timeframes (higher/lower), the risk-to-reward can improve. |
| Lack of clear targets | Trendlines do not always provide clear profit targets, particularly in markets making new highs or new lows for the first time. |
| Less effective in ranging markets | Trendlines lose relevance when markets move sideways without a clear directional structure. |
Trendlines are best used as structural references for confirming direction. Understanding their limitations encourages traders to seek additional confirmation and apply more disciplined risk management.
FAQ
Is a Trendline Strategy Profitable?
Trendline strategies can be profitable when used with discipline, proper risk management, and realistic expectations. Results depend more on how the strategy is executed and the market conditions than on the trendline itself.
Which Timeframe Is Best for Trendline Trading?
There is no single best timeframe. Higher timeframes usually give more reliable trendlines, while lower timeframes provide more frequent but less stable trading opportunities.
Why Are Trendlines Significant in Technical Analysis?
Trendlines help traders identify market direction, structure, and potential support and resistance levels. They make price behaviour easier to understand and follow.
What Is the Significance of the Spacing of Points in a Trendline?
Well-spaced swing points show that a trend has developed over time. This generally makes the trendline more reliable than one drawn from closely clustered points.
How Does the Angle of a Trendline Affect Its Validity?
Very steep or very flat trendlines are often less reliable. Trendlines with angles around 20° to 45° usually reflect healthier and more stable trends.
What Are the Common Trendline Mistakes to Watch Out For?
Common mistakes include forcing trendlines to fit price, ignoring the broader market context, and treating trendlines as exact barriers instead of guides.
What Are the Best Scale Settings for Trendlines?
The best scale depends on the market and timeframe. What matters most is using the same scale consistently, whether linear or logarithmic.
Is Trendline Trading Legit?
Trendline trading is a legitimate and widely used method in technical analysis when applied realistically and supported by proper risk management.


