


Written by:

Reviewed by:


Bearish
Bullish
- May 7, 2026
- 35 min read
Breaker Block Explained
Imagine it, the price of your favourite stock is just relentlessly climbing. Then suddenly: wham.
The price collapses below the previous low, taking out your long position, only to whip right back up into new highs.
Such scenarios can be frustrating, but they’re not exactly uncommon either; especially when trading equities or cryptocurrencies.
With breaker blocks, a component of the Smart Money Concepts trading approach, we can actually turn these scenarios into trade opportunities instead.
More importantly, Breaker Blocks offer an explanation of why price just moved the way it did, and what is likely to happen next.
In this guide, you will learn what breaker blocks are, how they form, how to identify them on a chart, and how traders use them to structure trade ideas around these flipped levels.
What are Breaker Blocks?
Breaker Blocks are failed order blocks that flip their role after price breaks through them with strength, turning former support levels into resistance, or resistance levels into support.
They form when an existing trend structure is broken, signalling a potential shift in market direction.
For example, in an uptrend, price typically forms:
Higher High (HH) → Higher Low (HL) → HH → HL
If this sequence is broken with a Lower Low (LL), replacing what should have been a HL, it signals a loss of bullish control and the potential start of a reversal.
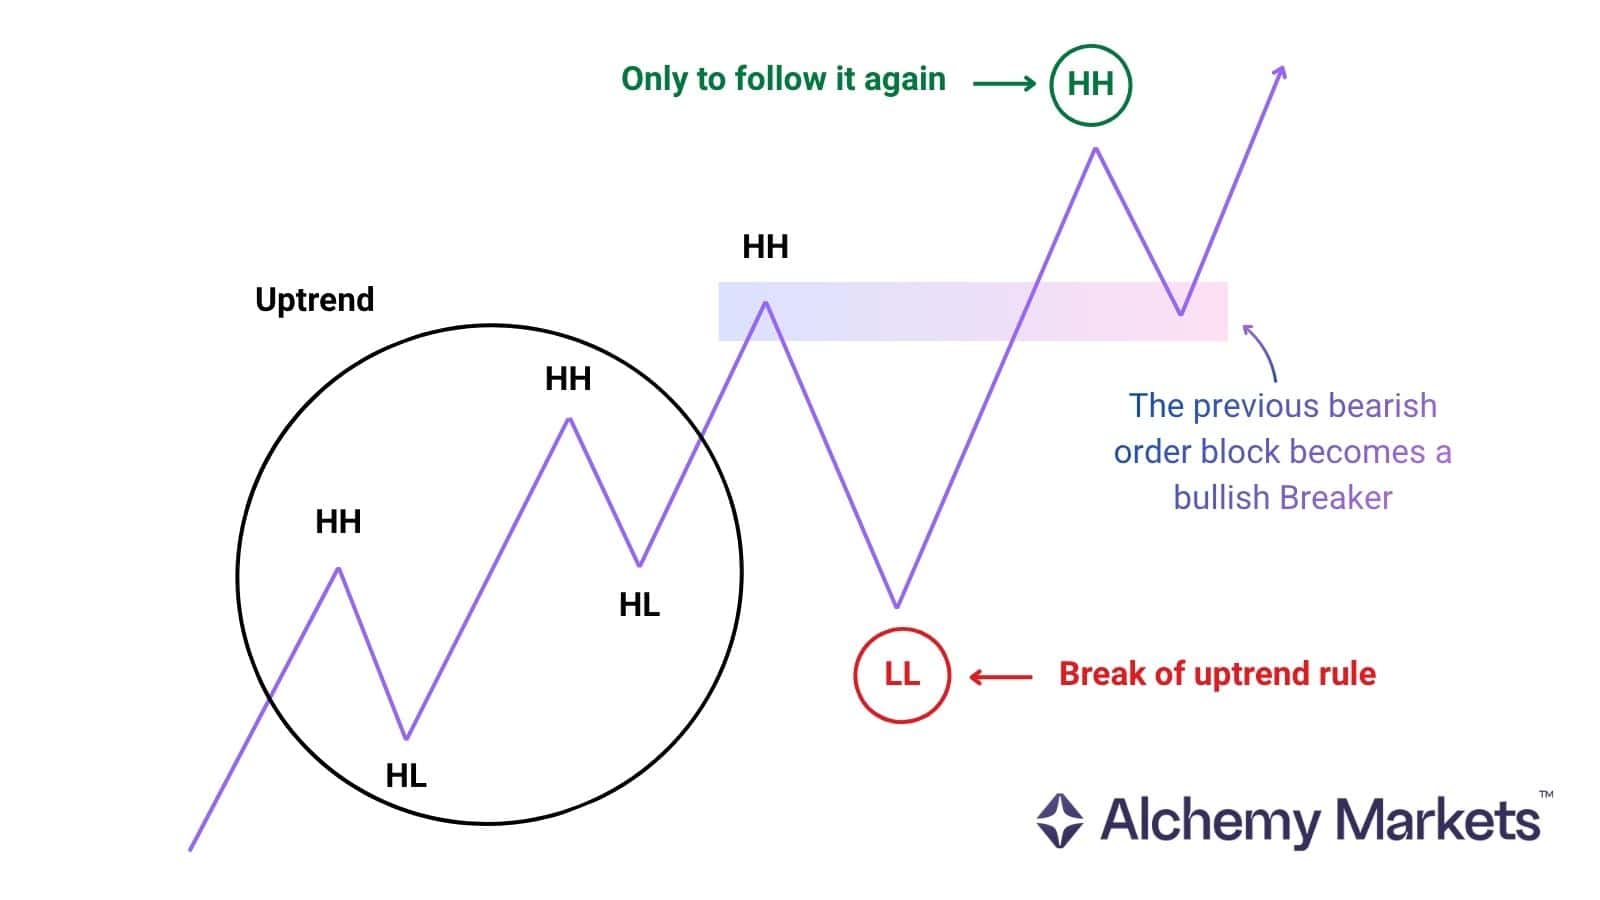
Normally, this would signal that the uptrend is potentially coming to an end. However, if the price goes on to then form a higher high – Smart Money Concept traders look at this and think:
“The smart money clearly pushed the prices lower than what was expected, in order to fill up on larger orders at a more viable price.”
So instead of being confused by this whipsaw structure, an SMC trader who understands breaker blocks may instead view this as an opportunity.
Types of Breaker Block
Breaker blocks (BB), or simply called “breakers”, come in two forms: bullish and bearish. The type depends on both the direction of the broken order block and the surrounding market structure.
A breaker block is all of the following at the same time:
i. A broken order block (the original zone fails to hold)
ii. A clear break in market structure (e.g. CHoCH such as LL in an uptrend or HH in a downtrend)
iii. A move that shows strong displacement or impulse
iv. A liquidity sweep or grab before the break
v. A price zone speculated to create a reversal when revisited
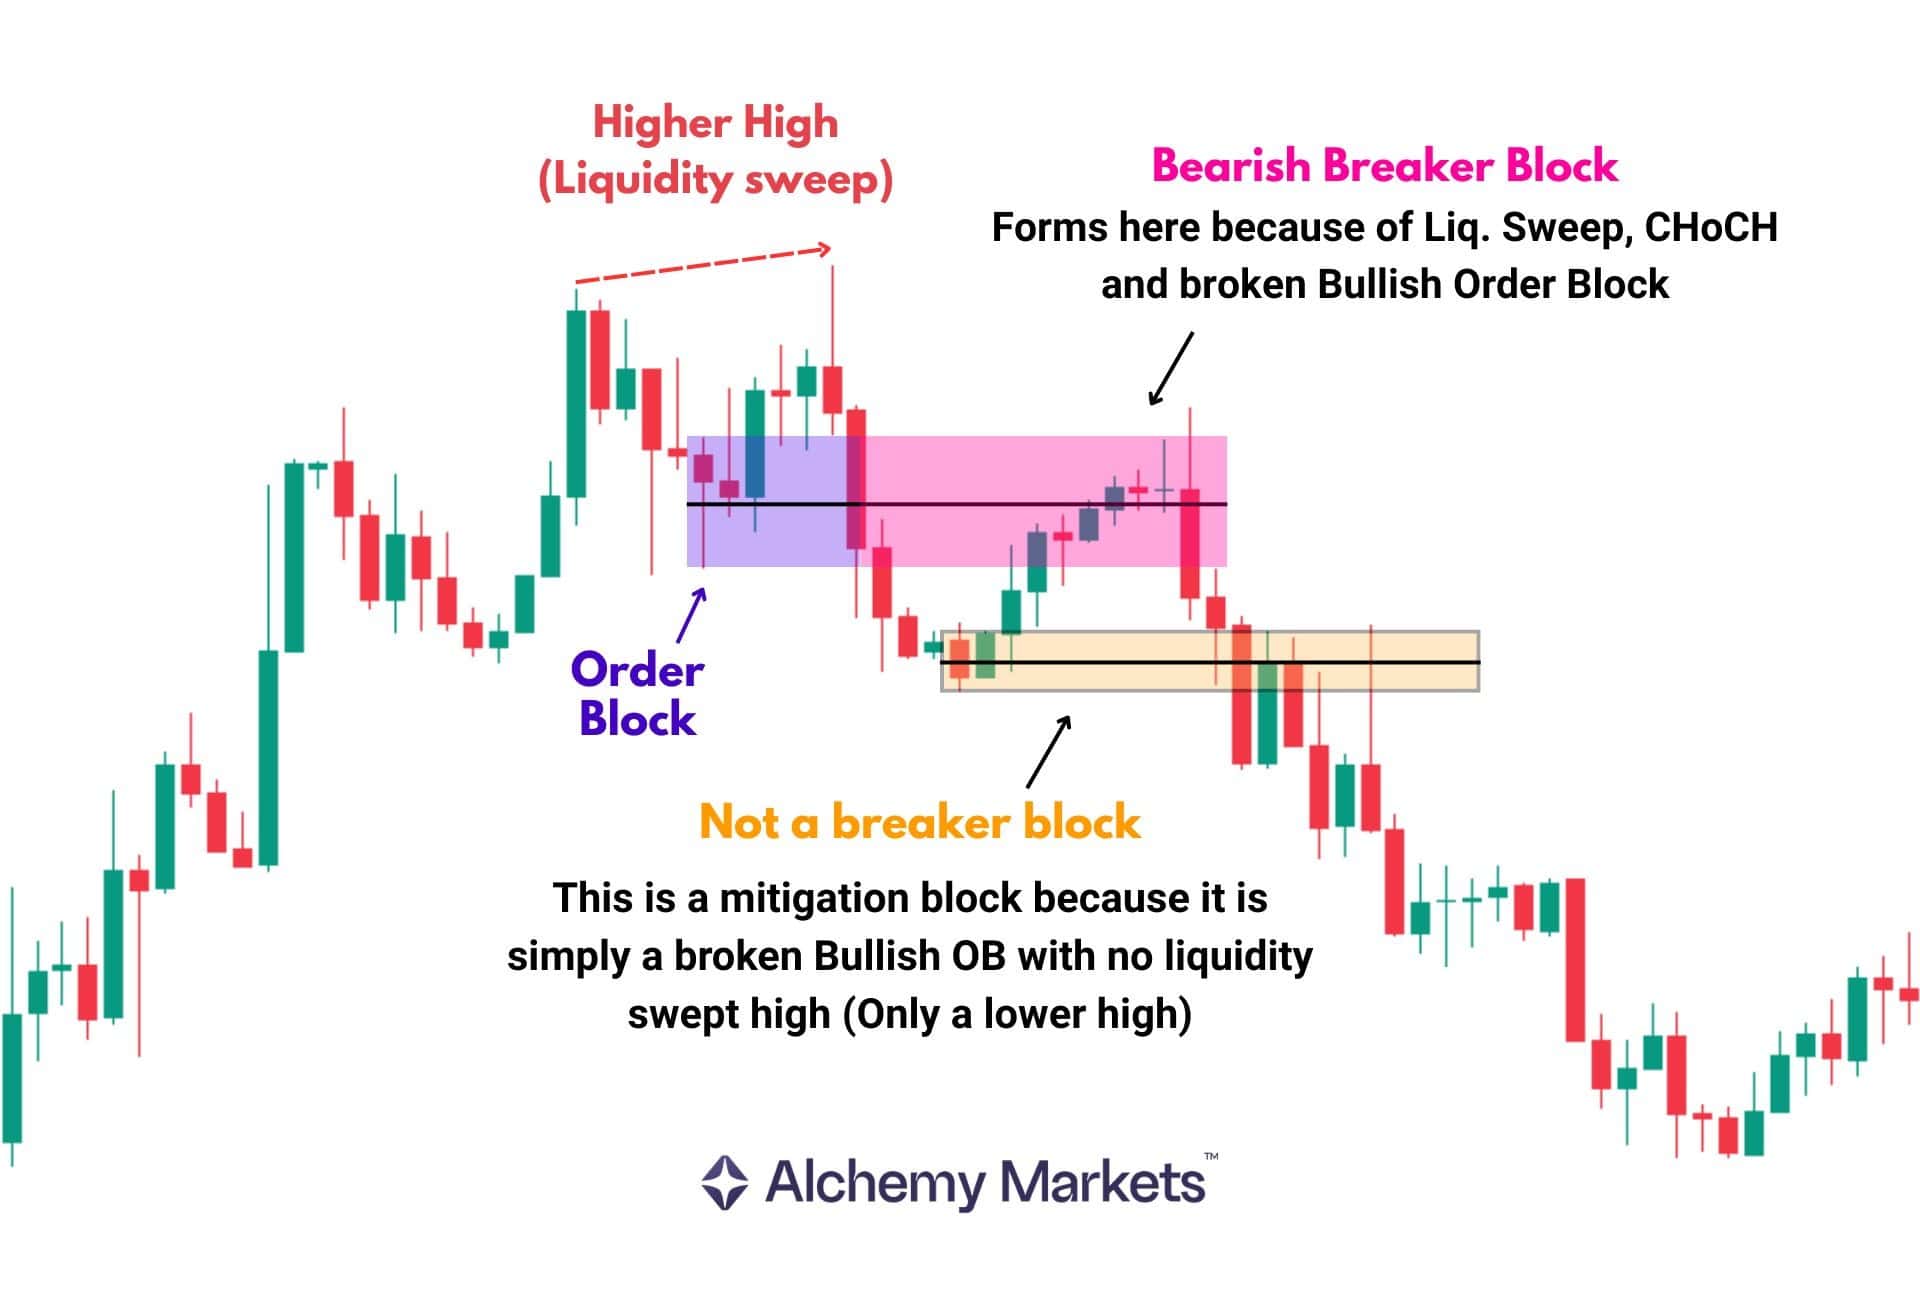
If no liquidity sweep occurs before the break, the zone is usually classified as a mitigation block rather than a valid breaker block.
In this case, price is simply returning to a prior order block to mitigate (fill remaining orders) before continuing in the same direction, rather than reversing the trend as a breaker block would suggest.
Bullish Breaker Block
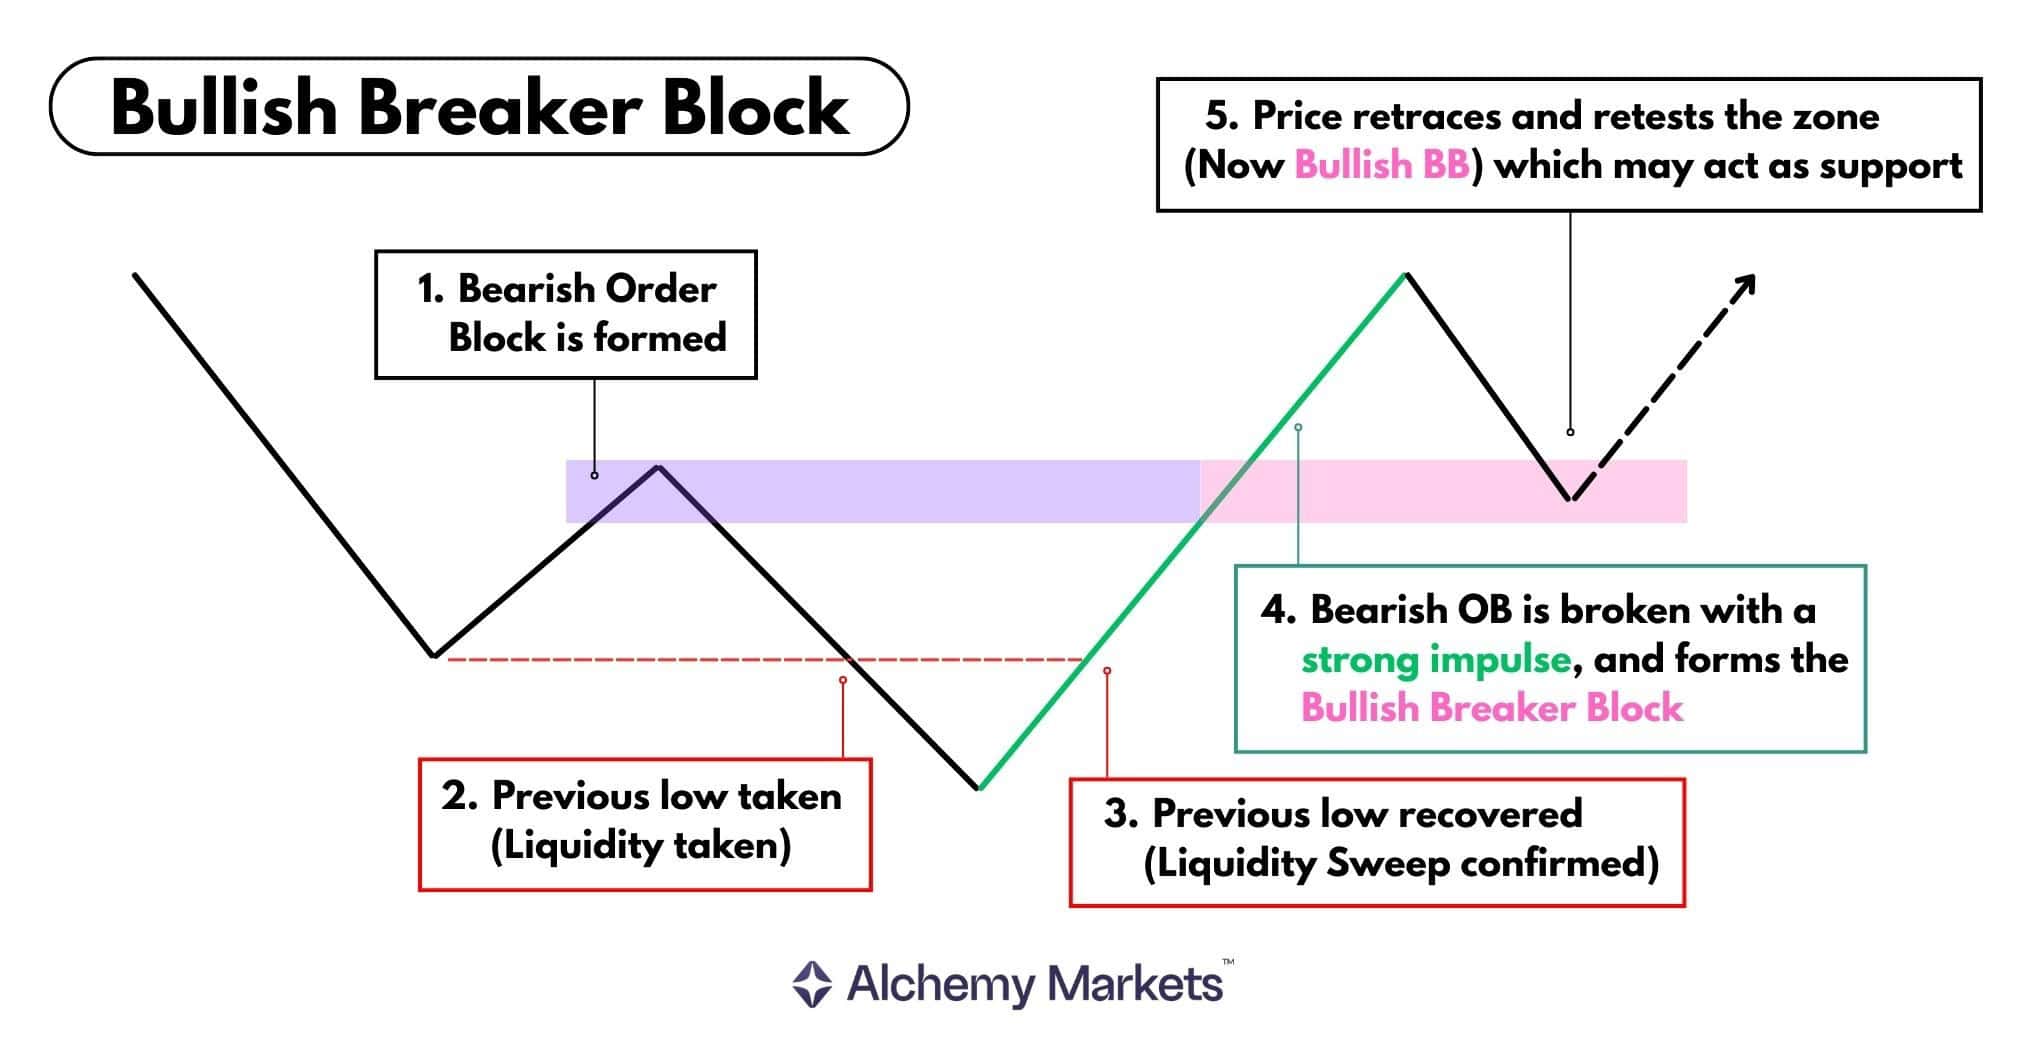
A bullish breaker block forms when price pushes into a lower low, then when it returns to a bearish order block, it fails as a resistance zone and is broken through with strength. This tells us that sellers lost their ability to hold prices lower, and buyers took over.
Structurally, this is typically seen as a sequence of: LL → HH → HL
Altogether, the sequence looks like:
i. A bearish order block is formed
ii. Price breaks below a previous low, creating a lower low
iii. Price quickly moves back above the previous low, confirming a liquidity sweep
iv. A strong move breaks above the bearish order block (MSS / CHoCH)
v. When price comes back to the zone, the bearish OB becomes a bullish breaker block (Support)
This is where traders begin looking for long opportunities.
Bearish Breaker Block
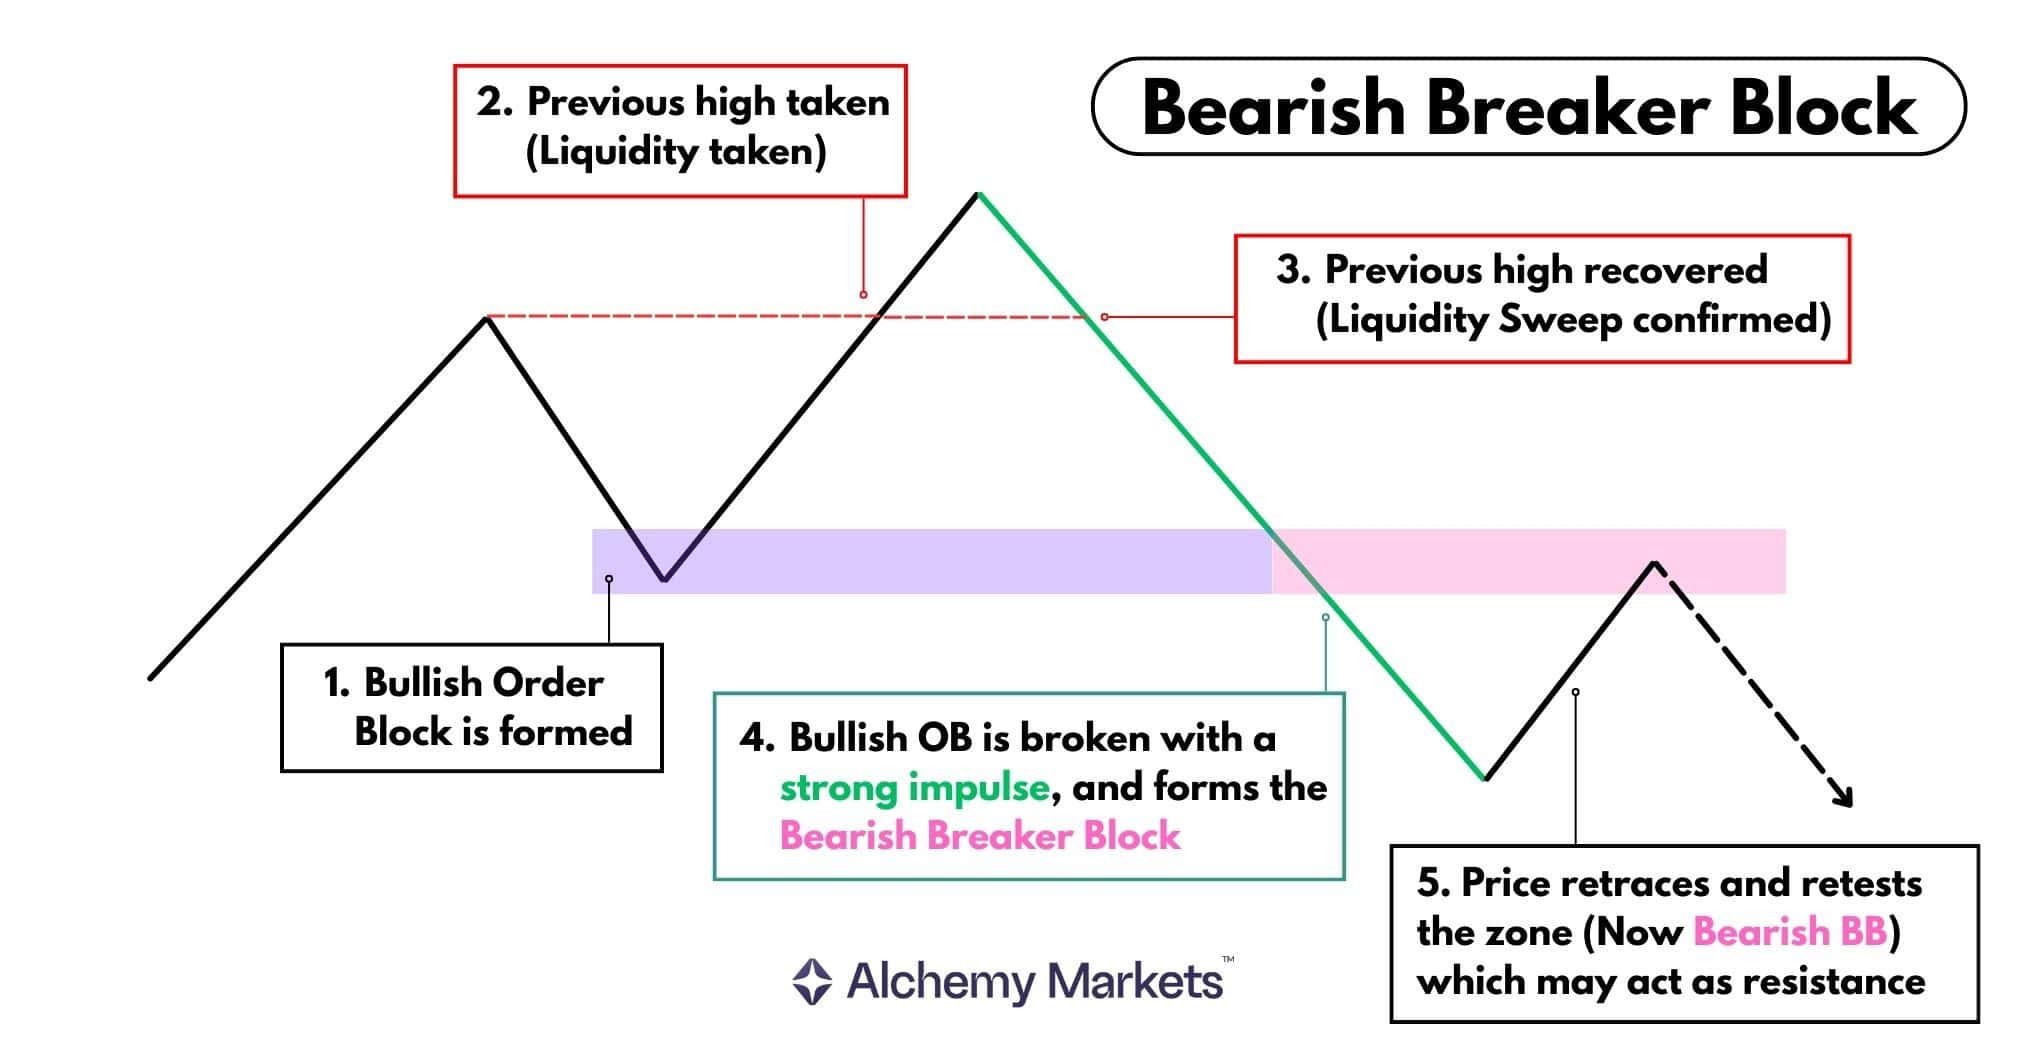
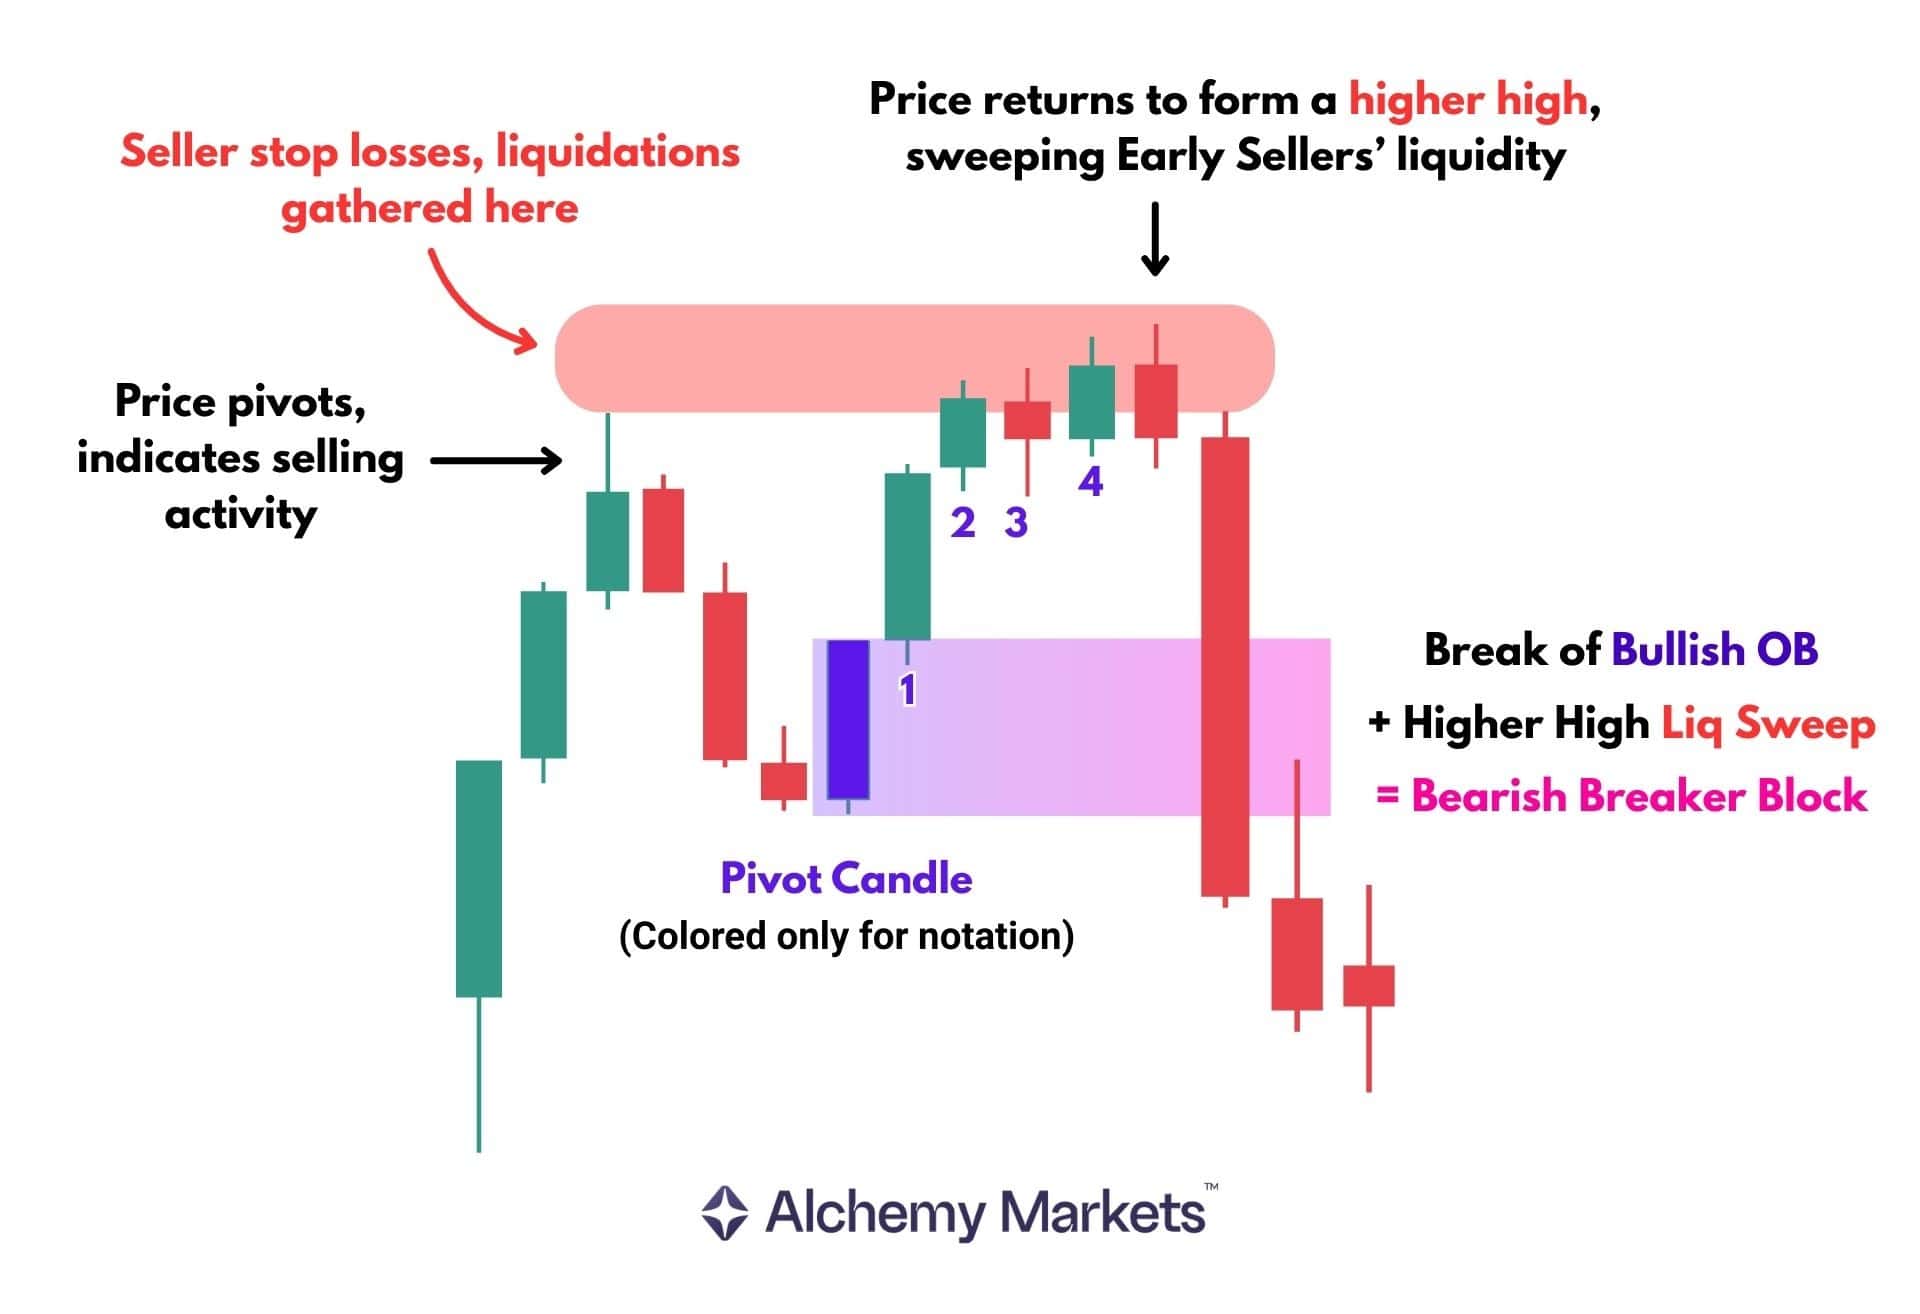
A bearish breaker block forms when price pushes into a higher high, then when it returns to a bullish order block, it fails as a support zone and is broken through with strength. This tells us that buyers lost their ability to hold prices higher, and sellers took over.
This is typically seen as a sequence of: HH → LL → LH
Altogether, the sequence looks like:
i. A bullish order block is formed
ii. Price breaks above a previous high, creating a higher high
iii. Price quickly moves back below the previous high, confirming a liquidity sweep
iv. A strong move breaks below the bullish order block (MSS / CHoCH)
v. When price comes back to the zone, the bullish OB becomes a bearish breaker block (Resistance)
This is where traders begin looking for short opportunities.
What is the Difference Between Bullish and Bearish Breaker Blocks?
The difference lies in which order block fails and how price reacts afterward.
- A bullish BB forms from a failed bearish OB, and acts as support
- A bearish BB forms from a failed bullish OB, and acts as resistance
In both cases, the logic remains the same:
- Liquidity is taken
- Structure shifts (MSS / CHoCH)
- The order block fails
- The zone flips
How to Identify Breaker Block
Before identifying a valid breaker block, it’s important to understand what it is not.
Not every broken order block becomes a breaker block. For a breaker block to be valid, price must first take liquidity (by sweeping a prior high or low) and then shift structure.
If no liquidity is swept, the level is simply a mitigation block.
Mitigation blocks are still support-resistance zone flips and can be traded similarly, but they are weaker.
Without liquidity taken at a prior high or low, there’s less evidence of institutional involvement, so reactions tend to be less aggressive and more continuation-driven.
How To Find a Bullish Breaker Block
① First step is to identify a bearish order block.
② Once it gets broken to the upside, a bullish breaker is formed.
The existing trend is not the main concern here.
What matters most is that price first takes sell-side liquidity — by creating a lower low — before breaking above the block.
Here’s how you can identify a bearish OB, using our method:
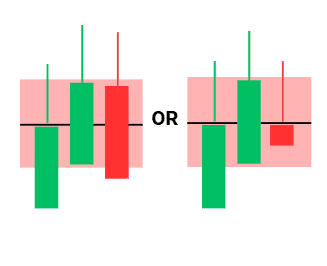
i. Find the highest candle in an upswing that leads to a pivot.
ii. Then watch the next four candles.
iii. If the 4th candle closes outside the pivot candle’s range, the pivot is considered significant and the order block is valid.
Once that bearish order block is later broken to the upside, it becomes a bullish breaker block. From there, traders can watch for price to return to the zone and react from it.
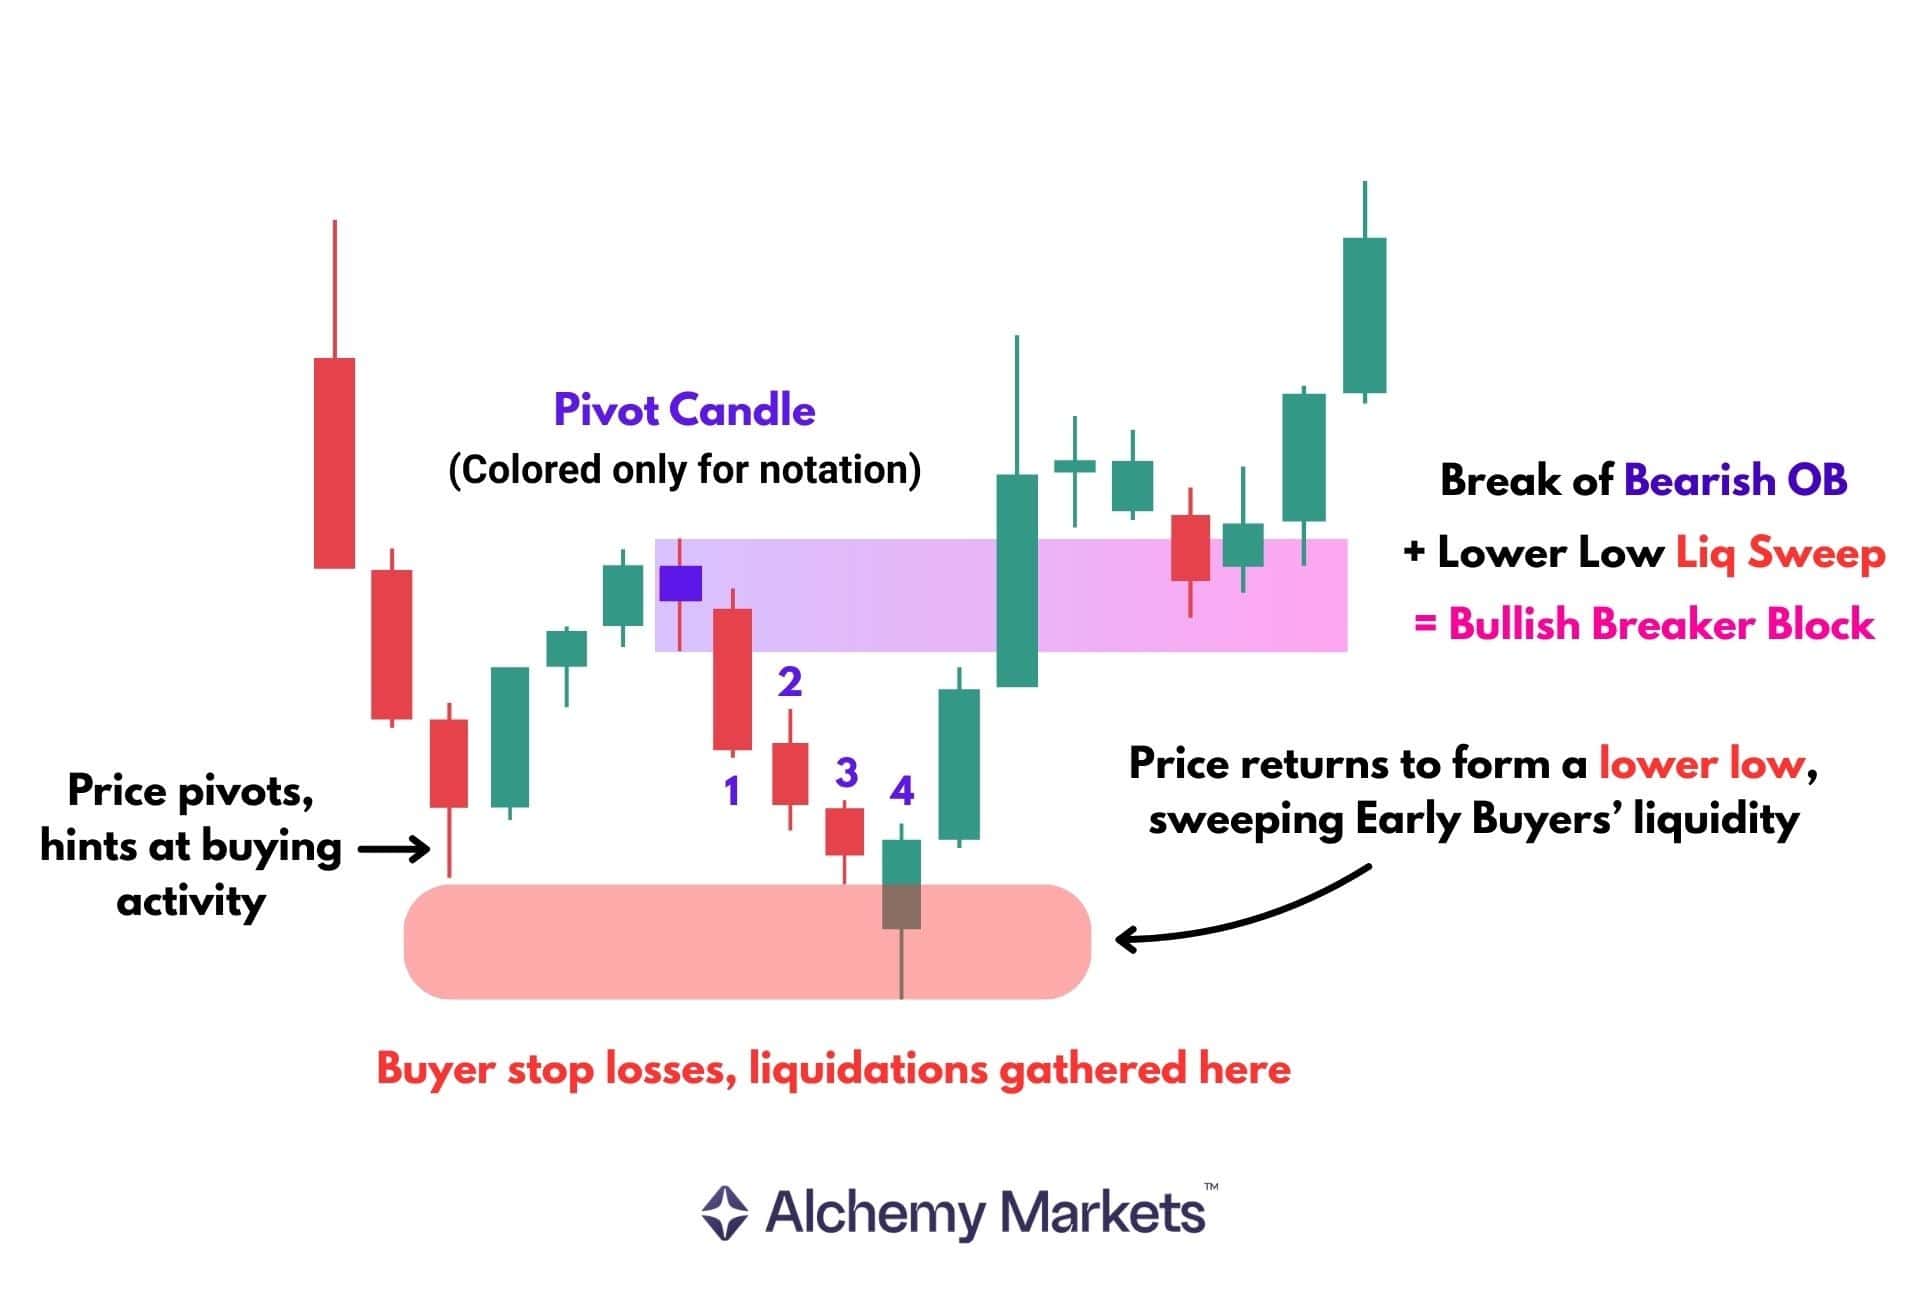
| Note: The numbers 1, 2, 3, and 4 represent the candles that form after the pivot candle. |
How to Find a Bearish Breaker Block
To find a bullish breaker, we need to identify a bullish order block that gets broken to the downside.
Again, use our method above to identify a true bullish order block, except it should occur from a downswing and not from an upswing.
If that block is broken, we have a bearish breaker block that can act as a tradeable short setup.
Breaker Block Example
Here we have a real chart example of a breaker block forming on the Copper 1H chart.
Notice the purple bearish order block acting as a resistance zone.
Price then moves lower, briefly forming a lower low, but quickly reverses back above the previous low, indicating a liquidity sweep.
With both conditions for a BB in place, the final step is to wait for a decisive break above the order block.
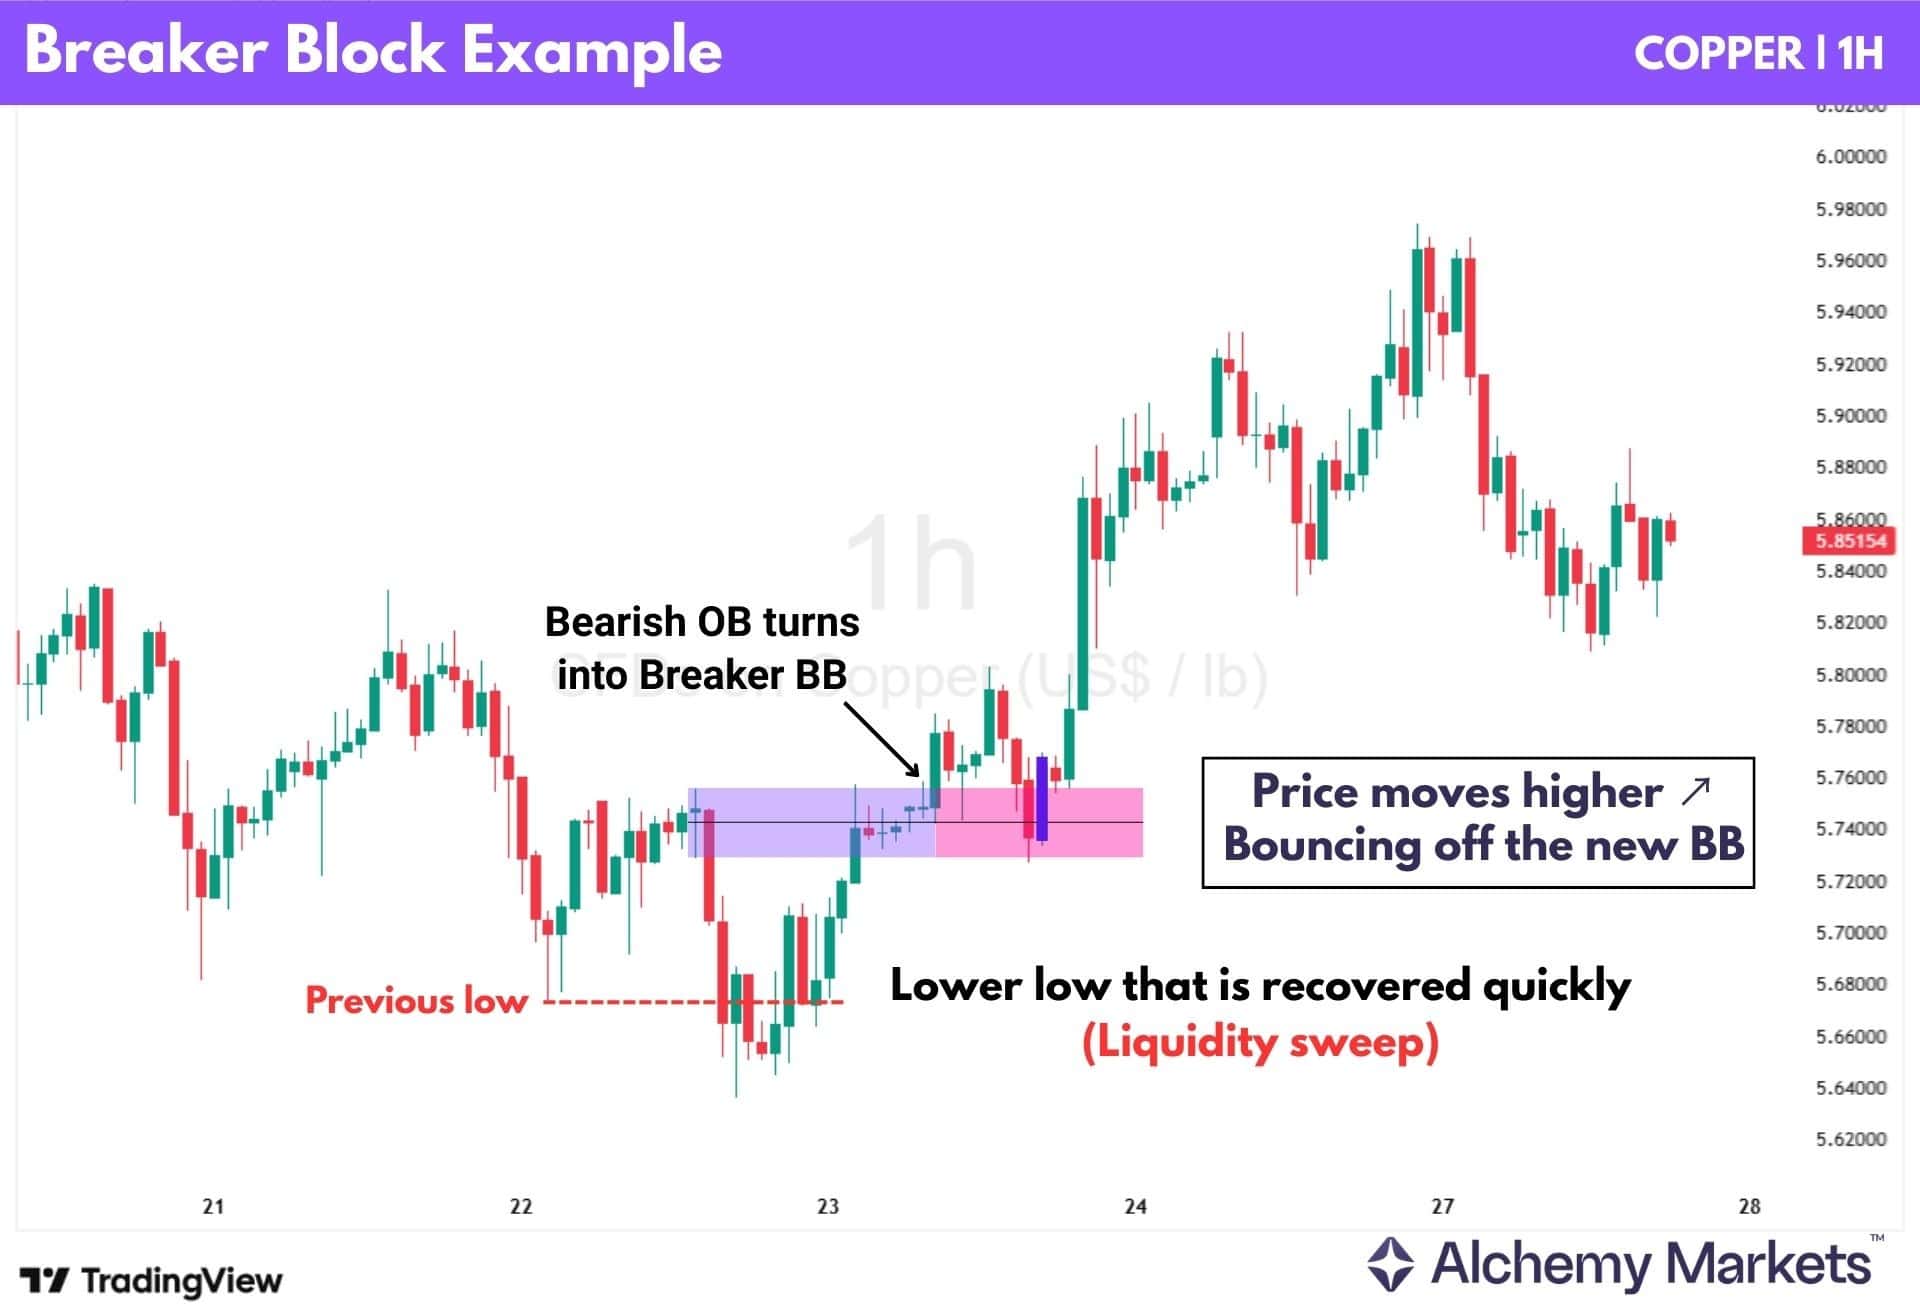
Since the bearish order block is broken, the same area has now become a bullish breaker block.
Notice how on a revisit, the price bounces off the same zone, using it as support cleanly.
How To Use Breaker Block
The breaker block is useful as a support or resistance zone, depending on where the price broke towards:
① If price breaks down, the BB acts as resistance.
② If price breaks upwards, the BB acts as support.
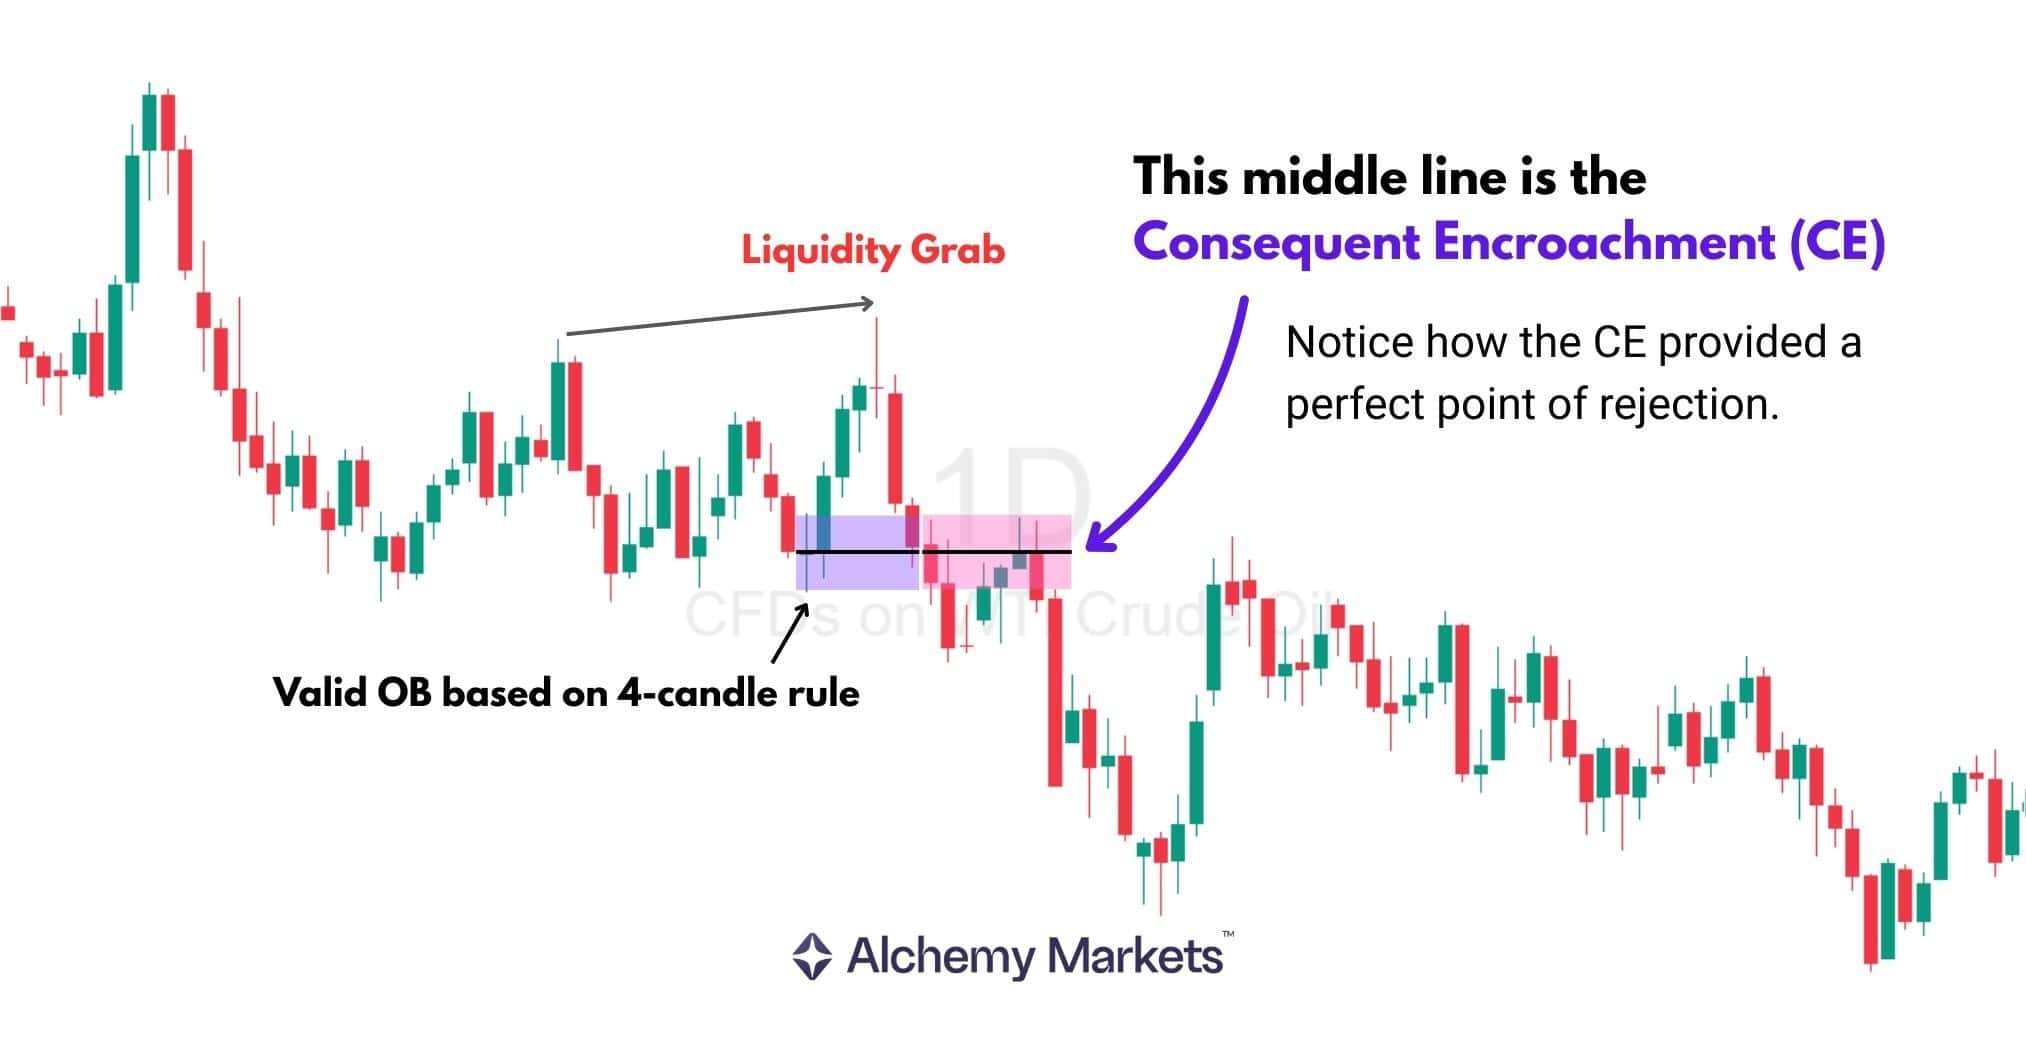
As a complement to this simple purpose, many SMC traders draw a line in the 50% retracement of the block to find a potential entry level. This level is called the Consequent Encroachment (CE).
How To Trade Using Breaker Block
Unlike the order block, a breaker block does not have to wait for 4 candlesticks to follow through to be considered valid (our custom rule for validating order blocks). That would simply take too long and cause you to miss trade opportunities.
Instead, what we look for is an immediate retest of the block without breaking it to the other opposite, to execute a trade.
A couple of actionable ways to trade a breaker block is as follows:
① After a breaker block has formed, wait for a retest of the block.
② This could be a wick, close back and close beyond the zone again, or failure to break the Consequent Encroachment (CE).
Usually, the stop loss is placed beyond the block’s range, and the take profit can be mechanically set to 1:2 RR or 1:3 RR.
Alternatively, a more nuanced approach is to target opposing PD arrays, which are SMC support and resistance zones:
e.g. Order Blocks, Mitigation Blocks, Breaker Blocks, Fair Value Gaps
For example, in a short trade, you would aim to take profit at these bullish PD arrays.
Long Trade Example
On this gold chart, a broader resistance is identified by the purple rectangular zone, which represents a bearish order block.
As price trades below this level, it forms multiple smaller swings, reflecting internal market structure. In contrast, the order block itself remains unbroken, acting as a key external swing high.
Following the liquidity sweep at the lows, price begins to shift momentum and eventually breaks above this order block. This break is labelled as an eCHoCH (external Change of Character), indicating that a higher timeframe structural level has been challenged.
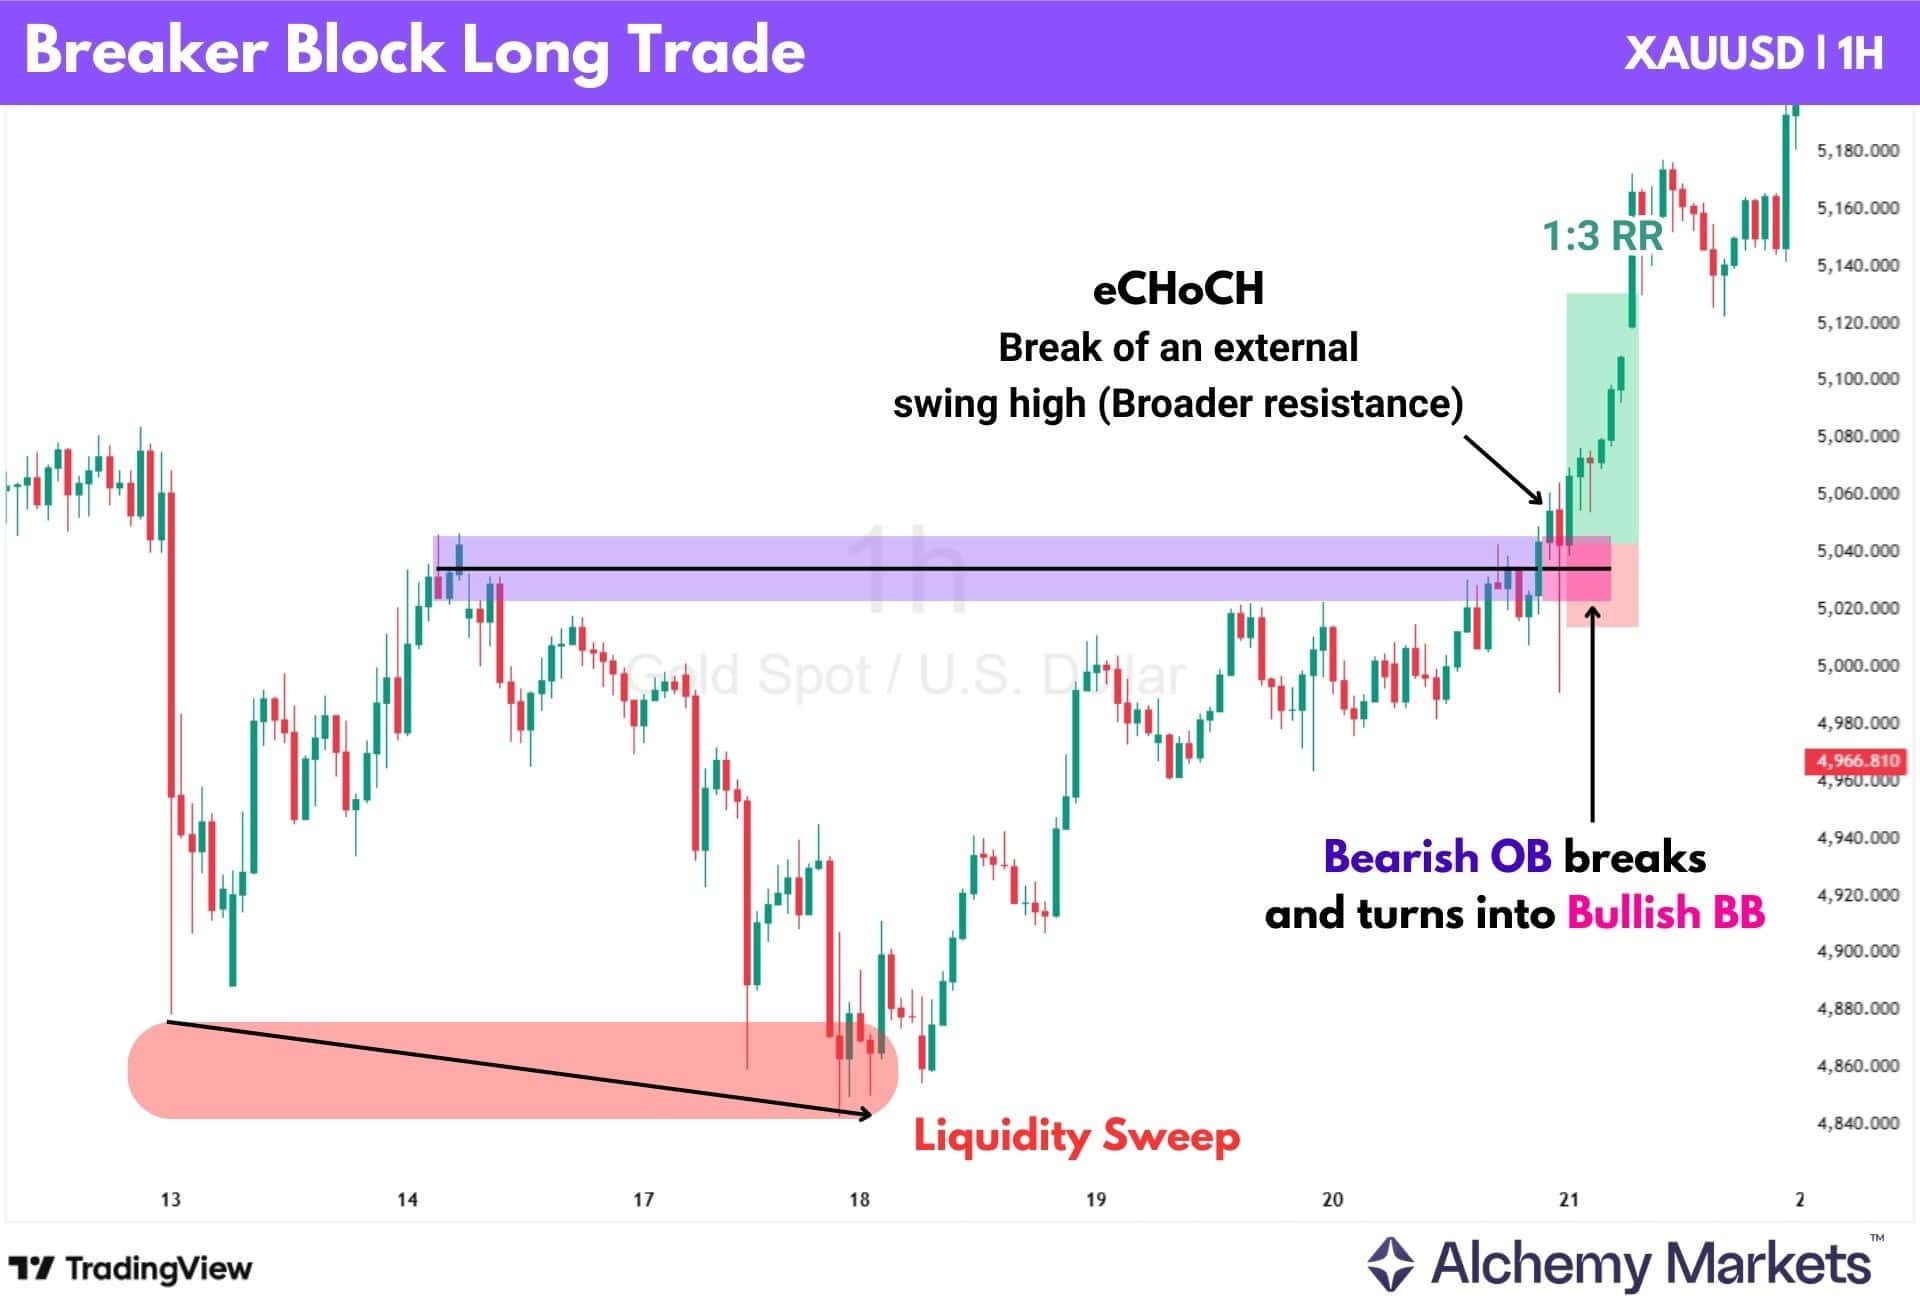
With the bearish order block now broken, it transitions into a bullish breaker block, forming the basis for a long setup.
On this chart, price immediately retests the breaker block and holds, providing a clear entry. From this signal alone, a long trade can be taken, which goes on to achieve a 1:3 risk-to-reward outcome.
What this highlights is how quickly breaker blocks can form and be traded. While some traders may hesitate to enter on a breakout near the top of a range, the breaker block provides clear structure for both stop loss placement and targets. Whether using fixed targets like 1:2 or 1:3, or aiming for the next major high, this allows traders to act decisively without second-guessing the setup.
Short Trade Example
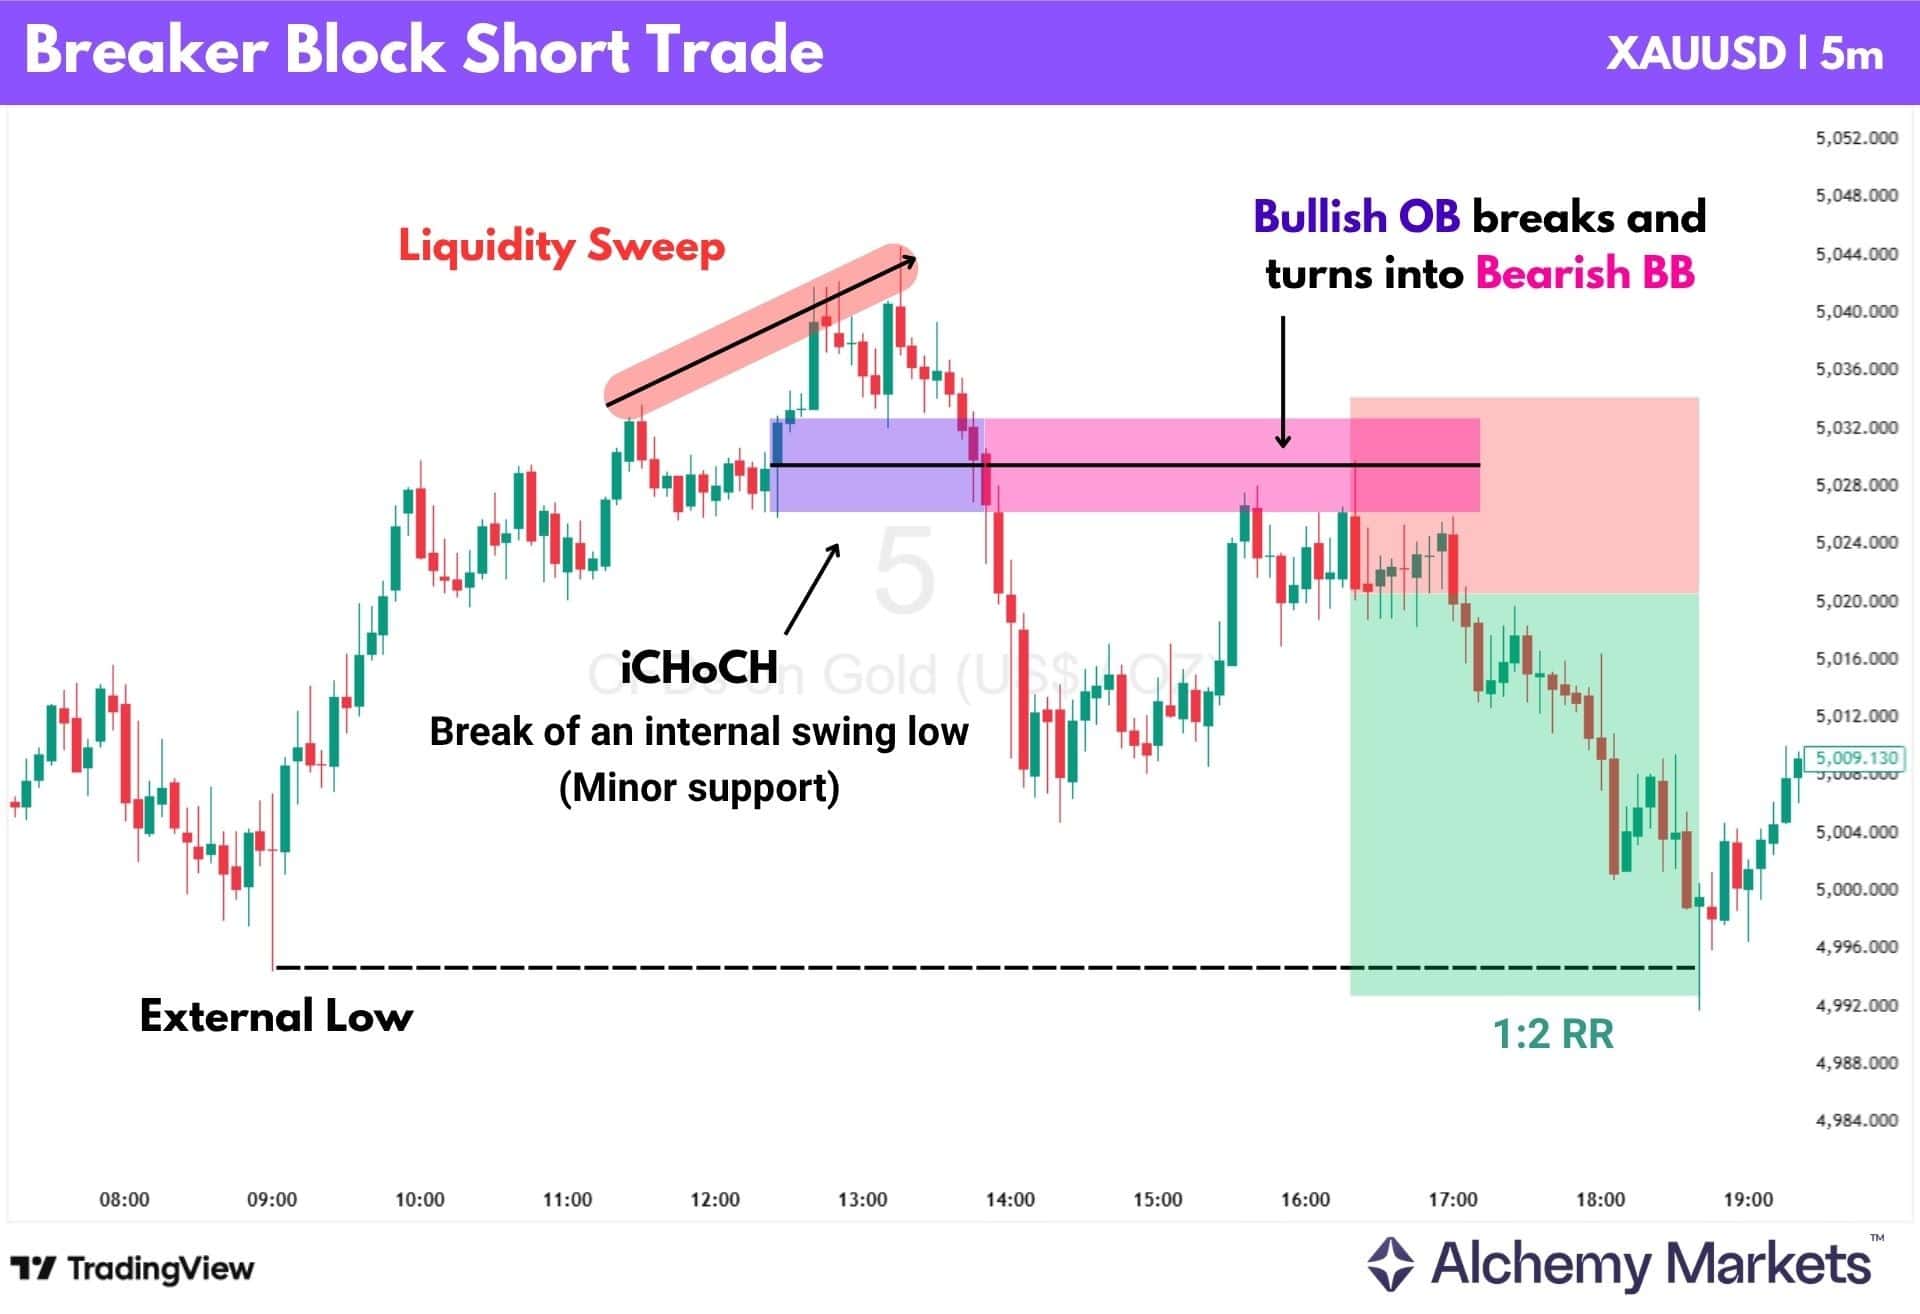
Here, we can see an external swing lowat the $4,994 area on Gold, which is 100 points away from the highs on this chart $5,044. Traders can trade a move from the highs to lows by spotting a smaller breaker block with an internal Change of Character (iCHoCH) or iMSS (Market Structure Shift).
The method of finding a bearish breaker block in this instance is the same:
- Locate a liquidity sweep (price forming a higher high).
- Locate a bullish order block that forms between the highs.
- Wait for a confirmed break of the block to identify a bearish breaker block.
- Trade the reaction.
Breaker Block Trading for Different Market Conditions
Breaker blocks do not behave the same way in every market environment.
Their reliability and how traders approach them often depends on the broader structure of the market.
To trade them effectively, it’s helpful to consider the context in which they appear. In particular, traders usually evaluate breaker blocks differently during trending markets, ranging markets, and periods of heightened volatility.
Trading Breaker Block in Trending Markets
Like all PD array concepts in SMC trading, breaker blocks tend to work best in trending markets, especially when they align with the prevailing direction.
An uptrend forms with higher lows (HL) and higher highs (HH), while a downtrend forms with lower highs (LH) and lower lows (LL).
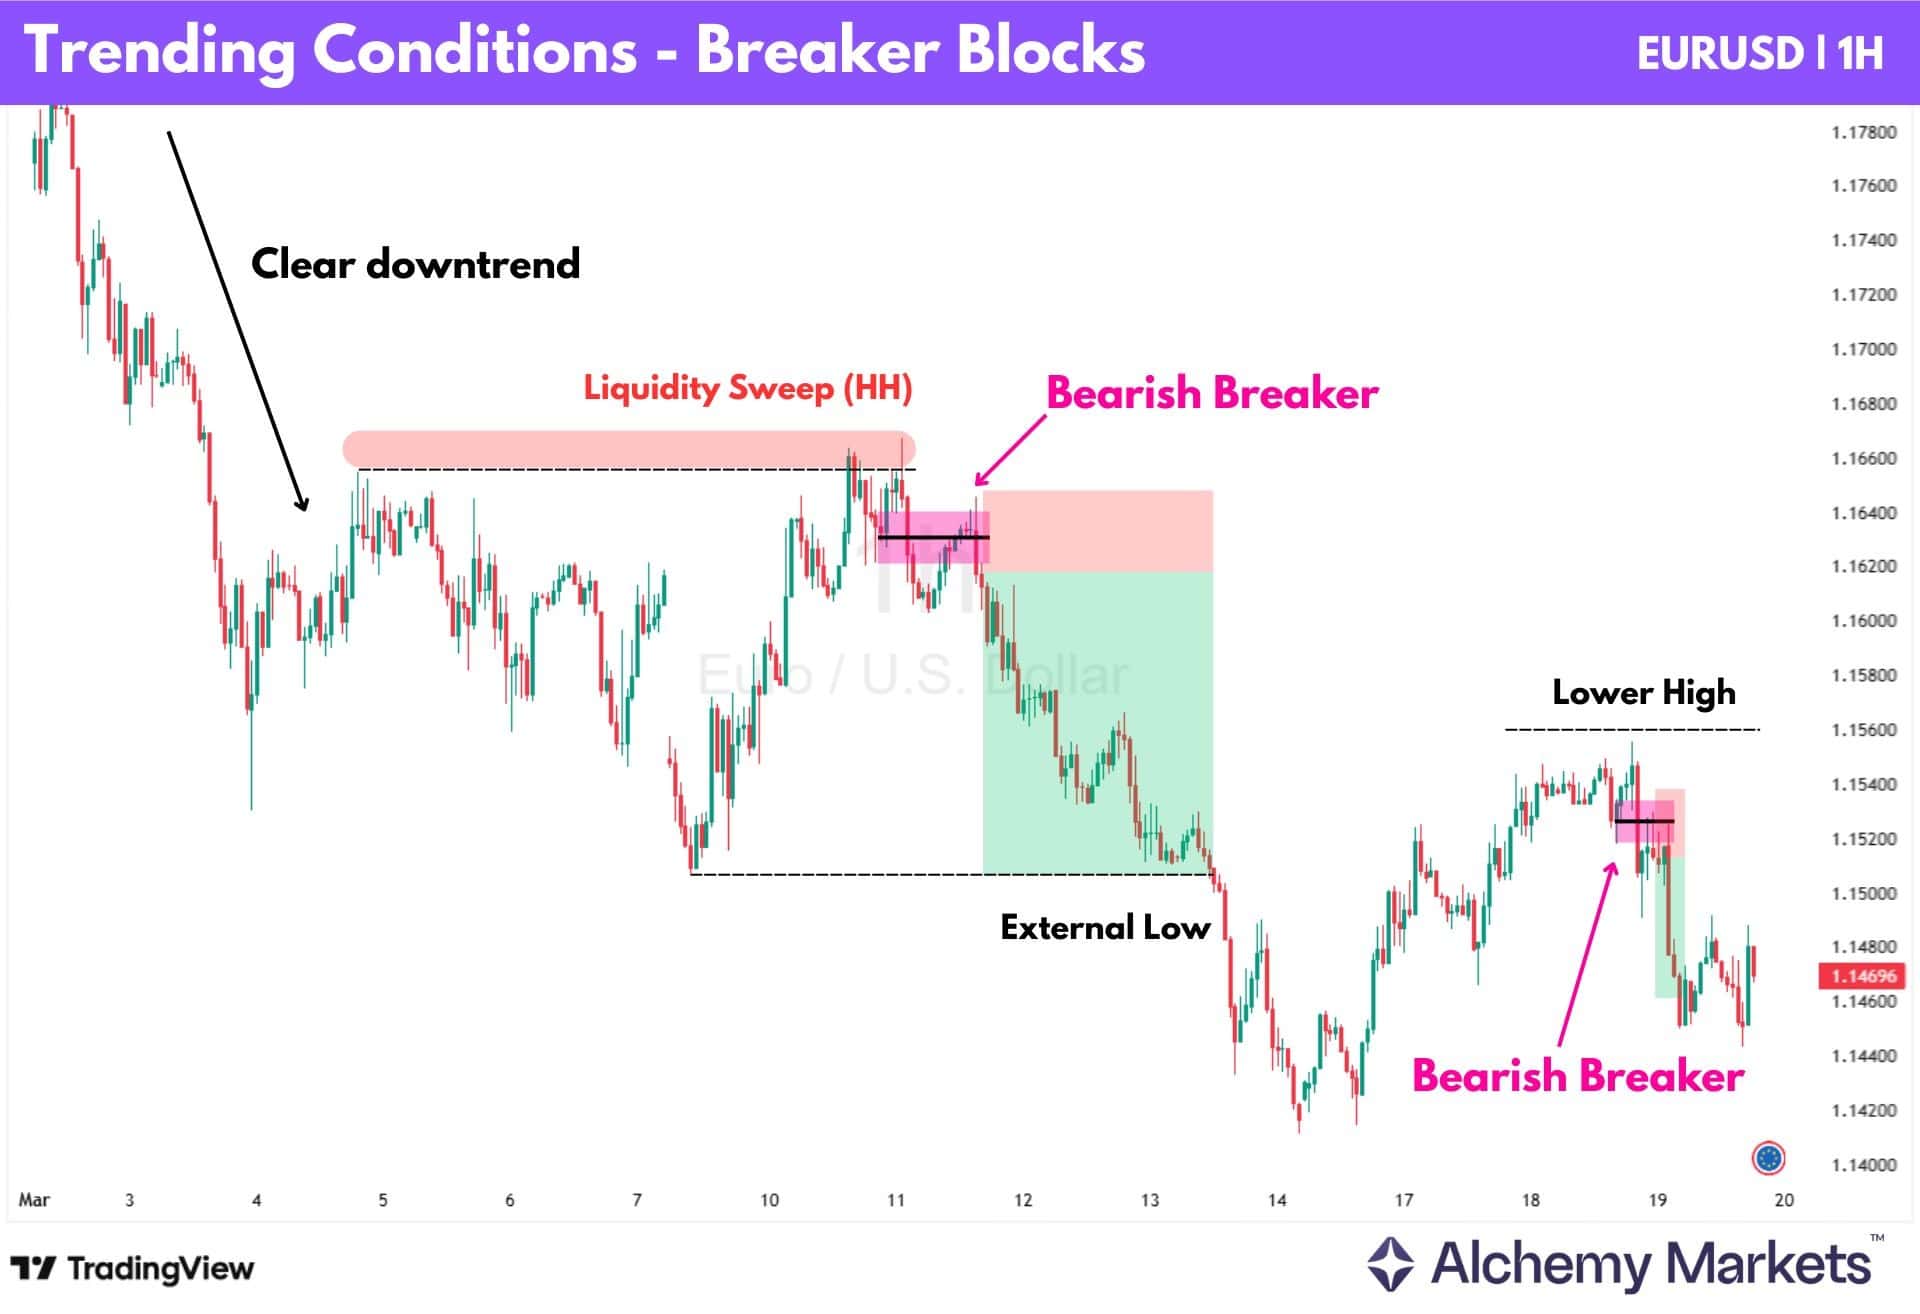
In the EURUSD example above, price is in a clear downtrend, as external highs remain unbroken while price continues to form lower lows. Even when price trades above a prior high, it is only a brief liquidity sweep, quickly rejecting and continuing lower.
This reinforces bearish control and confirms the trend remains intact. This is where breaker blocks become more reliable.
After the liquidity sweep, price breaks lower and forms a bearish breaker block, which acts as resistance on the pullback. As the trend develops, new bearish breakers continue to form near external highs, providing consistent short opportunities.
Breaker blocks work best when they align with confirmed structure, not against it.
Trading Breaker Block in Ranging Markets
In ranging markets, order blocks can be used to define the boundaries of the range, often more effectively than simple horizontal levels.
But first, what defines a range?
- At least two rejections around the same high
- At least two rejections around the same low
- Price fails to break out and instead rotates between both sides
Within this environment, price typically moves between the range high and range low. Traders can look for opportunities at the extremes, longing from the lows and shorting from the highs, targeting the opposite side.
Due to its sideways nature, ranging markets are primarily traded by order blocks. These zones clearly highlight respected support and resistance, making them ideal for trading sideways conditions. Breaker blocks, however, become useful when the range begins to break.
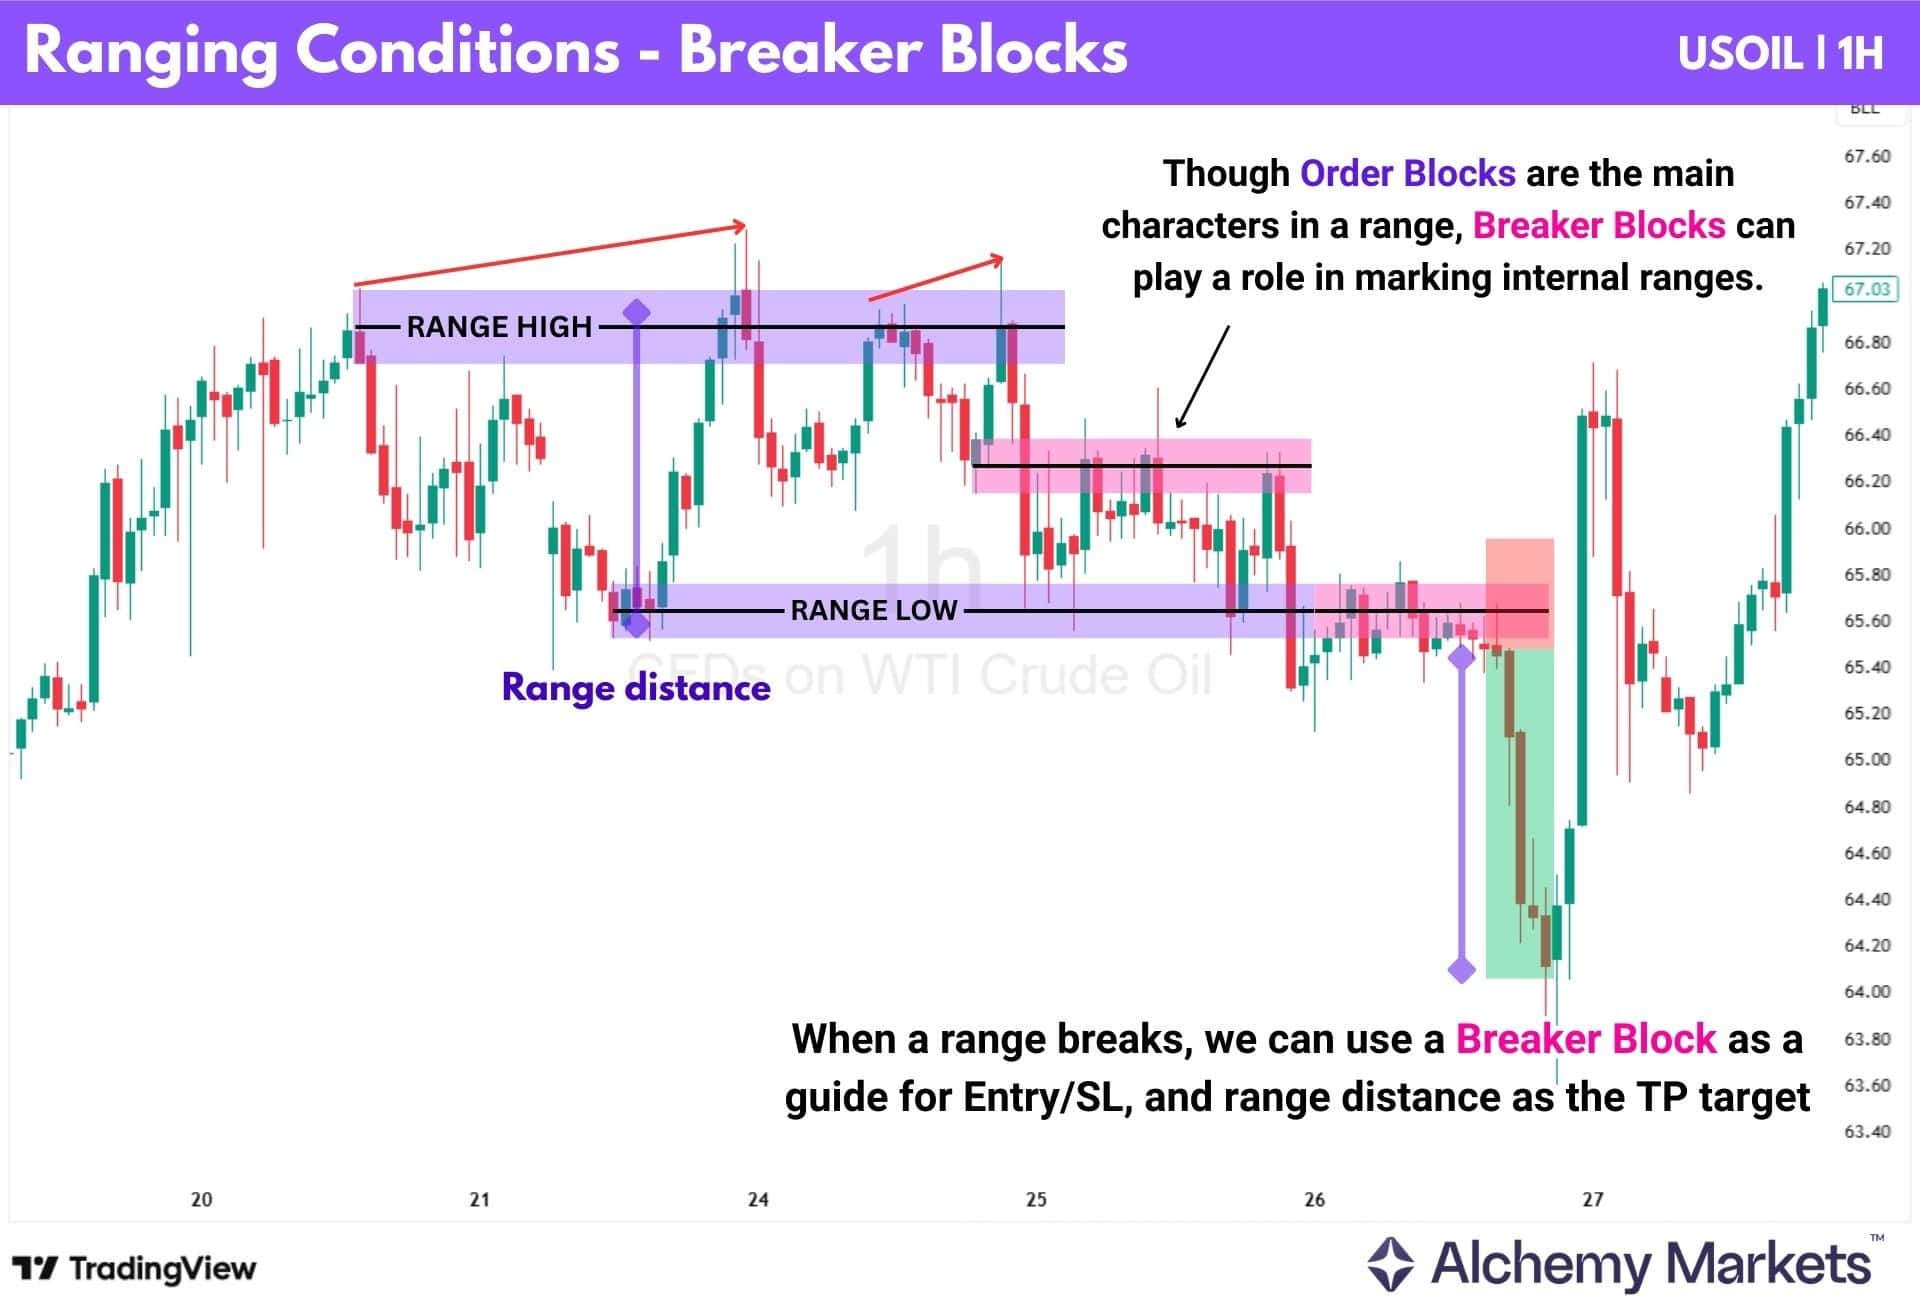
When price sweeps either the range high or range low, then makes a strong move in the opposite direction and breaks the other side, the breaker block in this context signals a breakout with institutional activity (higher reliability).
You can see this play out in the USOIL 1H chart above.
While breaker blocks are more suited for trading range breakouts, they can also form within the range itself. These create what’s known as internal ranges; smaller structures inside the broader range.
As shown in the chart, these internal breaker blocks can act as temporary support or resistance, offering additional opportunities if price rotates back into them.
Trading Breaker Block During Volatility
This is where we’ll deviate from other educational sources on Breaker Blocks, and say that volatile conditions actually aren’t good for trading breaker blocks. In fact, high volatility can significantly reduce the reliability of breaker blocks and other PD array concepts.
Turn your eyes to this Copper 4H chart below:
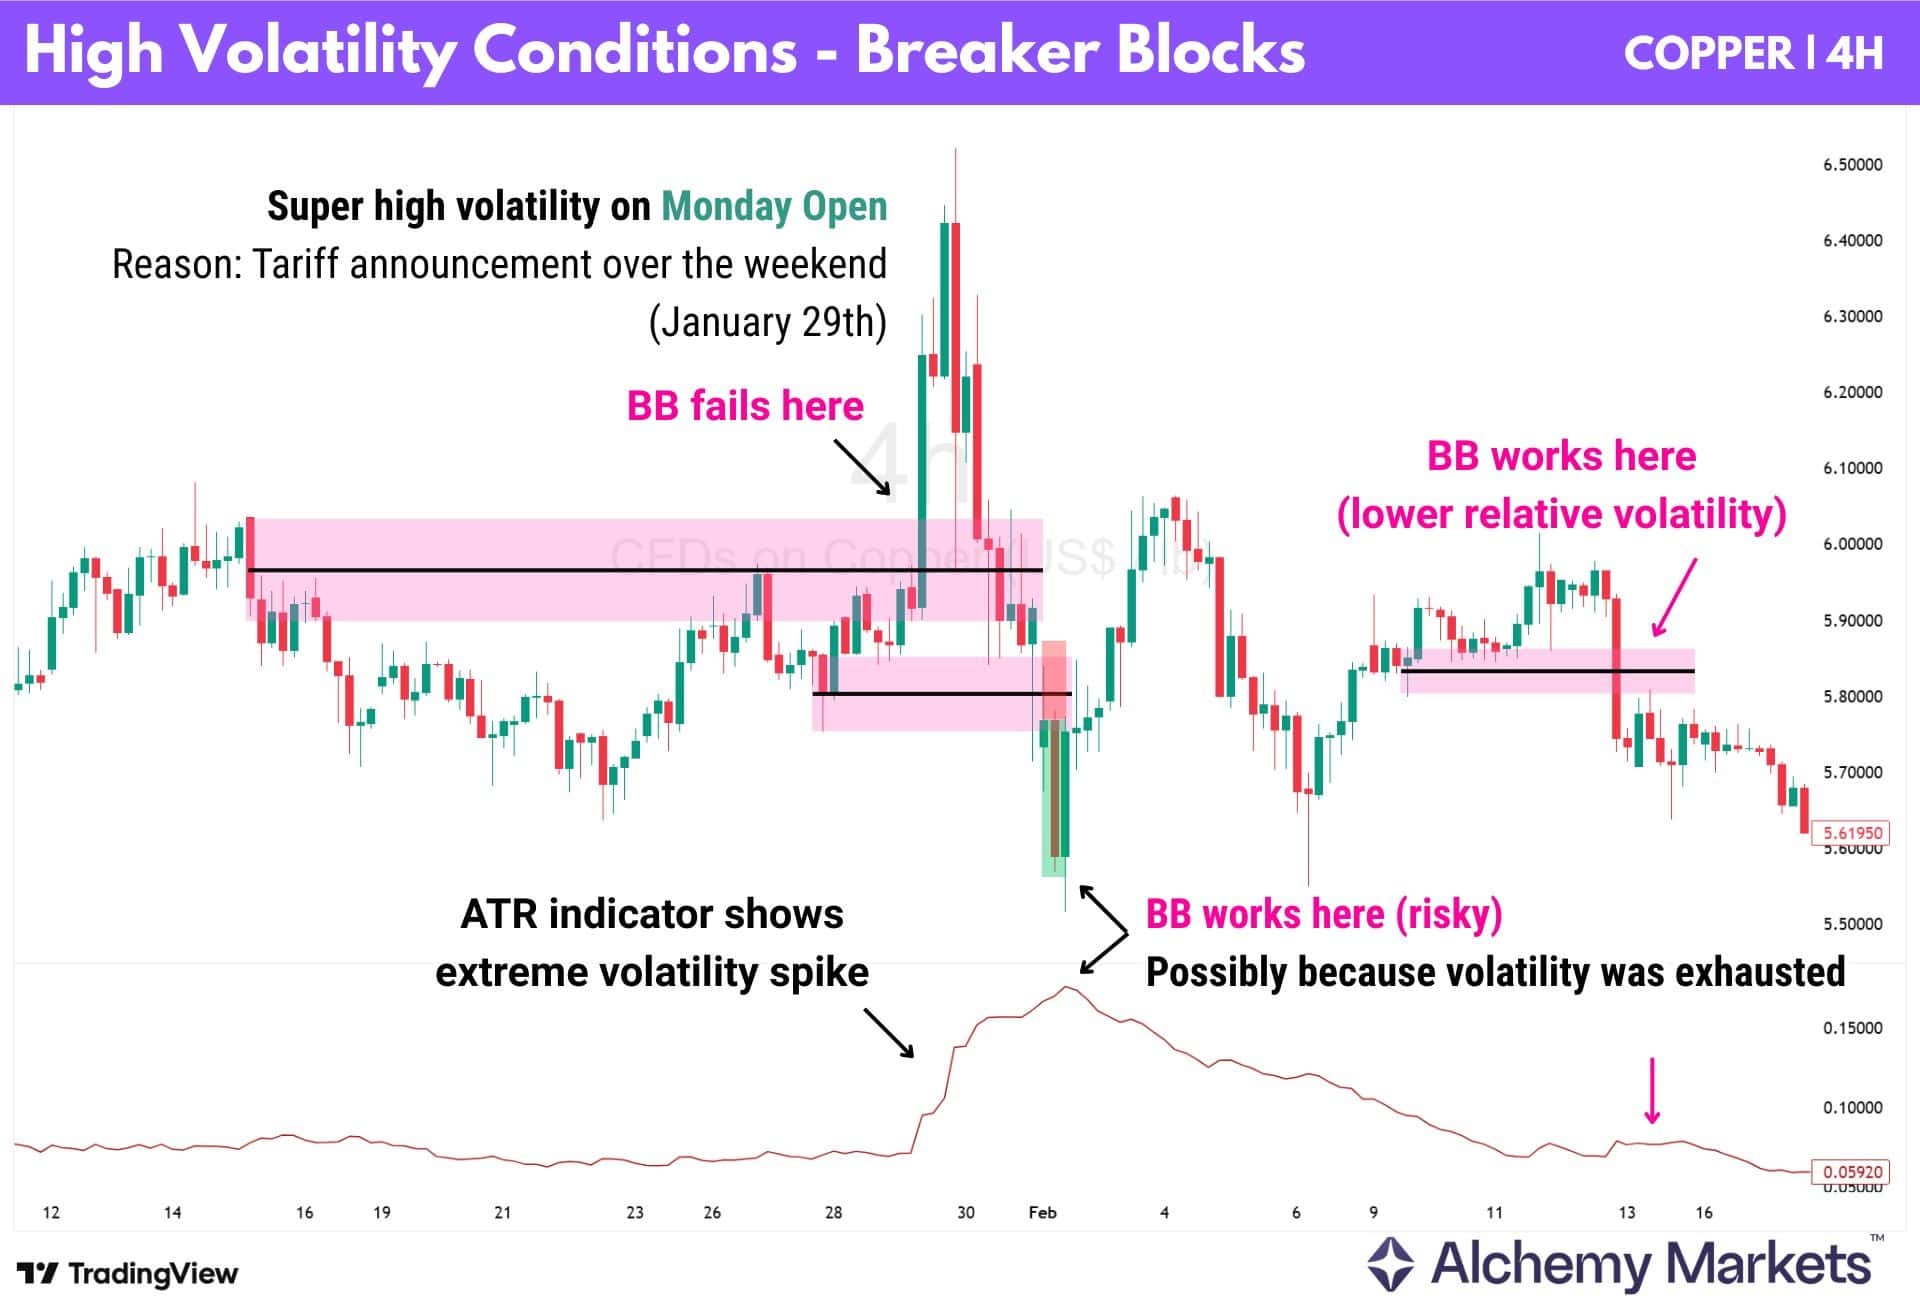
| Note: Here, the ATR is used to highlight the volatility spike. Though, volatility can also be identified visually through the unusually large candlesticks alone. Indicators serve as additional confirmation. |
Following a weekend announcement of new tariffs on China, a major global consumer of copper, the market opened on Monday with extreme volatility. The reaction was violent and immediate.
In this type of environment, price is not reacting to technical levels in a controlled manner. Instead, it is adjusting to new information that was not previously priced in. Notice how despite a powerful breakout from the lows, the bullish breaker was immediately sliced through as buyers and sellers readjusted their positions to the new development.
As a result, zones that would normally act as support or resistance can fail quickly, even when the structure itself looks valid.
Another example is the S&P 500 in Q4 2025. Take a look at this daily timeframe chart of SPX:
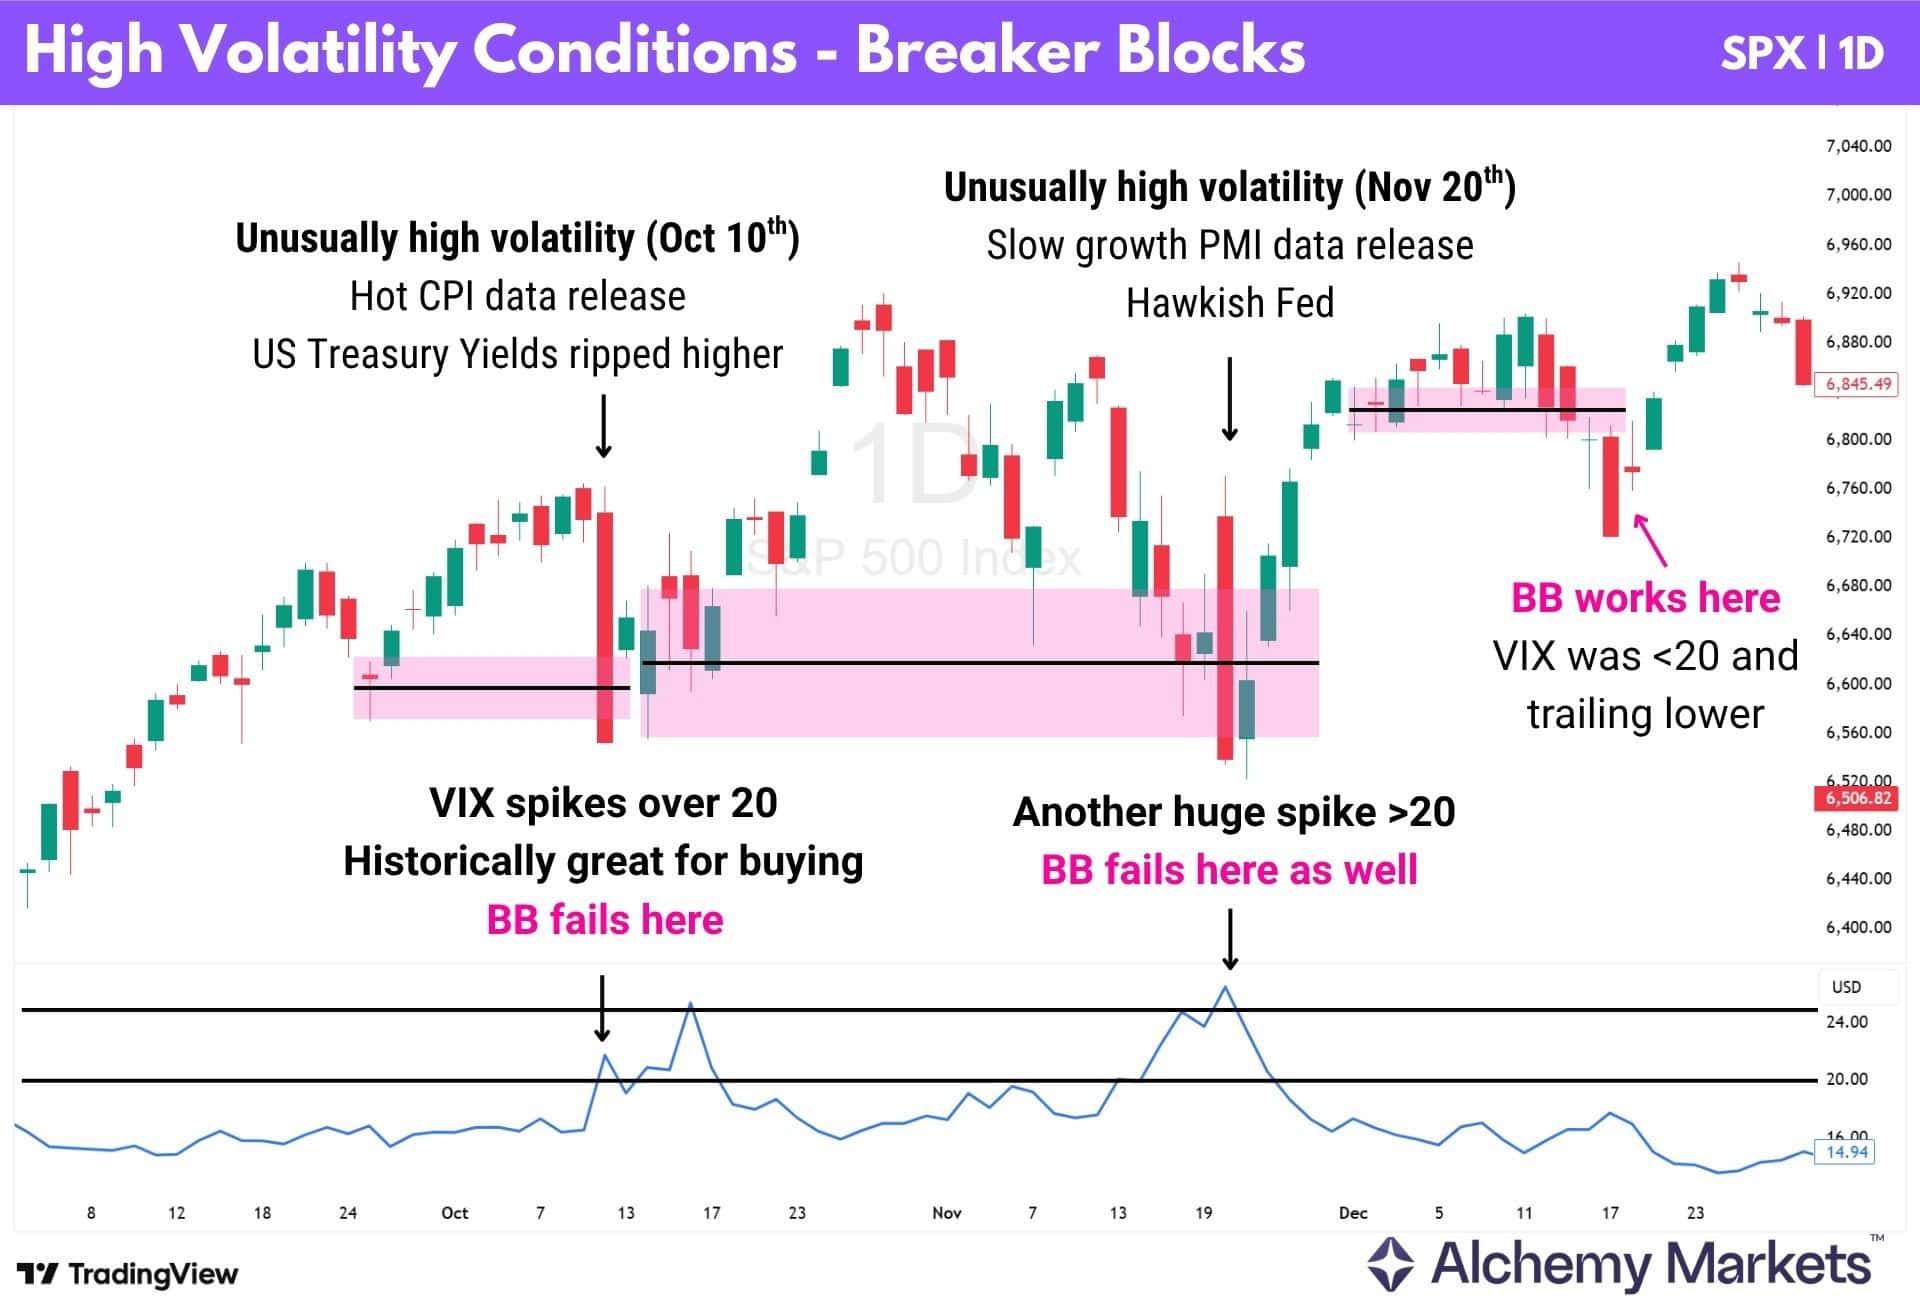
| Note: Here, the VIX is used as a measure of market volatility and risk sentiment. Spikes above 20 have historically coincided with periods of fear and, in many cases, buying opportunities in the S&P. |
Rather than a clean breaker block reaction, price often dropped sharply within a single session, sometimes sweeping higher first, only to form a breaker block that failed to hold as a point of reversal.
On October 10th, hotter-than-expected CPI data pushed US Treasury yields higher, triggering a spike in volatility across equities. Price reacted aggressively, with large impulsive candles, while the VIX moved above 20. A bearish breaker formed during this move, but failed to produce a continued downtrend.
A similar pattern occurred on November 20th, following weaker PMI data and a more hawkish Federal Reserve tone. Volatility expanded again (as per VIX), and yet, the bearish breaker failed to hold again.
These examples highlight the blind spot of breaker blocks during periods of high volatility. In both cases, the setup looked valid, but the price had already moved too far, too fast.
A breaker-only approach would have completely missed the context. The market was still repricing new information, and levels were not being respected in the usual way.
Seasonal Considerations
Another concept that affects how effective your breaker blocks can be, in terms of accuracy and meaningful movement, is “seasonality”. This refers to recurring patterns in market behaviour during specific times of the year, driven by shifts in liquidity, participation, and sentiment.
A useful way to think about this is in terms of liquidity regimes:
- High liquidity periods, such as earnings seasons or active market sessions, tend to support cleaner structure and more reliable reactions
- Low liquidity periods, such as holidays, tend to produce weaker follow-through or erratic price behaviour
For example, the S&P 500 has historically shown stronger performance between November and April, compared to the rest of the year, a pattern often summarised as “Sell in May and go away”.
According to the Stock Trader’s Almanac (CFRA Research), the S&P 500 has risen roughly 75–80% of the time during the Santa Claus rally period — the last five trading days of December and the first two of January — based on data since 1950.
PD arrays such as breaker blocks, tend to perform best in moderate to high liquidity conditions, where price can retrace and react in a controlled manner. In low liquidity environments, prices may either lack the strength to move meaningfully, or shift quickly due to thinner order books, creating unpredictability.
The key takeaway is that breaker blocks do not operate in isolation. Their effectiveness depends not just on structure, but on the surrounding liquidity and seasonal conditions.
Breaker Block Advantages
Breaker blocks are an extension of order block logic, so many of their strengths overlap.
Since they originate from failed order blocks, they still represent areas where institutional positioning previously occurred.
- Breaker blocks highlight clear support and resistance flips.
When an order block fails and price breaks through it, the same zone often acts as a reaction level on a retest.
- They also help structure trades more clearly.
The zone provides a defined entry area, especially when using CE, while the opposite edge can act as a logical stop loss. This creates a more structured risk framework.
- Breaker blocks can also be combined with other SMC tools…
Such as fair value gaps or market structure shifts. When aligned with broader context, their probability of holding improves.
Breaker Block Disadvantages
In the same token, breakers share many limitations with order blocks, as they are based on the same idea of institutional support and resistance zones.
- One issue is that they can create too many signals.
It can become somewhat of an intuitive or subjective practice to mark out where previous order blocks are; especially if you don’t set additional filter rules. This is why we use the 4-candlestick rule for order blocks and breakers.
- They are also susceptible to liquidity sweeps.
Price may push beyond the block to trigger stops before reversing, creating false entries.
- Breaker blocks can become unreliable in choppy or news-driven conditions.
When price moves aggressively in both directions, particularly during major economic or geopolitical events, structural levels such as breaker blocks, order blocks, and fair value gaps are less likely to hold.
Breaker Block Trading Strategies
Many traders also combine breaker blocks with other technical tools to strengthen their trade ideas. In this section, we will explore several ways traders incorporate breaker blocks into their trading strategies.
Price Action at Breaker Block
A common question traders ask is: What actually confirms a breaker block reaction?
Here are some key reactions to key an eye out for:
| Key price action scenarios to watch | |
 | CE Rejection The candle forms a strong wick at the midpoint of the breaker block, indicating strong participation from market participants to defend the CE. The color of the candle doesn’t matter as much, though an alignment with the block makes it more convicted – e.g. a bearish breaker block creates a red candle. What matters more is a strong wick or a large-bodied candle that tests the CE but fails to break. Closes outside of the BB are stronger indicators of a rejection. |
 | Failure to Close Beyond Block Another scenario occurs when price moves deeper into the breaker block but ultimately closes back below the CE, or outside the zone in the block’s biased direction. Note that the close below the midpoint does not have to be a clean wick, where the body’s open is right below the CE. Nothing in trading ever happens perfectly. The key attribute here is that price action has demonstrated an attempt to break the block, but ultimately fails. |
 | Liquidity Sweep This is often the most frustrating for most traders. Sometimes, price can push beyond a breaker, and even create multiple closes — creating an illusion of a true break. In such instances, traders may have been enticed into a trade, only for the price to respect the breaker and close outside the block once again in its intended direction. When this occurs, traders can consider taking a breaker block trade, though it can be risky depending on the cause of the volatile move (see: “Trading Breaker Block During Volatility”). Trading this setup is somewhat risky, and requires experience and context. |
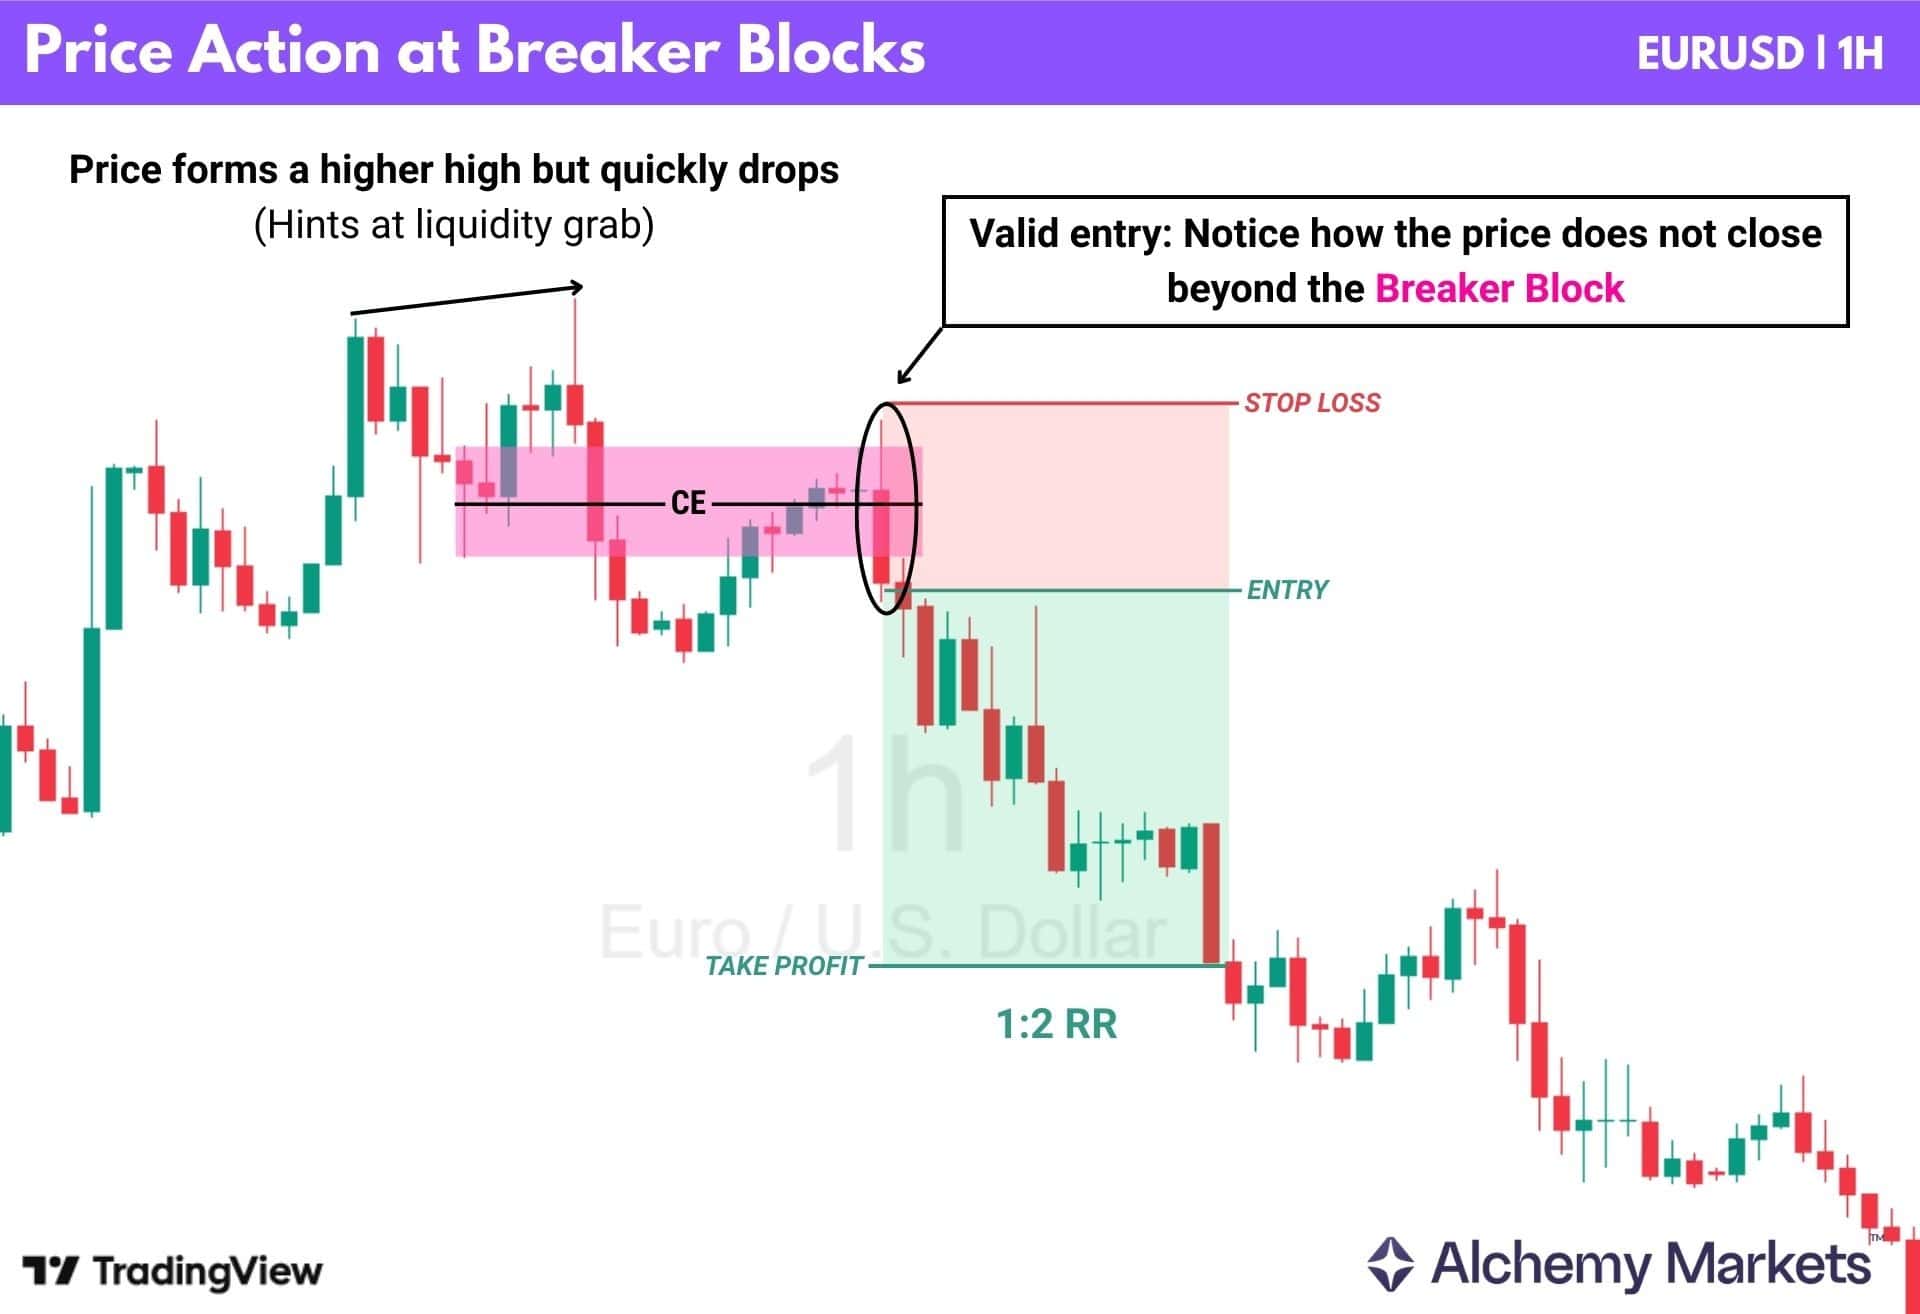
In the EURUSD chart above, the first breaker block shows why not every reaction at the CE should be treated equally.
Price briefly touches the CE and closes back below it, technically respecting the bearish breaker block, but the reaction candle is small and lacks both a strong body and a meaningful wick. As such, the price is still able to trail higher afterward. The clearer rejection appears later; when a large bearish candle closes back below the breaker block, signalling that sellers have regained control of the market.
The second breaker also highlights how confirmation can build through multiple reactions around the BB and CE:
- Price first pushes into the CE with a bullish candle that leaves a small wick. On its own, this reaction does not strongly confirm the breaker block.
- The next candle forms a large bearish body that closes below the breaker block, showing that the attempt to move above the CE has failed. This alone can be an entry signal.
- As price moves lower, a sudden surge of buyers pushes the price back into the BB. This retests the zone and forms a wick above the CE before closing back below it, reinforcing that the level is still being rejected.
- This third test produced a rejection with a large wick, which acts as another confirmation factor and entry signal.
Together, these reactions show how price repeatedly fails to accept the CE, strengthening the bearish breaker block bias.
Fibonacci Tool
Whenever there’s a CHoCH, you can use the Fibonacci retracement tool to draw from:
- Swing Low to Swing High if it’s a price swing that produces a bullish CHoCH
- Swing High to Swing Low if it produced a bearish CHoCH
This will give you several levels to watch such as 23.6%, 38.2%, 50%, 61.8%, 78.6%. These are estimated levels for where price may first return to, before continuing in the direction of the initial CHoCH.
However, one major issue many beginners struggle with is — Just which fib level should I trade? There are so many.
Most Fibonacci traders focus mainly on the 50%, 61.8%, and 78.6% retracement levels, since the 23.6% and 38.2% pullbacks tend to occur only during extremely strong momentum moves. By identifying a breaker block that aligns with one of these key levels, it helps narrow the potential reaction zones to just a few high-probability areas.
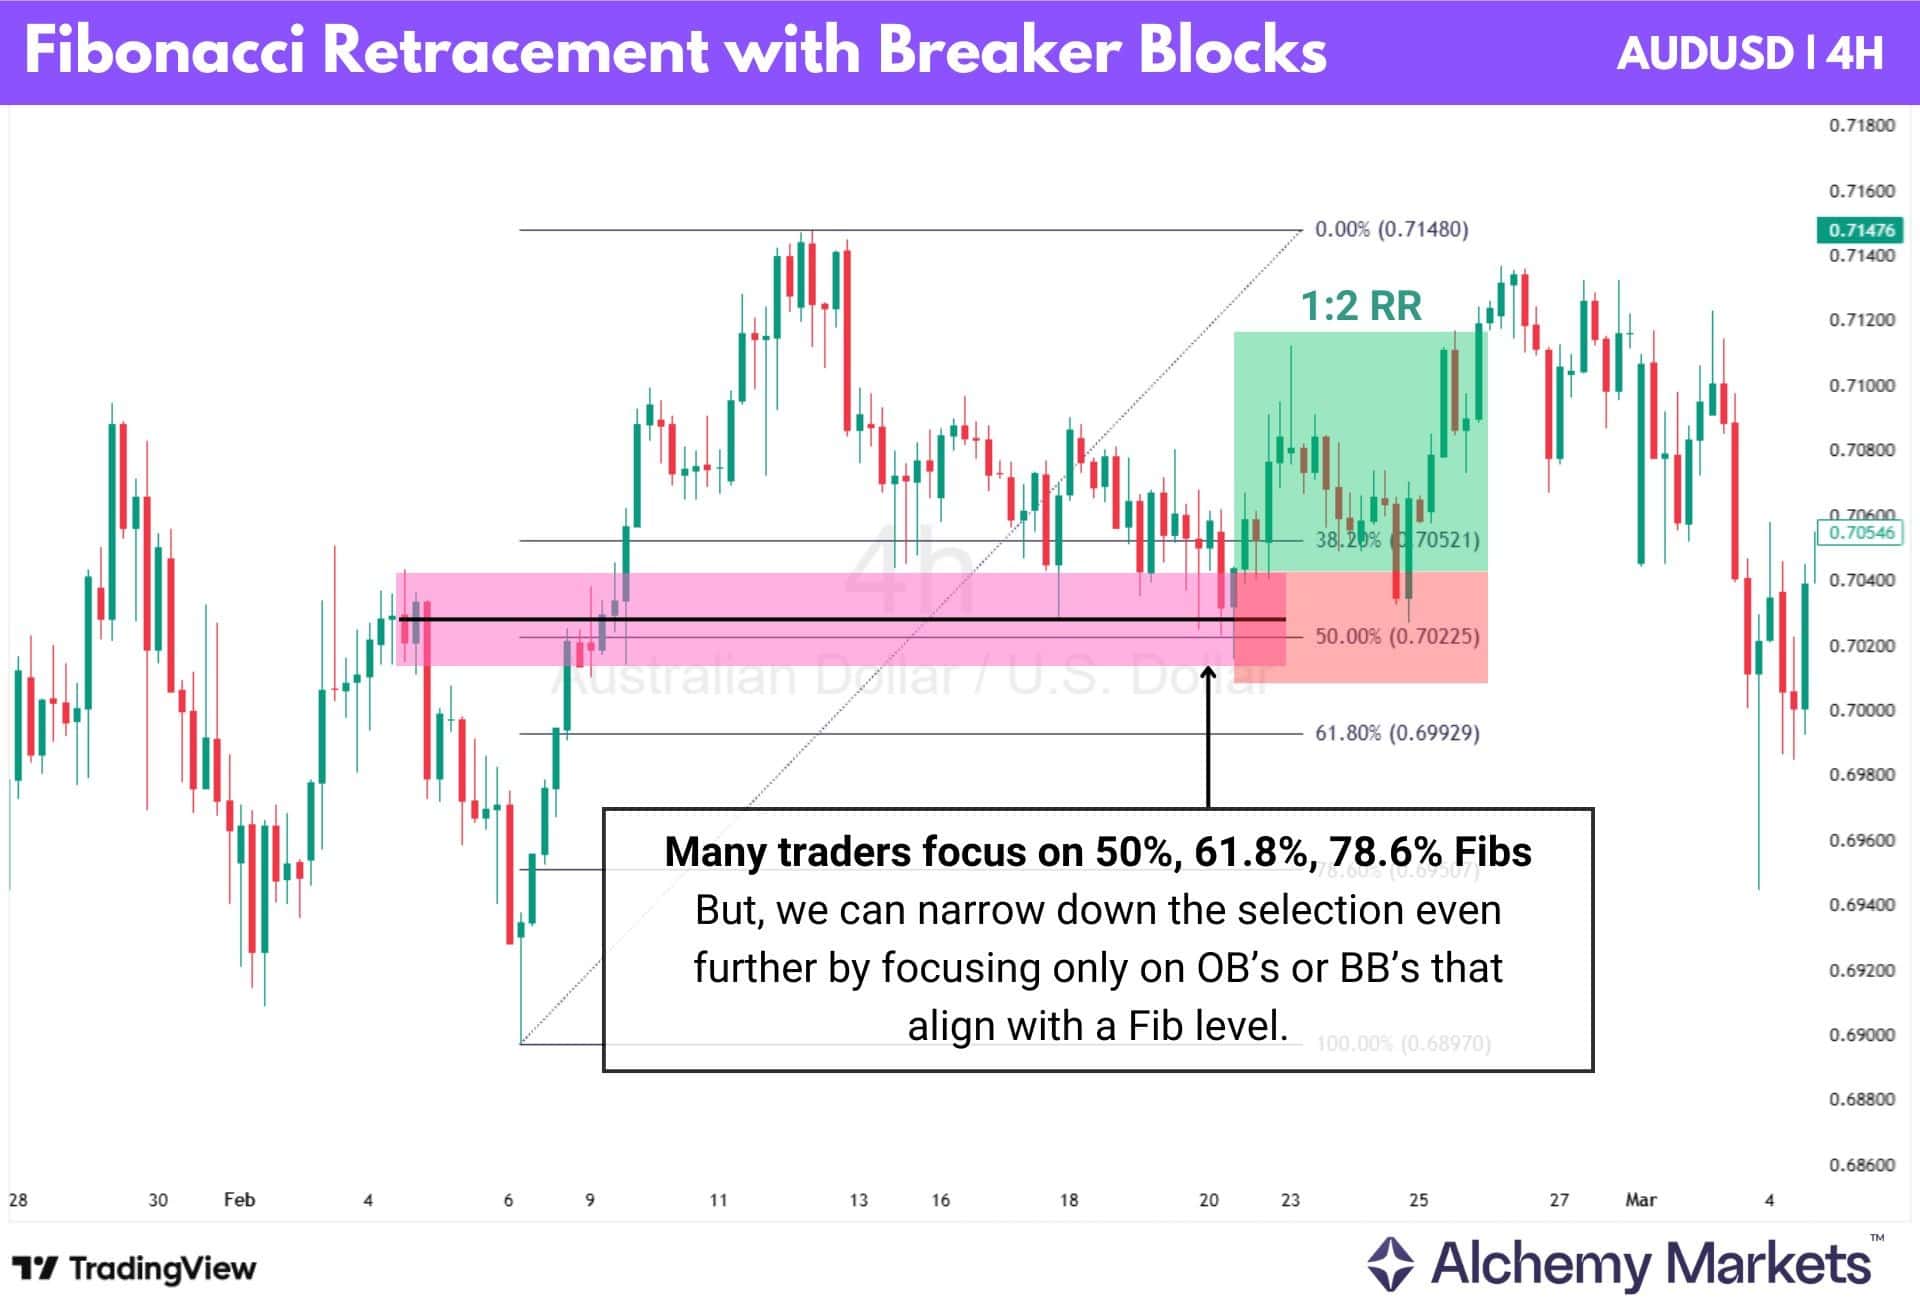
In the Aussie-Dollar chart above, the FX currency pair retraces toward the 50% Fibonacci level, where a breaker block is already present. This confluence helps remove uncertainty for where to look for a trade entry.
Traders may then apply the typical breaker block entry rules, such as waiting for a test of the CE or a rejection within the zone, before targeting a move back toward the prior high or the 0% Fibonacci level.
Alternatively, using a 1:2 Risk-to-Reward (RR) take profit keeps your trade conservative, which helps you avoid situations where the price does not reach its usual target like shown above.
Market Structure Shift (MSS)
Market structure shift, or MSS, is another terminology used to describe a Change of Character (CHoCH). It denotes the moment where the price closes breaks a swing high or low which goes against the trend.
So for example, in an uptrend, you expect to see only Higher Highs (HH) and Higher Lows (HL). MSS here would mean the higher low is now broken – and a lower low is created.
This is often the first sign of a possible trend shift; not to be confused with SMS (Shift of Market Structure), which is a confirmed trend shift denoted by a CHoCH, followed by a BoS.
When trading breakers, it’s actually best (in this editor’s opinion) to trade iCHoCH or iMSS, because they strike a good balance between early signals and reliability.
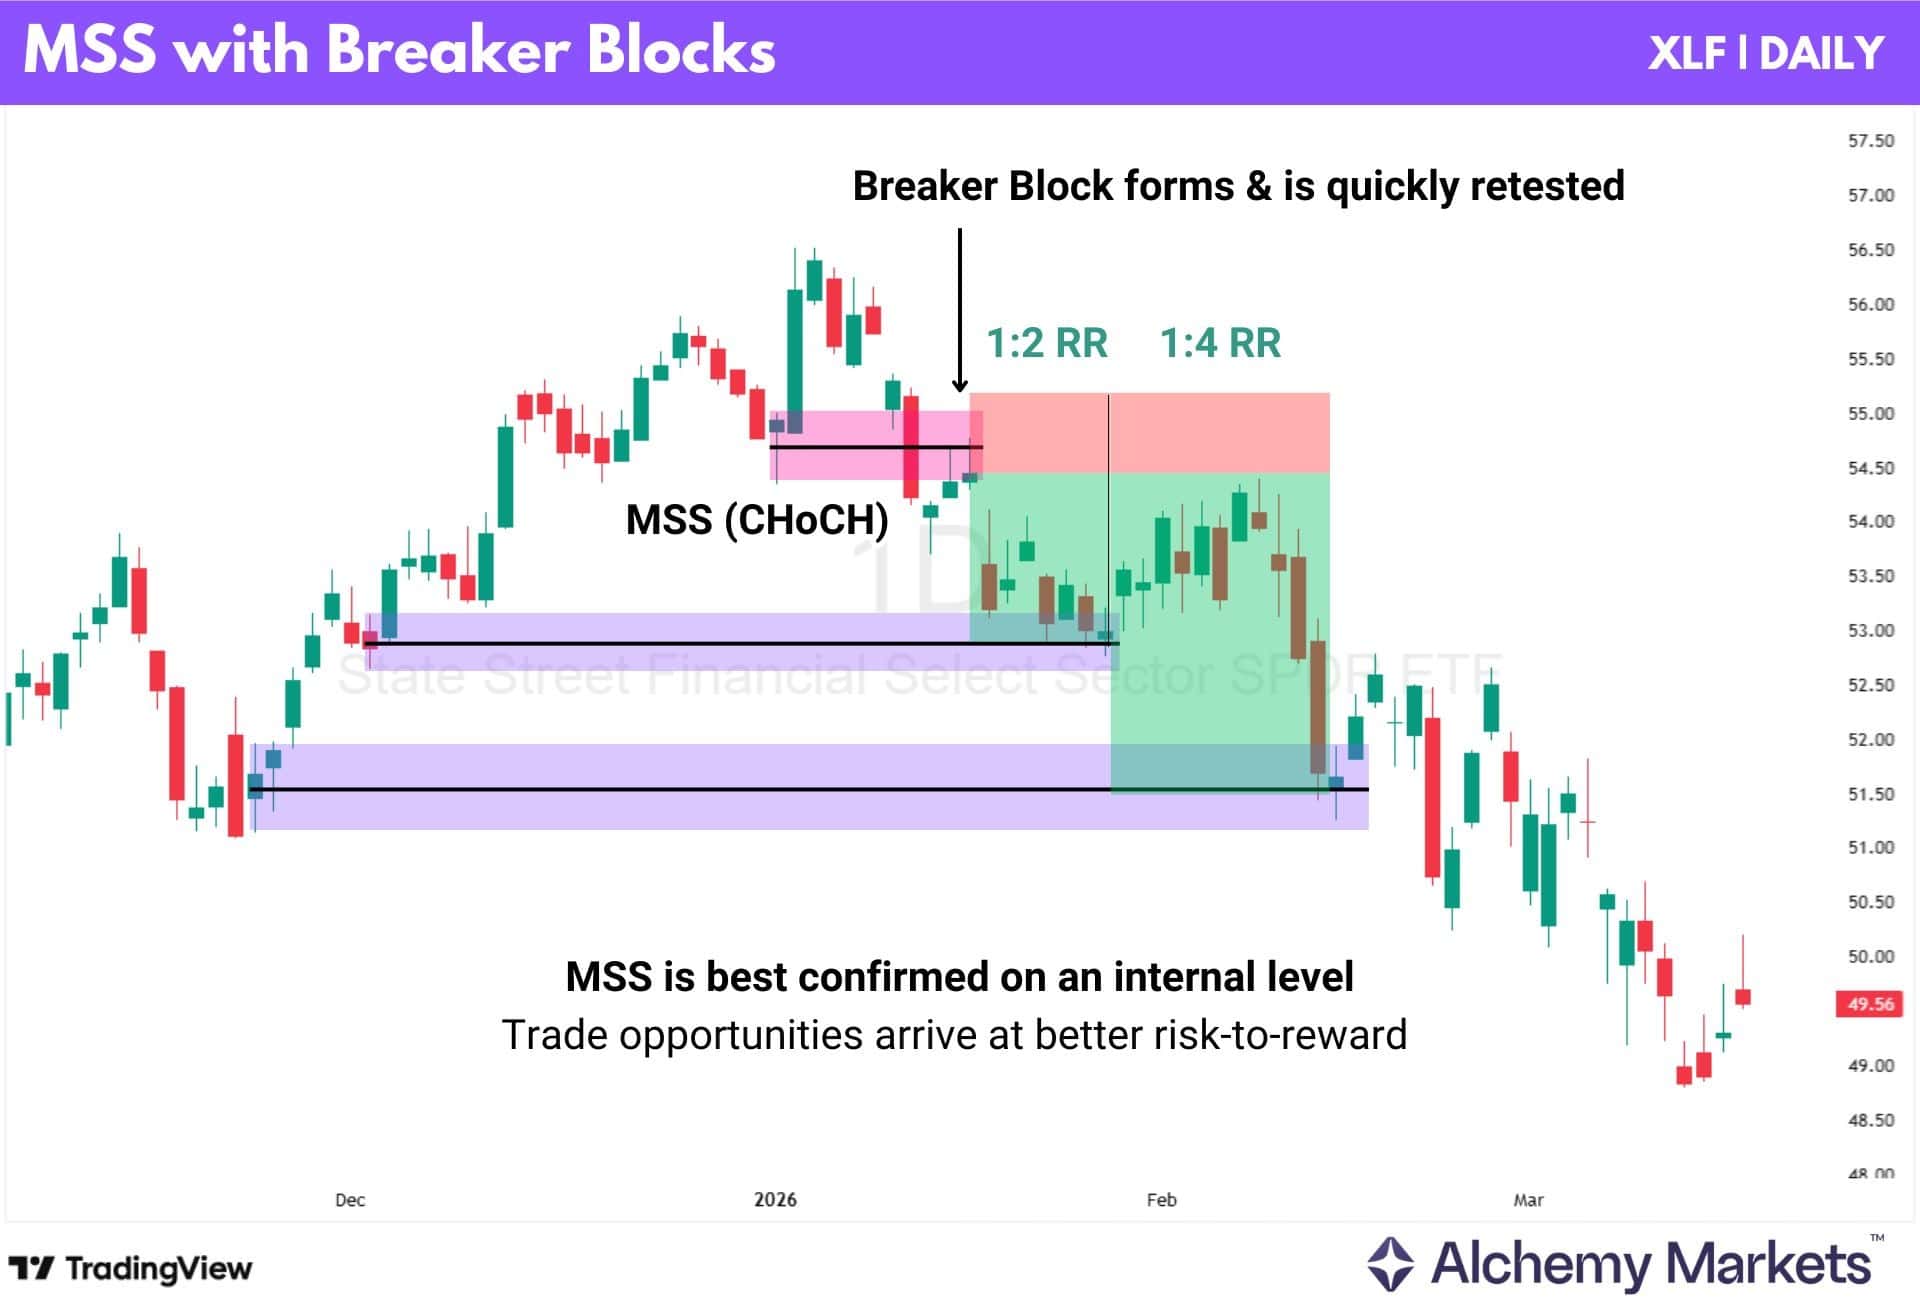
In the chart above, the XLF ETF creates a higher high, then cleanly breaks it and retests the breaker block. Upon creating a rejection candle at the CE, traders can already consider a trade.
Then, take profits can be set to 1:2 or 1:3 (or even longer), or towards previous supportive structures like bullish order blocks.
Notice how the lowest purple block (Order block) actually turns into a breaker block later on; but the price does not initially respect the BB upon creation. Instead, its liquidity sweeps higher before finally following the bias of the block — see “Price Action at Breaker Block”.
This highlights how trading BB’s created by broader MSS carry some risk, especially when going short, because you’re likely trading against historical support in a market that’s macro-uptrend.
Most assets are macro-uptrend because inflation has just historically gotten worse.
Nested Breaker Block
A nested breaker block refers to a BB that occurs within a larger PD array, or another breaker on a higher timeframe. Here, we have an example on GBPUSD using the daily timeframe and 2H timeframe.
The daily timeframe illustrates the HTF (high timeframe) breaker, while the lower timeframe (LTF) is used for finding smaller breaker blocks to help confirm the HTF signal.
This method can help traders time their entries for larger HTF breakers or pd arrays, which can appear as a rather large zone. By aligning LTF signals with the HTF block, one could find more reliable setups.
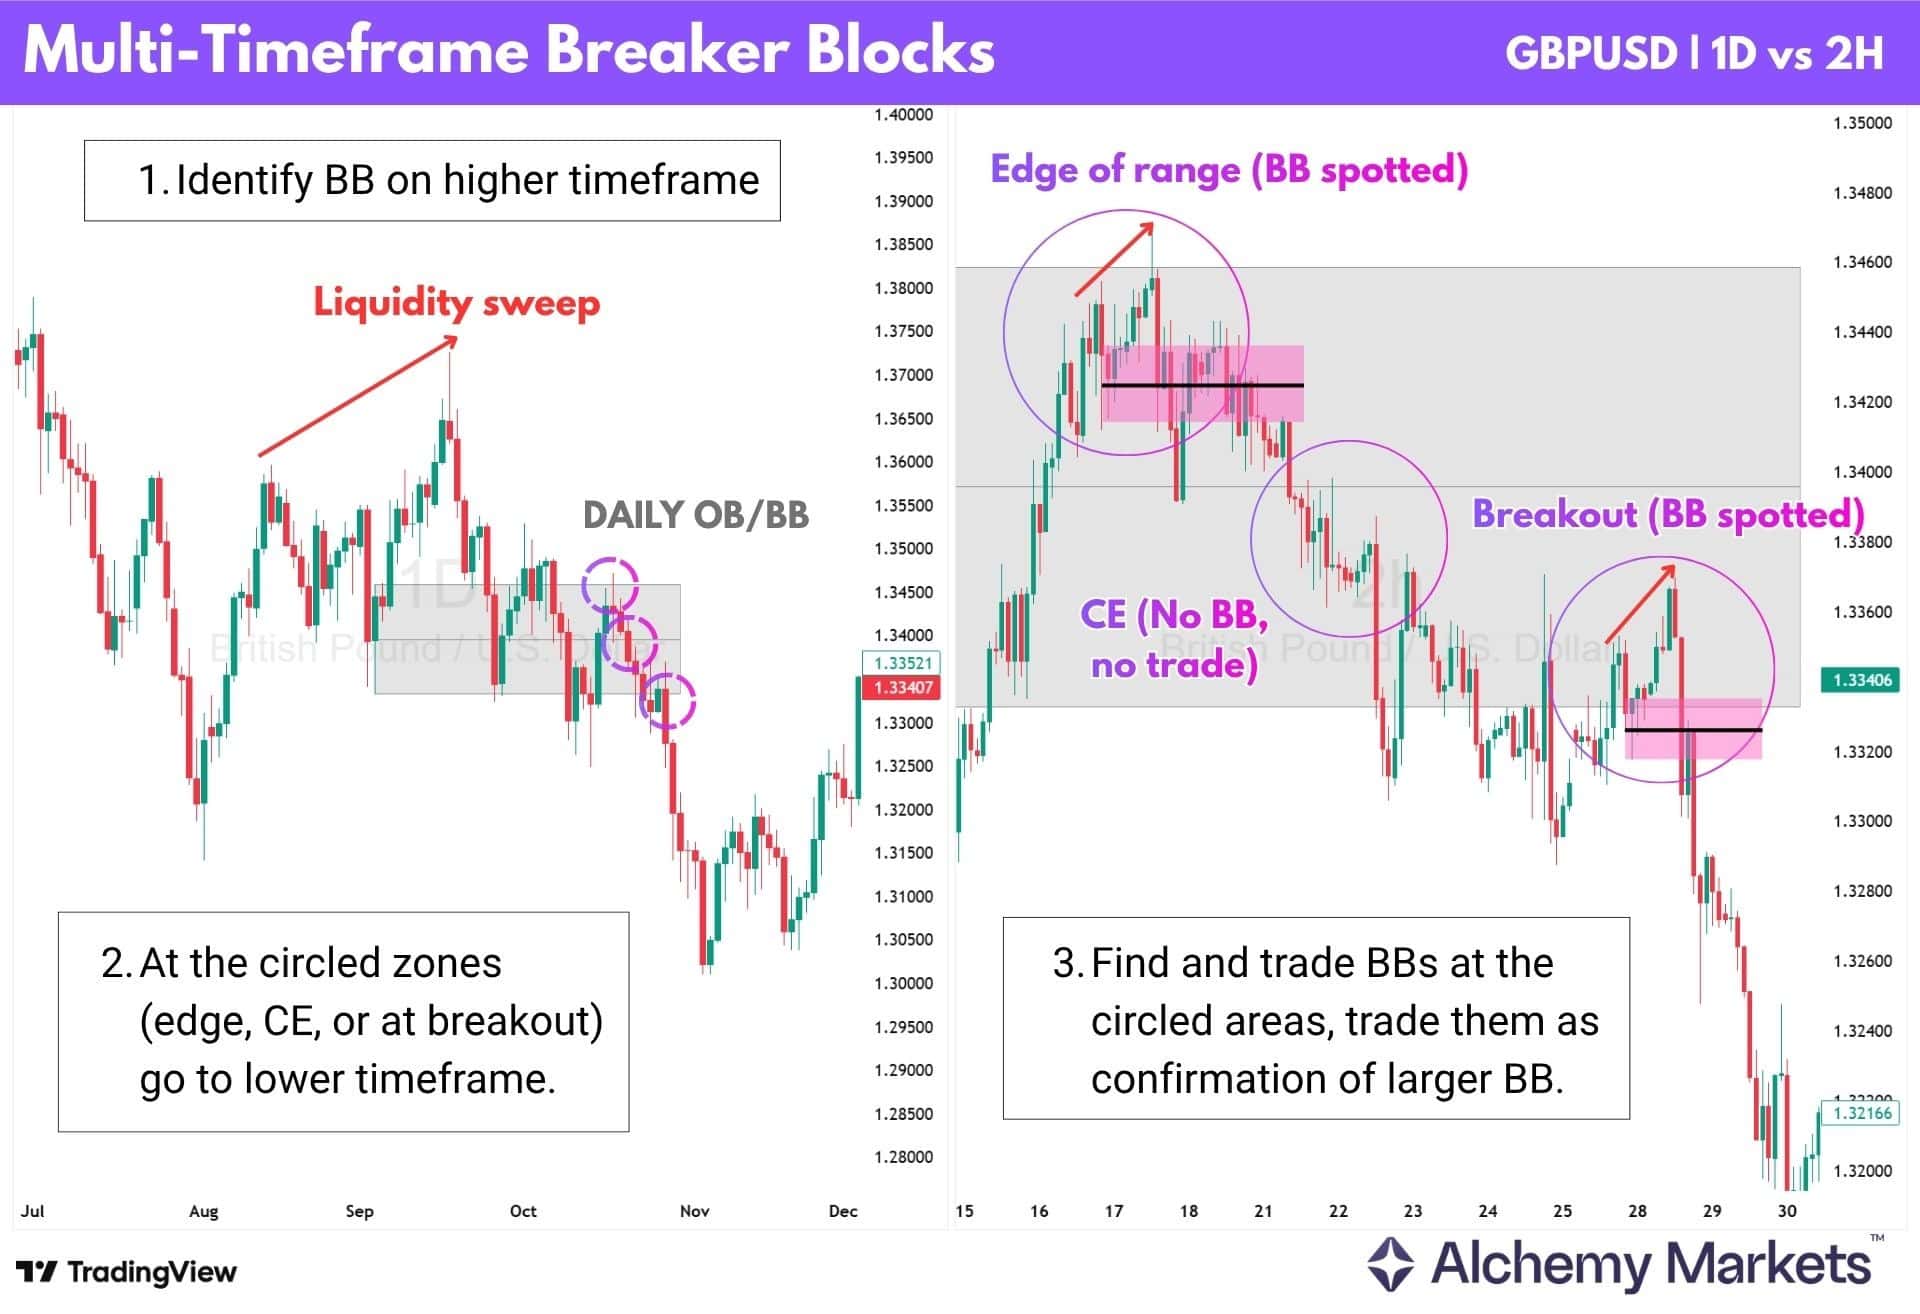
Observe the chart above. We begin by identifying a higher timeframe (HTF) order block that transitions into a breaker block. From there, we drop to a lower timeframe (LTF) to look for smaller breaker blocks that help confirm the setup.
There are three key areas to focus on: the edge of range, the consequent encroachment (CE), and the breakout, where price moves beyond the breaker block in the direction of the bias.
Each of these areas presents a different type of opportunity, with varying levels of confirmation, risk, and trade management. Let’s delve into it individually.
Edge of Range
If a lower timeframe breaker block forms at the edge of the higher timeframe block:
- Best traded as a standalone setup
- Offers strong risk-to-reward when targeting the HTF objective
- Aligns early with the higher timeframe bias
The main risk is that the lower timeframe trade can fail even while the higher timeframe breaker block remains valid. Price may take out the LTF BB, then continue respecting the HTF block afterward. This makes edge entries attractive, but less reliable in execution.
Consequent Encroachment (CE)
If a lower timeframe breaker forms around the midpoint of the higher timeframe block:
- Rejection here suggests stronger defence of the block
- Provides more stable confirmation than edge entries
In some cases, this reaction may come after price has already interacted with the edge. A move back to CE shows that the initial rejection was strong enough to push price away from deeper continuation.
This is generally a more comfortable area to trade the full higher timeframe idea. Partial profit can still be taken at nearer levels, while leaving a portion open for the larger target.
Breakout
If price begins breaking out of the higher timeframe block, then forms a lower timeframe breaker:
- Confirms directional acceptance
- Uses LTF structure for precise entry
- Keeps HTF signal as the primary take profit target
This is often the cleanest setup, as both timeframes are aligned. It also helps reduce the issue of wide zones by tightening the entry and risk.
The key idea is that the higher timeframe provides direction, while the lower timeframe refines execution.
Breaker Block Failure Strategy
What happens if a breaker block fails to hold? Can that failure itself become an opportunity?
In many cases, the answer is yes.
Within Smart Money Concepts, the formation and break of any support or resistance level reflects a shift in order flow. When a breaker block is broken again, it signals that the previous shift has failed and control has changed once more.
In simple terms, the level does not lose its importance, it changes role.
- Bullish breaker → Bearish breaker
- Bearish breaker → Bullish breaker
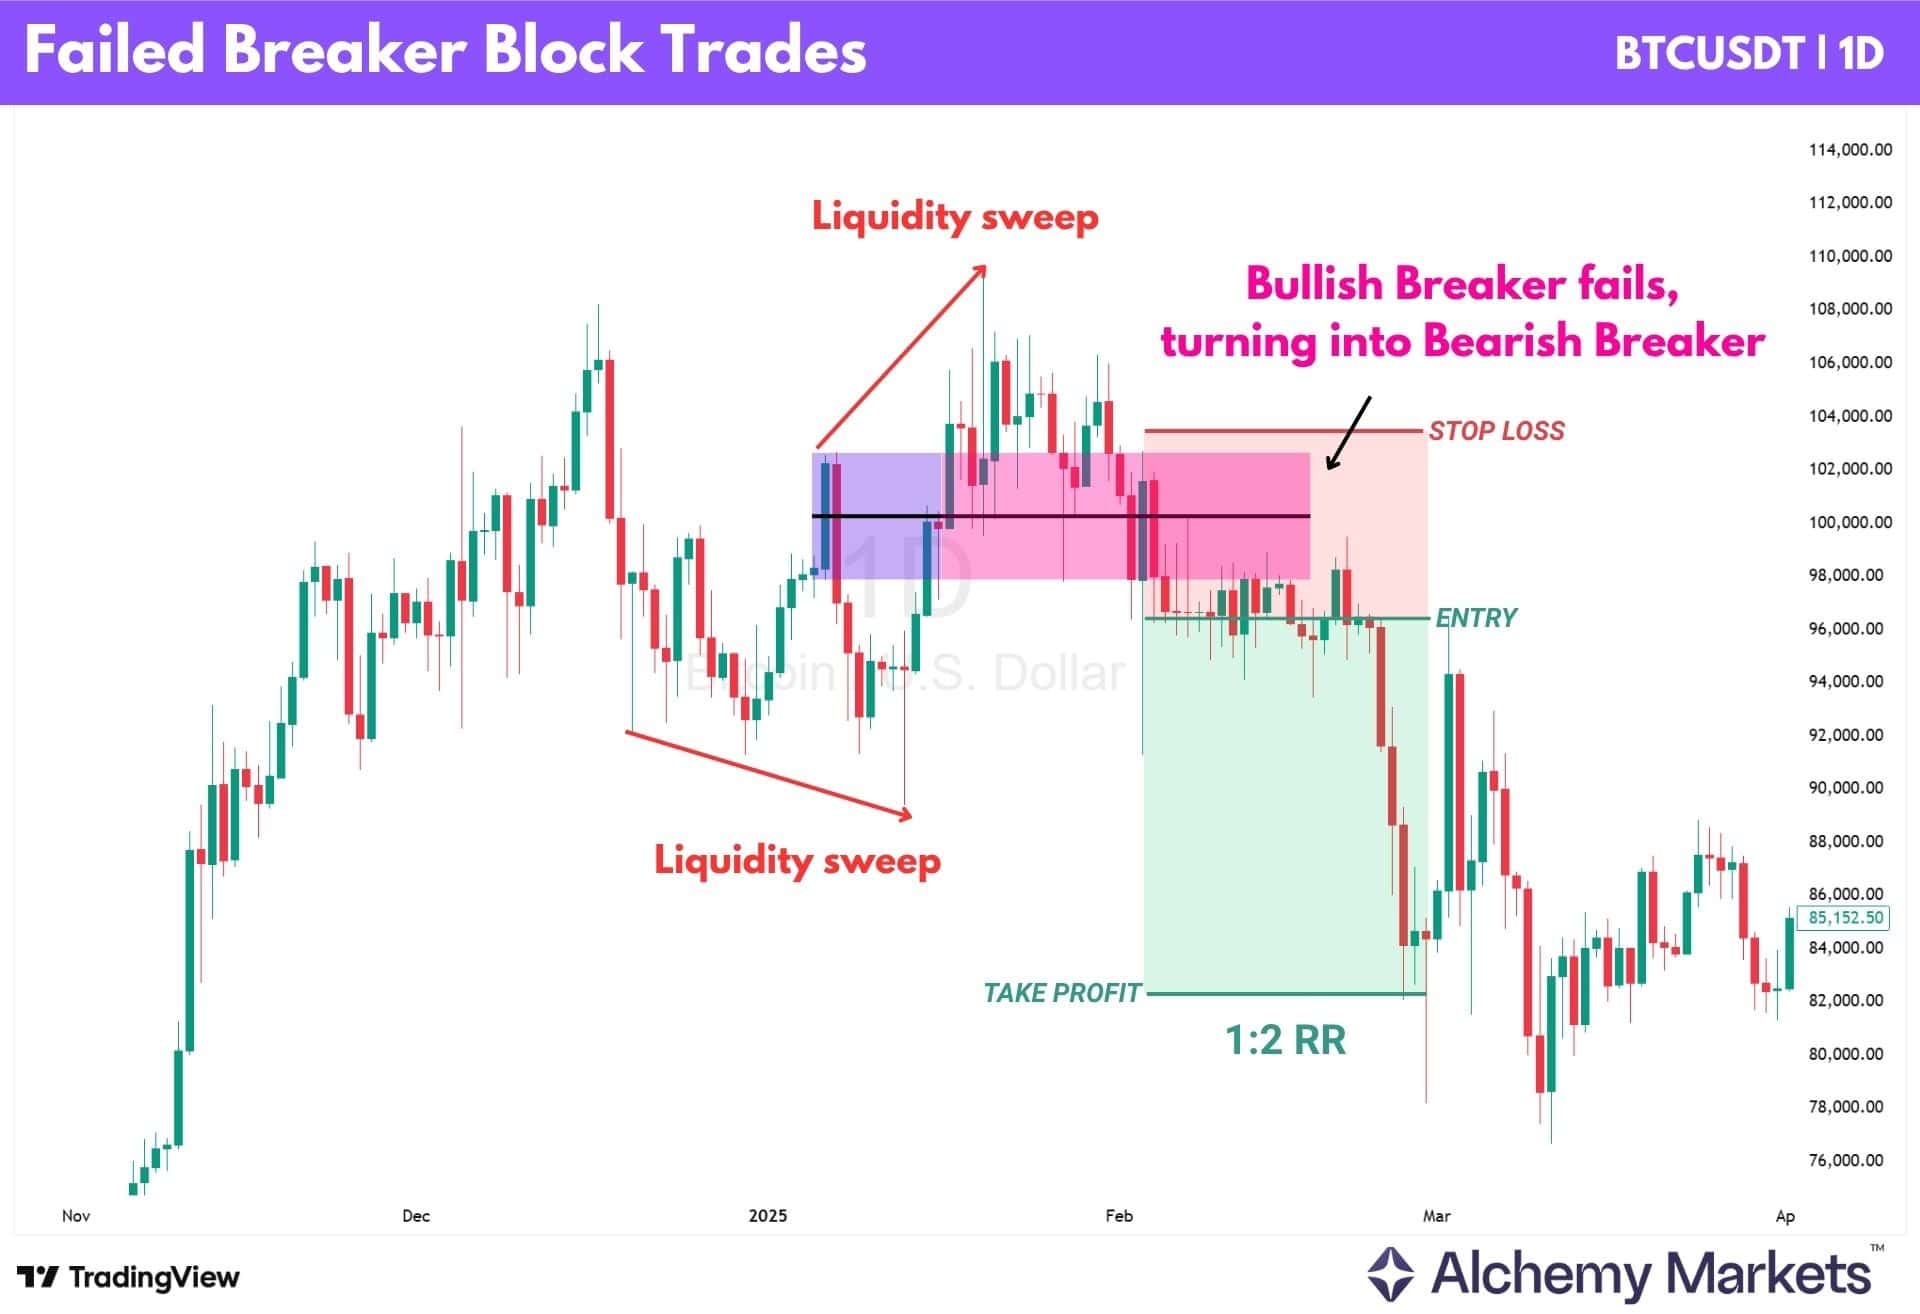
Let’s break down why this works. Observe the sequence of the Bitcoin daily timeframe chart above:
- Bullish BB forms: Price sweeps lower, then breaks above a bearish order block.
- Initial retest holds: Price reacts from the level and pushes higher, validating the setup.
- Failure: After multiple retests, the level breaks with momentum, invalidating the bullish shift and forming a bearish breaker.
- Retest of failed zone: As price returns, prior longs begin to close or reduce positions. This mitigation adds selling pressure as prior longs flip into shorts.
- Bearish reaction: Price respects the zone and continues lower, offering a clean continuation.
The key takeaway here is simple. When a breaker block fails, it does not lose its relevance, it changes its role. The same zone can often be reused, allowing traders to recognise the shift in structure and act on it quickly without needing to redraw the entire setup.
Rather than treating it as a failed idea, it becomes a continuation signal, driven by trapped traders mitigating their positions and reinforcing the move in the direction of the break.
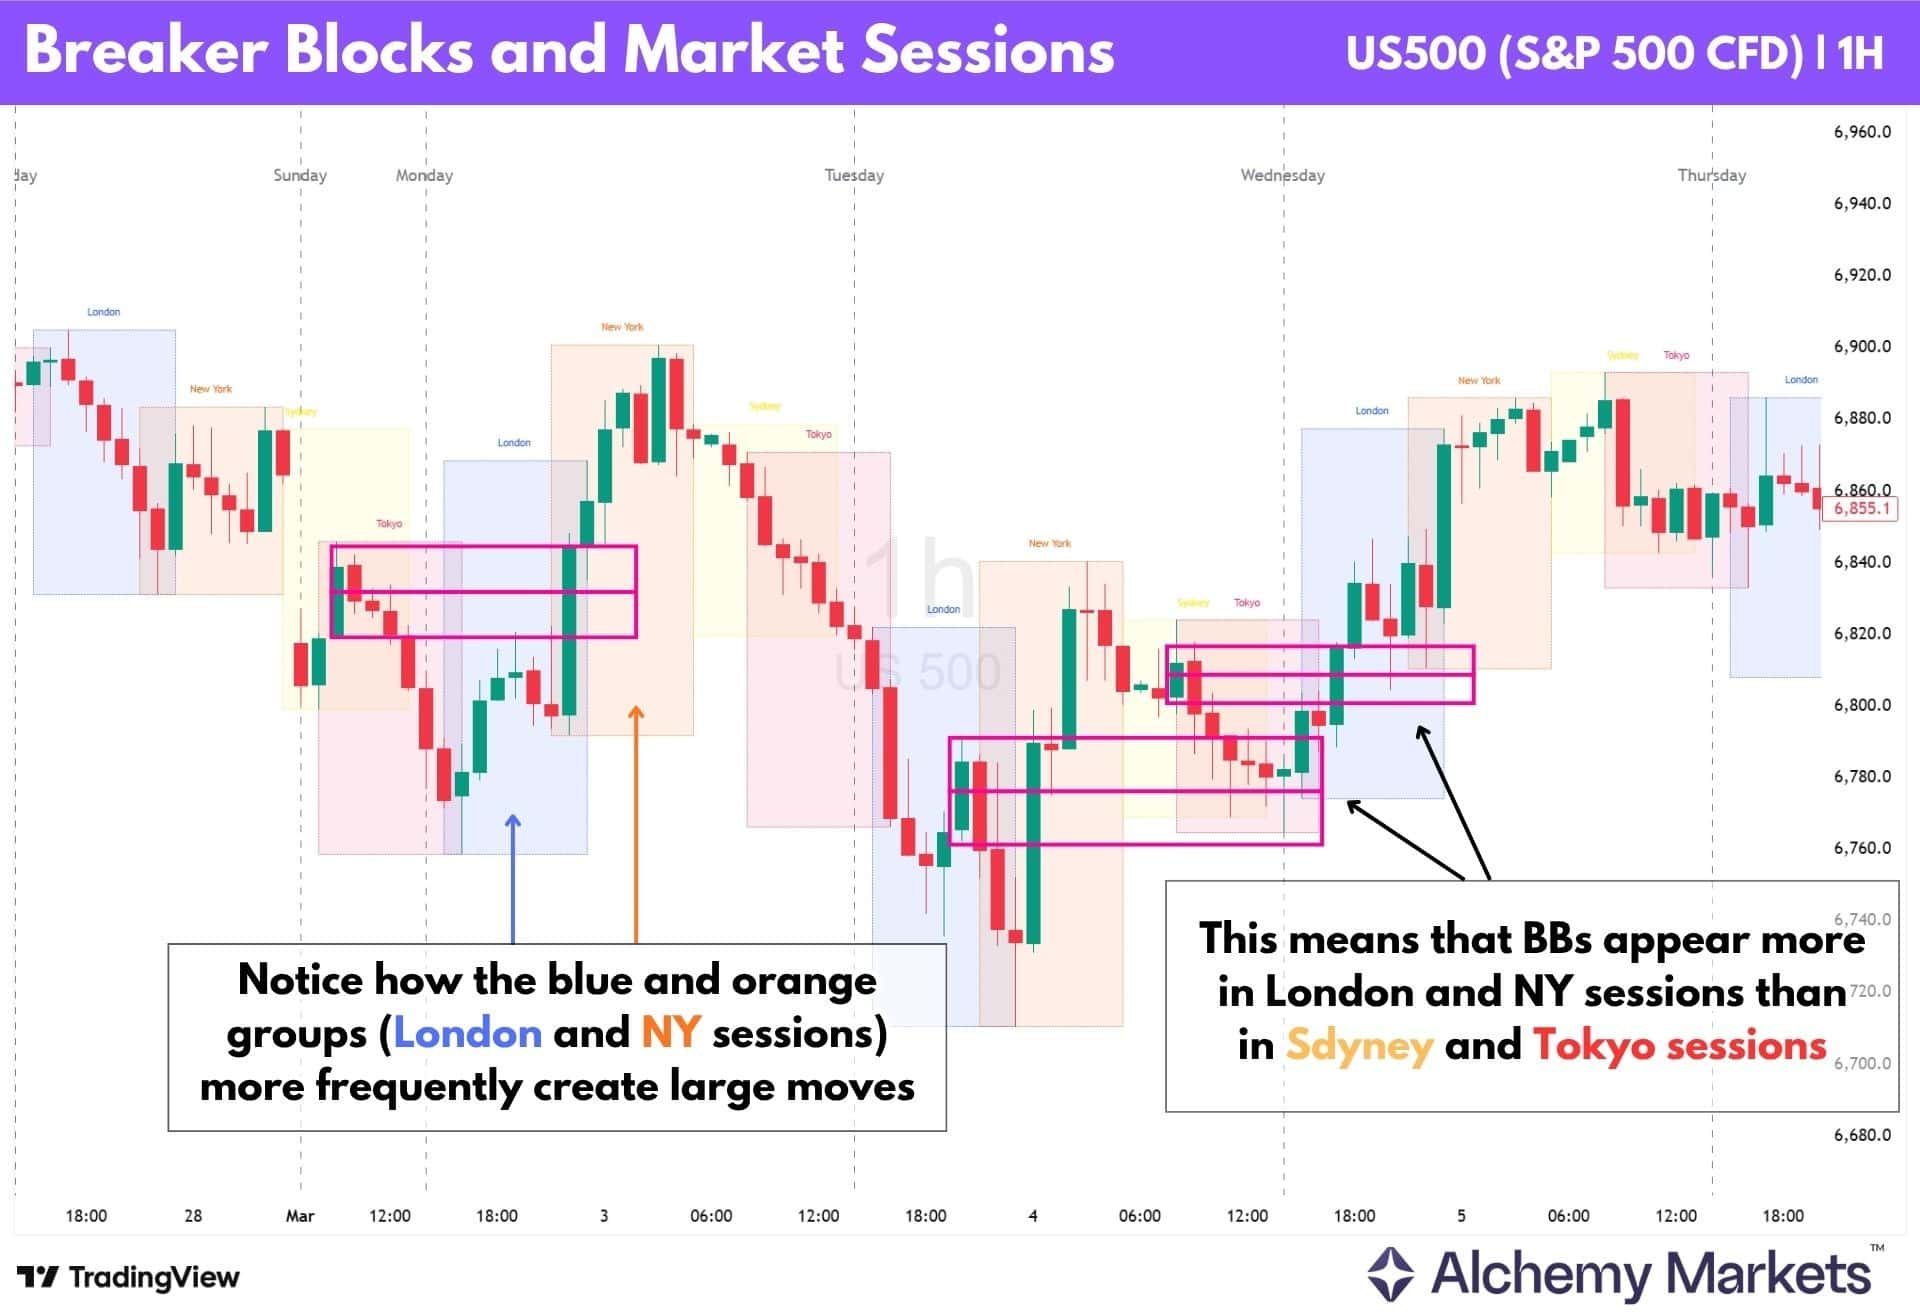
Time-Based Filtering
Some traders make the decision to only trade during specific market sessions. These timings play an important role in how breaker blocks perform, as liquidity and participation change throughout the day.
London and New York sessions generally see the highest activity, where institutional trading is concentrated. During these periods, price tends to move with more intent, allowing breaker blocks to form more clearly and produce stronger reactions.
Lower liquidity sessions, such as Tokyo or Sydney for most global assets, often act as a buildup phase. Price may consolidate or form liquidity before a larger move develops once higher participation returns.
As shown in the chart, the more decisive moves tend to occur during the London and New York sessions, while quieter sessions help form the structure that leads into those moves.
Of course, this is just a general rule of thumb. Market behaviour is not the same across all instruments. Some assets see stronger movement during specific sessions.
For example, UK equities and indices like the DAX tend to be most active during London hours, while the Nikkei sees stronger movement during the Tokyo session. Each market has its own active window and “rhythm”, and breaker blocks tend to form more frequently during periods of higher participation.
Volume Profile Analysis
Fixed Range Volume Profile (FRVP) can be used alongside breaker blocks to assess how price is likely to behave by mapping trading activity within a swing.
Applied from a swing low to high like a Fibonacci retracement, it highlights key areas of interest:
- POC (Red Line): Highest traded volume, strong area of interest
- VAH / VAL (Blue Lines): Upper and lower bounds of the value area (the most traded areas)
- HVN: High historical participation, where price is more likely to react
- LVN: Low historical participation, where price tends to move quickly
These levels can act as both targets and reaction zones, as price is often drawn toward areas of prior participation before reacting. When combined with breakers, it can give insights into what to expect.
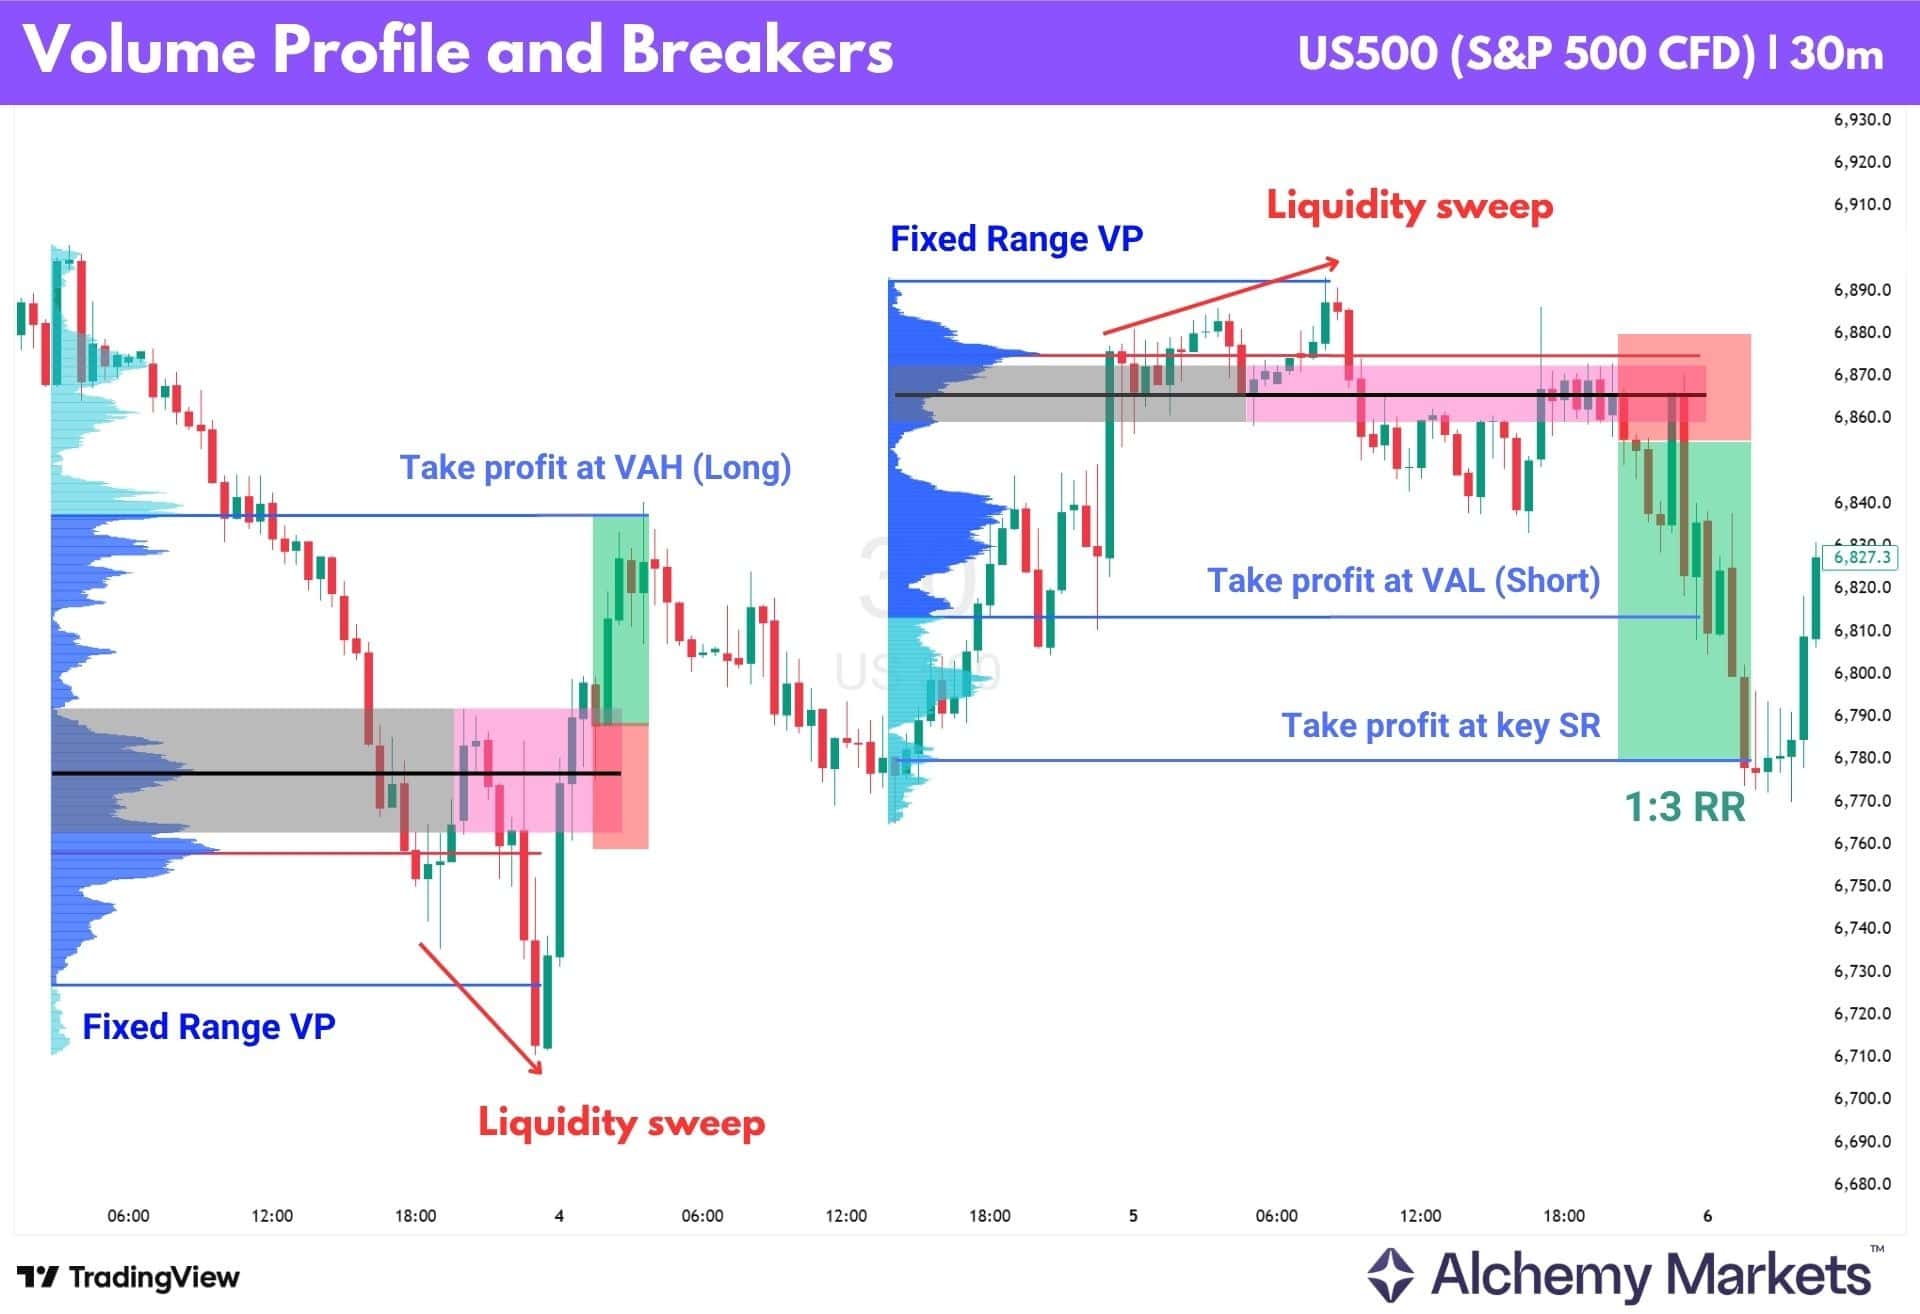
As shown in the chart, the first breaker block produces a clean reaction as it forms directly within a high-volume area. In contrast, the second example shows a breaker that forms below a HVN. This ends up with the price sweeping higher, above the breaker, before reversing.
Rather than reacting immediately at the breaker, price pushes deeper into the zone, tapping into the POC before reversing. This reflects how areas of higher participation can act as magnets before a reaction occurs, especially when the true concentration of volume sits slightly beyond a PD array.
Breaker blocks that form within HVNs are more likely to produce reactions, while those in LVNs are more likely to be traded through.
Breaker Blocks in Forex Trading
Breaker blocks can be a useful forex setup, especially on major pairs (USD pairs) during active sessions. This is because breakers tend to work better when the market is active and well-participated.
Forex suits this well, as it is the most liquid market in the world, with average daily turnover reaching $9.6 trillion, according to the 2025 Bank for International Settlements survey.
It is also worth noting that high liquidity is not the same as high volatility. Liquidity refers to market participation, while volatility refers to how sharply price moves. In contrast, low-liquidity conditions can cause prices to move more erratically and respect structure less cleanly.
Breaker Block ICT: Understanding the Inner Circle Trader Approach
ICT (Inner Circle Trader) refers to a trading framework focused on market structure and liquidity.
It is widely considered the origin of Smart Money Concepts, with SMC being a broader and often simplified version of the same ideas.
For instance, a breaker block in SMC can be defined in different ways. Some traders treat it as simply a broken order block that flips into support or resistance, while others require a liquidity sweep. This is where definitions start to vary.
In ICT, the definition of a breaker block is concrete: “A breaker block is a failed order block that only becomes valid after a liquidity sweep and a shift in market structure.”
The approach taught here follows the ICT model, which is what most SMC traders use nowadays.
Some still define a breaker block as a simple broken order block, but this removes the liquidity requirement and can overlap with mitigation-type behaviour rather than a true ICT breaker.
Breaker Block vs Order Block
An order block is the range of the candle that marks the beginning of a pivoting move. It’s expected to hold as support or resistance when price returns.
A breaker block forms when that order block fails after a liquidity sweep has formed:
- If the bullish order block has failed after a higher high was formed, it’s a bearish breaker.
- If the bearish order block fails after a lower low was formed, it’s a bullish breaker.
That liquidity sweep is what gives the breaker block context for a potential shift in trend direction.
Although not mandatory, we suggest using a 4 candlestick followthrough rule to filter out your order block signals, which will also improve the quality of your breaker block signals.
| Reminder: The 4 candlestick follow-through rule checks whether the fourth candle after the pivot candle (PC) closes outside the PC’s range, which confirms the order block’s strength. |
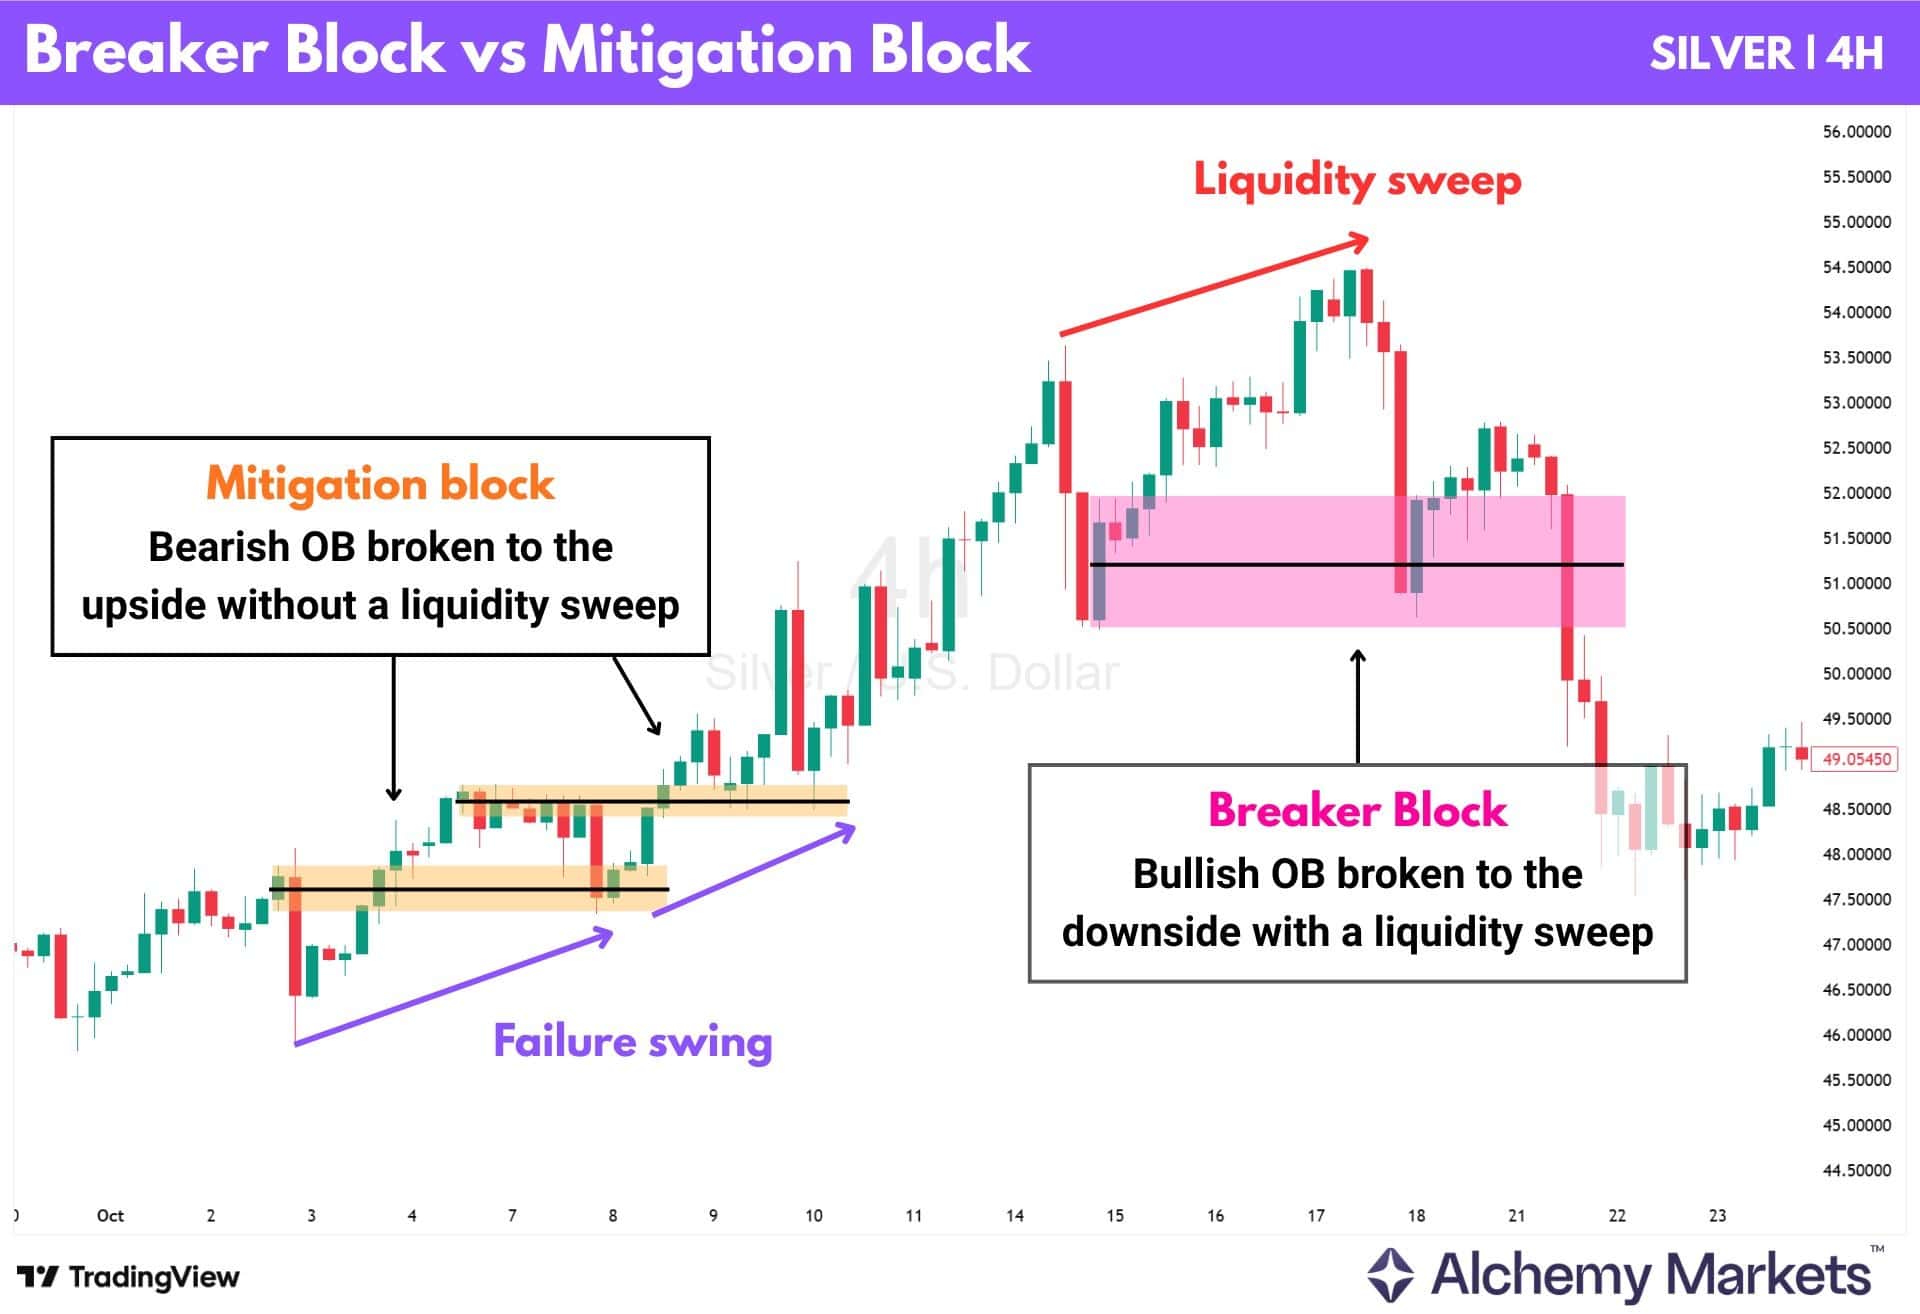
Breaker Block vs Mitigation Block
In SMC terms, mitigation blocks are former order blocks that price has pushed through, causing it to flip from support to resistance, or the other way around.
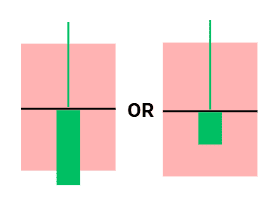
On the surface, it looks just like a breaker block. But unlike BBs, mitigation blocks do not require a liquidity sweep in the form of a higher high or lower low to be formed.
Instead, mitigation blocks form with a failure swing. Price fails to make a new high or low, loses momentum, and then breaks through the level without first taking liquidity. As a result, mitigation blocks are more commonly treated as continuation signals, or at most weaker reaction points.
Breaker blocks, on the other hand, come with stronger confirmation. Liquidity has already been taken and structure has shifted, so when price returns, the level tends to hold with more follow-through.
FAQ
What is the best timeframe to trade Breaker Block on?
Breaker blocks can appear on any timeframe, from the 1-minute chart to the weekly chart. However, many traders prefer identifying breaker blocks on higher timeframes such as the 1-hour, 4-hour, or daily charts.
Higher timeframes tend to filter out market noise and represent stronger institutional positioning. Once a higher-timeframe breaker block is identified, traders often move to lower timeframes to refine their entry, such as waiting for price action at the Consequent Encroachment (CE).
For example, a trader may identify a breaker block on the 4-hour chart and then look for a confirmation entry on the 5-minute or 15-minute chart.
Is the Breaker Block Trading Strategy Good or Bad?
Breaker blocks are neither inherently good nor bad. Their effectiveness depends on market context and how traders apply them. They can be powerful because they represent failed institutional positioning, where a broken order block flips its role and becomes a new reaction zone. However, breaker blocks work best when combined with other tools such as market structure shifts, liquidity sweeps, fair value gaps (FVGs), or Fibonacci retracements.
How do you identify strong Breaker Block?
Strong breaker blocks usually share several characteristics:
- The breakout that created the breaker block shows clear momentum or displacement
- Price breaks the original order block decisively
- The retest occurs relatively quickly
- The breaker block aligns with the trend or a market structure shift
Breaker blocks that form after a CHoCH and BoS are often considered stronger setups.
Are breaker blocks unique to forex trading?
No. Breaker blocks can appear in any liquid financial market, including forex, stocks, commodities, indices, and cryptocurrencies. The concept is based on price structure, not the specific asset being traded.
Do breaker blocks always work as expected?
No. Breaker blocks can fail just like any support or resistance level. Markets may break through structural zones due to news events, strong trends, or liquidity shifts. This is why traders typically place stop losses beyond the breaker block’s range.
How are breaker blocks different from supply and demand zones?
Both identify potential reaction zones, but they are formed differently. Supply and demand zones come from imbalances where price moves away strongly (exactly like order blocks), while breaker blocks are failed order blocks that flip roles after being broken.
In simple terms:
- Supply/demand = Imbalance zones
- Breaker blocks = Failed order blocks
Can I automate breaker block detection?
Yes. Some indicators on platforms like TradingView attempt to automatically detect breaker blocks by identifying order blocks and marking when they are broken. They operate somewhat similarly to a zig-zag indicator.
Is volume important when identifying a breaker block?
Volume can provide additional confirmation but is not essential. A breakout with strong momentum or increased volume may indicate stronger participation, but most SMC traders rely primarily on price structure and displacement.
How to Avoid False Breaks
False signals often occur when the breakout that created the breaker block lacks momentum. Traders typically reduce false setups by looking for strong displacement, trend alignment, and confirmation at the CE, often combined with other tools.
How to Find High-Probability Breaker Block
High-probability breaker blocks usually form when multiple confluences align, such as in trending conditions, and if the higher timeframe PD array (Order Block, FVG, Breaker Block) aligns with a lower timeframe one. For example, a 4H breaker block that forms within a daily timeframe OB, is going to be a stronger signal if they share alignment. That confluence is taken even further if the higher TF’s trend aligns with the bias of the 4H breaker block.
What is the Breaker Block Indicator in Tradingview?
Breaker block indicators on TradingView are community submitted indicators that highlight potential breaker block zones. They typically detect order blocks, track when those blocks are broken, and mark them as breaker blocks once the role flips. These tools can help scan charts quickly but should be used as guides rather than exact trading signals.
Can breaker blocks be used for day trading?
Yes, breaker blocks are actually fantastic for day trading. It can be used as an entry signal once price reaches key levels, and then pivots away. One relevant strategy we mentioned is the “Nested Breaker Block” strategy, which uses multi-timeframe analysis to find strong entry signals.


