


Written by:

Reviewed by:

Bearish
- August 25, 2025
- 21 min read
Bull Trap Trading Guide
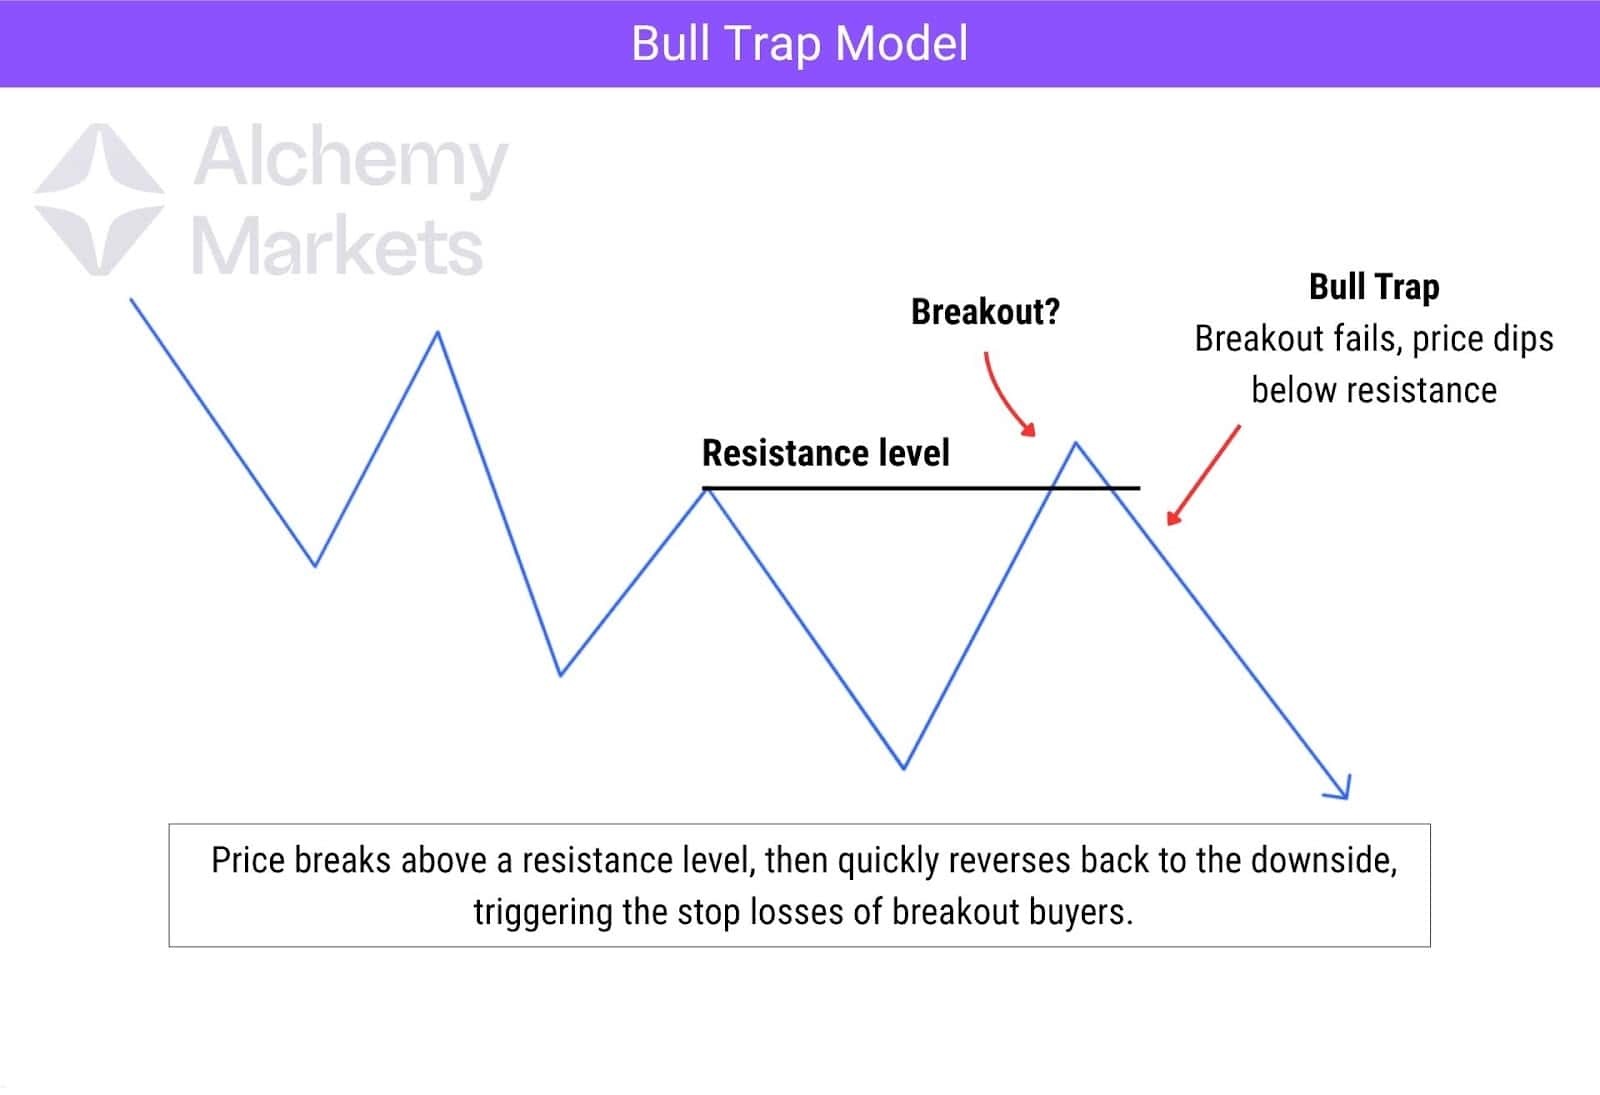
If you have ever been caught buying a breakout, only to watch the market reverse sharply against you, congratulations. You have seen the bull trap in action. These deceptive moves happen when price breaks above a key resistance level, luring in breakout buyers, only for the market to reverse and fall back below that level. This sharp reversal often triggers stop-losses and leaves breakout traders trapped on the wrong side of the market.
Bull traps are especially common during a downward trend, where false breakouts temporarily interrupt the broader price decline before resuming lower. While these setups can be costly for those caught off guard, they also offer valuable insight into market psychology and liquidity shifts. For traders who can recognise the signs early, bull traps present an opportunity to trade with the trend right before the price falls again.
In this guide, we will explore how bull traps work, how to spot them in real time, and how to trade them smartly.
What is a Bull Trap?
A bull trap is a false breakout that tricks traders into thinking a market is going up, when in reality, it’s setting up to continue downward. This occurs when price breaks above a resistance level, inducing buyers to enter long positions. However, the breakout is short-lived, and price quickly reverses, leading to a price decline that traps those traders in losing trades.
Bull traps are most common in bear markets or strong downtrends, where temporary upward price movements spark false hope of a reversal. These moves are often triggered by short covering, speculative buying, or misleading technical signals. In some cases, bull market traps can also occur within a bull market, especially near major resistance levels where breakouts fail and reverse sharply.
What makes bull traps dangerous is how convincing they look. Many traders rely on breakout strategies, and when a breakout occurs with speed or volume, it seems valid until the market reverses.
Understanding the psychology behind the bull trap and recognising the early warning signs is crucial to avoid falling for this classic reversal setup.
How to Identify Bull Traps?
Spotting a bull trap early requires a combination of price action, technical confirmation, and emotional control. These traps often share several visual and behavioural patterns across markets.
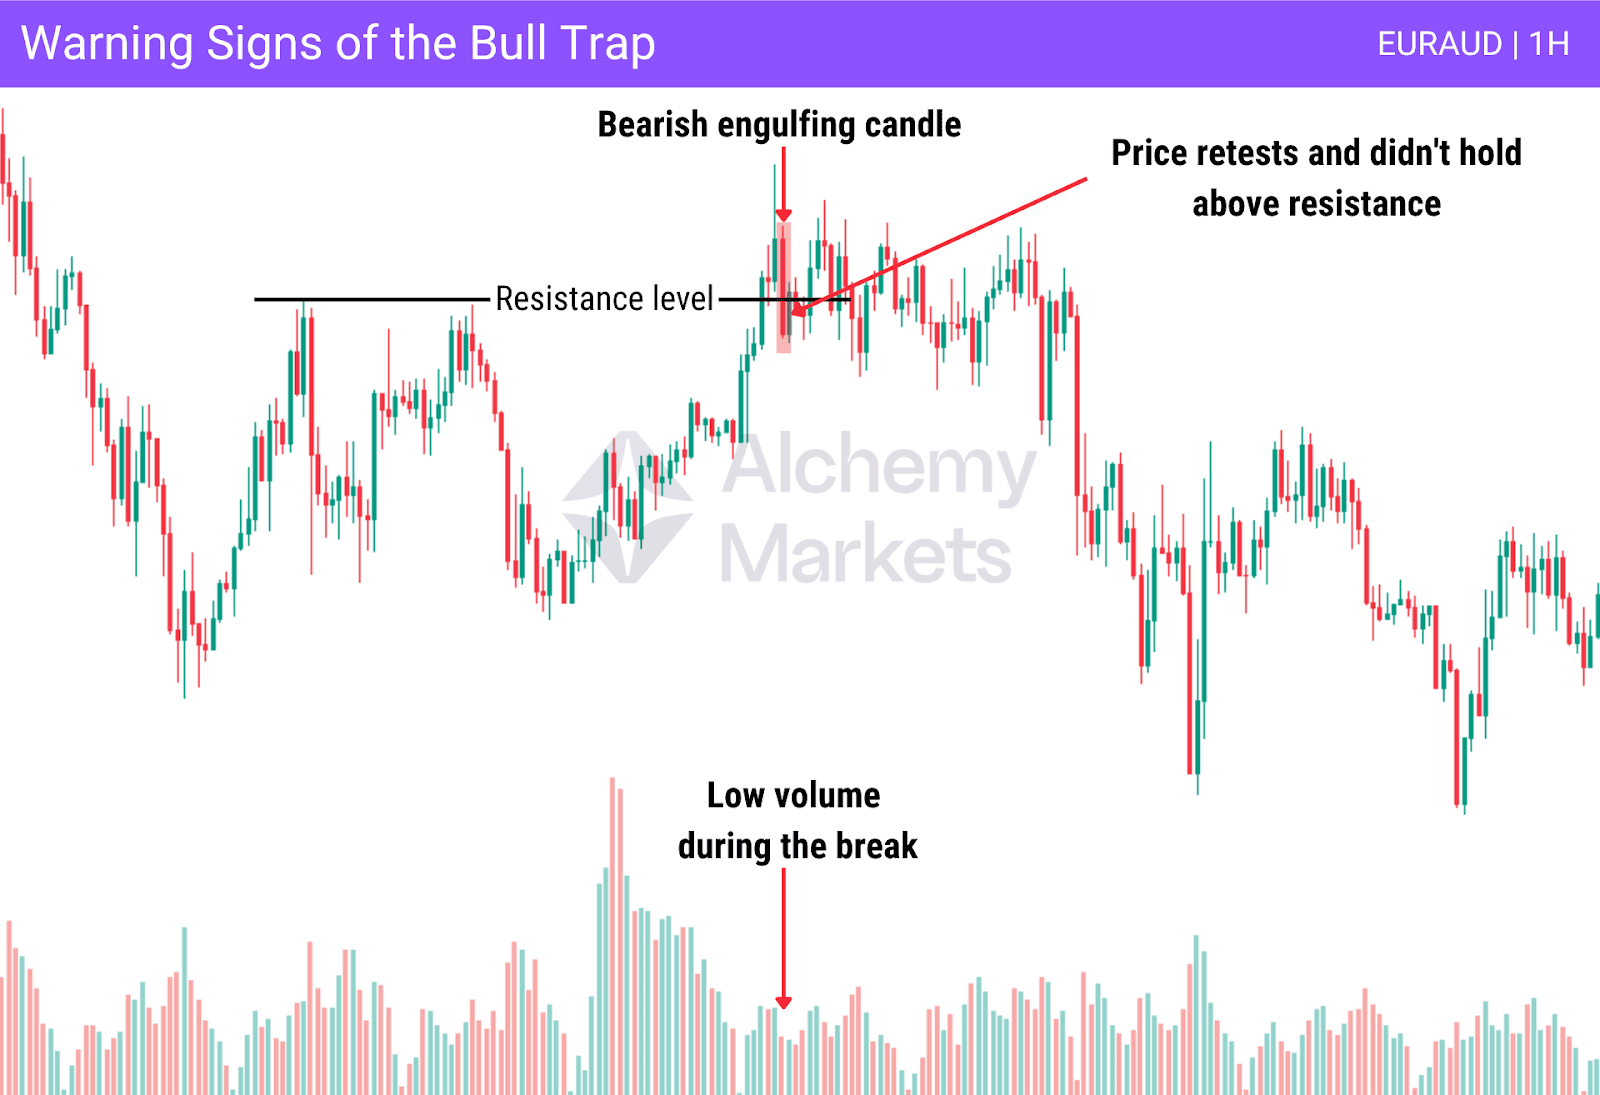
Breakout Above Resistance: The setup starts when price pushes above a known resistance level or swing high, often triggering breakout trades and stop entry orders.
Low Trading Volume or Weak Momentum: A valid breakout typically comes with strong volume. If volume is weak, the breakout may lack conviction, an early warning sign of a potential bull trap.
Fast Reversal: After the breakout, price quickly reverses below the resistance line, catching long traders off guard. This reversal often forms a long-wick candle or bearish engulfing pattern.
Failure to Hold Above Breakout Zone: The price fails to retest and hold above the new high. Instead, it collapses, confirming that the move was a false signal.
Divergence on Indicators: Indicators like RSI or MACD may show bearish divergence, further suggesting a weakening move.
To identify a bull trap, traders should combine chart structure with supporting data such as volume, candlestick patterns, and some indicators.
How Does Bull Trap Trading Work?
Bull trap setups play on market psychology, particularly FOMO (fear of missing out) and the desire to catch a breakout early. When price breaks above a resistance level, it attracts long traders who believe a new upward trend is starting.
However, institutions or large sellers may use this moment to offload positions, creating a false breakout. As the market reverses, stop-loss orders get triggered, adding to the selling pressure and accelerating the move back down. This effect traps the early buyers in losing trades.
Retail traders, especially those who chase breakouts without confirmation, often get caught on the wrong side of the market. The more convincing the breakout, sharp price spikes, temporary bullish candles, the more likely it is to lure in traders.
Understanding how bull traps work is key to developing a reliable trading strategy. This requires patience, discipline, and a good eye to spot the pattern. Recognising bull traps early allows skilled traders to avoid them, rather than falling victim to false breakouts.
Bull Trap Chart Patterns
Certain technical chart patterns tend to lead into bull traps. Recognising these early can help traders stay cautious during breakout attempts:
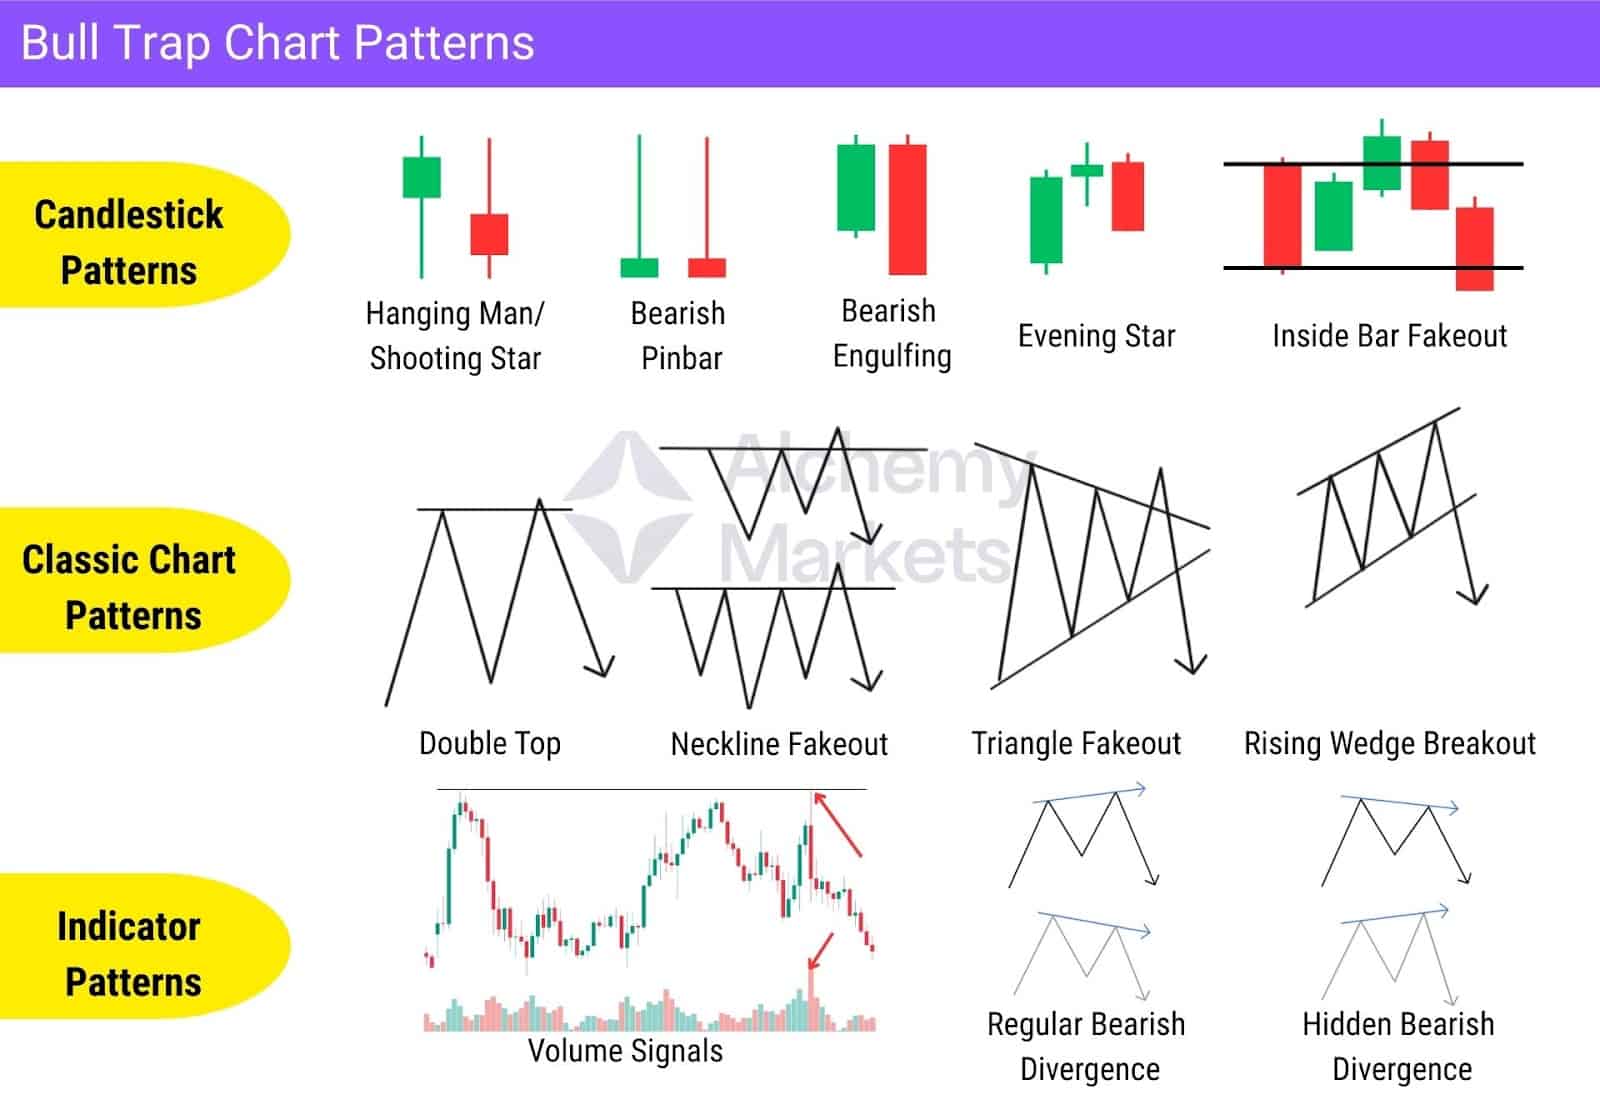
Here’s a simple breakdown of the various ways a bull trap can show up in the chart:
- Bearish Reversal Candlesticks
Bearish engulfing candles are one of the clearest signs of a bull trap, signalling strong rejection and a shift in momentum just after a failed breakout. Other candlestick patterns play the same way, including pin bar, shooting star, and hanging man, which often reflect exhaustion after a short-term rally. More complex setups like the evening star or inside bar fakeout can also trap buyers before price turns lower.
- Classic Chart Patterns
Certain price structures are closely associated with bull traps, particularly those that encourage breakout buying. A double top is a classic example, where price forms a second high that briefly breaks above resistance, only to collapse back below it. Other chart patterns can behave the same way, inducing buyers before reversing. Triangle breakouts, neckline fakeouts, and rising wedges often break upward without follow-through, then reverse with bearish confirmation triggering the trap.
- Indicator Patterns
Momentum and volume can help confirm bull traps. A breakout on weak volume followed by selling pressure is a common warning sign. RSI and MACD are great tools for spotting divergence, which often signals fading momentum and a potential reversal to the downside.
Bull traps tend to form near resistance levels or bearish trendlines and become more reliable when confirmed by patterns, volume, or divergence. Spotting these signals early helps traders avoid losses and capitalise on high-probability setups with the prevailing trend.
Bull Traps Example
This NZDUSD 4-hour chart shows a classic bull trap setup during a clear downtrend, marked by a single, well-defined resistance level.
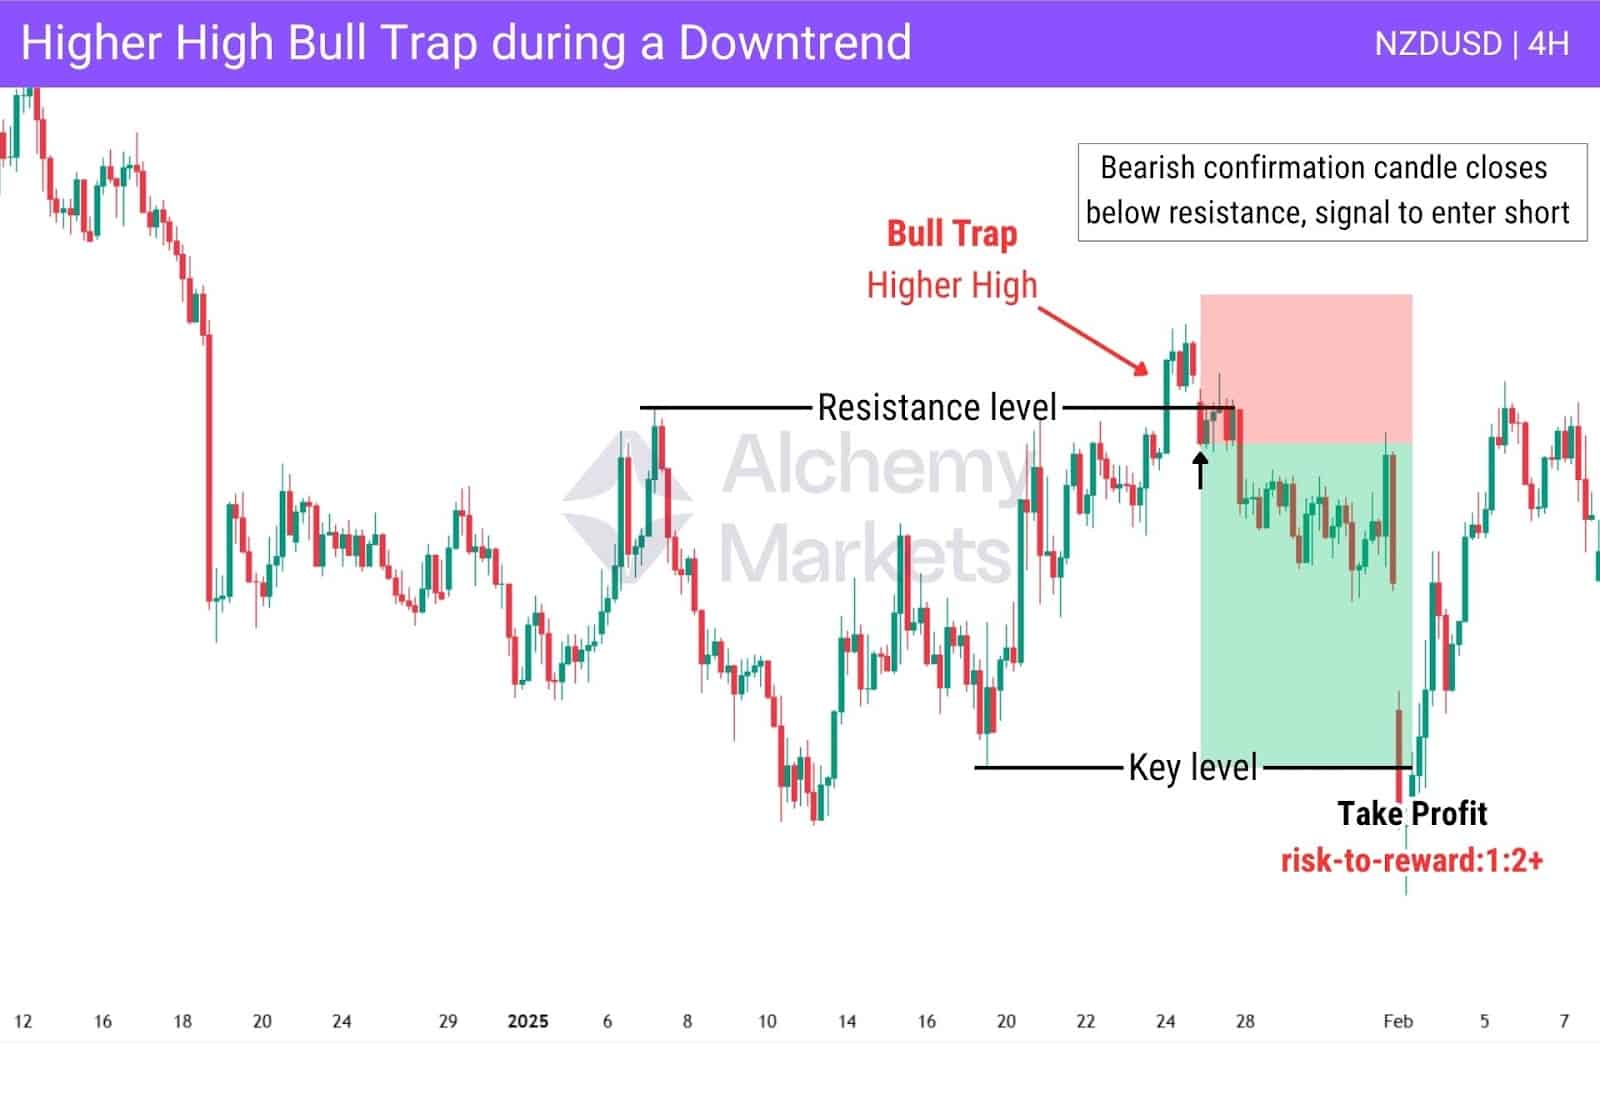
After forming a series of lower highs and lower lows, price broke above the resistance, inducing breakout traders to enter long positions in anticipation of a trend reversal.
However, the move quickly failed. Price reversed sharply and closed back below the resistance, with a bearish candle providing a clear confirmation for a short entry. This move not only triggered stop-losses for the long positions, but also created a high-probability opportunity to sell in line with the dominant downtrend.
Traders who remained patient and waited for confirmation were rewarded with a successful short trade, as bearish momentum resumed and price continued to drop, offering a favourable risk-to-reward.
This example highlights how bull traps often form near resistance in a downtrend and how traders can capitalise on these setups by trading with confirmation and aligning with the market direction.
How to Avoid Getting Caught in a Bull Trap
Bull traps can be costly for impulsive traders, especially during breakout attempts.
Avoiding them starts with recognising subtle warning signs before committing to a trade. By learning what to look for, traders can avoid bull traps, reduce unnecessary losses, and stay on the right side of the market.
One of the most reliable signals is low trading volume. When price breaks above a resistance level but the breakout isn’t backed by volume, it often signals a false breakout rather than genuine market interest.
Another key component is confirmation. Instead of jumping in on the first move above a resistance zone, disciplined traders wait for a retest of the breakout level. If price retests and holds above it, the breakout is more likely to be valid. If it quickly drops back below, it may be a trap in progress.
Technical indicators like the relative strength index or candlestick patterns can also help. A breakout followed by a shooting star or bearish engulfing candle near resistance is a classic trap signal.
Lastly, strong risk management is essential. Using stop-loss orders below the breakout zone and managing position size can help you limit losses if the setup fails.
By staying patient, waiting for clear confirmation, and avoiding impulsive entries, many traders can successfully avoid bull traps and stay aligned with their overall trading strategy.
How to Escape a Bull Trap
Getting caught in a bull trap is frustrating, but it is something all traders experience from time to time. What separates skilled traders is how they respond. The key is effective risk management, ensuring that a small loss does not escalate into something more damaging.
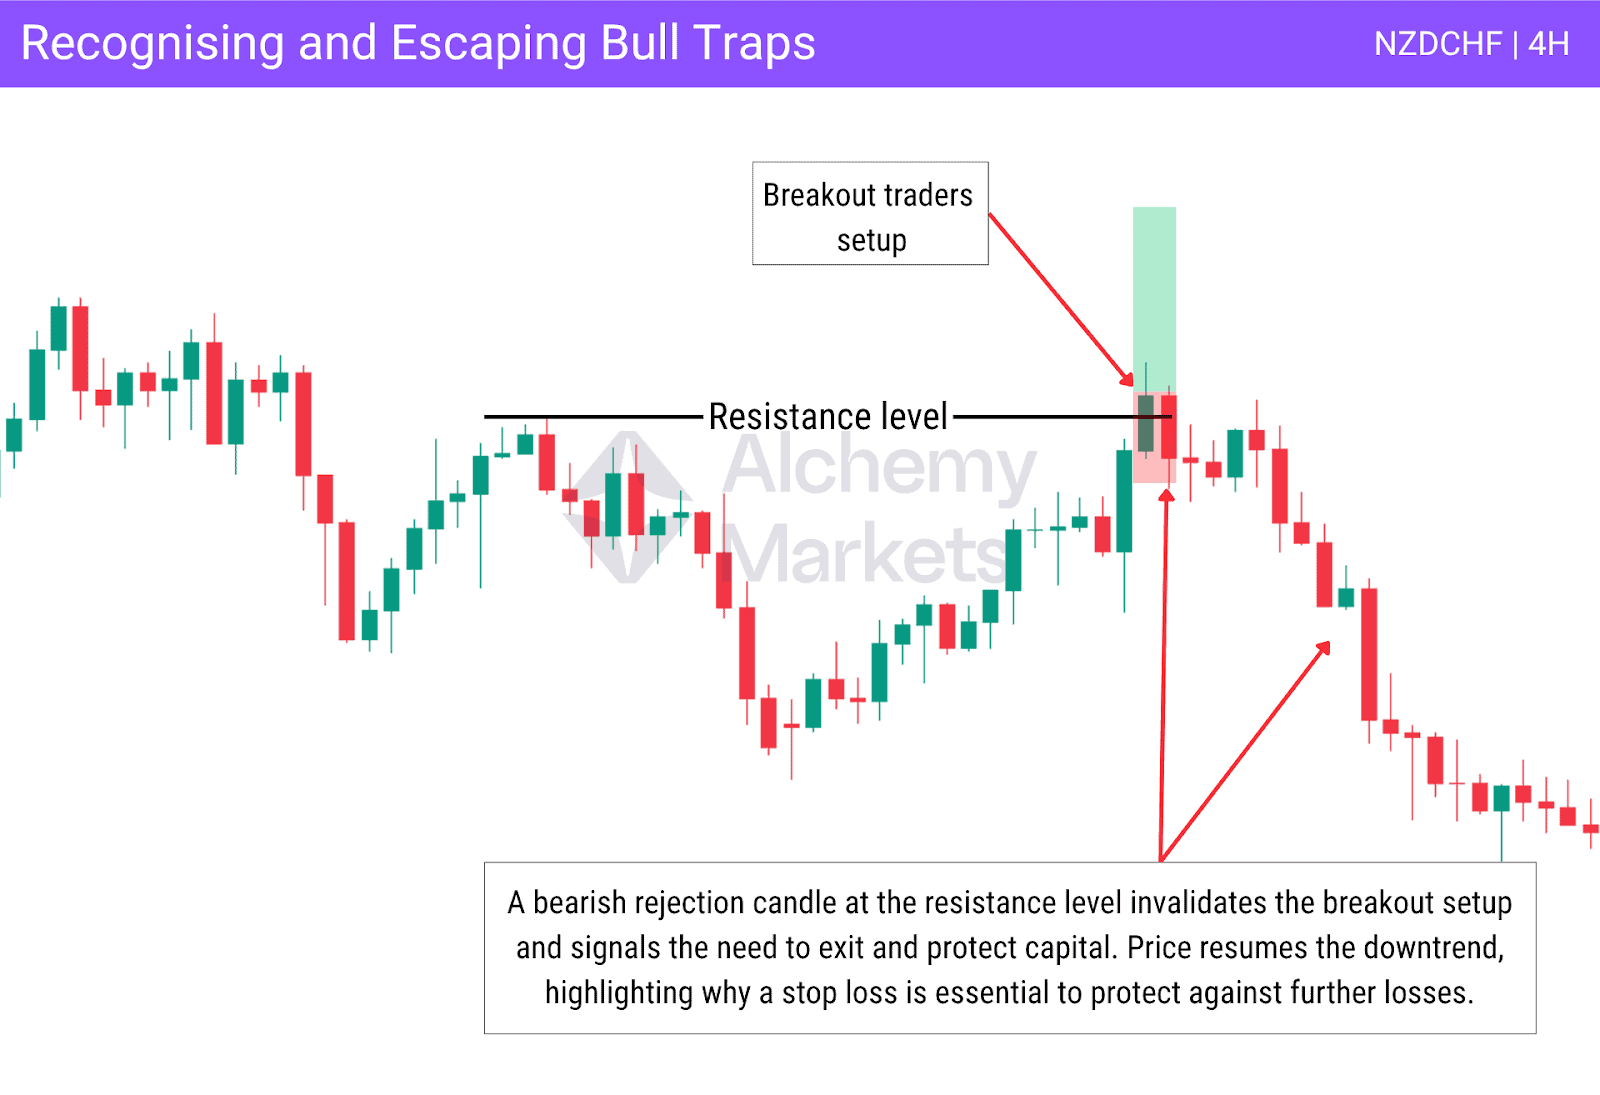
This NZDCHF 4H example highlights how a breakout above resistance quickly failed, trapping breakout traders. It also reinforces the importance of placing a stop loss in advance to control potential losses when the market turns against you.
Effective risk management starts before the trade is even placed. This includes having a clear plan for position sizing, calculating your lot size based on account size, risk tolerance, and stop loss distance. If the trade fails and price quickly reverses, exiting promptly protects your capital and prevents a minor loss from becoming something larger. Hoping the market will recover often leads to unnecessary and deeper losses.
Skilled traders accept these small setbacks as part of doing business. They move on, refocus, and wait patiently for the next clean, high-quality opportunity where the probabilities are back on their side.
Bull Traps Trading Strategies
Bull traps are deceptive but highly tradable events. When approached with a structured plan, they can offer precise short entries, tight stop losses, and high-reward opportunities. Below are some of the most effective ways to trade them using technical tools like price action, volume, support and resistance, RSI, moving averages, and candlestick analysis.
Trading a Bull Trap In a Downtrend
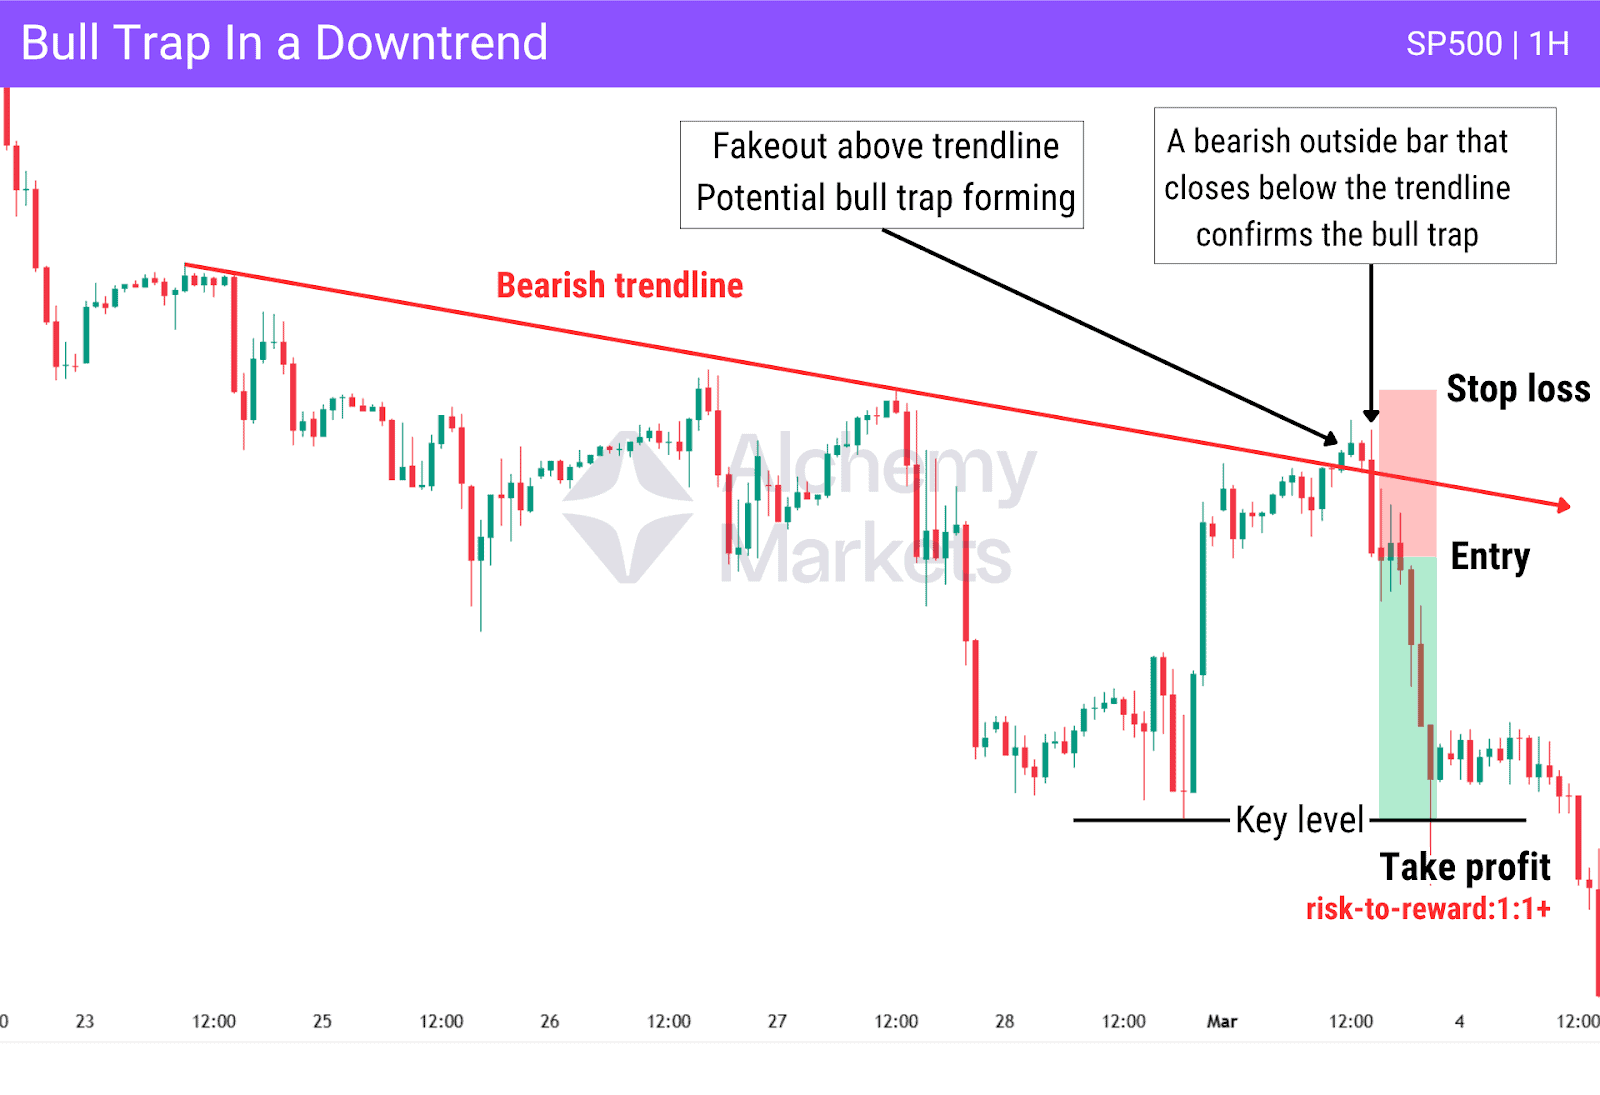
A bull trap occurs frequently in strong downtrends when price temporarily breaks above a bearish trendline, creating the illusion of a reversal. This move often lures breakout traders into long positions expecting further upside.
But instead of continuing higher, price forms a strong bearish candle, trapping buyers and resuming the dominant trend.
Entry Criteria
- Wait for price to break above the bearish trendline and then form a strong bearish candlestick, such as a bearish outside bar that closes back below the trendline. This confirms that the breakout failed and a bull trap has likely occurred. A nearby resistance level can provide added confluence for the setup. Traders may also use price action or indicators for additional confirmation.
Stop Loss
- Place your stop just above the wick of the engulfing candle to protect against further upside.
Take Profit
- Target the next support level and use a positive risk-to-reward ratio, depending on structure. This strategy works best in clearly bearish markets, where the bull trap occurs as part of a liquidity sweep before the trend continues lower.
Trading a Bull Trap In an Uptrend
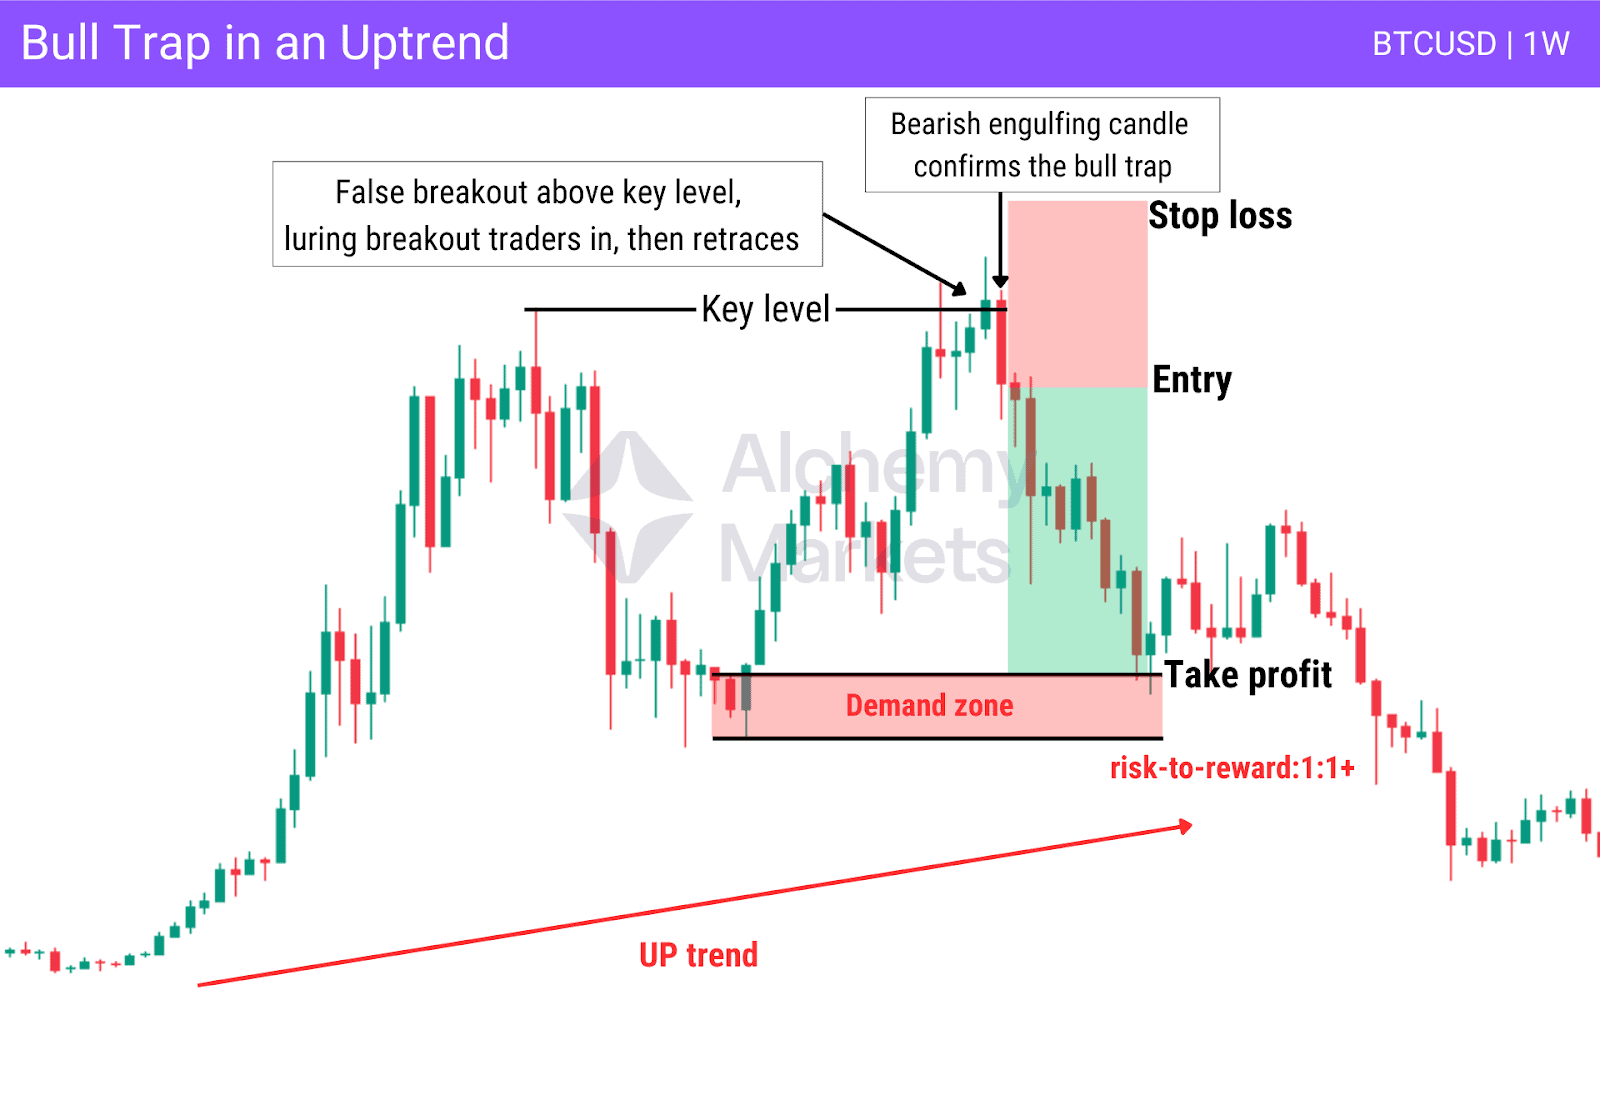
Although less common, a bull trap can occur during an uptrend, especially when price rises aggressively and breaks above a previous high. Traders often anticipate a continuation breakout, but the move fails, trapping buyers and triggering a temporary retracement, sometimes resembling a brief bearish reversal before the uptrend resumes.
Even though the trend remains bullish, traders can benefit from the retracement that follows the trap by taking short-term sell positions during this pullback phase.
Entry Criteria
- Look for price to push above a recent key level and then form a clear rejection, such as a bearish engulfing or pin bar, which confirms the failed breakout. This signals that a bull trap has likely occurred.
Stop Loss
- Place your stop just above the highest point reached during the breakout to protect against any extended bullish attempts.
Take Profit
- Since you are trading against the overall trend, it is often better and less risky to target the first zone or level where price is likely to react and possibly reverse back into the uptrend. This could be a demand zone, a swing low, or the base of a consolidation range, areas where profit taking often occurs. It’s important to treat these setups with tactical precision and avoid holding the trade too long.
Additional Confirmation
- Use price action, market structure, or indicators such as volume and RSI to increase confidence in the setup.
Bull Traps with Support and Resistance Levels
Support and resistance levels play a key role in identifying bull traps, especially in range-bound markets or during pullbacks within a larger trend. A bull trap typically occurs when price breaks above a clear resistance level, triggering long entries from breakout traders, only to reverse back below the level, trapping those buyers.
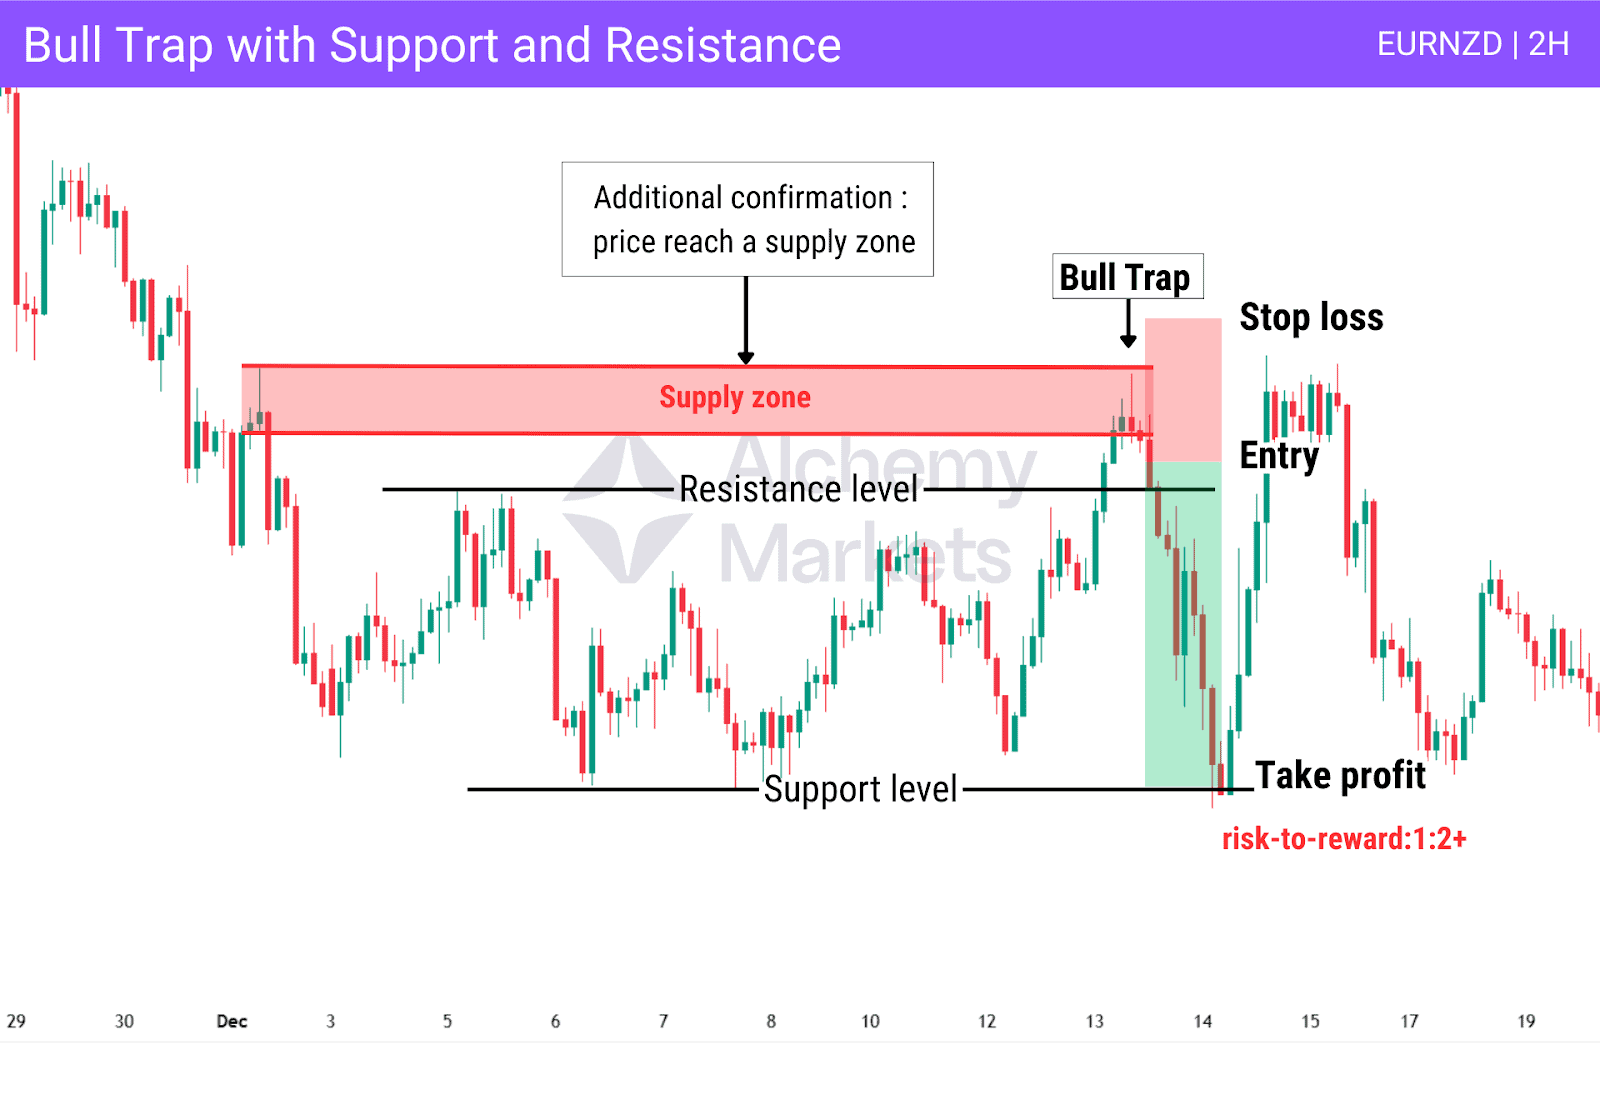
Entry Criteria
- Enter short after a failed breakout above resistance, confirmed by a strong bearish candlestick, such as a pin bar or engulfing pattern. The setup becomes even more reliable if the rejection aligns with a supply zone or a previously tested resistance level.
Stop Loss
- Place your stop right above the highest point reached during the breakout.
Take Profit
- You can target support levels that formed within the range during the buildup to the trap. Your final take-profit should be at the support range itself, ensuring you capture the full retracement while respecting the overall structure.
- A risk-to-reward of 1:2 or 1:3 is ideal for this type of setup.
Bull Traps with Volume Analysis
Volume often reveals what price action alone cannot. A breakout that forms on low trading volume typically lacks real buying interest, making it vulnerable to failure. In this context, volume can be useful for signalling bull traps before they fully unfold.
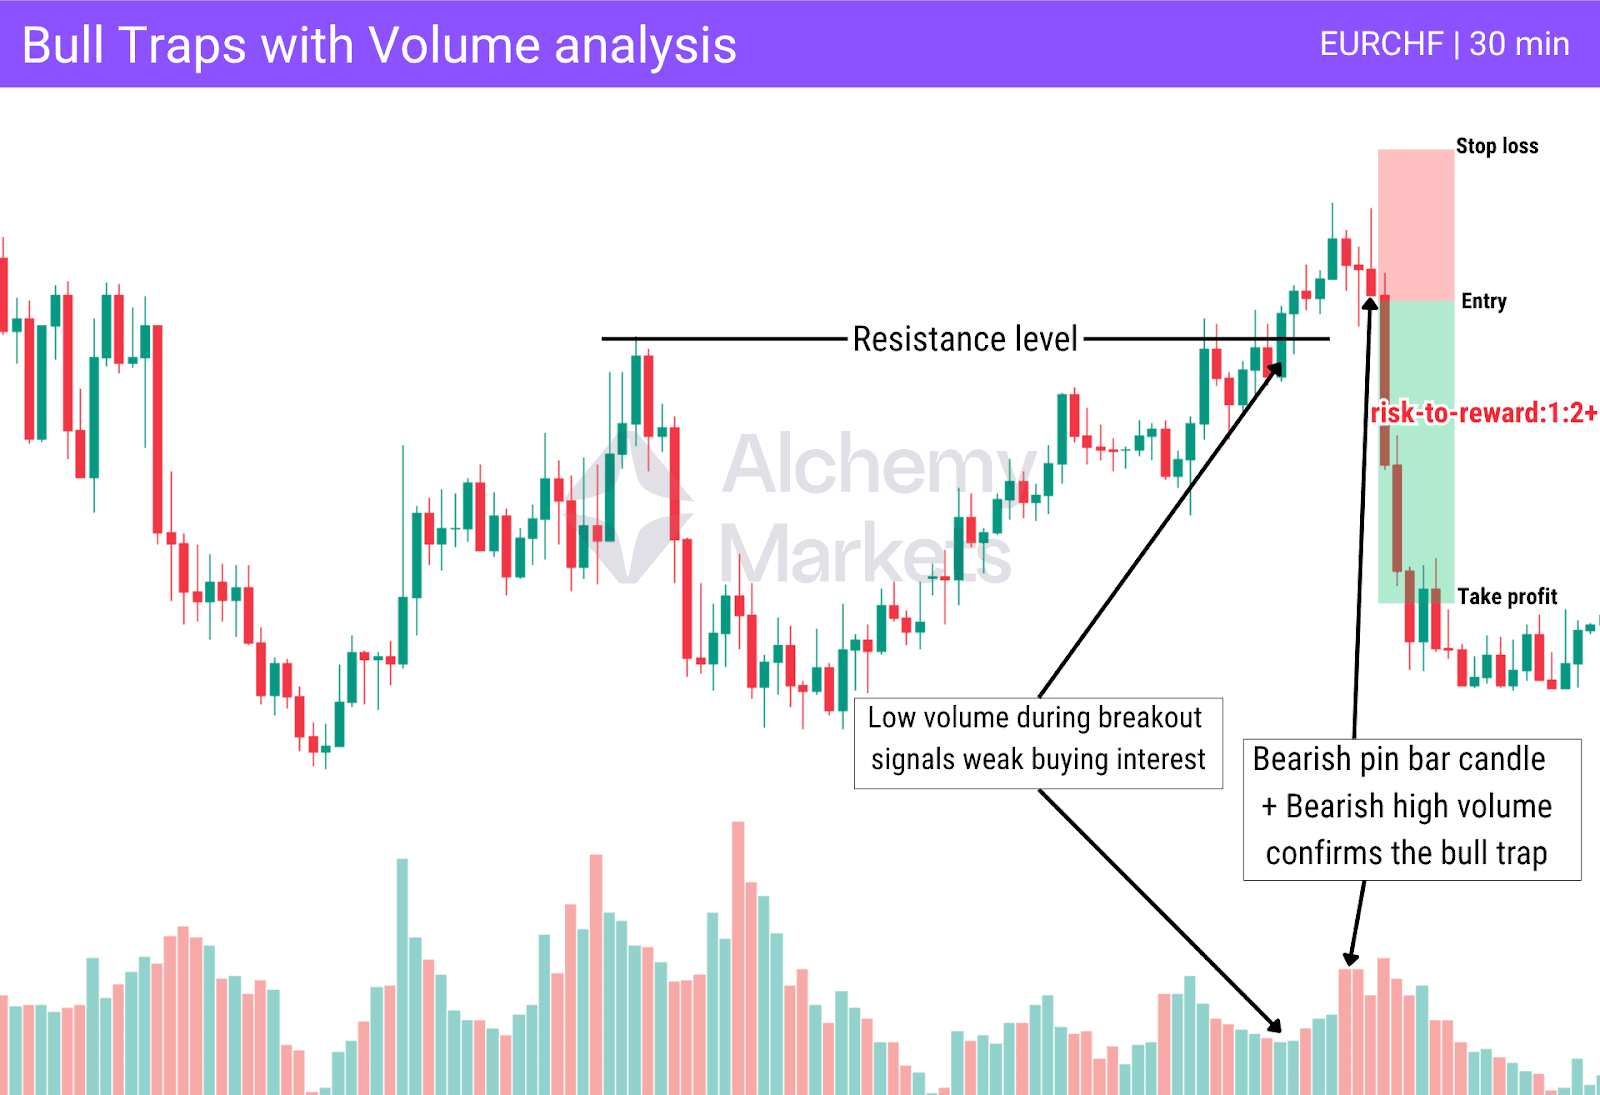
Entry Criteria
- Wait for price to break above a resistance level on low volume, then look for a strong bearish candle to form, ideally with higher selling volume. This confirms that the breakout lacked conviction and signals a potential bull trap.
Stop Loss
- Place your stop just above the high of the bearish rejection candle to protect against further upside.
Take Profit
- Target a key support or demand zone, depending on market structure. You can also monitor volume behaviour, if selling volume fades and buying volume builds, this is often a sign to secure profits and exit the trade.
Bull Traps with RSI
The Relative Strength Index (RSI) is a valuable tool for spotting momentum weakness before a reversal. A classic setup for a bull trap involves bearish divergence, when price makes a higher high but RSI forms a lower high, indicating that buying pressure is fading and a bearish move may be approaching.
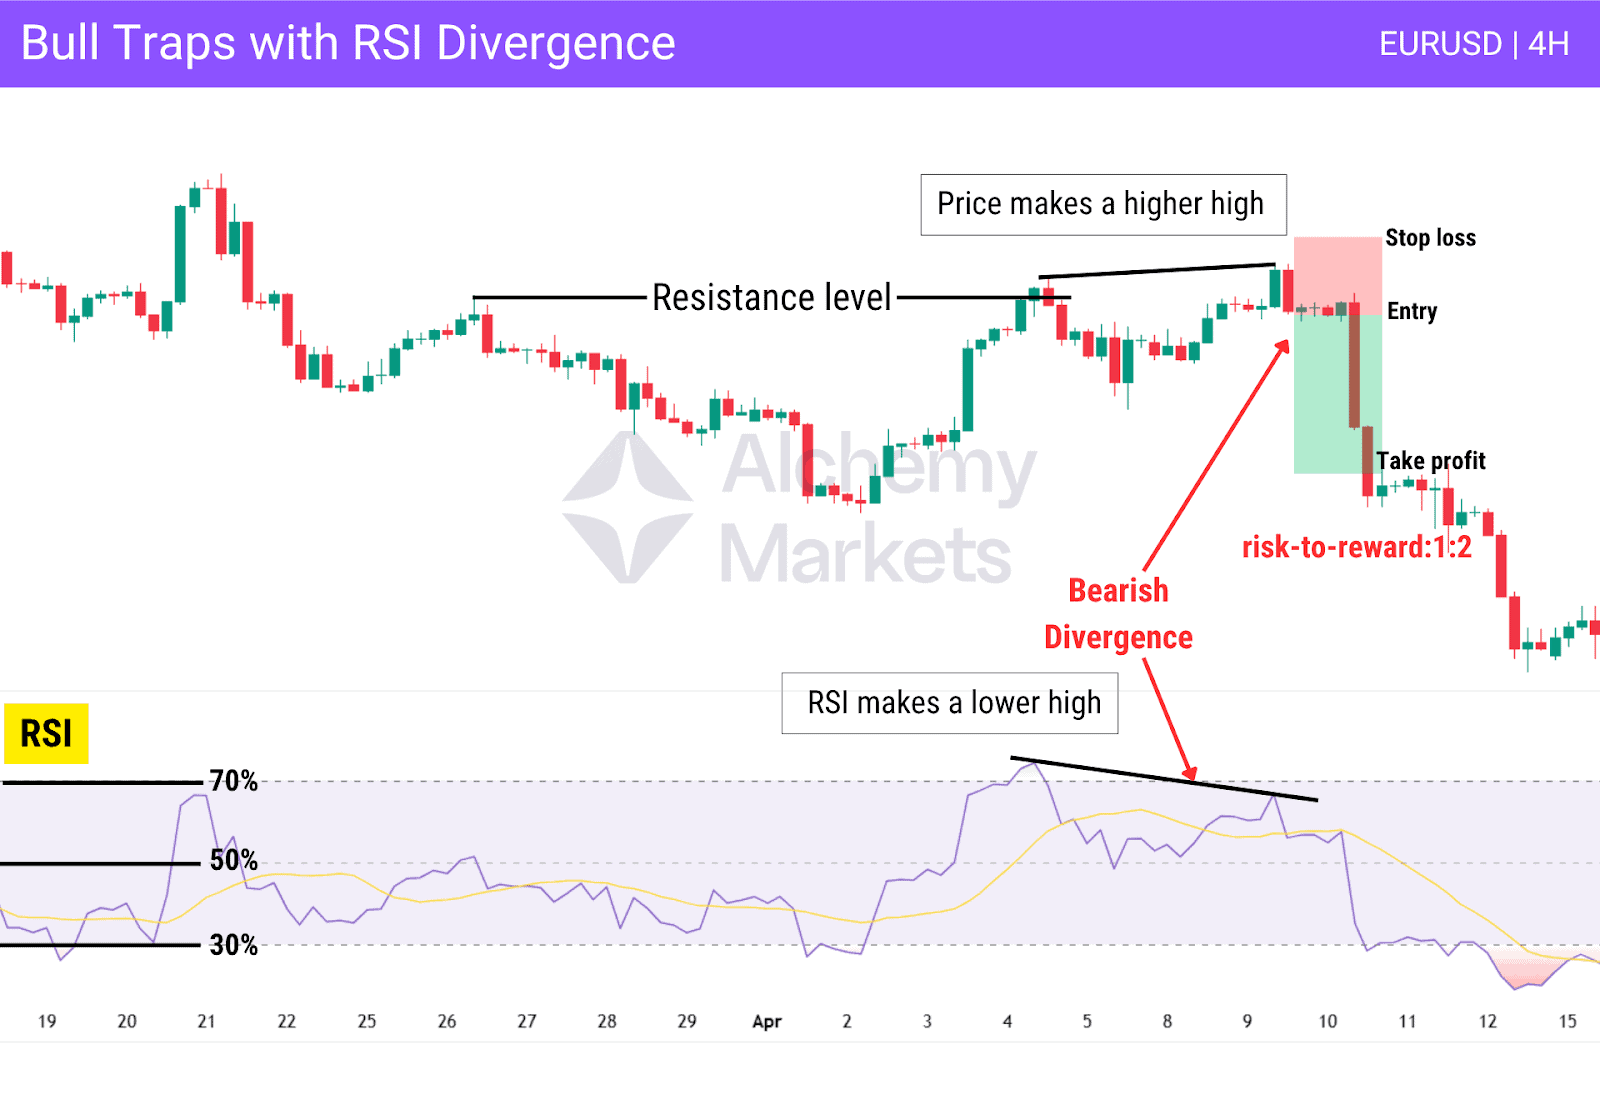
Entry Criteria
- Wait for price to break above resistance and form a higher high, while RSI forms a lower high. This divergence signals weakening momentum behind the breakout. Enter short after a clear bearish rejection candle confirms the trap near the resistance level.
Stop Loss
- Place your stop just above the high of the bearish rejection candle to protect your position.
Take Profit
- Target the nearest swing low or a clearly defined support level where price is likely to react.
RSI Conditions
- Ideally, RSI should be above 70 during the breakout, indicating an overbought market. A bull trap becomes more likely when RSI fails to make a new high and starts turning lower as the setup unfolds.
Additional Confirmation
- Consider using tools like volume, MACD, or the Money Flow Index (MFI) to strengthen the setup through divergence analysis and improve the reliability of the trade.
Bull Traps with Moving Averages
Moving Averages (MAs) or Exponential Moving Averages (EMAs) often act as dynamic resistances in trending markets. A bull trap can occur when price temporarily breaks above a moving average, only to reverse and close back below it, trapping breakout buyers. This setup often signals a selling opportunity aligned with the dominant trend, especially when confirmed by bearish price action.
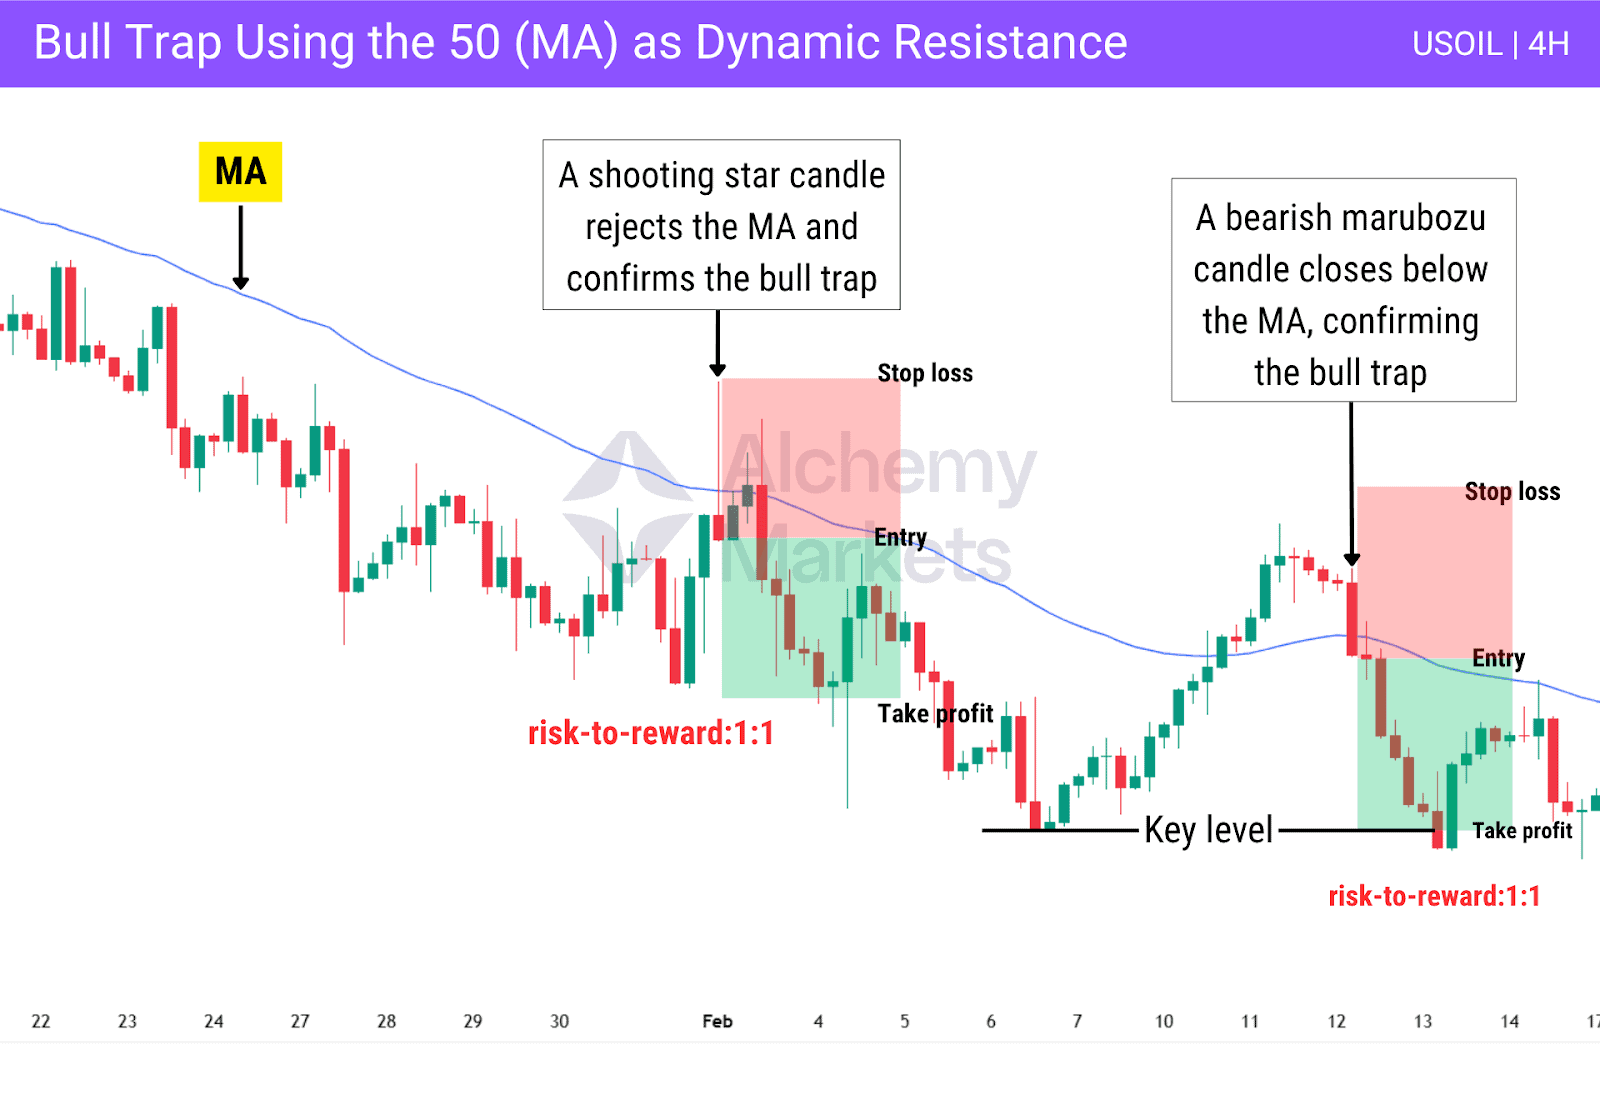
Entry Criteria
- Enter short when price fails to hold above a sloping 50 or 200-period moving average and a bearish candle closes back below the moving average. This confirms that the breakout attempt has failed.
Stop Loss
- Place your stop just above the high of the bearish confirmation candle to protect against further upside.
Take Profit
- Target the most recent swing low as your take-profit level.
Additional Notes
- This setup works best in clearly trending markets, where moving averages align with the dominant trend and provide reliable signals through clean price rejections.
Bull Traps with Candlestick Analysis
Candlestick patterns offer powerful insight into market sentiment. While they help detect trends, they can also mislead impulsive traders as shown in this example. Strong bullish candles often give the impression that the market is reversing upward, encouraging premature long entries. But when followed by bearish rejection near resistance, they often signal a bull trap. Patterns like pin bars, engulfing candles, or shooting stars confirm buyer exhaustion and trap setups.

Entry Criteria
- Look for a bearish candlestick pattern at or just above resistance, such as a bearish engulfing or pin bar. For additional confirmation, wait for a bearish candle to close below the resistance level to confirm the rejection and signal a likely reversal.
Stop Loss
- Set your stop just above the wick of the bearish rejection candle to protect against price moving higher.
Take Profit
- Target the recent swing low with a risk-to-reward ratio around 1:2.
Advantages of Trading on the Bull Traps
Trading bull traps can offer high probability setups when timed correctly. They allow traders to take advantage of false breakouts and catch opportunities both with the trend and against it during retracements. Bull traps are useful in short term and long term trading strategies, especially when supported by other tools and analysis.
Clear risk management
Bull traps often form around key resistance levels, making it easier to define stop loss placement just above the trap high.
Good reward potential
Since bull traps typically lead to aggressive price reversals, traders can target multi-R multiples by riding the momentum back down.
Fast setups
Bull traps often trigger immediate declines, reducing waiting time for confirmation or extended drawdowns.
Versatility
These setups appear across all financial markets including forex, indices, crypto and stocks. They can also be found across multiple time frames, offering plenty of trading opportunities for different styles and strategies.
Works well with other tools
Bull traps become even more powerful when combined with volume analysis, RSI divergence, or candlestick patterns.
Many traders use bull traps as part of a broader trading strategy to capitalise on false breakouts and sudden reversals, both in trending and range-bound conditions.
Disadvantages of Trading on the Bull Traps
While profitable, trading bull traps comes with certain risks. If misread, the setup can lead to early entries or getting caught on the wrong side of the market.
False identification
Not every breakout failure is a true bull trap. Traders may confuse natural pullbacks or pauses with legitimate trap setups.
Tight stop losses
Because bull traps often require placing stops just above recent highs, there is a higher chance of being wicked out by volatility.
Requires experience
Accurately reading price action, key support and resistance levels, and volume context takes time and practice. New traders may find it difficult to recognise the trap in real time.
Limited entry window
The bearish reversal after the trap often develops quickly. Traders must act decisively to avoid missing the opportunity.
Not suited for all conditions
Bull traps are more common in bear markets or periods of high volatility. In low volume environments, they are more difficult to spot and confirm.
Being aware of these limitations helps traders set realistic expectations and avoid unnecessary losses when executing bull trap strategies.
Bull Trap vs Bear Trap
Bull and bear traps are false breakout patterns that mislead traders into entering positions in the wrong direction. Both exploit emotion, overconfidence, and poor confirmation at key price levels.
A Bull Trap gives the impression of a breakout to the upside, luring in long buyers before the price reverses lower. A Bear Trap does the opposite, creating a false breakdown that tricks sellers before price moves back up.
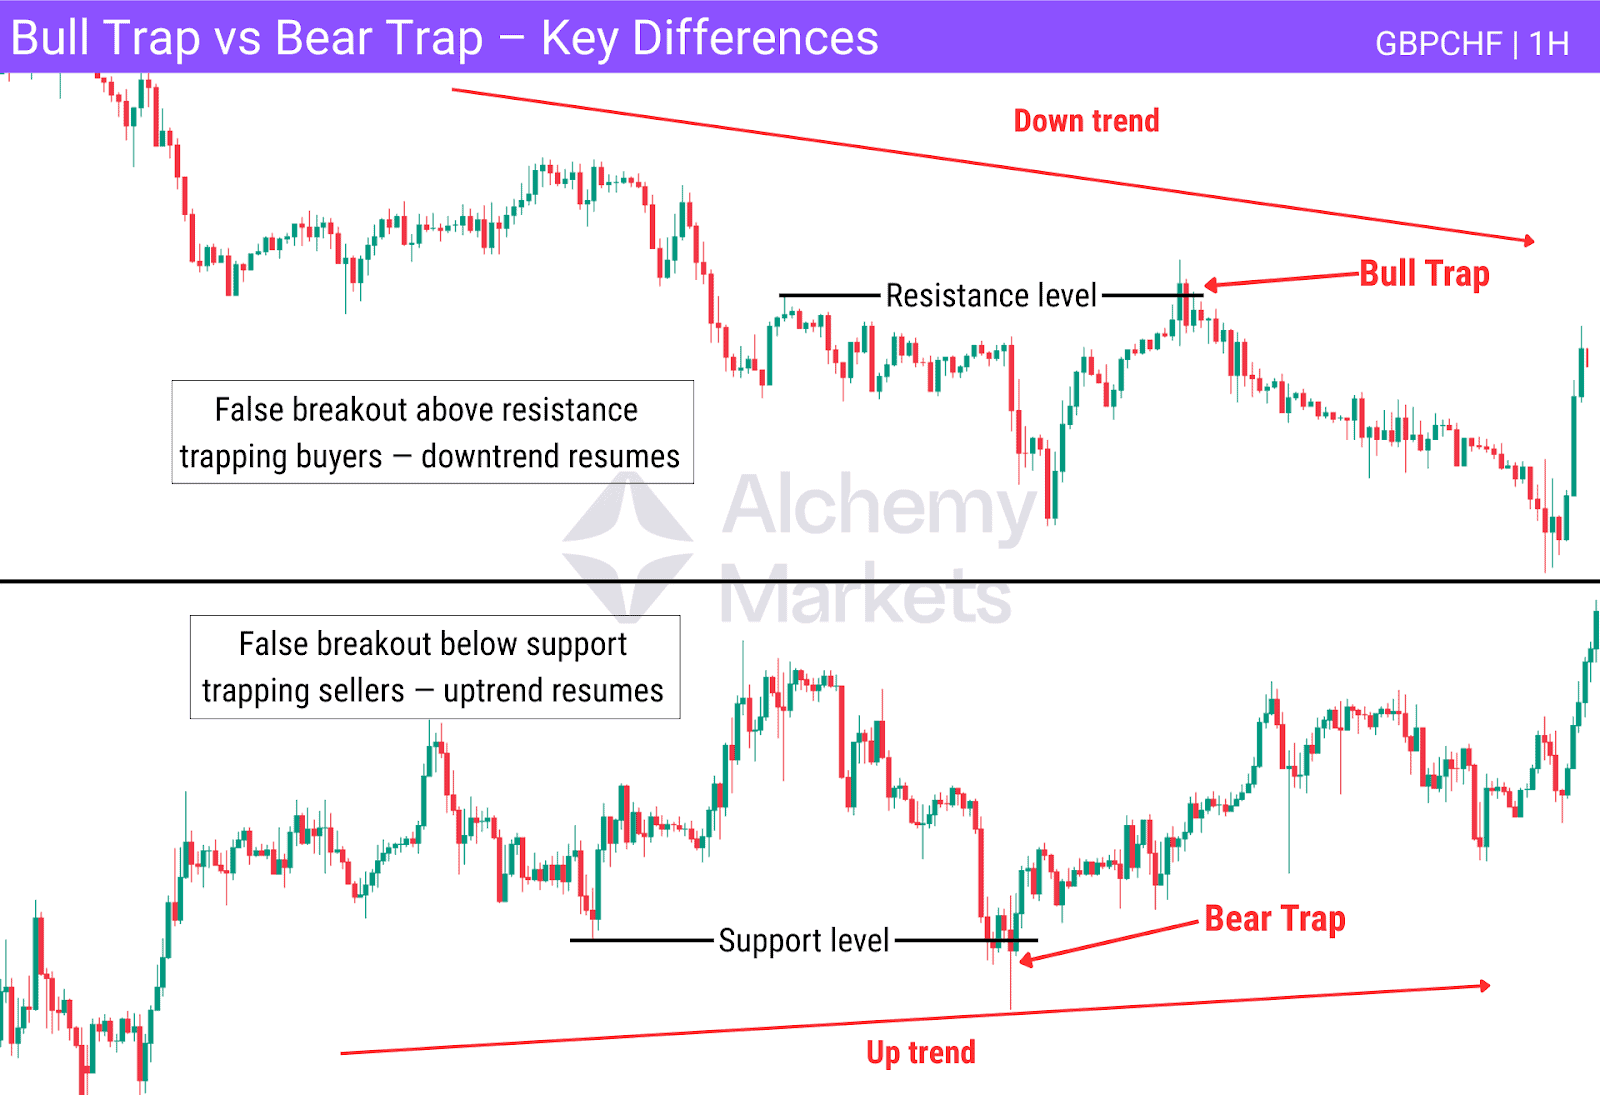
| Bull Trap | Bear Trap |
| Forms near resistance | Forms near support |
| Fakes a breakout above a key resistance | Fakes a breakdown below a key support |
| Traps long buyers | Traps short sellers |
| Often leads to a sharp decline | Often leads to a strong rally |
| More common and effective in downtrends, but can also occur in uptrends during corrections or overbought conditions | More common and effective in uptrends, but can also occur in downtrends during pullbacks or oversold conditions |
Recognising the broader market context and using proper confirmation tools is essential to avoid being trapped, or to capitalise on these setups effectively.
Bull Trap vs. Legitimate Bullish Move
Understanding the difference between a bull trap and a genuine breakout is essential for avoiding false entries and trading with confidence.
A Legitimate Bullish Move shows strength, sustained momentum, and healthy volume often signalling a potential shift into an uptrend. In contrast, a Bull Trap may appear convincing at first but lacks real strength and momentum, leading to a quick reversal that traps long traders.
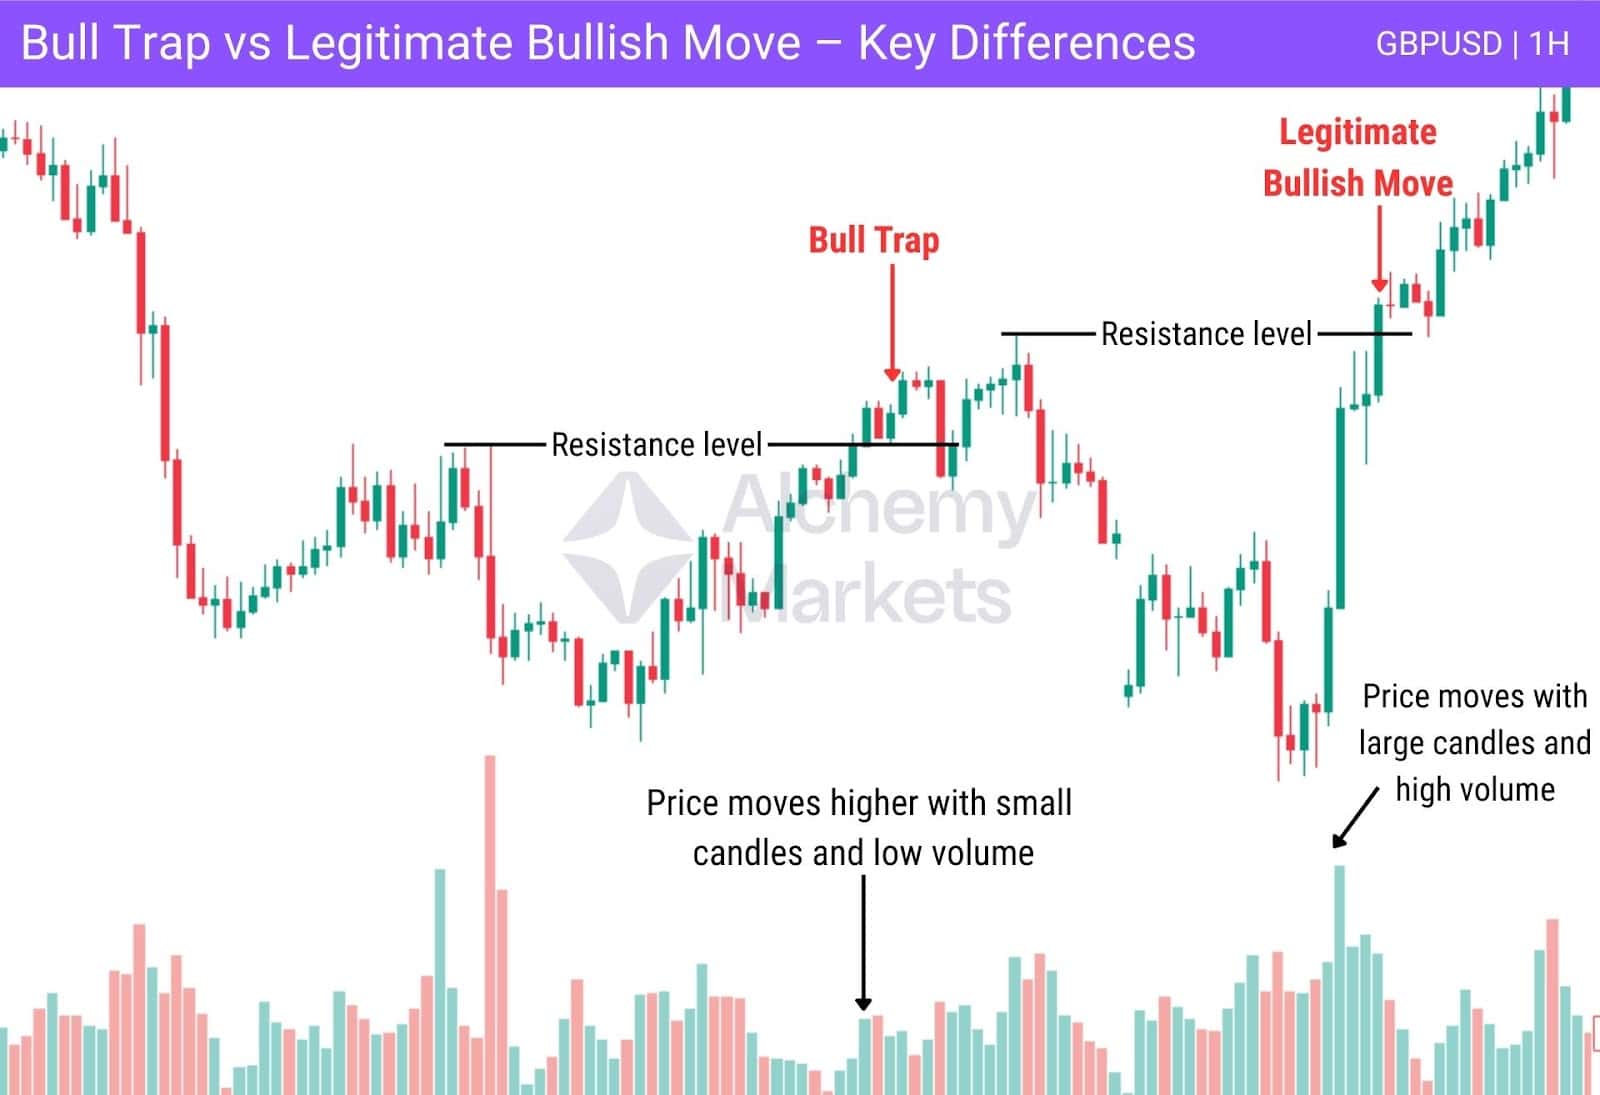
| Key Factor | Legitimate Bullish Move | Bull Trap |
| Volume | Volume expands during and after the breakout | Volume is often low or spikes only during the breakout then decrease |
| Structure | Old resistance is retested and holds as new support | Price quickly drops back below resistance without holding gains |
| Momentum | RSI and other indicators support the breakout with continued strength | RSI may show bearish divergence or overbought conditions |
| Candlestick Clues | Bullish candles close above resistance with strong bodies | A small candle breaking above resistance, or a rejection wick, signals weak buyer momentum. |
By learning to spot these distinctions, traders can avoid false breakouts and focus on high quality setups supported by confirmation and market structure.
Bull Trap vs Dead Cat Bounce
Bull traps and dead cat bounces can both mislead traders into taking positions against the dominant trend, but they occur in different contexts and follow distinct price behaviours.
A Bull Trap is a false breakout above resistance that quickly fails and reverses lower, trapping breakout buyers.
A Dead Cat Bounce is a temporary recovery during a strong downtrend that creates the illusion of a reversal before the bearish trend resumes.
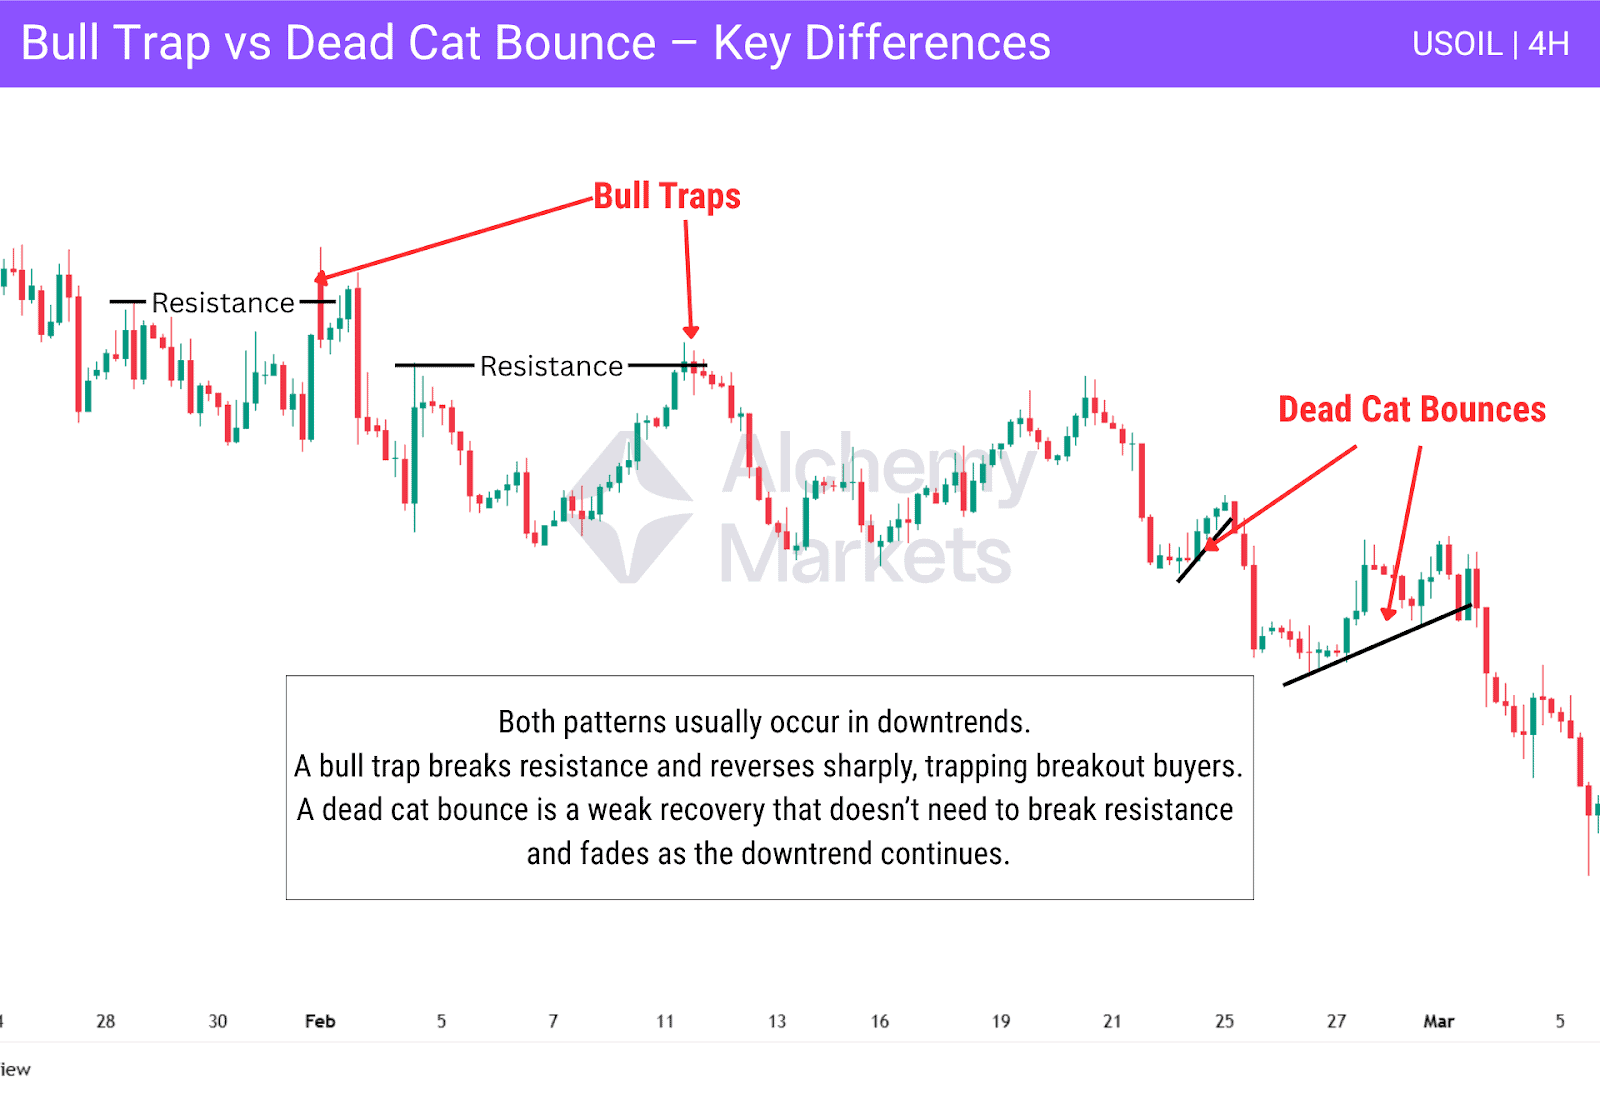
| Aspect | Bull Trap | Dead Cat Bounce |
| Pattern Structure | Breaks above resistance, then quickly reverses | Gradual rise into supply zones, previous breakdown areas, or fair value gaps, often rejected before the downtrend resumes. |
| Context | Forms near resistance in downtrends or bear markets | Occurs after sharp drops, often triggered by negative news or overselling |
| Trader Behaviour | Traps breakout buyers chasing bullish momentum | Traps reversal traders expecting a full recovery |
| Reversal Speed | Sharp rejection after the breakout fails | Slow fade as selling pressure returns |
Both patterns highlight the risk of ignoring trend direction. Understanding them helps traders avoid unnecessary losses and enter opportunities allied with the overall trend.
FAQs
When Do Bull Traps Most Commonly Occur?
Bull traps often occur around areas where liquidity rests above previous highs, regardless of the broader market bias. While they are common during downtrends or bear markets, they can also appear within ranges or even uptrends. Typically, price briefly breaks above a key resistance or prior high, triggering breakout entries before sharply reversing and trapping the buyers.
What Is a Bull Trap Rally?
A bull trap rally is a short-lived upward move that mimics a breakout or trend reversal but lacks follow-through. These rallies often occur on low volume and end with aggressive sell-offs, trapping long traders at unfavourable prices.
What Are the Common Bull Trap Mistakes to Watch Out For?
- Entering breakouts without confirmation
- Ignoring volume as a confirmation tool
- Reacting to every breakout as valid
- Placing wide or poorly positioned stop losses
- Overexposing risk on uncertain setups
Avoiding these mistakes requires patience, a defined strategy, and the ability to read price action in context.
What is the Psychology Behind Bull Traps?
Bull traps exploit emotional triggers like FOMO and hope. When price breaks above a resistance level, traders rush to buy, thinking a new uptrend has begun. Large players may use this surge in liquidity to enter short positions. Once buying pressure fades, the reversal leaves long traders trapped, often triggering panic selling.
Are Bull Traps Bullish or Bearish?
A bull trap is bearish in outcome. Although it starts with an upward move, the failure to sustain above resistance and the rapid reversal confirm bearish control. It traps buyers and often signals further downside continuation.
Can I Find Bull Traps in All Markets?
Yes. Bull traps occur across forex, stock market, crypto, indices, and other financial markets. Any market where traders respond to price levels and breakout patterns can form bull traps. The key is understanding the market context, especially trend direction and volume.
What Is a Bull Trap in Stocks?
In stocks, a bull trap happens when price breaks above a prior high or resistance level, triggering long entries. The breakout quickly fails and reverses, often after earnings reports or news-driven spikes. The reversal traps bullish traders and leads to declines.
What Is a Bull Trap in Crypto?
Crypto bull traps are common due to volatility and sentiment-driven trading. Price may break above resistance with weak volume, encouraging long positions. When price reverses, short sellers take control. These traps are often amplified by hype or misleading signals on lower time frames.
How does a Bull Trap Affect Retail Traders?
Retail traders are frequently caught in bull traps because they chase breakouts without waiting for confirmation. When the reversal hits, many close at a loss or hold onto bad trades. This can lead to emotional decision-making or revenge trading. Bull traps highlight the importance of risk control, patience, and trading with confirmation.


