Written by:

Reviewed by:

Bullish
- August 29, 2024
- 25 min read
Three White Soldiers: Key Characteristics and Strategies

What is the Three White Soldiers Candlestick Pattern?
The three white soldiers is a bullish reversal candlestick pattern that signals a potential end of the ongoing downtrend. This pattern is composed of three consecutive long-bodied bullish candles that close progressively higher each time. This successive surge in price reflects growing buying pressure as the asset is seen as a “bargain” or very cheap at its current price level.
What Does the Three White Soldiers Tell You?
The three white soldiers chart pattern indicates that the bearish market sentiment driving the asset’s price down is diminishing and possibly shifting into a new bullish trend. This shift can be attributed to “bargain hunting,” where buyers overwhelm sellers because they believe the asset is worth much more than its current trading price. Hence, this results in a significant price increase within just three trading sessions.
How to Identify the Three White Soldiers Pattern?
Chart patterns, such as the three white soldiers, are important in technical analysis for identifying potential buying opportunities for developing new bull trends. Due to its simple characteristics, the three white soldiers bullish candlestick formation can be easily spotted on a chart. Practically, it’s just three consecutive relatively long bullish candles—either green or white, depending on your chart settings—that close at a higher price each time.
Note: The three candles must form during a downtrend to be considered a three white soldiers pattern and serve as a bullish reversal signal. Otherwise, if the three candles form during an uptrend or sideways market period, then they are just three ordinary candles and are NOT considered a Three White Soldiers pattern.
Key Characteristics of Three White Soldiers Pattern
The following are the key characteristics of a three white soldiers pattern:
- The candlestick pattern must occur during a downtrend (or at the end of it if the pattern has been successful as a reversal signal).
- The pattern must have three consecutive bullish candlesticks (in three consecutive trading sessions).
- The first candlestick must be relatively long-bodied, closing above the previous candle’s last price.
- The second and third candles must also be relatively long-bodied and have a higher high and higher low than the previous candlestick.
- All three candles must open above the opening price of the previous candle.
- All three candles preferably have relatively small or no shadows (wicks/tails).
Three White Soldiers Examples
The following are three different examples of the three white soldiers candlestick pattern:
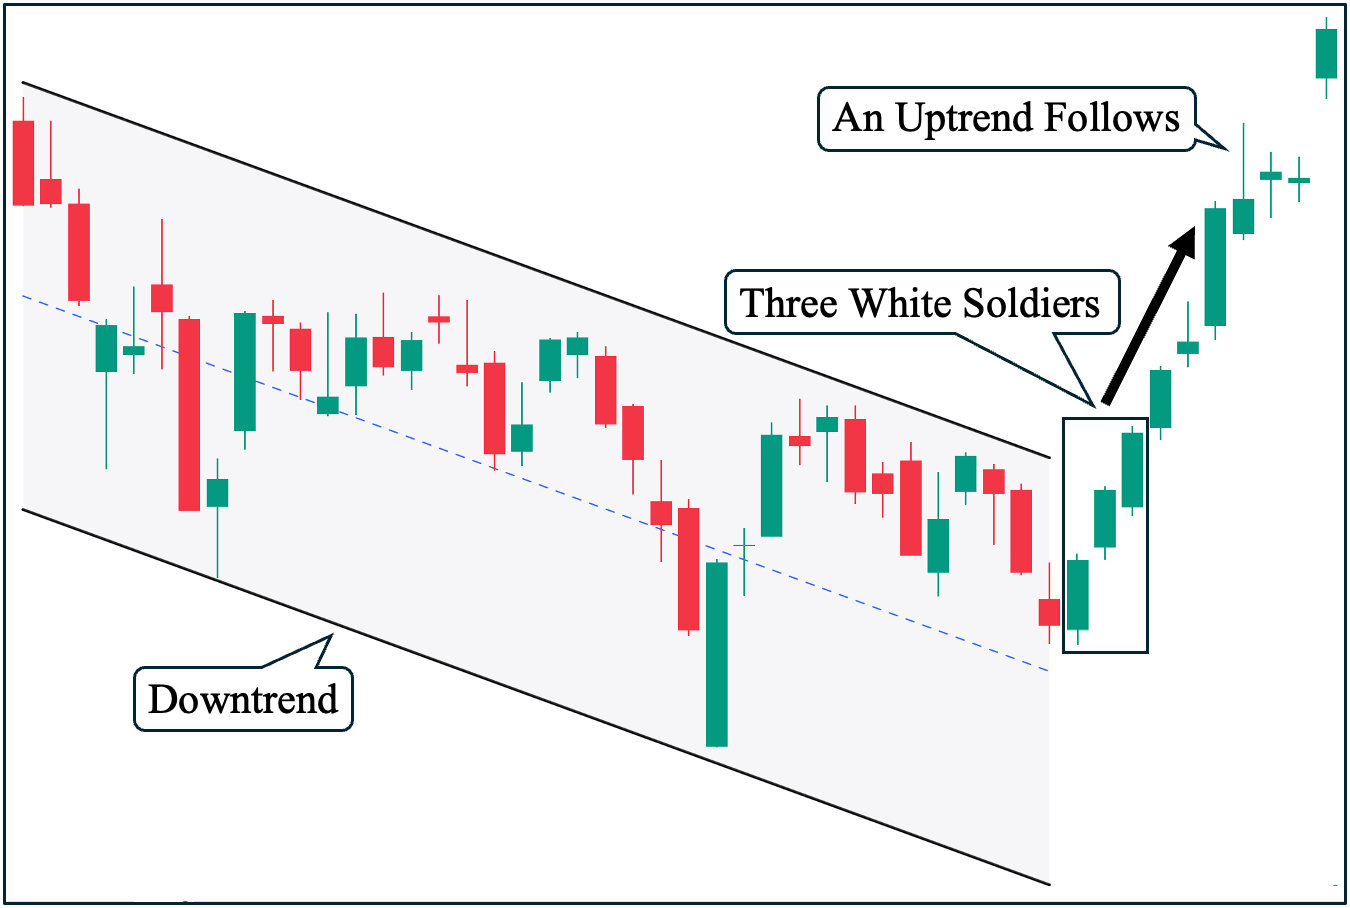
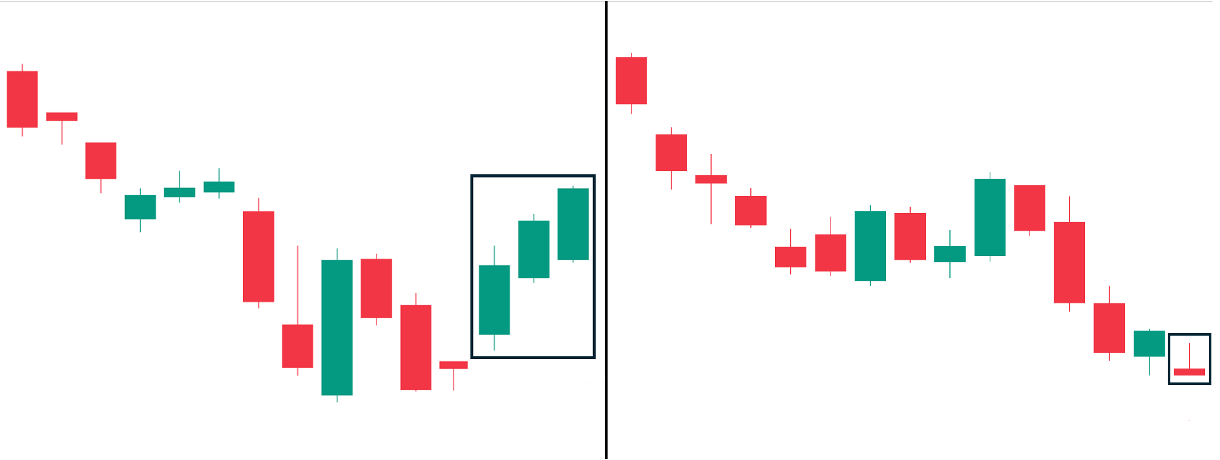
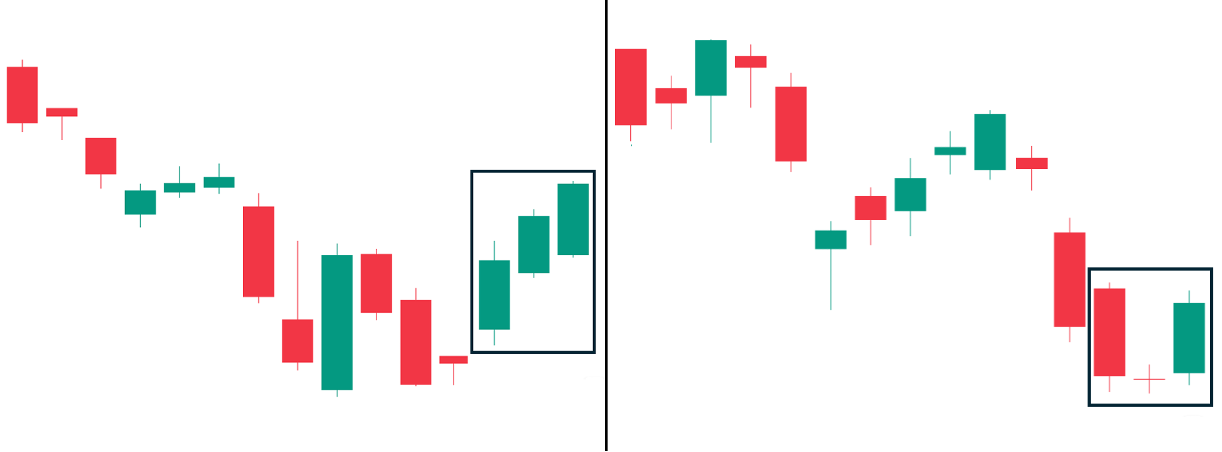
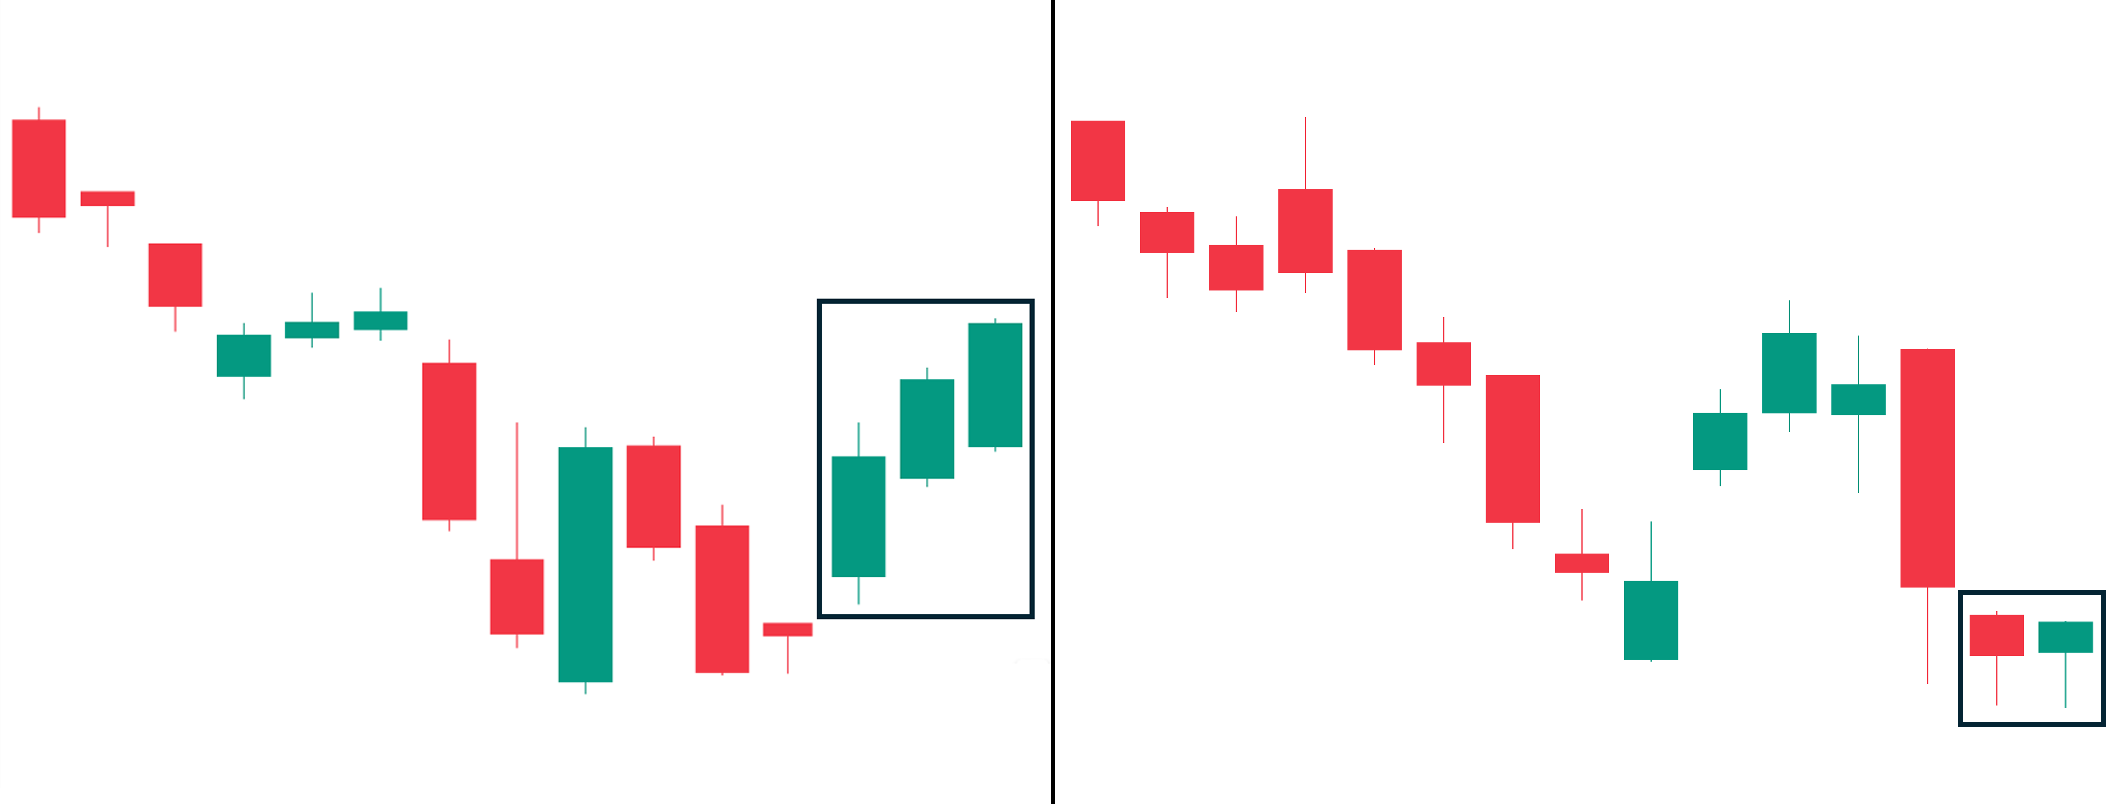
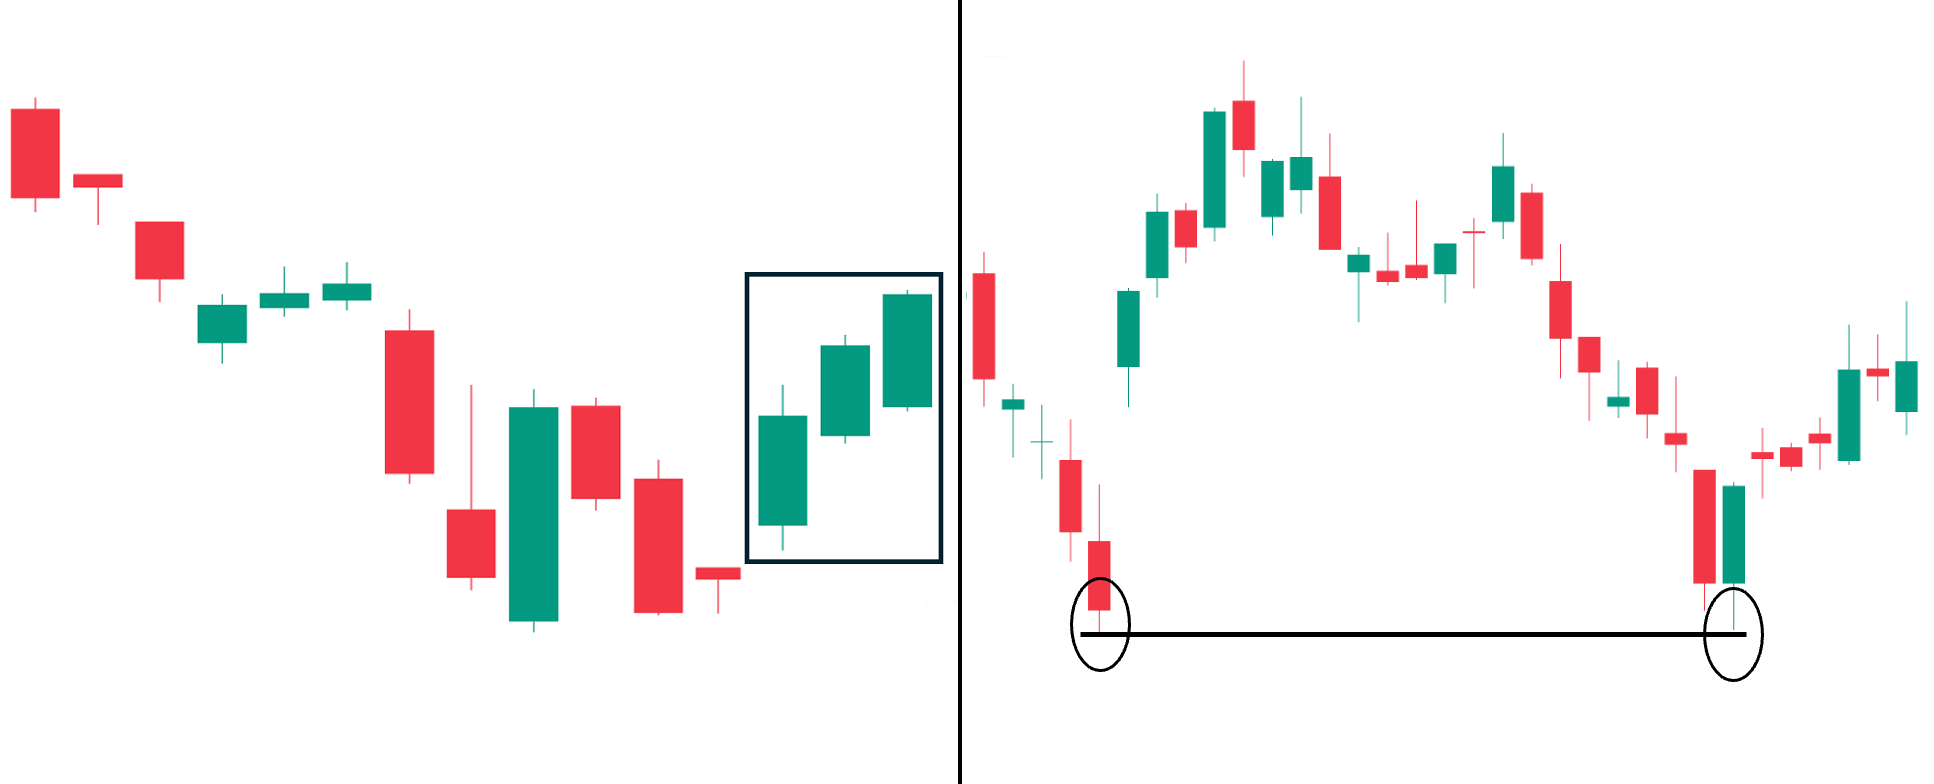
Example #1: Steep Downtrend (Success)
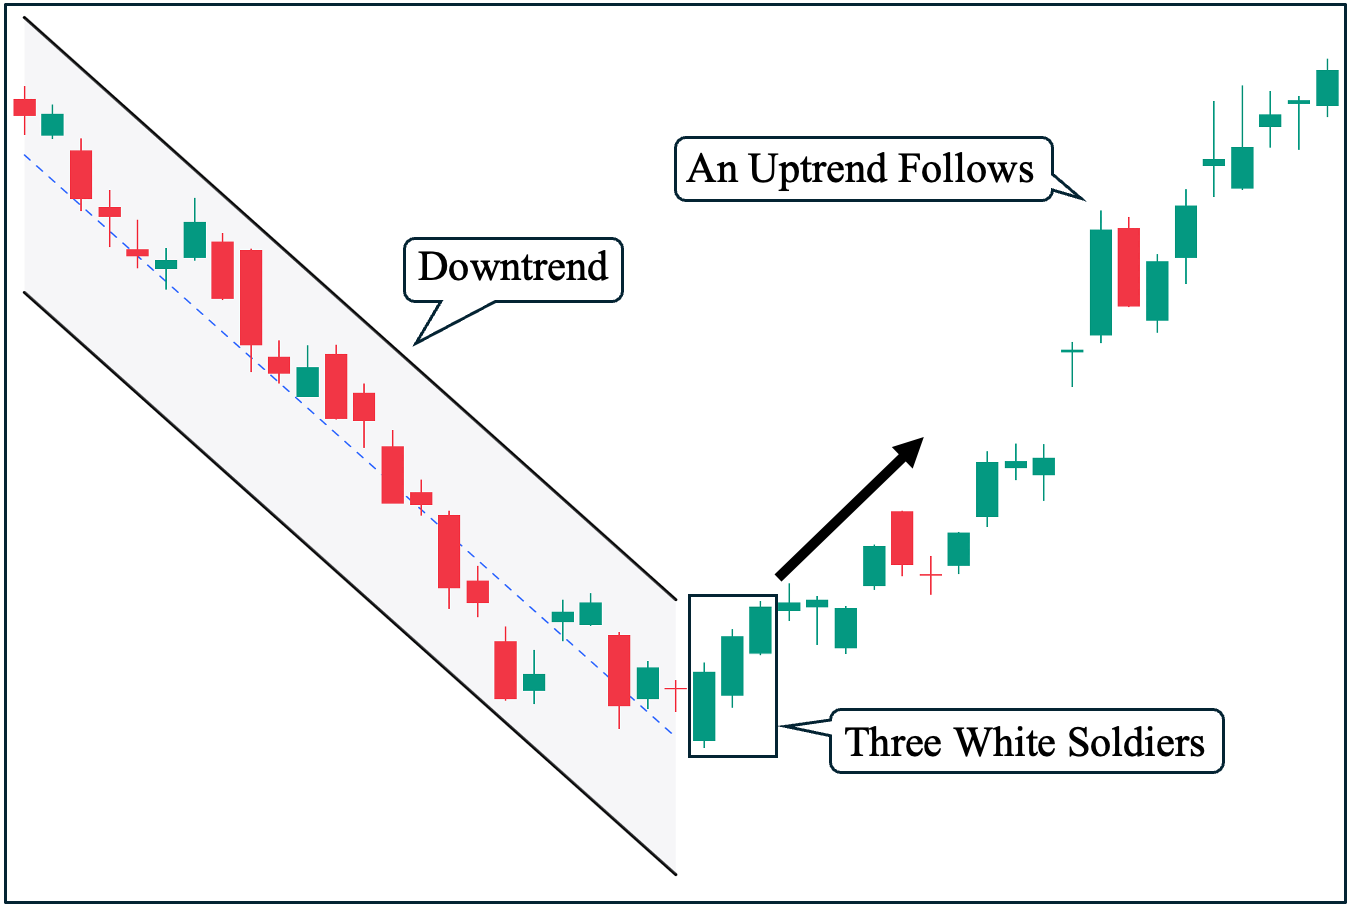
As shown, a steep downtrend—characterized by a significant price decline over a short period of time—was established before the candlestick pattern appears. Afterward, we can observe three consecutive bullish candles forming, which then propelled a strong upward trend to follow. Hence, the three white soldiers has successfully served as a bullish reversal pattern.
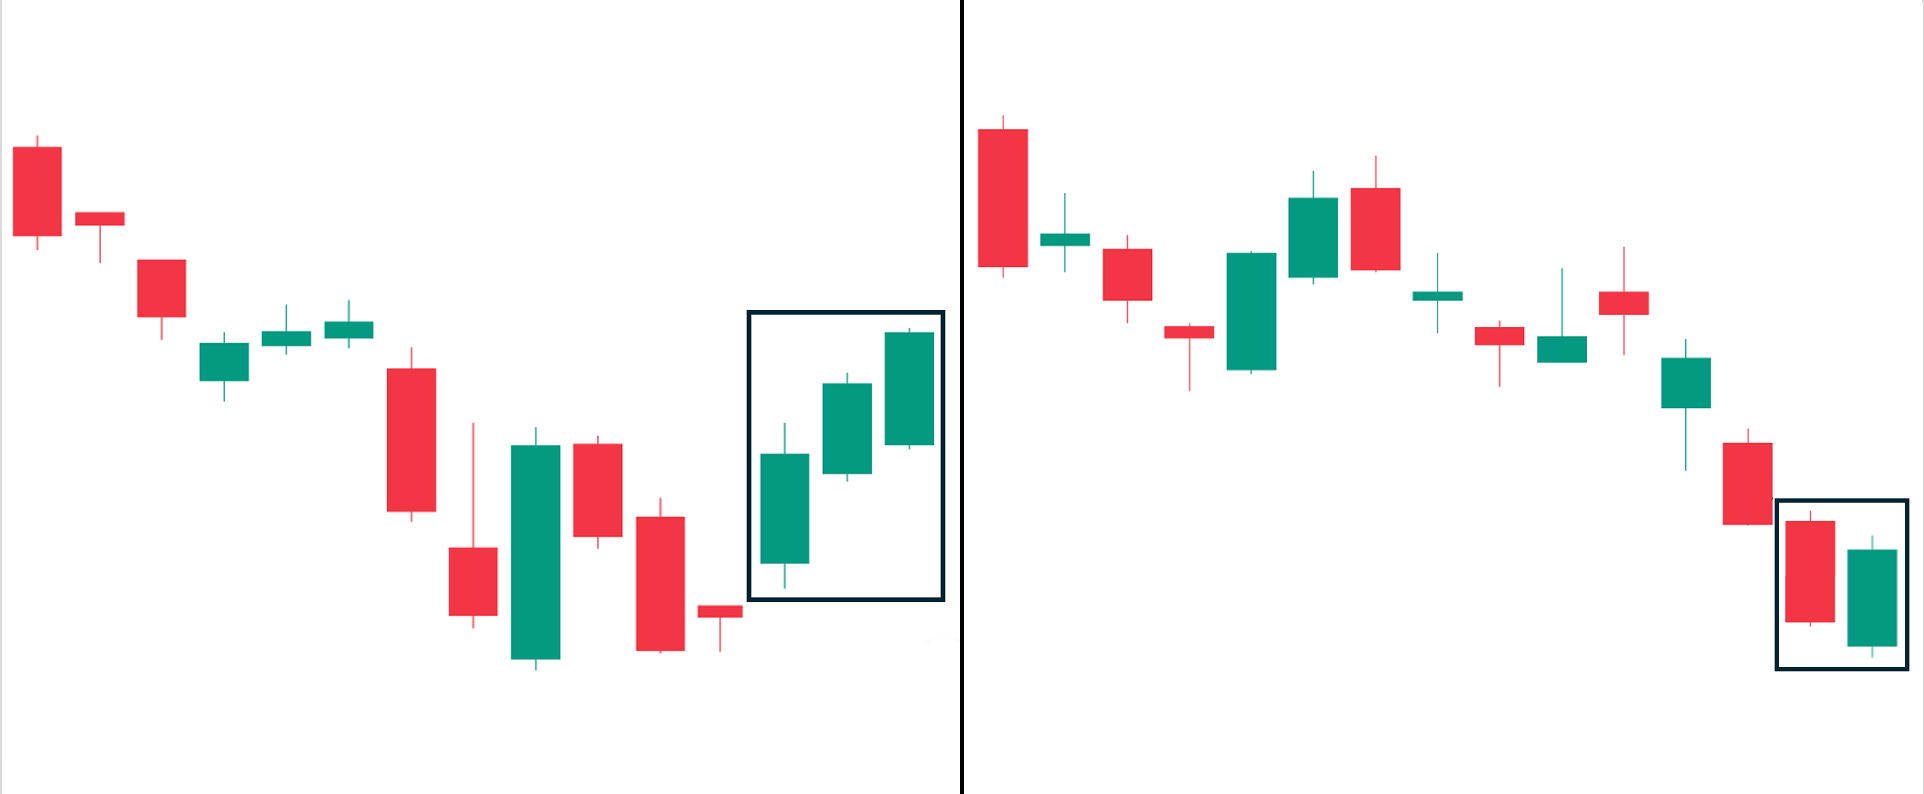
Example #2: Shallow Downtrend (Success)
In this example, a shallow downtrend—characterized by much slower price decline over a period of time—existed before the candlestick pattern appears. Then, we can see the three white soldiers pattern form, leading to an eventual upward trend. Hence, similar to the first example, the three white soldiers has succeeded in serving as a reversal pattern.
Example #3: Failed Set Up
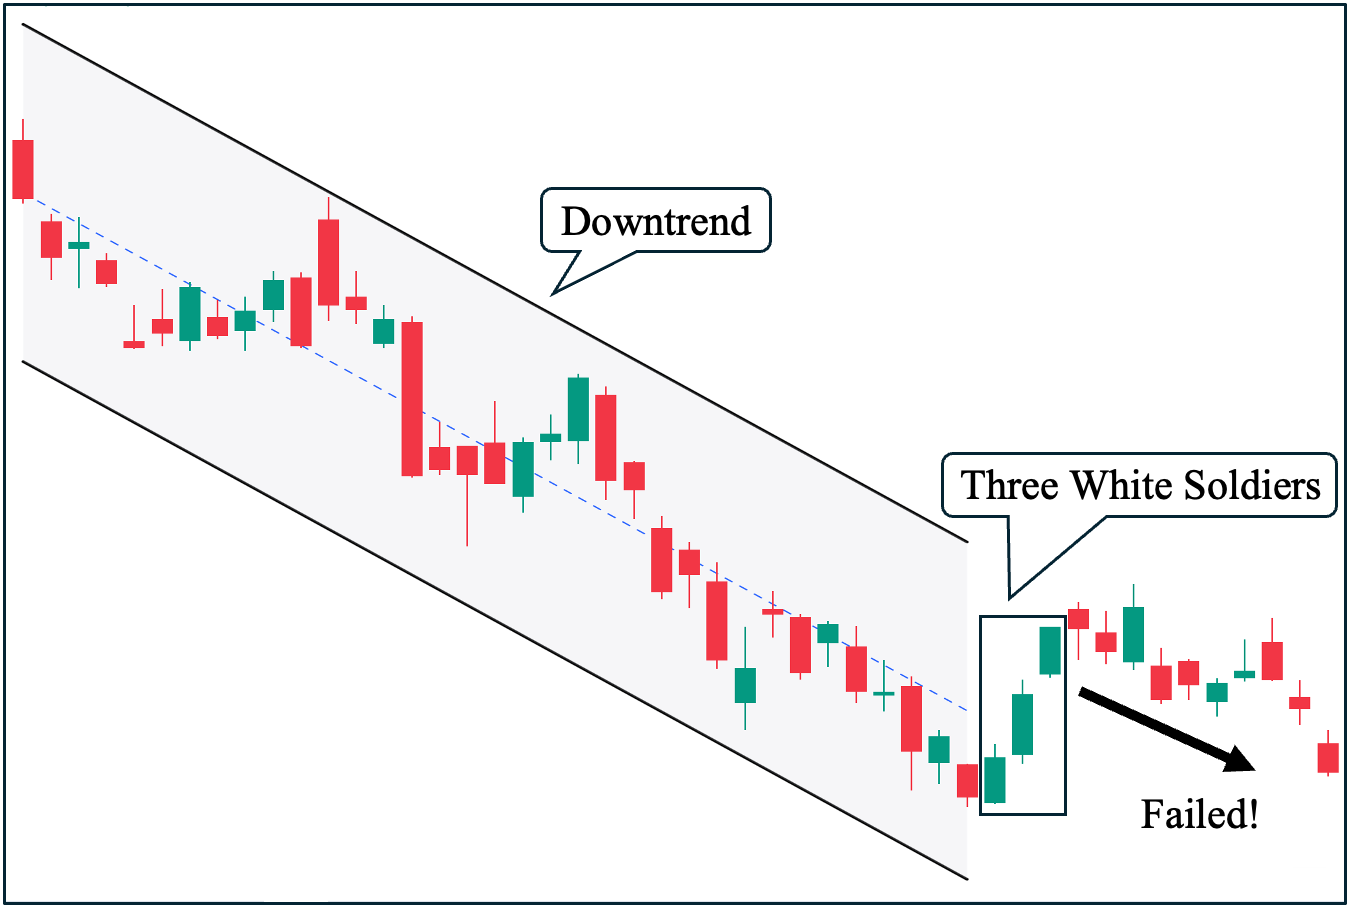
Just like any other candlestick patterns, the three white soldiers pattern is not perfect. In this example, we can see a clear downtrend that preceded the potential bullish reversal pattern. However, after the three white soldiers formed, it failed to serve as a trend reversal pattern and drive an upward trend. Instead, the downtrend eventually continued.
Pro Tip: How to Avoid Failed Set-Ups
First of all, avoiding all potentially unsuccessful set-ups is simply impossible. In fact, despite our utmost due diligence, we cannot guarantee that the market will go our way. However, there is a crucial rule that you need to remember to have higher success with the three white soldiers pattern: prioritize the market structure above any candlestick pattern.
Simply put, it’s vital that you identify the key structural price levels (i.e., major support and major resistance levels plus trend lines) of an asset before acting upon a candlestick pattern—in this case, the three white soldiers. If you take a look at both Example #1 and Example #2, the candlestick pattern has also broken the upper channel line, which serves as a key resistance level of the downtrend. In contrast, in Example #3, the three white soldiers pattern failed to break the channel line and, in fact, was still inside the downtrend channel. Hence, it failed to gain momentum for a potential reversal.
Three White Soldiers Pattern Trading Strategies
The following are different ways to incorporate other technical analysis tools with the three white soldiers pattern:
Three White Soldiers with Relative Strength Index (RSI)
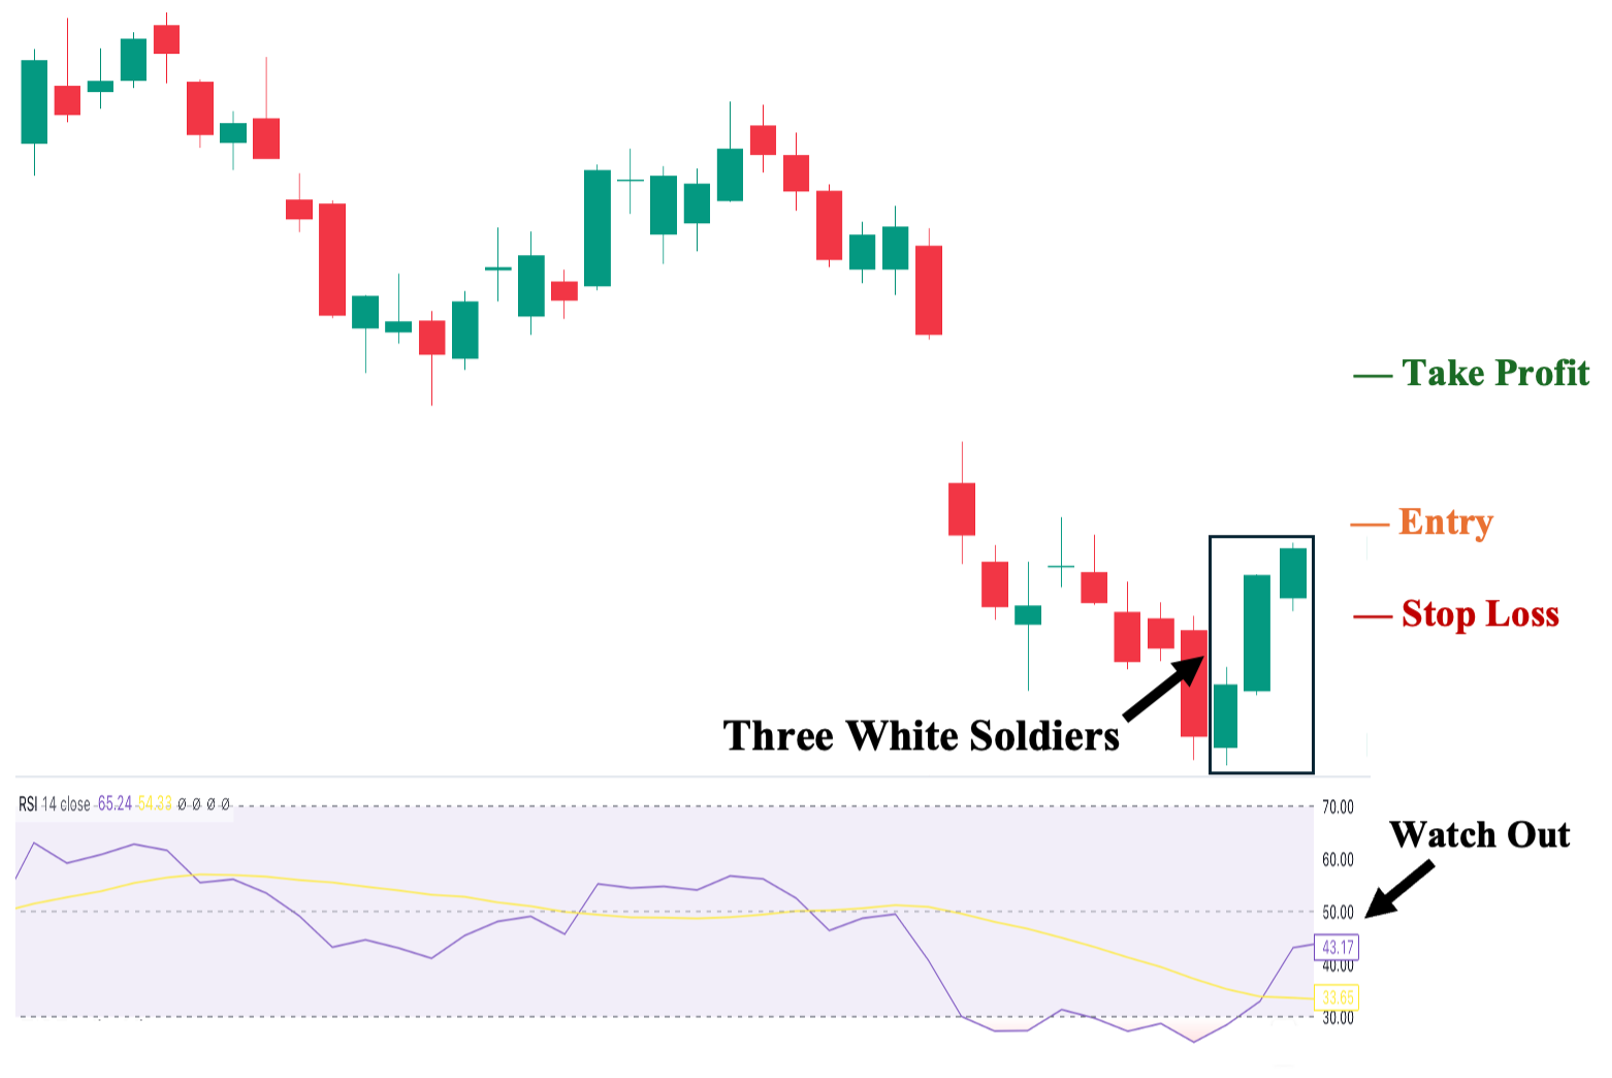
You can use the Relative Strength Index (RSI) indicator with the three white soldiers pattern to help confirm the shift in market sentiment. Therefore, you want the RSI to increase alongside the three white soldiers to confirm the momentum strength of the candlestick pattern. In addition, you can also use it as a “divergence” tool to identify possible mismatches with price action. For example, if the candlestick pattern successfully leads to an upward trend, you can use it to signal when momentum is diminishing—which is likely to lead to the end of an uptrend.
- Suggested Entry: A few ticks above the third candle’s close.
- Take Profit (TP) Level: Set your first TP a few ticks below the nearest structural resistance area. Then, use the RSI as a trailing stop by selling when it diverges from the price action (the price is still going up, but RSI is already pointing down).
- Stop Loss Level: A few ticks below the lowest price of the third candle.
- Risk-Reward Ratio: At least 1:1. We strongly recommend not taking trades with a risk/reward ratio lower than 1:1. The higher the potential reward compared to risk, the better.
Three White Soldiers with Moving Average Convergence/Divergence (MACD)
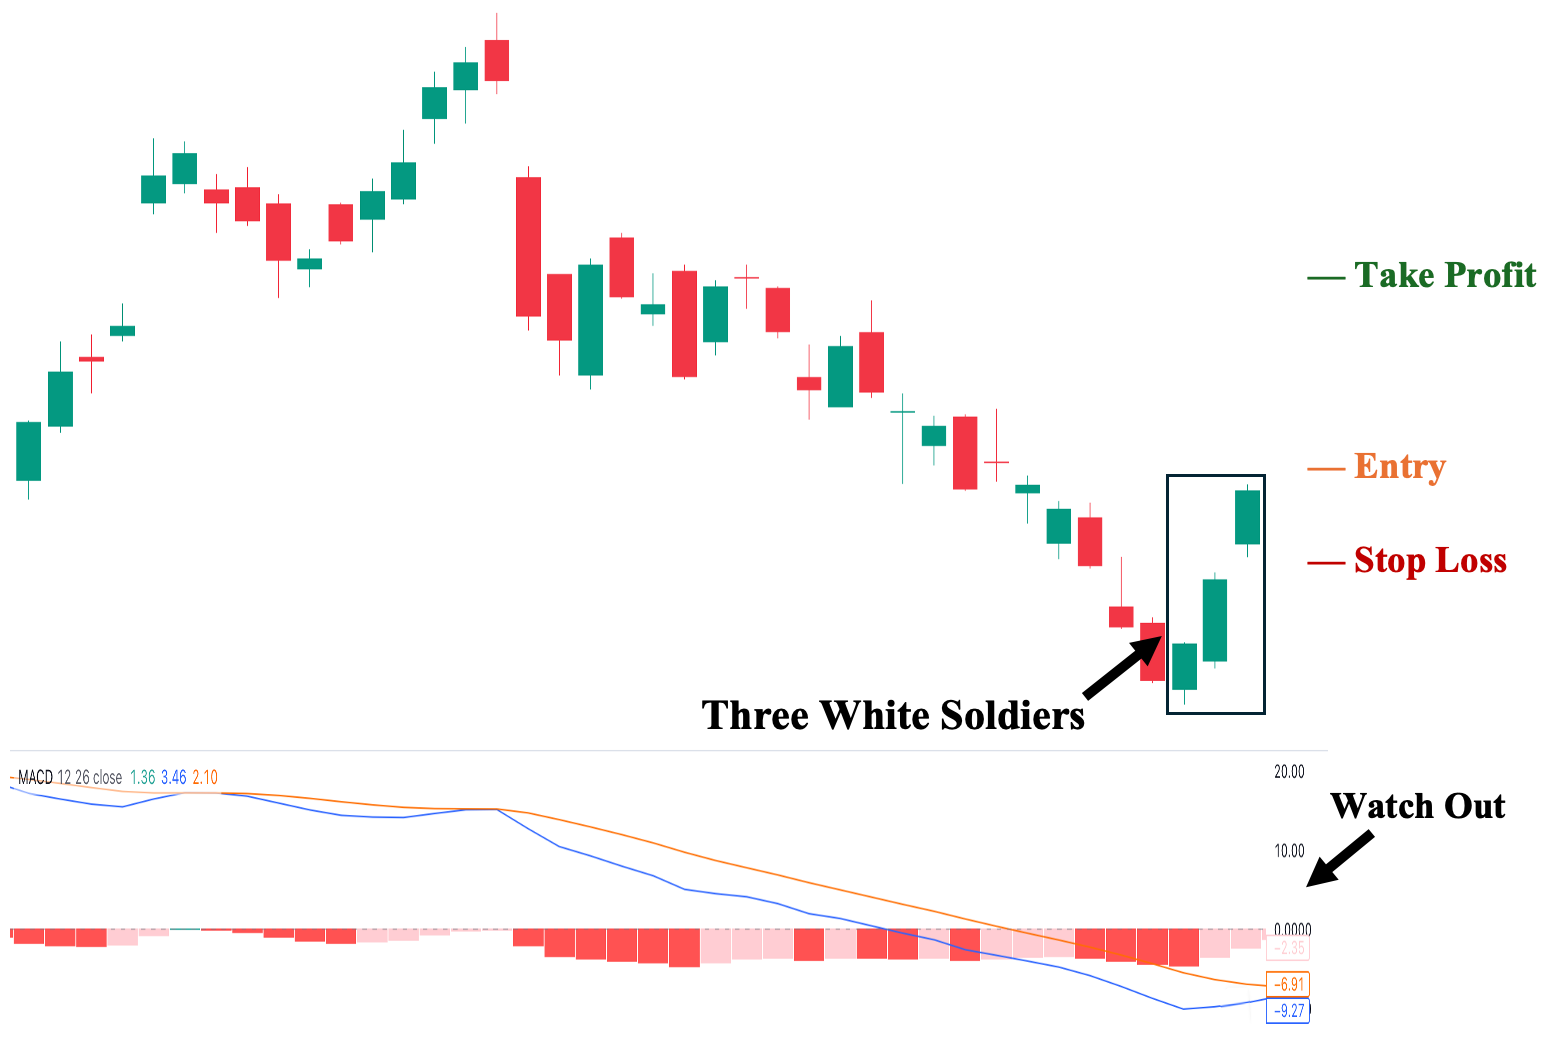
Similar to the RSI, you can use the MACD with the three white soldiers pattern to help identify shifting market sentiment. As shown, there are two lines—the blue and orange lines—you need to pay attention to. There is usually a consequential price action when these two lines cross over.
- Suggested Entry: A few ticks above the third candle’s close.
- Take Profit (TP) Level: Set your first TP a few ticks below the nearest structural resistance area. Then, use the MACD as a trailing stop (consider selling when a crossover occurs).
- Stop Loss Level: A few ticks below the third candle’s low.
- Risk-Reward Ratio: At least 1:1. We strongly recommend not taking trades with a risk/reward ratio lower than 1:1. The higher the potential reward compared to risk, the better.
Three White Soldiers with Bollinger Bands®
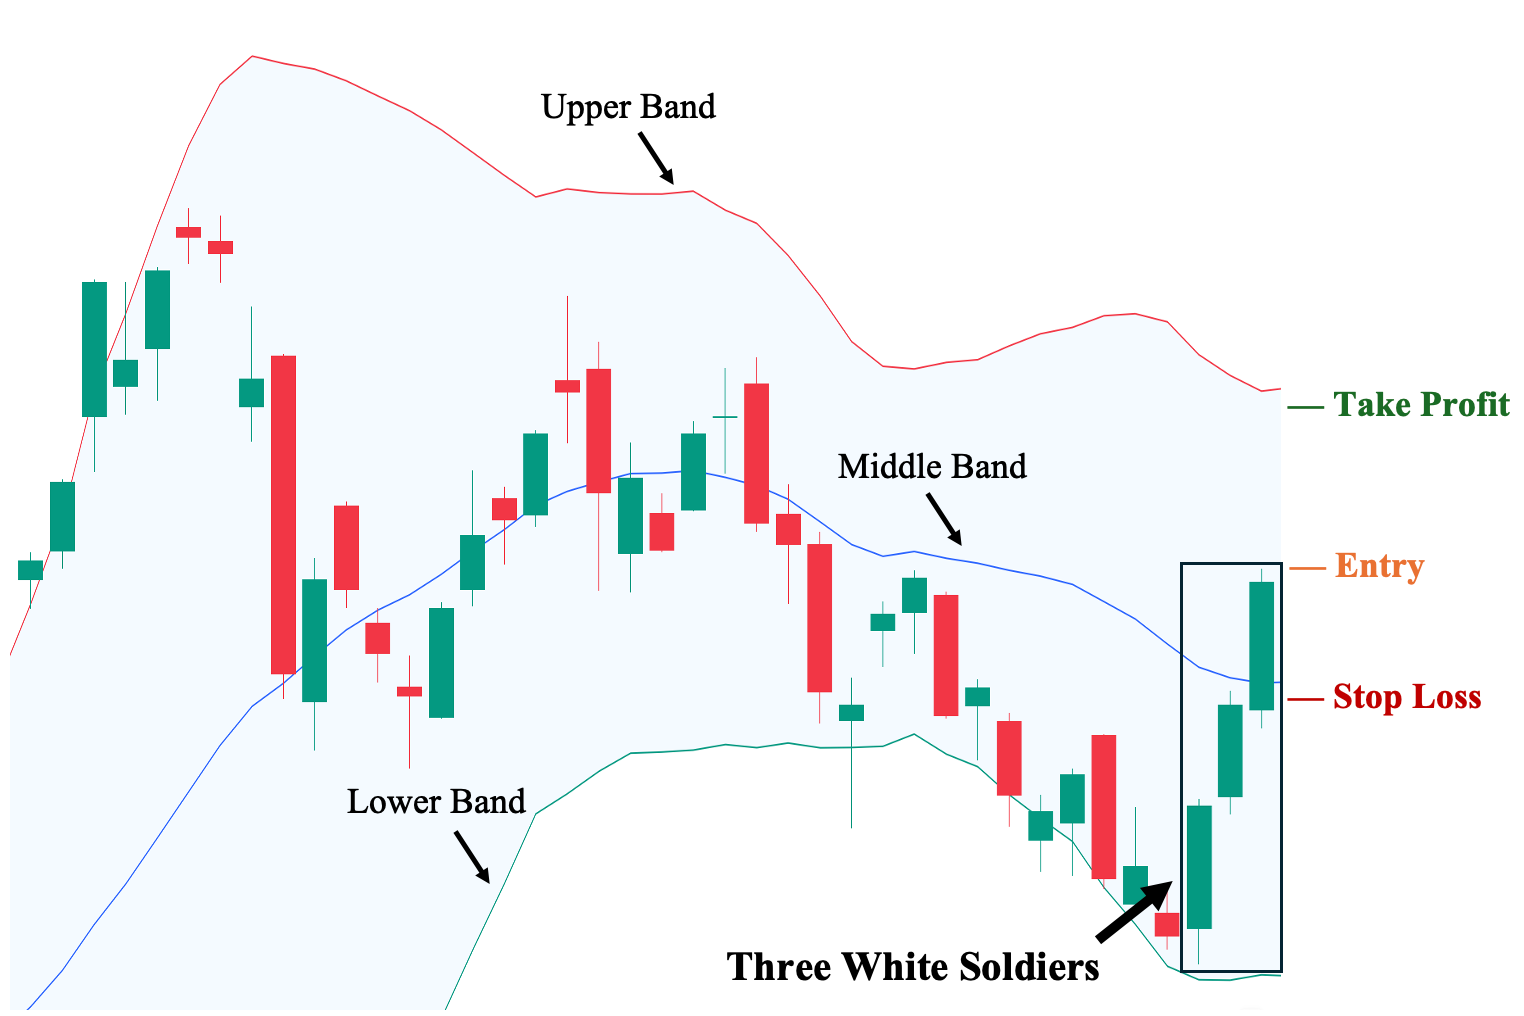
You can use the Bollinger Bands with the three white soldiers pattern to identify key price ranges. For instance, the middle band (in blue) can signal the general momentum of the trend.
If the price action is above the middle band, it suggests upward price momentum, while if it is below the middle band, it suggests downward price momentum. Hence, the middle band can act as a dynamic support or resistance level. On the other hand, the upper band (in red) can serve as the next key resistance after the middle band.
- Suggested Entry: A few ticks above the third candle’s close, and it must be above the middle (blue) band.
- Take Profit (TP) Level: A few ticks below the nearest structural resistance area. We suggest it be a few ticks below the upper band as well.
- Stop Loss Level: A few ticks below the middle (blue) band, as breaking it signifies a possible return of the downtrend’s bearish momentum.
- Risk-Reward Ratio: At least 1:1. We strongly recommend not taking trades with a risk/reward ratio lower than 1:1. The higher the potential reward compared to risk, the better
Three White Soldiers with Moving Averages
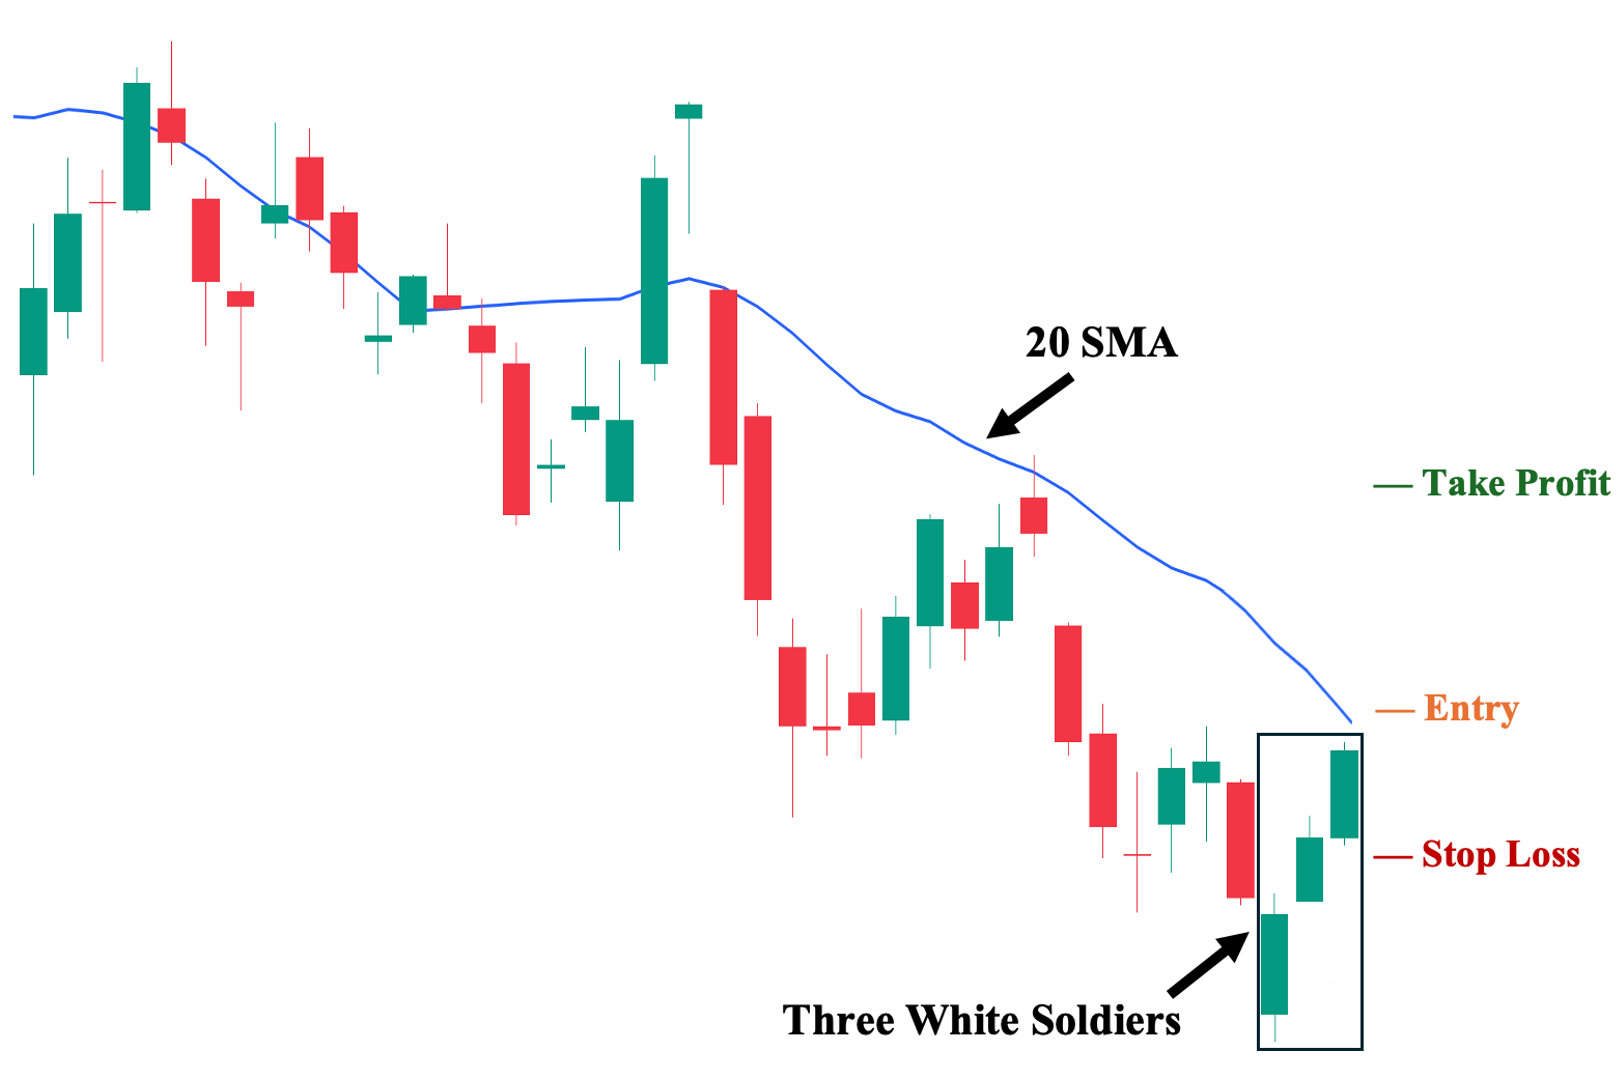
You can use Moving Averages (MA) with the three white soldiers pattern to pinpoint dynamic key price action levels, such as your possible entry, stop loss, and target profit areas. In this example, we use the 20 Simple Moving Average (SMA) to serve as our dynamic resistance (price must close above it before we enter) and dynamic support (price must not close below it; otherwise, we sell).
- Suggested Entry: A few ticks above the third candle’s close. It must also be above your chosen MA.
- Take Profit (TP) Level: Set your first TP a few ticks above the nearest structural resistance area. Then, use an MA (preferably short-term, such as MA 20 or EMA 20) as a trailing stop moving forward.
- Stop Loss (SL) Level: A few ticks below the third candle’s low.
- Risk-Reward Ratio: At least 1:1. We strongly recommend not taking trades with a risk/reward ratio lower than 1:1. The higher the potential reward compared to risk, the better.
Three White Soldiers with Volume Oscillator
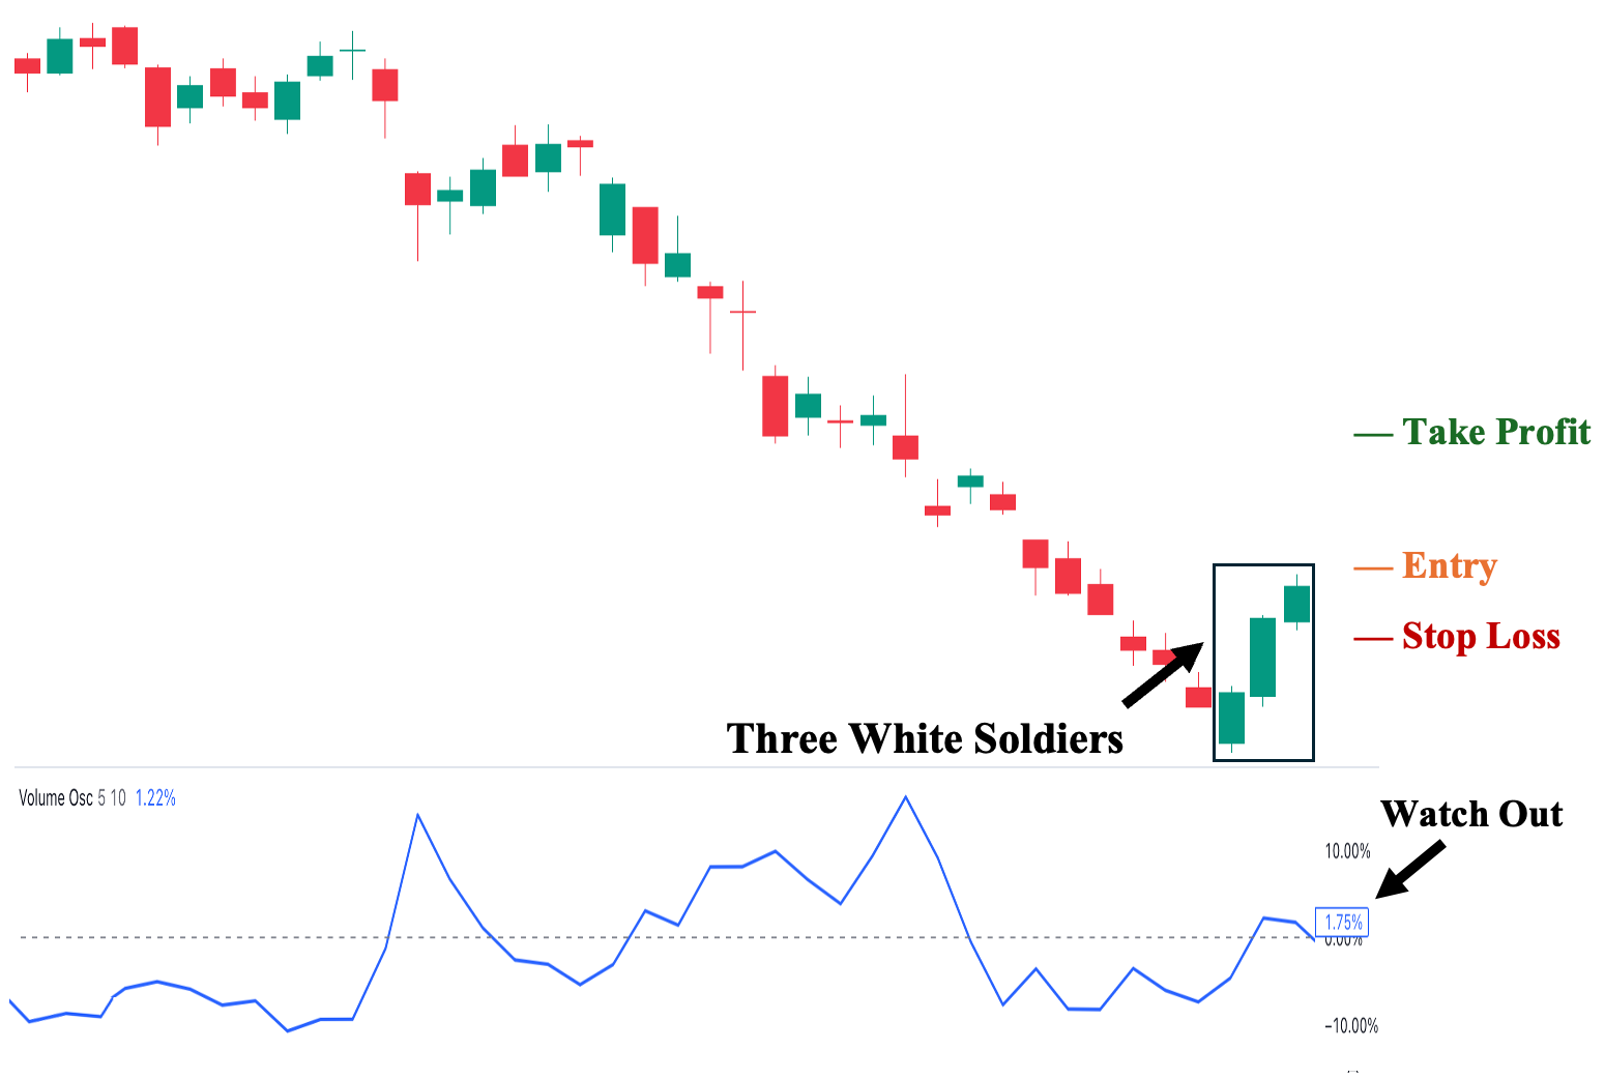
You can use the Volume Oscillator with the three white soldiers pattern to reveal an asset’s volume dynamics. For example, we can see that the volume was below the 0% threshold, indicating a lack of interest from market participants. However, the candlestick pattern was then backed up by increasing volume turnover, propelling it to the positive side of the Volume Oscillator. From this point, if an uptrend is to follow, volume must visibly increase and remain in the upper half (>0%).
- Suggested Entry: A few ticks above the third candle’s closing price.
- Take Profit (TP) Level: Set your first TP a few ticks below the nearest structural resistance area. Then, watch for volume breaking from the dotted midpoint into the lower half, as this can indicate a possible momentum shift. When this happens, consider offloading your entire position.
- Stop Loss Level: A few ticks below the third candle’s low.
- Risk-Reward Ratio: At least 1:1. We strongly recommend not taking trades with a risk/reward ratio lower than 1:1. The higher the potential reward compared to risk, the better.
Three White Soldiers with Stochastic Oscillator
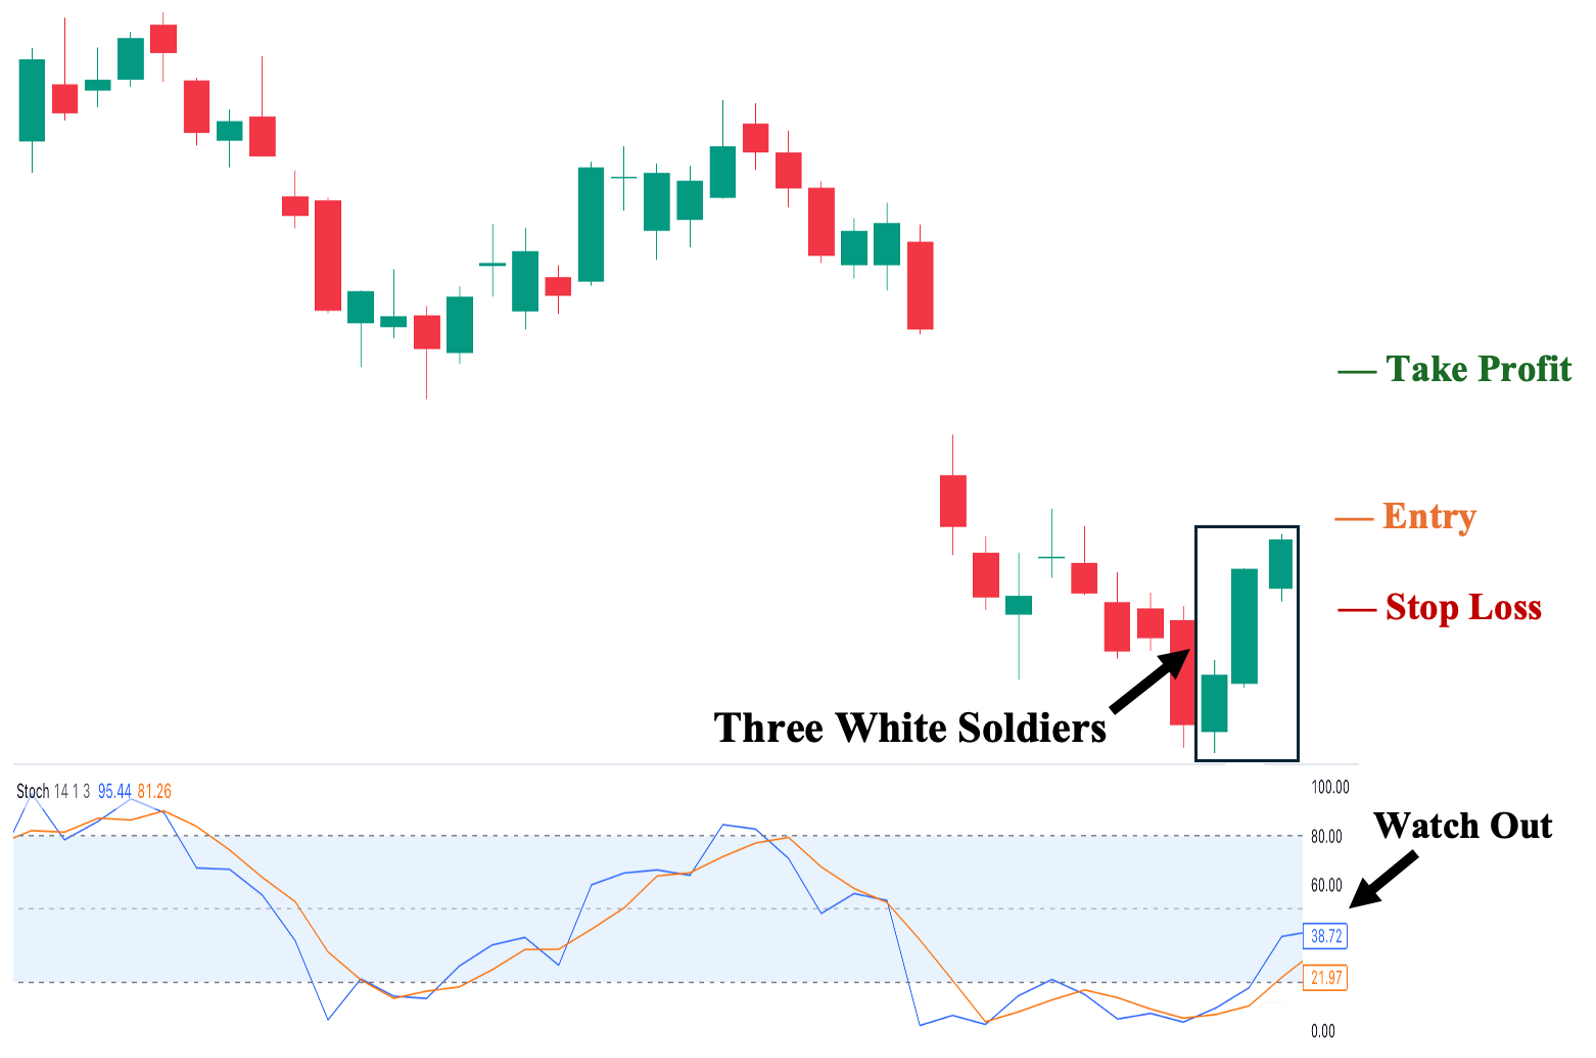
Like other technical indicators such as MACD, you can use the Stochastic Oscillator (STS) with the three white soldiers pattern to help identify shifting market sentiment. The difference is that STS is more sensitive and volatile than MACD. There are also two lines—the blue and orange lines. When the blue line crosses above the orange line, it signifies a shift towards bullish momentum. Here, we can see that STS supports a possible reversal brought by the candlestick pattern.
- Suggested Entry: A few ticks above the third candle’s closing price.
- Take Profit (TP) Level: Set your first TP a few ticks above the nearest structural resistance area. Then, use the STS as a trailing stop (consider closing the rest of the position when the blue line crosses below the orange line).
- Stop Loss Level: A few ticks below the third candle’s low.
- Risk-Reward Ratio: At least 1:1. We strongly recommend not taking trades with a risk/reward ratio lower than 1:1. The higher the potential reward compared to risk, the better.
Three White Soldiers with Fibonacci Retracement Levels
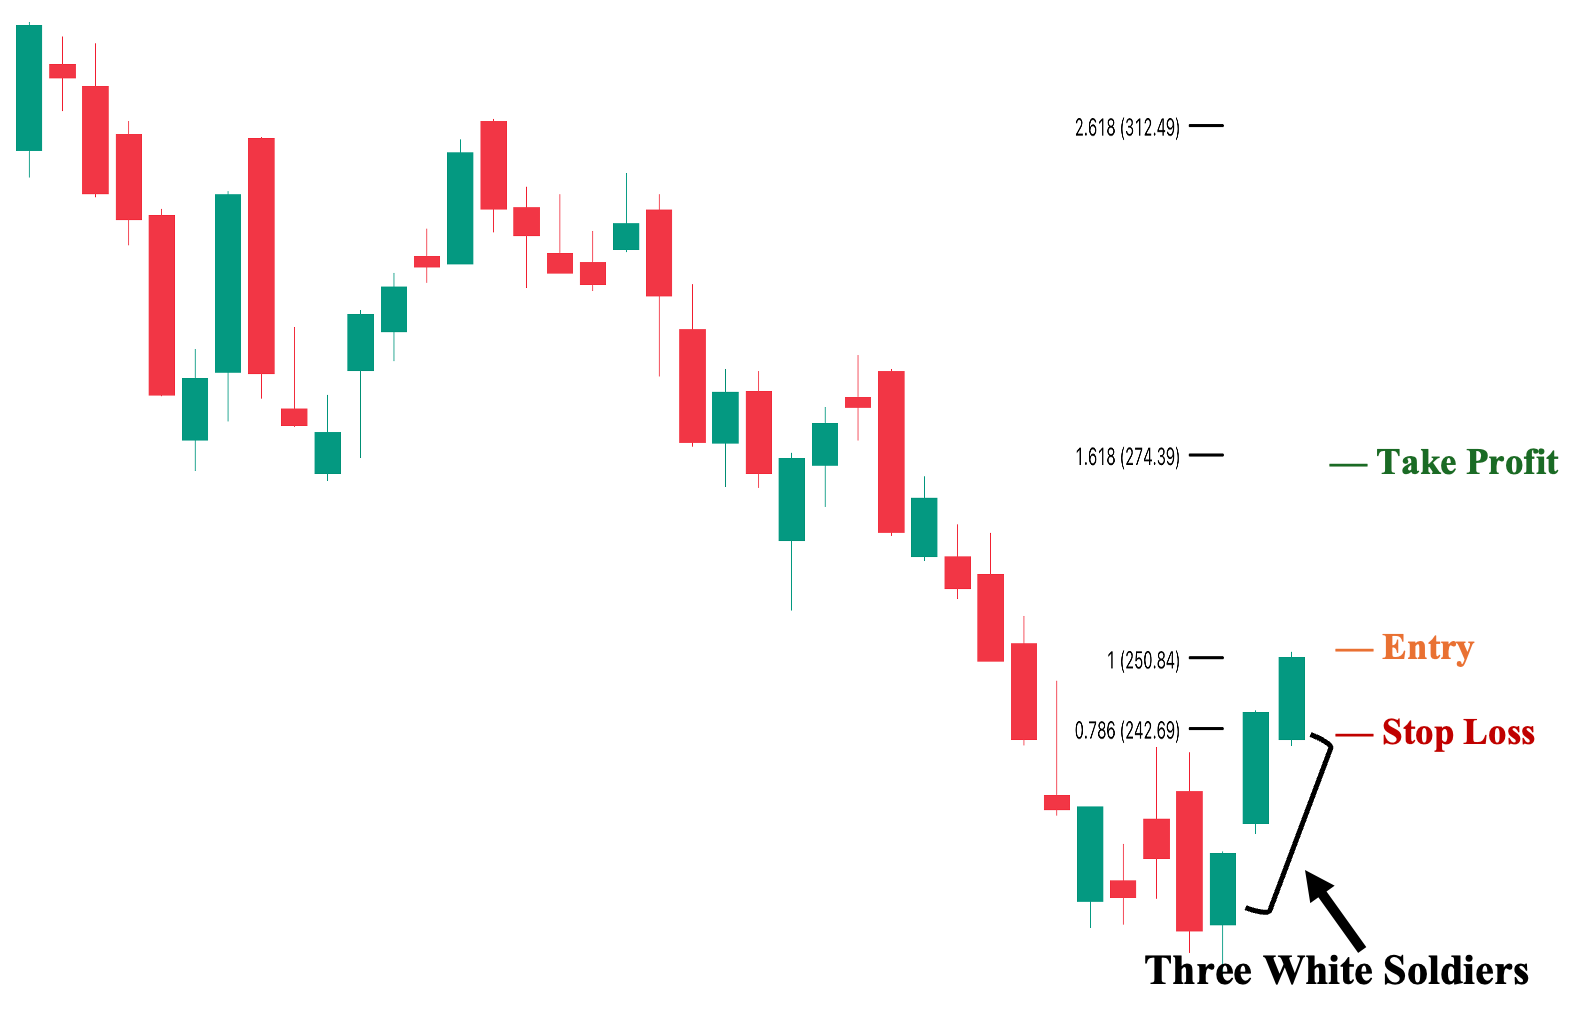
You can use key Fibonacci (Fib) levels with the three white soldiers pattern to pinpoint where the price may likely “retrace” or pull back before continuing its move. In addition, we can use Fib to extrapolate possible resistance levels along the way. Therefore, we can identify both our potential SL and TP areas.
- Suggested Entry: A few ticks above the third candle’s closing price.
- Take Profit (TP) Level: Set your first TP a few ticks below the nearest Fib resistance at 1.618, and your potential second TP a few ticks below the 2.618 resistance level.
- Stop Loss Level: A few ticks below the Fib’s 0.786 level.
- Risk-Reward Ratio: At least 1:1. We strongly recommend not taking trades with a risk/reward ratio lower than 1:1. The higher the potential reward compared to risk, the better.
Three White Soldiers with Average Directional Index (ADX)
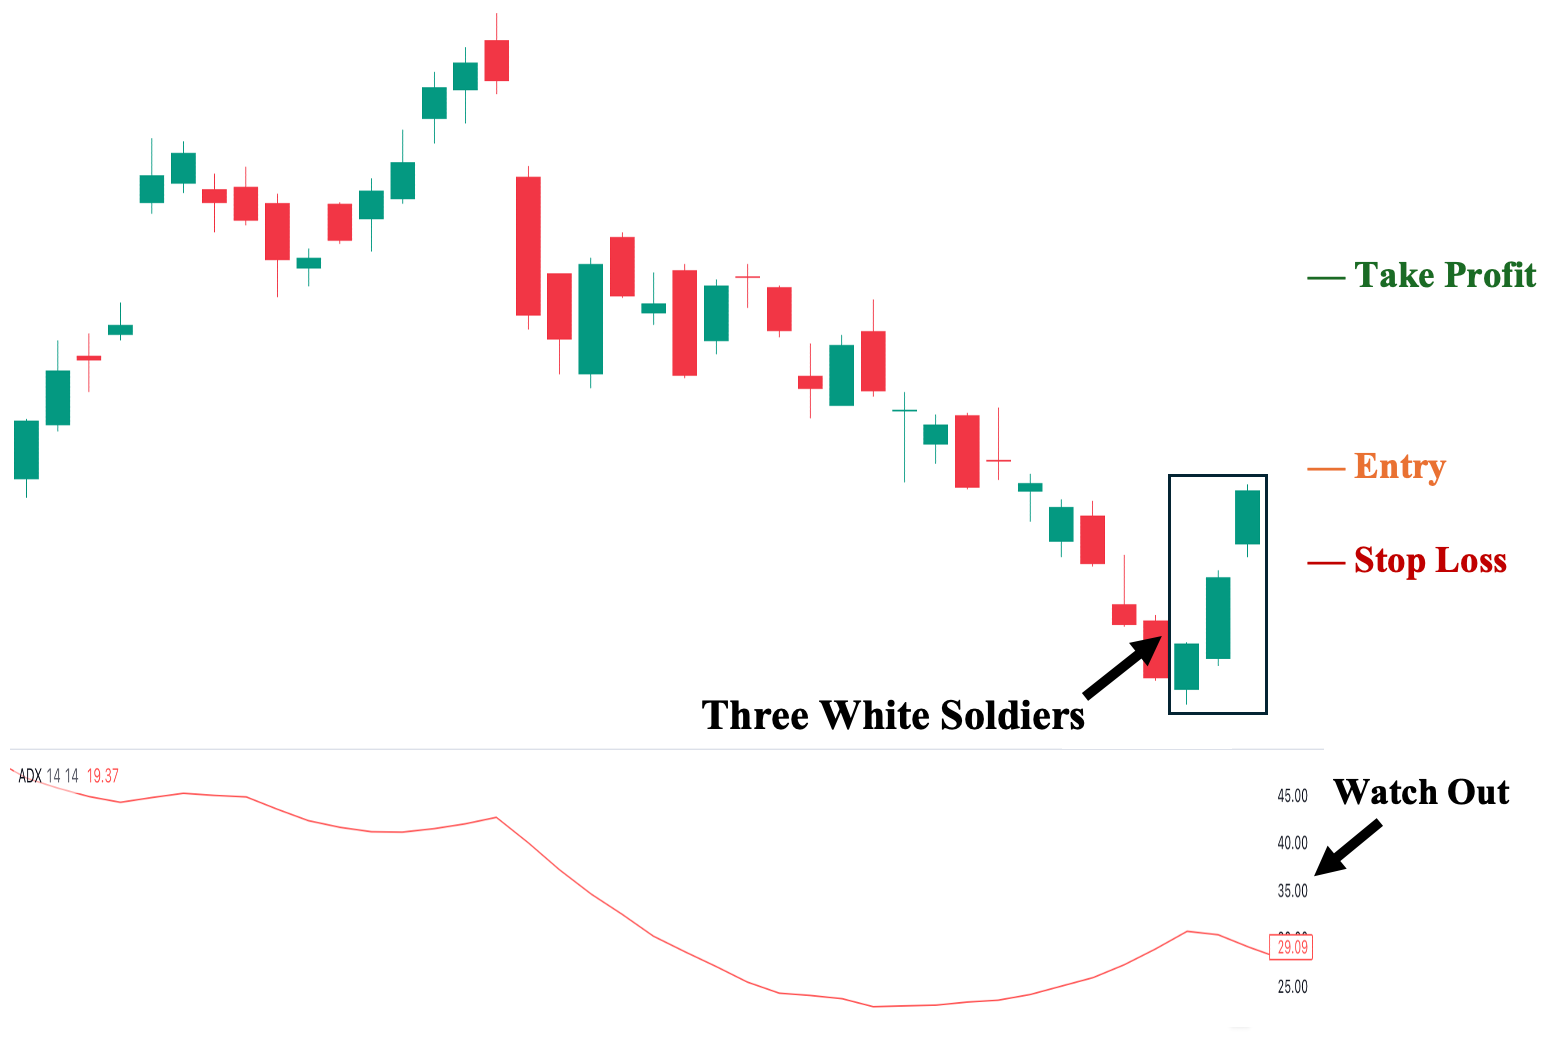
Like other technical indicators (such as RSI and STS), you can use the Average Directional Index (ADX) indicator with the three white soldiers pattern to measure the strength or weakness of a potential upcoming trend (an uptrend if the candlestick pattern successfully leads to a reversal). An increasing ADX signals that the trend is strong and backed by momentum. In contrast, a declining ADX signals that the trend may be weak and may not last.
- Suggested Entry: A few ticks above the closing price of the third candlestick.
- Take Profit (TP) Level: Set your first TP a few ticks below the nearest structural resistance area. Then, use the ADX as a guide to your trailing stop (consider closing the rest of the position when ADX declines sharply).
- Stop Loss Level: A few ticks below the third candle’s low.
- Risk-Reward Ratio: At least 1:1. We strongly recommend not taking trades with a risk/reward ratio lower than 1:1. The higher the potential reward compared to risk, the better.
Three White Soldiers with Ichimoku Cloud
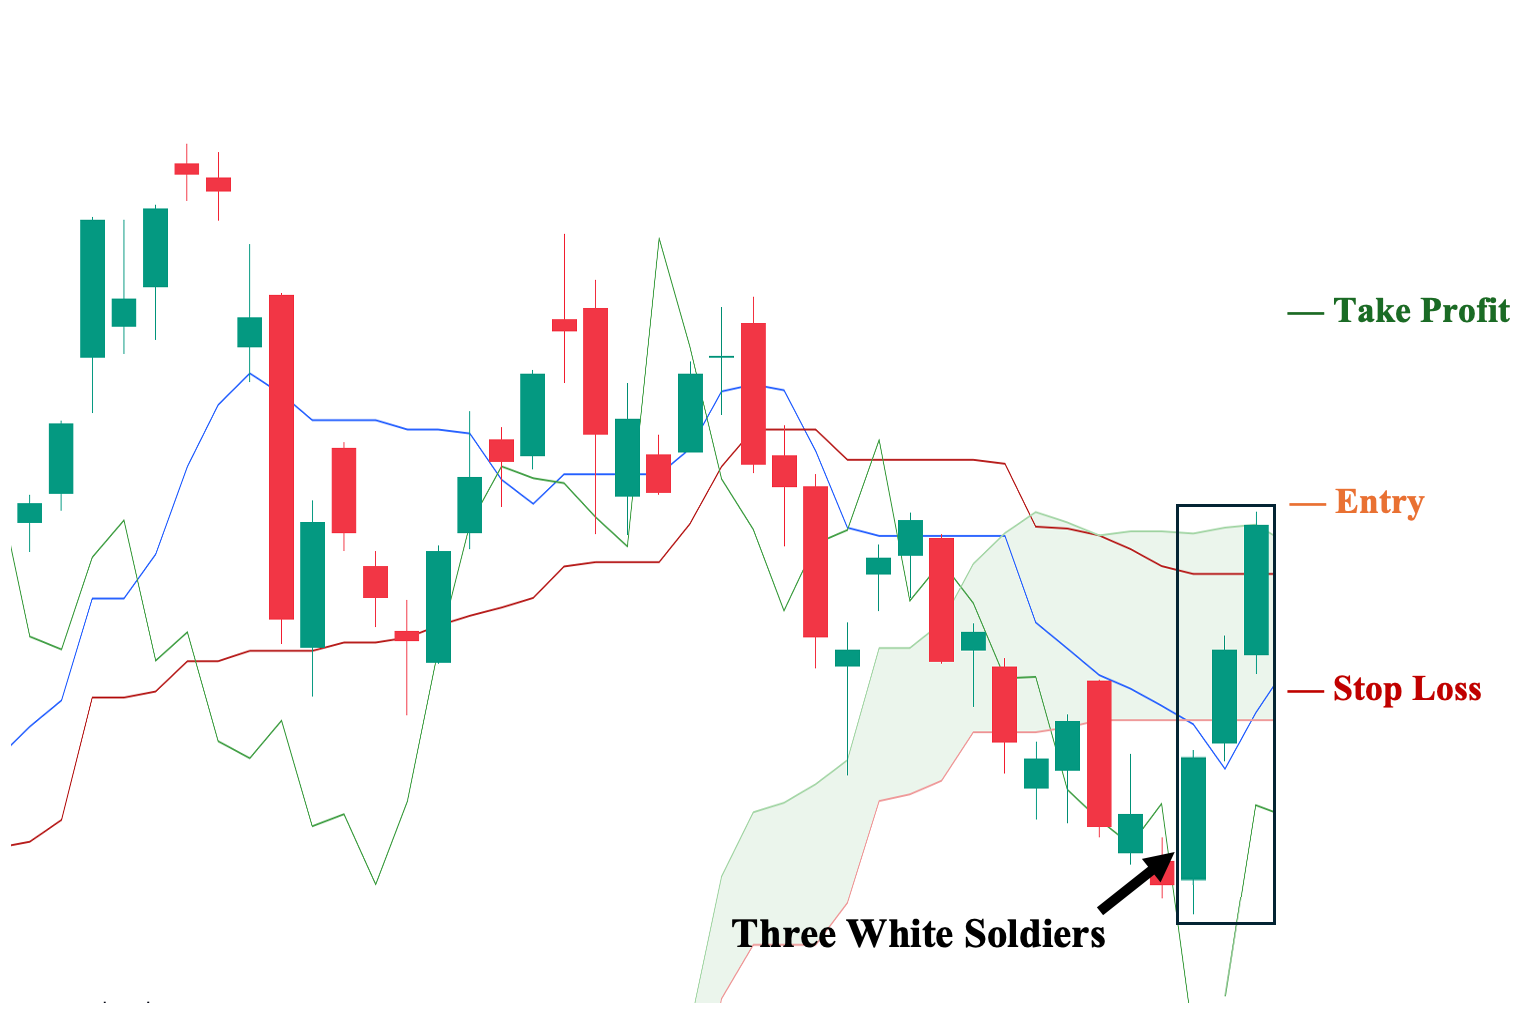
Unlike other technical indicators, the Ichimoku Cloud is perhaps one of the most complex indicators to learn at first. However, upon mastery, you can effectively use it together with the three white soldiers pattern to identify key price levels, momentum, and the ongoing trend all at once. The key lines to pay attention to are the Conversion Line (blue line) and the Base Line (red line). The Base Line can serve as an entry point, while the Conversion Line can serve as your cut loss point. In addition, it’s generally a bullish sign when the Conversion Line crosses above the Base Line.
- Suggested Entry: A few ticks above the closing price of the third candlestick and must also be above the Base (Red) Line.
- Take Profit (TP) Level: Set your TP a few ticks below the nearest structural resistance area.
- Stop Loss Level: A few ticks below the third candle’s low.
- Risk-Reward Ratio: At least 1:1. We strongly recommend not taking trades with a risk/reward ratio lower than 1:1. The higher the potential reward compared to risk, the better.
Trading The Three White Soldiers Based on Support and Resistance Levels
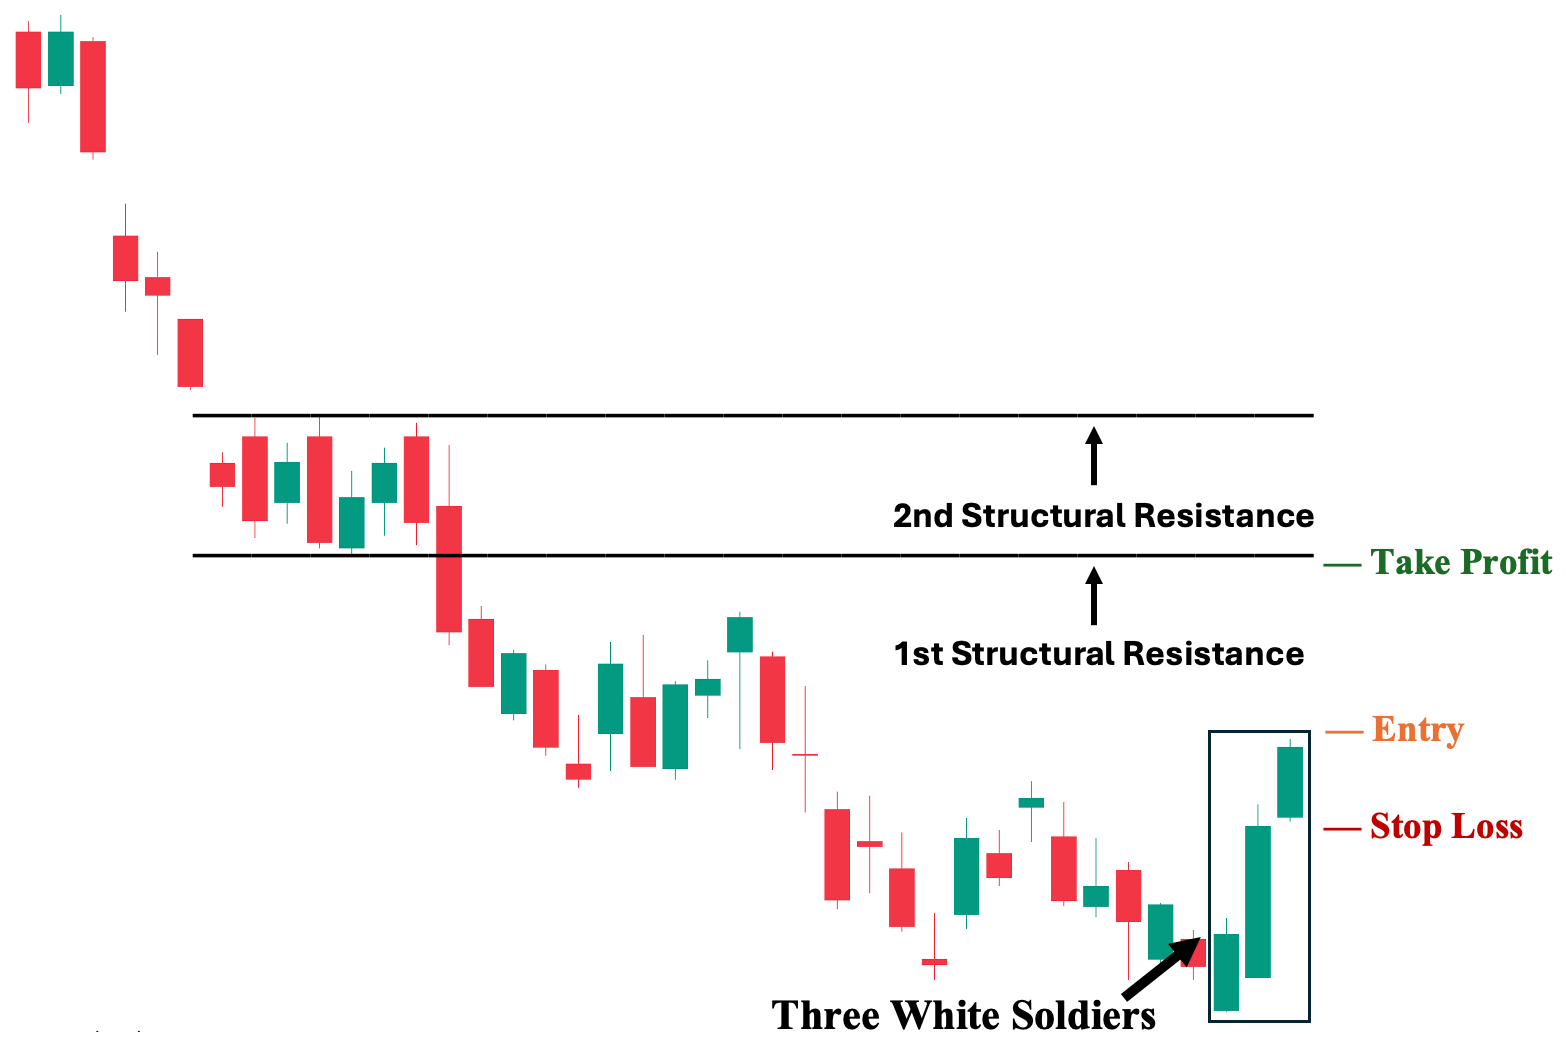
Lastly, you can simply use structural support and resistance levels with the three white soldiers pattern. This is done by pinpointing the native support and resistance levels of an asset’s market structure. Unlike other technical indicators—which can be dynamic—market structure is static and uses historical chart data to identify key price levels.
- Suggested Entry: A few ticks above the closing price of the third candlestick.
- Take Profit (TP) Level: Set it a few ticks below the previous trend’s support area, which is now a resistance area. In a downtrend, the previous key support level becomes the future resistance level for both a pullback and when transitioning to an uptrend.
- Stop Loss Level: A few ticks below the third candle’s low.
- Risk-Reward Ratio: At least 1:1. We strongly recommend not taking trades with a risk/reward ratio lower than 1:1. The higher the potential reward compared to risk, the better.
Advantages of Trading on the Three White Soldiers Pattern
The following are the three key advantages of using the three white soldiers candlestick pattern:
1. Sentiment Analysis Integration
First, fundamental and technical analysis are the two most regarded types of analysis in financial markets (especially in the stock market). However, sentiment analysis remains crucial for “connecting the dots” in the broader market context. While experienced traders and investors can intuitively incorporate this, it’s more challenging for beginners in the market. That being said, one of the advantages of using the three white soldiers candlestick pattern is its potential to serve as a practical tool for learning how and why market sentiment changes. By studying these candlestick patterns, inexperienced traders and investors can develop their “intuition” for the markets.
2. Opportunity for Exploit
Second, the three white soldiers candlestick pattern is widely recognized and understood as a bullish reversal signal. Hence, it can easily trigger herd behavior—where many market participants in the financial markets follow and act on the same signal. However, the ones who hold the greatest power to move the markets are not retail traders or investors like you and I but rather the “whales,” as they are commonly referred to. These are predominantly institutions that exploit common technical analysis patterns to their benefit.
As a retail trader, one way to unveil this is by watching the volume—if the pattern is not supported by substantial volume, then it may not be enough to push the asset out from the ongoing downtrend and may be the opportunity for these whales to dump their positions gradually at better prices.
3. Scalping Opportunity
Third, because the three white soldiers candlestick pattern is universally recognized across different financial markets, you can anticipate heightened volatility when it develops, particularly on the daily chart (the most common timeframe used). This can then create scalping opportunities on lower timeframes (i.e., seconds, minutes, or hourly) to take advantage of the heightened volatility of the asset.
Disadvantages of Trading on the Three White Soldiers Pattern
The following are the three key disadvantages of using the three white soldiers candlestick pattern:
1. May Not Be Worth It
First, even if the three white soldiers candlestick pattern is successful (meaning the trend reverses to the upside), a substantial portion of the upward movement may already have occurred. This is especially true if the third candle’s close is nearing a key resistance level based on market structure. Hence, if you decide to buy, you risk being forced out prematurely if it fails to break the nearing resistance level. This can then leave you in an awkward situation where the risk-to-reward ratio is not worth it.
2. Cognitive Bias
Second, since the three white soldiers candlestick pattern is easy to spot in a downtrend, you may become 100% convinced that this is a reversal signal—ignoring other factors, such as market structure and other technical indicators, due to Fear of Missing Out, or FOMO. After all, waiting for confirmation may limit your potential returns, right? Yet, this tunnel vision can compromise your risk management efforts by disregarding proper risk management techniques to chase a potential winner.
In fact, the worst thing that can happen is if you turn out to be correct and the pattern leads to an eventual uptrend. This is because it now incentivizes you to continue this bad habit, exposing you to more severe consequences in the future.
3. If Everyone is Buying, Who is Selling?
Third, if you employ the three white soldiers candlestick pattern in its traditional and universally accepted use case—as a bullish reversal pattern—then you may be one of the many retail traders susceptible to being exploited by whales, i.e., institutional investors who can actually move markets. These whales can take advantage of the expected reaction from retail investors and traders by taking a counter position.
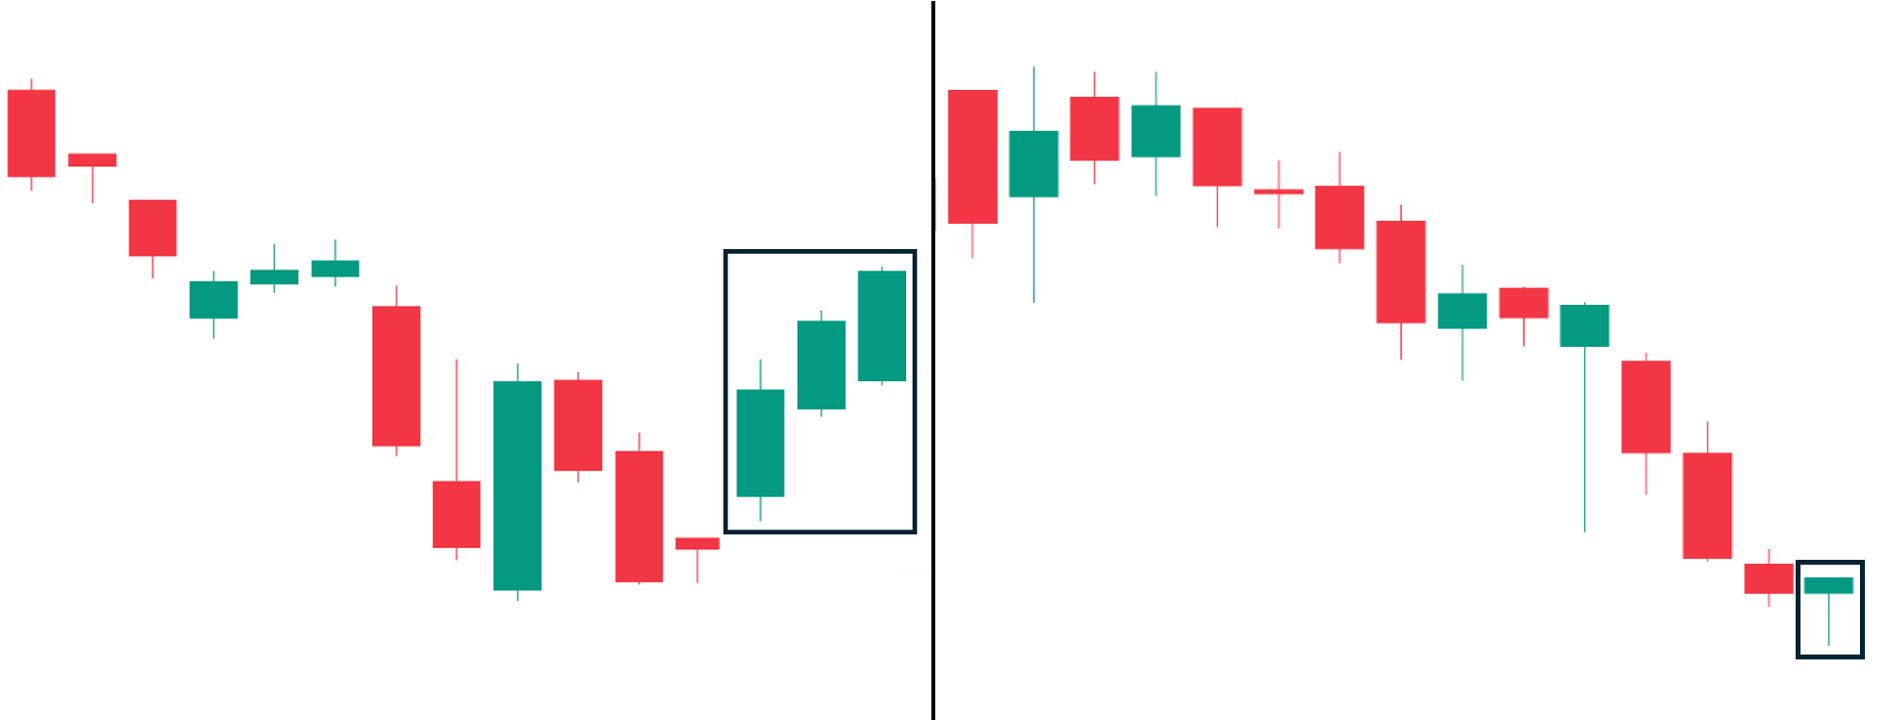
Three White Soldiers vs Three Black Crows
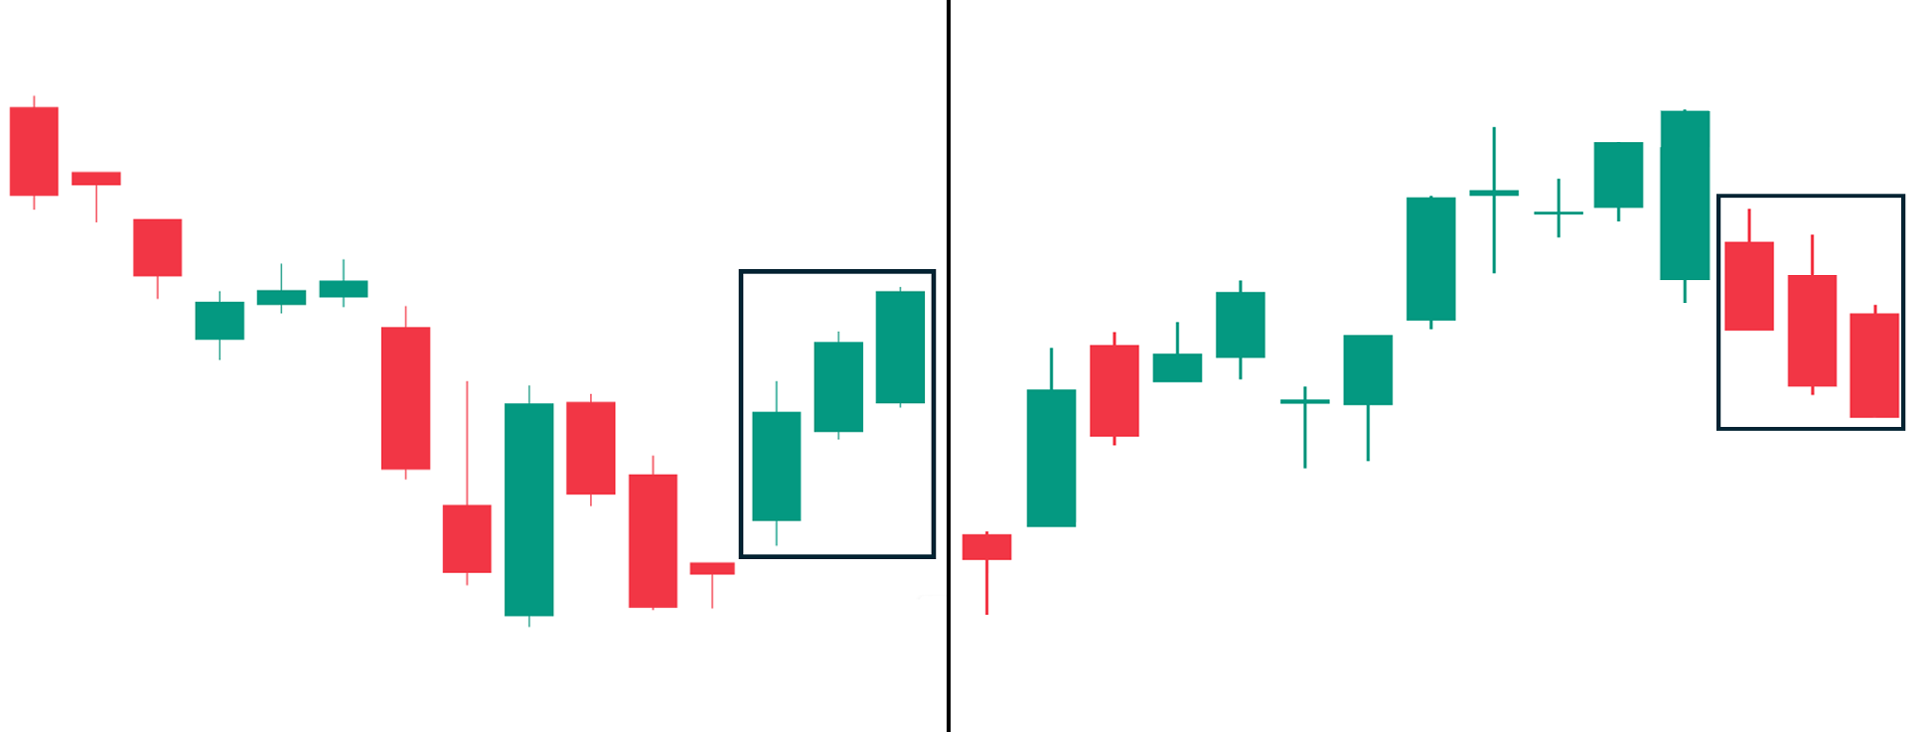
The three black crows is a bearish reversal pattern that is the direct counterpart to the three white soldiers pattern. Therefore, the characteristics of the three black crows are similar to those of the three white soldiers, but in reverse. Instead of having three consecutive long-bodied bullish candles, the three black crows pattern is composed of three consecutive long-bodied bearish candles.
Condition for Validity: The three black crows pattern must appear during an uptrend to be considered a bearish reversal pattern. In contrast, the three white soldiers must occur during a downtrend to be considered a bullish reversal pattern.
Three White Soldiers vs. Bullish Engulfing Pattern
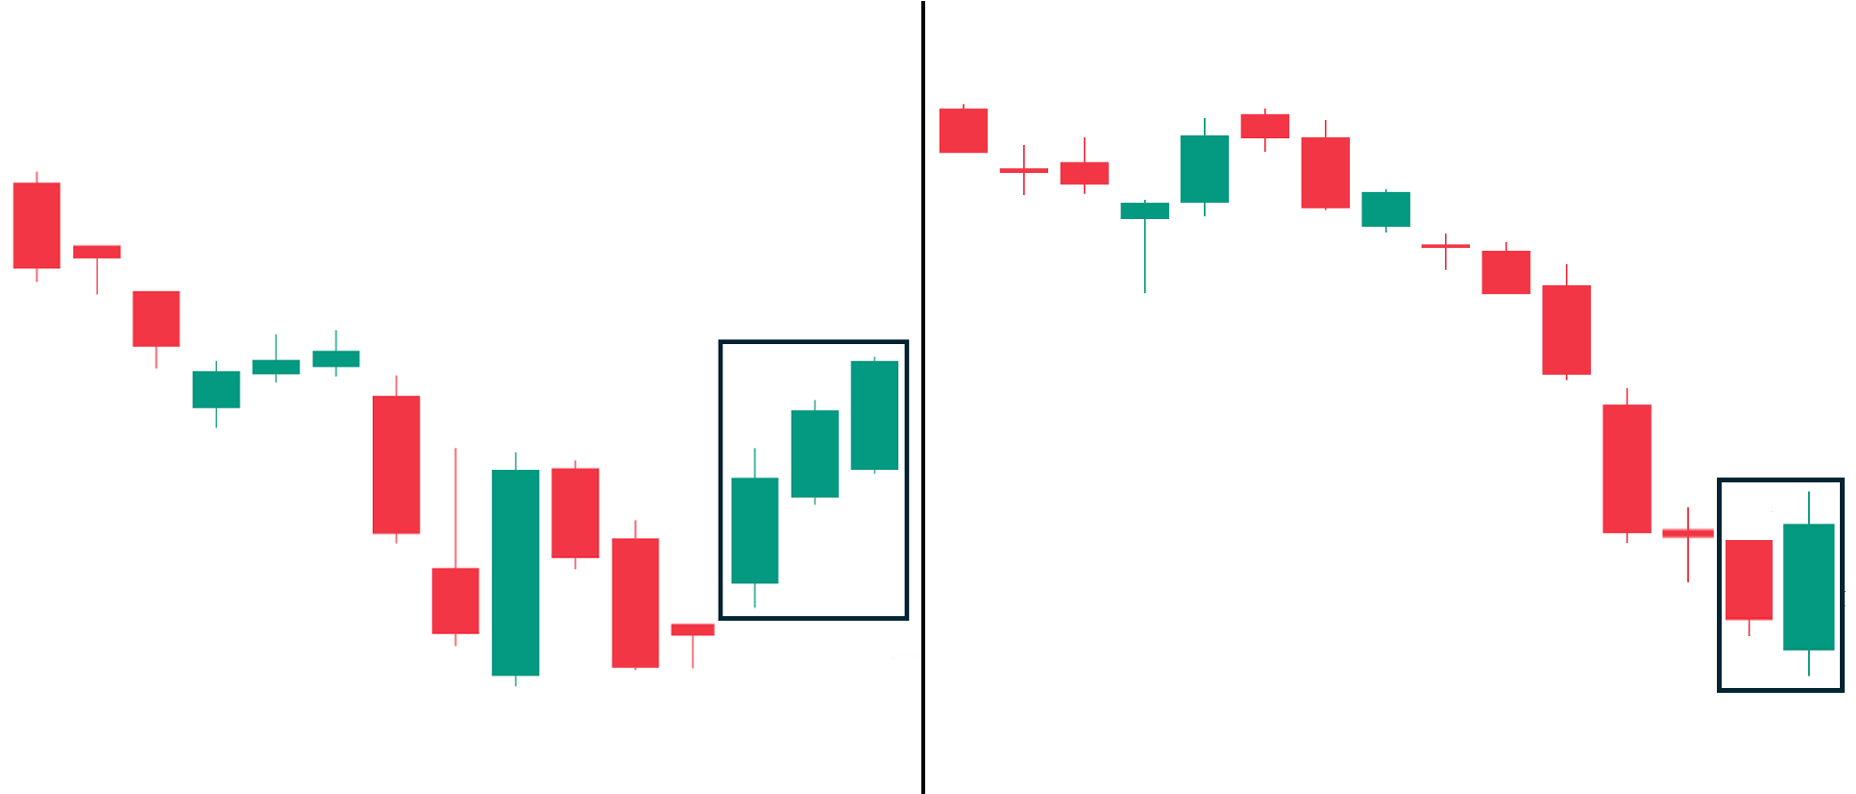
Similar to the three white soldiers, the bullish engulfing pattern is also a bullish reversal formation. However, unlike the three white soldiers, the bullish engulfing is only a two-candlestick pattern characterized by the second candle being a long-bodied bullish candle that completely ‘engulfs’ or covers the body of the bearish first candle (preceding candle). It’s counterpart is the bearish engulfing pattern.
Comparatively, the three white soldiers is considered a “stronger” bullish reversal signal because it is a three-candle pattern compared to the bullish engulfing’s two-candle formation. This is because three-candle reversal formations are considered more reliable than two-candle reversal formations.
Condition for Validity: Like the three white soldiers pattern, the bullish engulfing pattern must occur during a downtrend to be considered a valid bullish reversal pattern.
Three White Soldiers vs. Morning Star
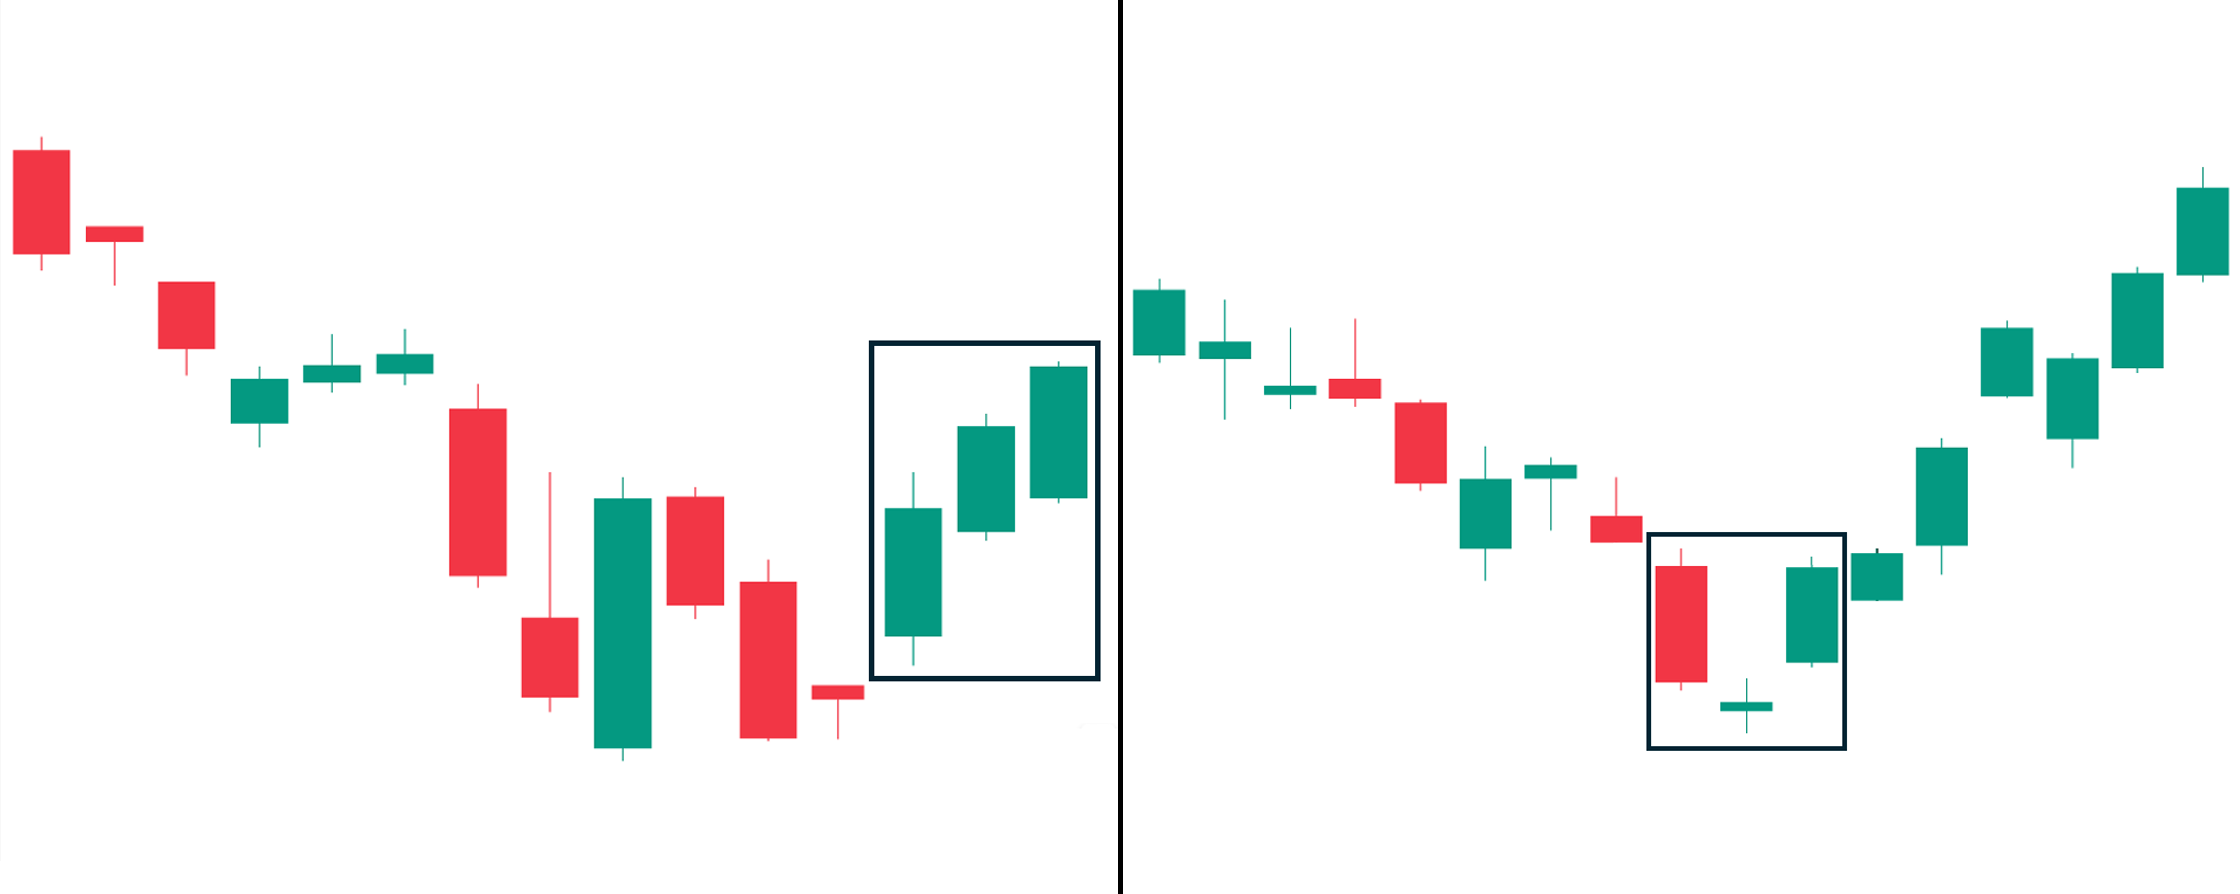
Like the three white soldiers, the morning star pattern is composed of three candlesticks. Arguably, this pattern is harder to find yet more reliable than the three white soldiers. The first candle is a long-bodied bearish candlestick that continues in the direction of the downtrend. The second candle is a thinly bodied candlestick, creating a “gap down” (opening below the previous candle’s closing price) on the opening in the direction of the previous trend. Note that the color of this second candle does not matter. Finally, the third candle of the morning star pattern is a long-bodied candle that “gaps up” (opening above the previous candle’s closing price) on the open in the opposite direction of the previous trend. This confirms the previous trend has lost momentum and is potentially reversing.
Condition for Validity: Like the three white soldiers pattern, the morning star pattern must occur during a downtrend to be considered a valid reversal pattern.
Three White Soldiers vs. Hammer
Like the three white soldiers, the hammer candlestick pattern is a bullish reversal formation. However, it is only composed of one candle that has a short body and long wick (and looks like a hammer). The color does not really matter as its figure is the sole defining factor. Essentially, this pattern indicates a possible rejection of further price decline and may signal a potential reversal to the upside.
Condition for Validity: Like the three white soldiers pattern, the hammer pattern must occur during a downtrend to be considered a valid reversal pattern.
Three White Soldiers vs. Inverted Hammer
Similar to three white soldiers, the inverted hammer is also a bullish reversal signal. It looks like the hammer upside down (hence the name). It consists of a small real body with a long upper shadow and little to no lower shadow. This indicates that, despite selling pressure, buyers were able to push the price up significantly during the session, though the price fell back to near its opening level.
Condition for Validity: Like the three white soldiers pattern, the inverted hammer pattern must occur during a downtrend to be considered a valid reversal pattern.
Three White Soldiers vs. Piercing Line
Like the three white soldiers, the piercing line is also a bullish reversal formation. It is composed of two candles and is characterized by the first candlestick being a bearish long-bodied candle followed by a bullish long-bodied candle that opens below (gap down) the first candle’s close yet manages to close above 50% of the previous candle’s body. This indicates a rejection of further price drops and signals a potential build-up of bullish momentum for a possible reversal.
Condition for Validity: Like the three white soldiers pattern, the piercing line pattern must occur during a downtrend to be considered a valid reversal pattern.
Three White Soldiers vs. Bullish Abandoned Baby
Both the three white soldiers and the abandoned baby are three-candlestick pattern formations. In fact, the abandoned baby is even more nuanced and rare than the morning star. As shown, the first candle is a large-bodied candle that continues in the direction of the previous downtrend. Then, the second candle is a thinly-bodied or doji candle making a “gap down” (opening below the previous candle’s close). Note that the color of this second candle does not matter. Lastly, the third candle of the abandoned baby pattern is a long-bodied candle that gaps on the open in the opposite direction of the previous trend. This confirms the previous trend has lost momentum and is reversing.
Condition for Validity: Like the three white soldiers pattern, the bullish abandoned baby pattern must occur during a downtrend to be considered a valid reversal pattern.
Three White Soldiers vs. Tweezer Bottoms
Similar to the three white soldiers pattern, the tweezer bottom pattern is also a bullish candlestick pattern. However, compared to the three white soldiers—which is composed of three long-bodied bullish candles—the tweezer bottom is characterized by only two candlesticks: a bearish candle (often with relatively long wick) creating a new low, followed by a long-bodied bullish candle reaching approximately the same low but closing above the first candle’s opening price.
This pattern’s formation can be interpreted as sellers being unable to overcome the strong buying pressure at the bottom, which potentially developed as a key support level, suggesting that bullish momentum may soon follow.
Condition for Validity: Like the three white soldiers pattern, the tweezer bottoms pattern must occur during a downtrend to be considered a valid reversal pattern.
Three White Soldiers vs. Double Bottom
Similar to the three white soldiers, the double bottom is also a bullish candlestick pattern, conceptually the same as the tweezer bottom. However, instead of two candlesticks forming next to each other, a double bottom occurs when the asset makes an identical low in between a certain period.
Thus, many traders consider it a stronger bullish reversal pattern, even compared to three-candle reversal patterns, such as the three white soldiers. This is because the double bottom signals that the previous low remains a major support level and that the price will gain momentum upward as the strong buying pressure overwhelms the asset’s previous bearish sentiment.
Condition for Validity: Like the three white soldiers pattern, the double bottom pattern must occur during a downtrend to be considered a valid reversal pattern.
Variants Of The Three White Soldiers Candlestick Pattern
The following are the variations of the three white soldiers pattern:
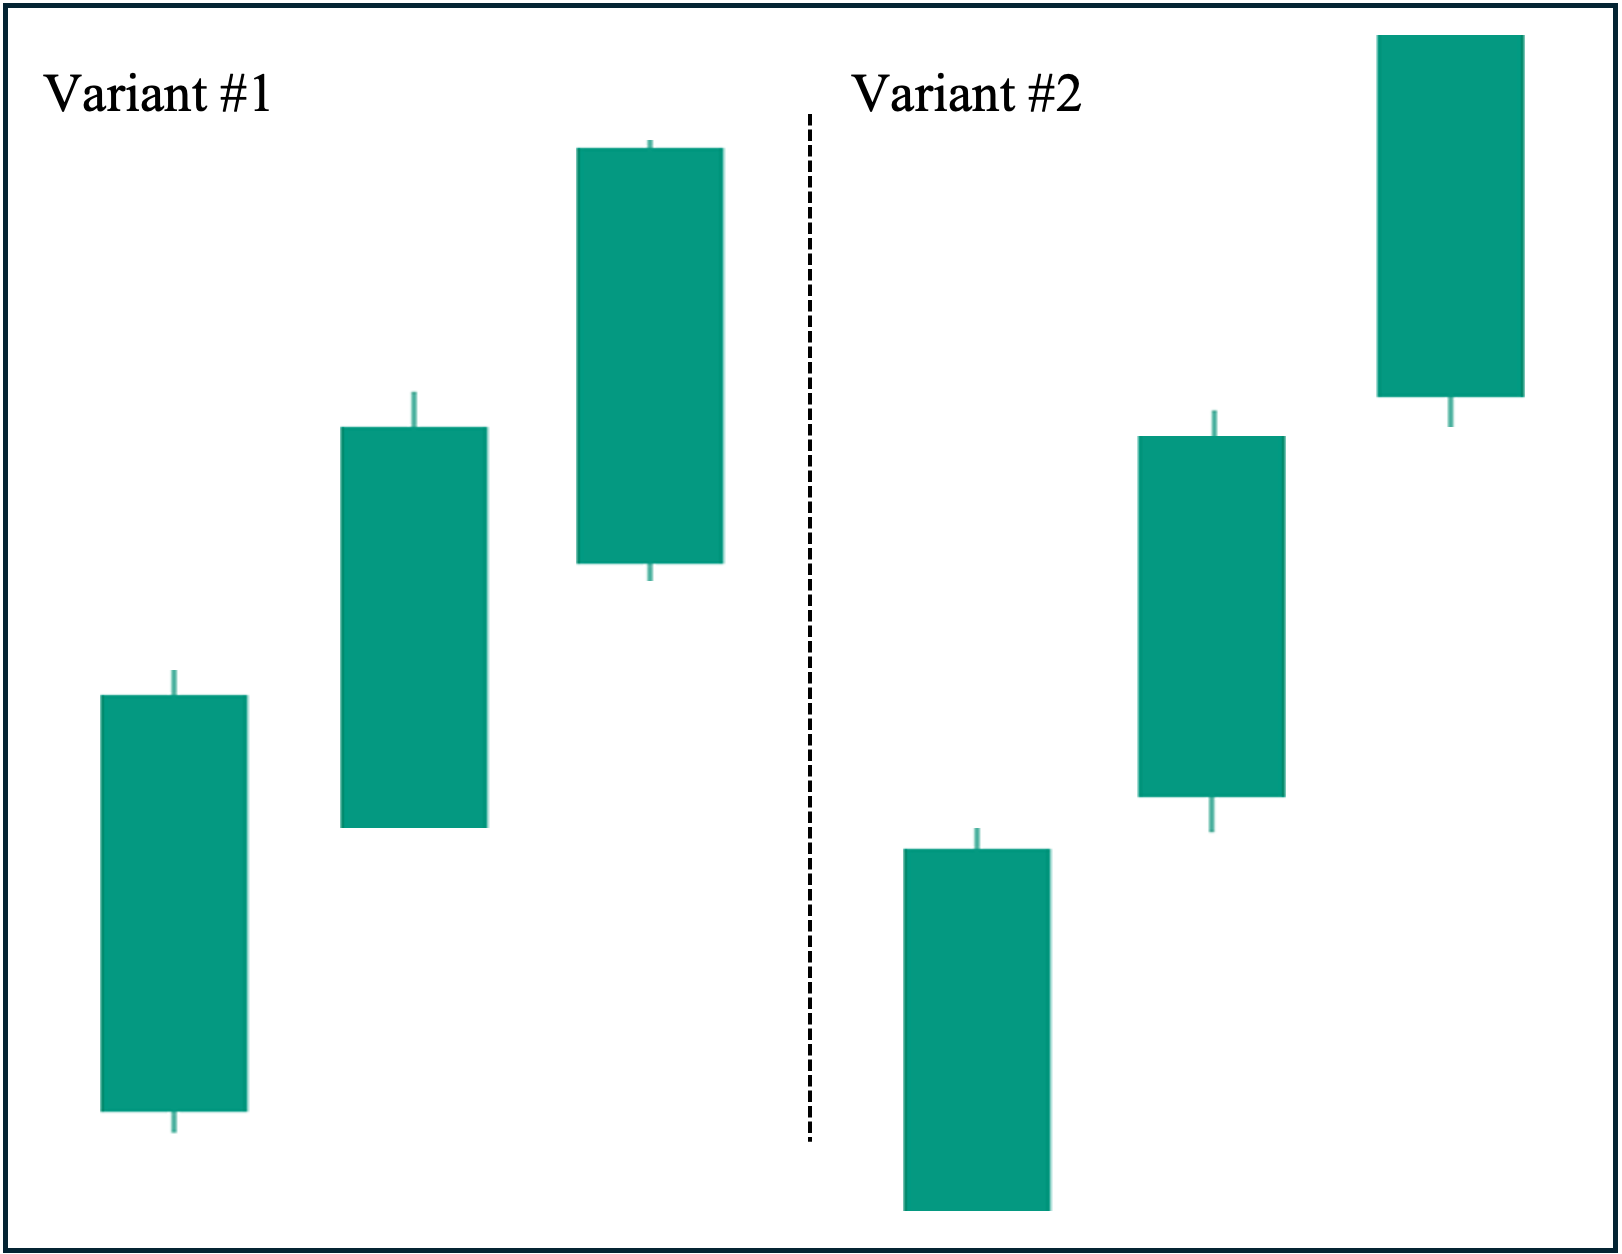
Variation #1: Three Long-Bodied Bullish Candlesticks with no break-away price gap
Variation #2: Three Long-Bodied Bullish Candlesticks with a break-away price gap
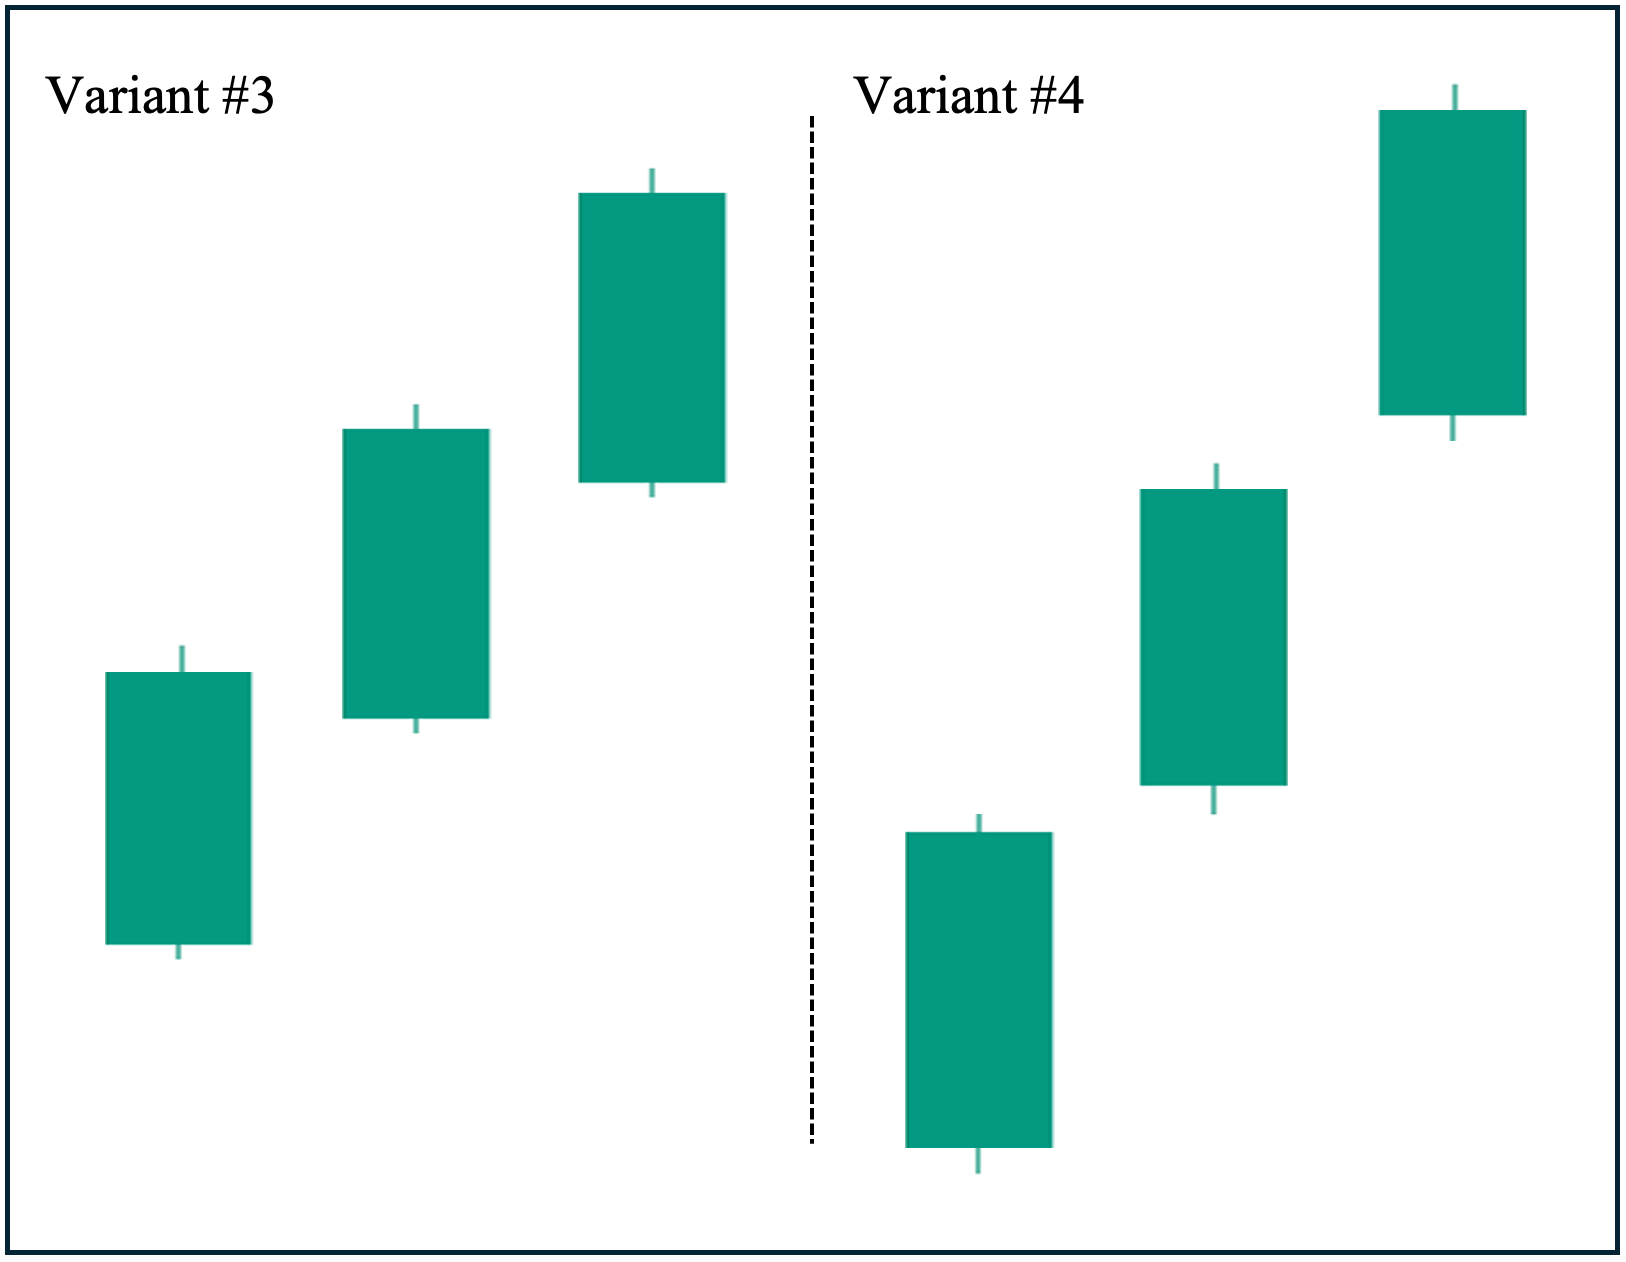
Variation #3: Three Medium-Bodied Bullish Candlesticks with no break-away price gap (must still be relatively longer than normal candles in the chart)
Variation #4: Three Medium-Bodied Bullish Candlesticks with break-away price gap (must still be relatively longer than normal candles in the chart)
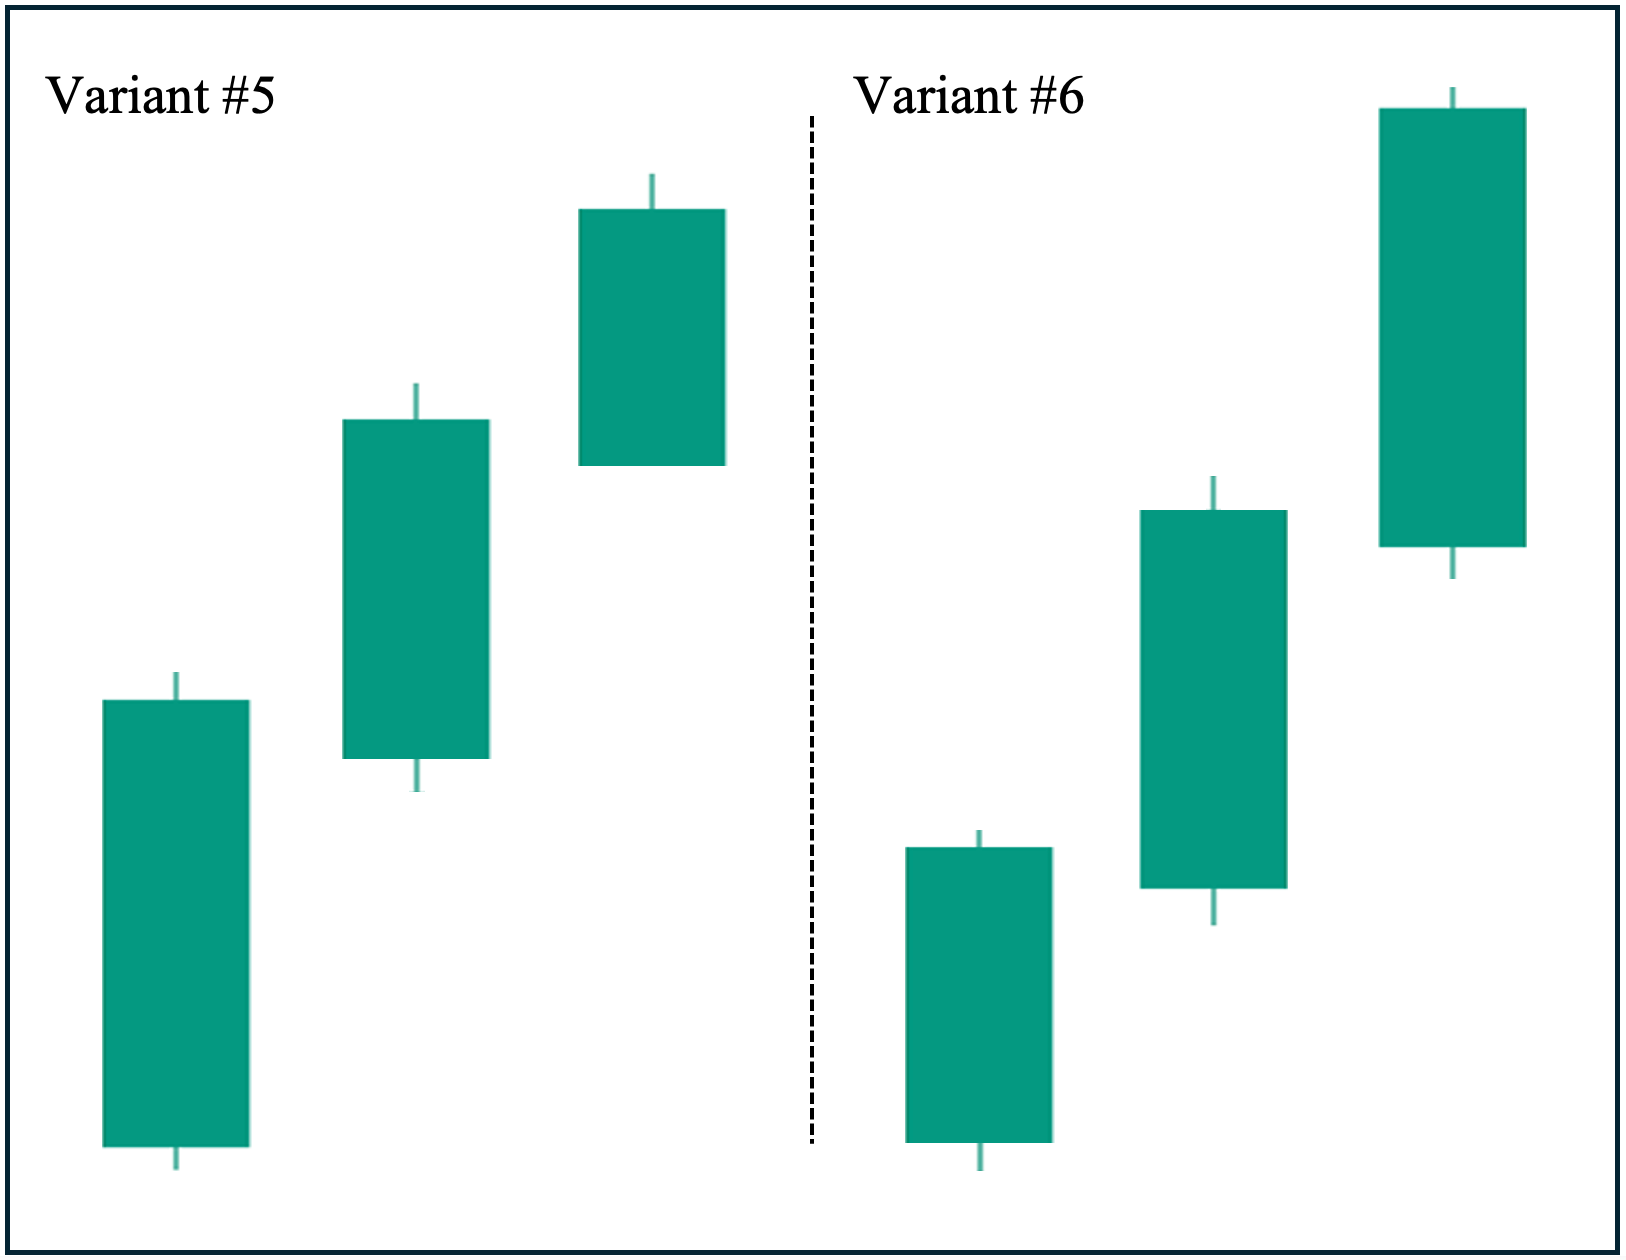
Variation #5: Decreasing Body Size (all candles must be relatively longer than normal candles in the chart)
Variation #6: Increasing Body Size (all candles must be relatively longer than normal candles in the chart)
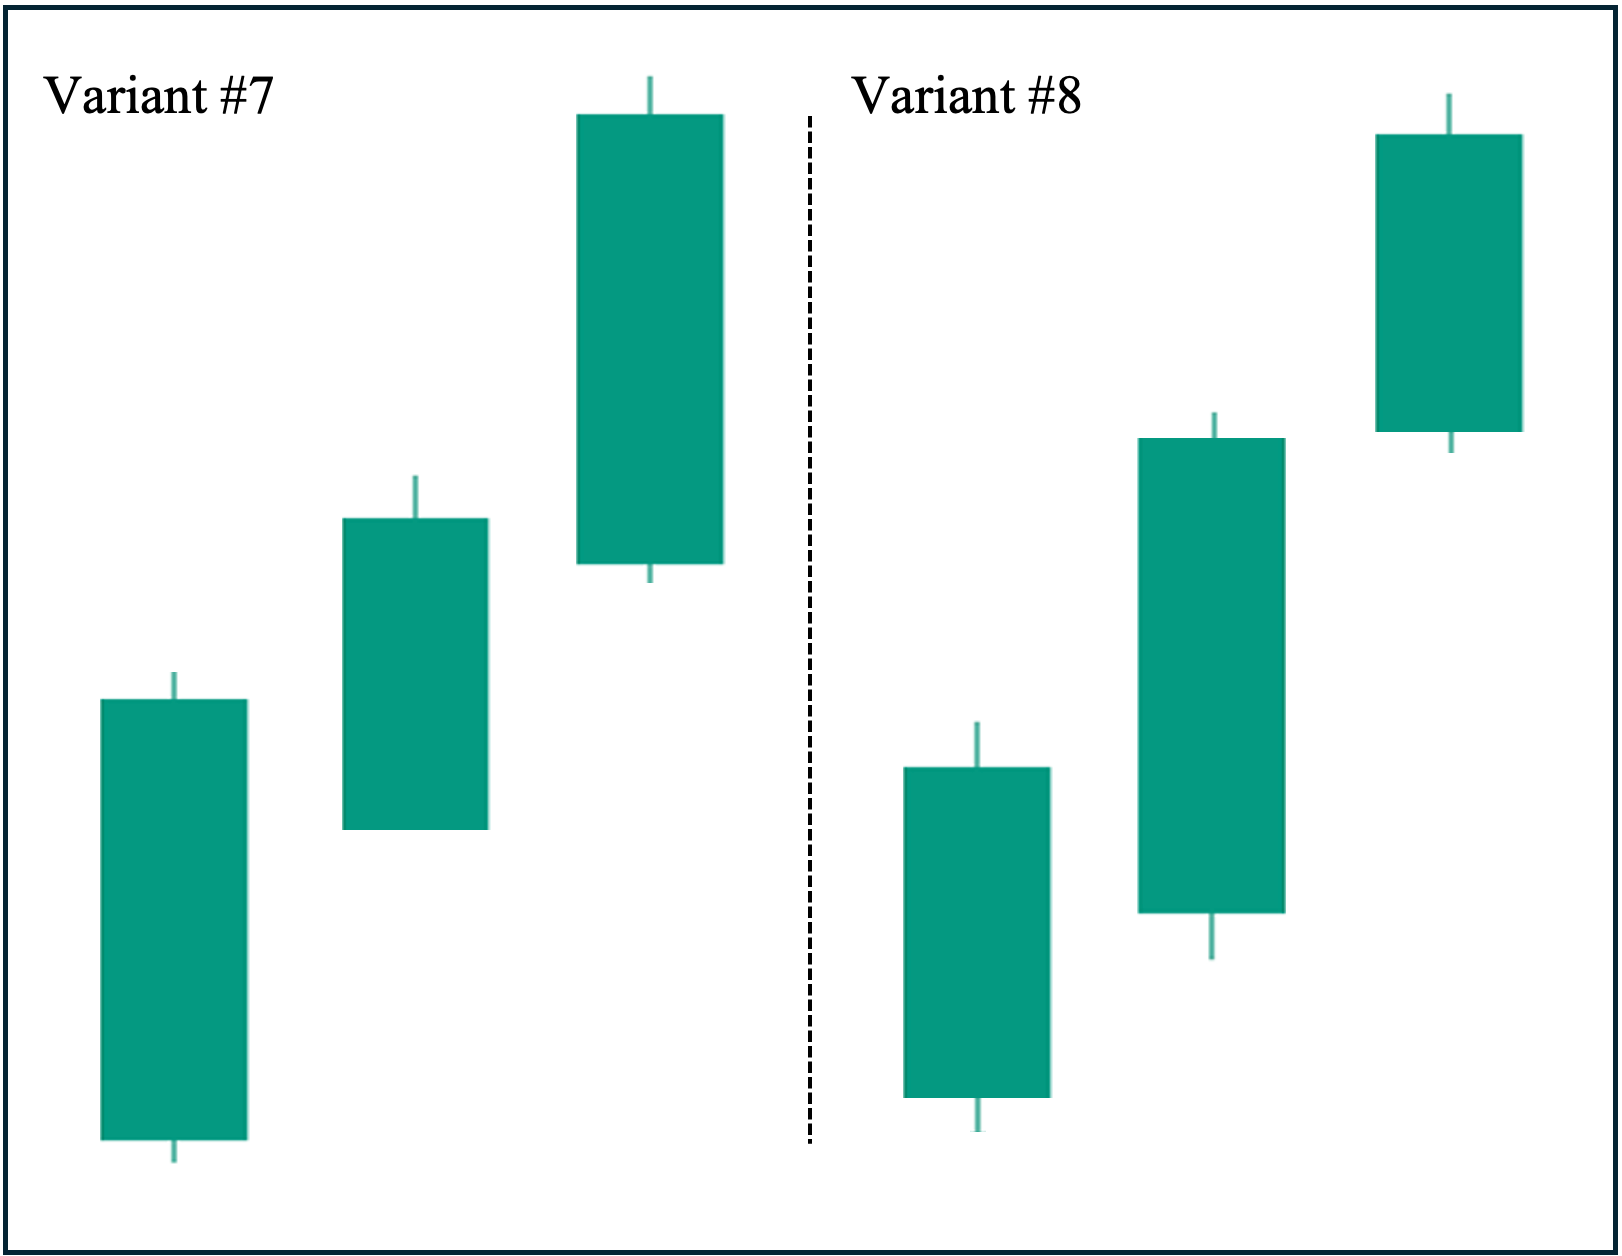
Variation #7: Long-Short-Long Candlesticks (the short candlestick must still be relatively longer than normal candles in the chart)
Variation #8: Short-Long-Short Candlesticks (the short candlesticks must still be relatively longer than normal candles in the chart)
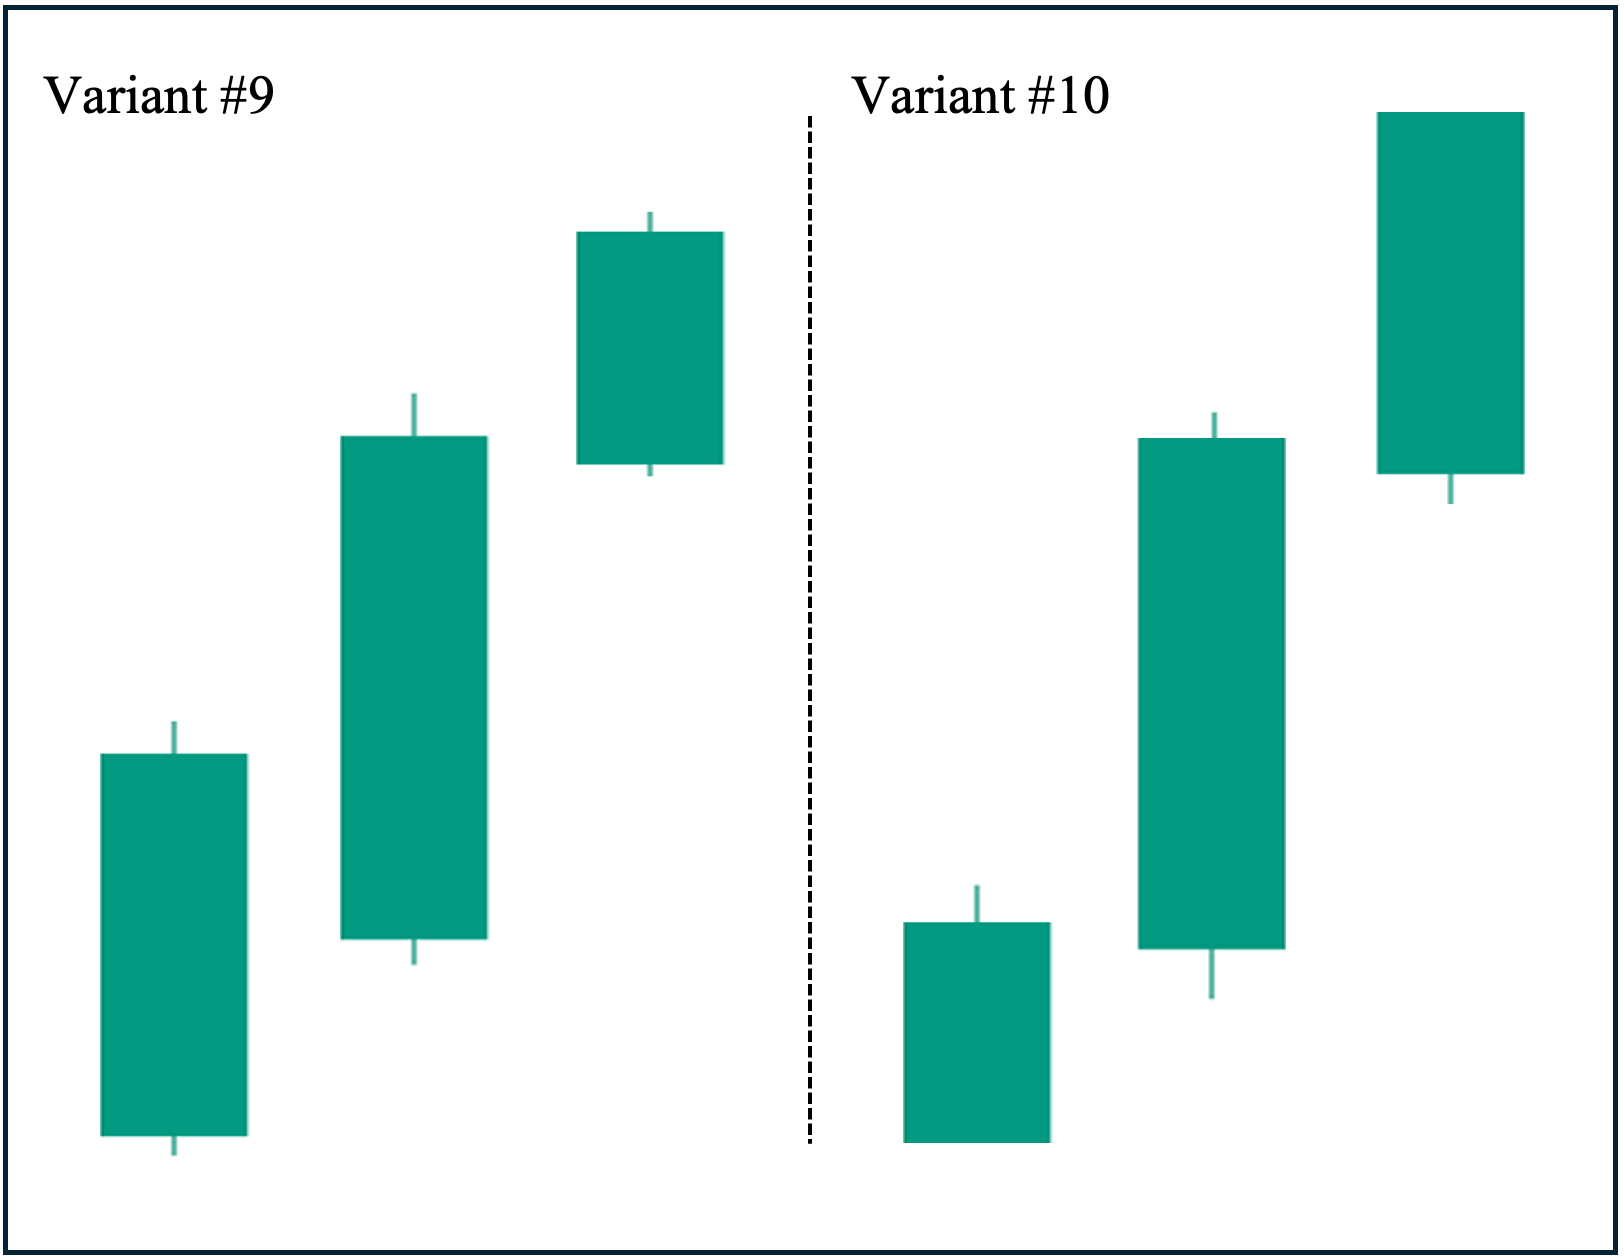
Variations #9 and #10: Irregular Patterns (the short candlestick must still be relatively longer than normal candles in the chart)
Frequently Asked Questions (FAQs)
What is the best time frame for using the three white soldiers candlestick pattern?
There is no single universally applicable best time frame for using the three white soldiers pattern. Instead, the ‘best’ time frame depends uniquely on your trading strategy, style, and risk management. Nevertheless, if two or more timeframes apply to you, the highest timeframe often proves more reliable than its lower counterparts.
For example, if you are a ‘swing trader’—that is, you usually hold an asset for a few days or weeks—the daily time frame may suit you better. On the other hand, if you are a ‘day trader’—someone who buys and sells within the same day—then the hourly time frame often proves to be the most reliable for using the pattern.
How reliable is the three white soldiers candlestick pattern?
Like any trading pattern, the reliability of the three white soldiers depends on numerous key factors, including market conditions, market sentiment, and external confirmations. Generally, the pattern is strongest when it occurs during a clear downtrend coupled with shifting market sentiment (such as when the overall market starts to rally) and external confirmation, such as bullish divergences from indicators like RSI or Stochastic.
Is the three white soldiers candlestick pattern a bearish or bullish reversal pattern?
The three white soldiers is a bullish reversal pattern. For it to be valid, it needs to occur during an ongoing downtrend. If this pattern develops during an uptrend or during a period with no clear trend—also known as a ‘sideways’ or ‘consolidation’ period—then it does not signify a reversal.
When does the three white soldiers candlestick pattern occur?
For it to be considered the ‘three white soldiers’ pattern, the three consecutive bullish candles must occur ONLY during downtrends. In any other market condition (i.e., during an uptrend or in a sideways market), the three consecutive bullish candles are just normal candles that do not serve as a reversal pattern.
How important is the color of the three white soldiers candlestick pattern?
By definition, the three white soldiers pattern consists of three consecutive bullish candlesticks. Hence, depending on your chart setting, it is very important that all three candles must be either green or white. Otherwise, if one or more of the three candles are black or red, then they cannot be considered the three white soldiers.
What is the opposite of the three white soldiers candlestick pattern?
The opposite of the three white soldiers pattern is the ‘three black crows.’ Unlike the three white soldiers, which is a bullish reversal pattern that occurs during a downtrend, the three black crows is a bearish reversal pattern. It consists of three long-bodied candlesticks (black or red) that occur during an uptrend and signify a shift from bullish to bearish market sentiment, thereby marking an end to the ongoing uptrend.
Is the three white soldiers candlestick pattern in an uptrend a sell signal?
No. First, by definition, the three consecutive candles (white or green) are not considered the three white soldiers pattern if they occur in an uptrend. Instead, they are viewed merely as three normal candles. Second, by design, the three white soldiers serve as a ‘buy signal’ during a downtrend. Hence, the pattern cannot serve as a sell signal if it occurs in an uptrend, as it is not recognized as the three white soldiers in this context.