Written by:

Reviewed by:

Bearish
- June 25, 2024
- 15 min read
Shooting Star Candlestick Pattern Guide

The classic Japanese candlestick pattern, the shooting star, has been used by traders for centuries and has a longstanding history. Contrary to cultural beliefs that shooting stars are good omens, this pattern is a bad omen for the asset’s price as it indicates a potential price correction.
Below, we share what the shooting star candlestick pattern is, how it works, and how to trade it effectively.
What is a Shooting Star Pattern?
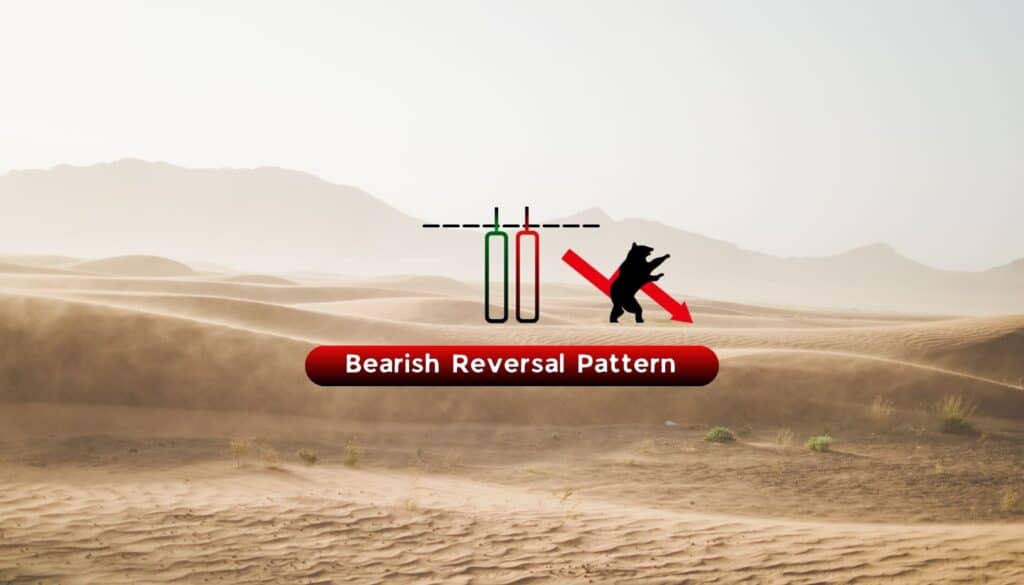
The shooting star is a bearish Japanese candlestick pattern used by technical traders to find a point of reversal after a price rally. Traders use this pattern to identify the start of a price reversal where the trend begins to turn bearish, helping them find short opportunities, prepare for dip-buying opportunities, or as a signal to exit existing long trades.
Just like an actual shooting star, the shooting star candlestick pattern is always found at the highs of a chart. It’s a bearish reversal candlestick pattern that tells traders the market may be in for some downturns, which can serve as an opportunity to short trade, buy the dip, or exit a long trade.
How to Identify a Shooting Star Candlestick Pattern?
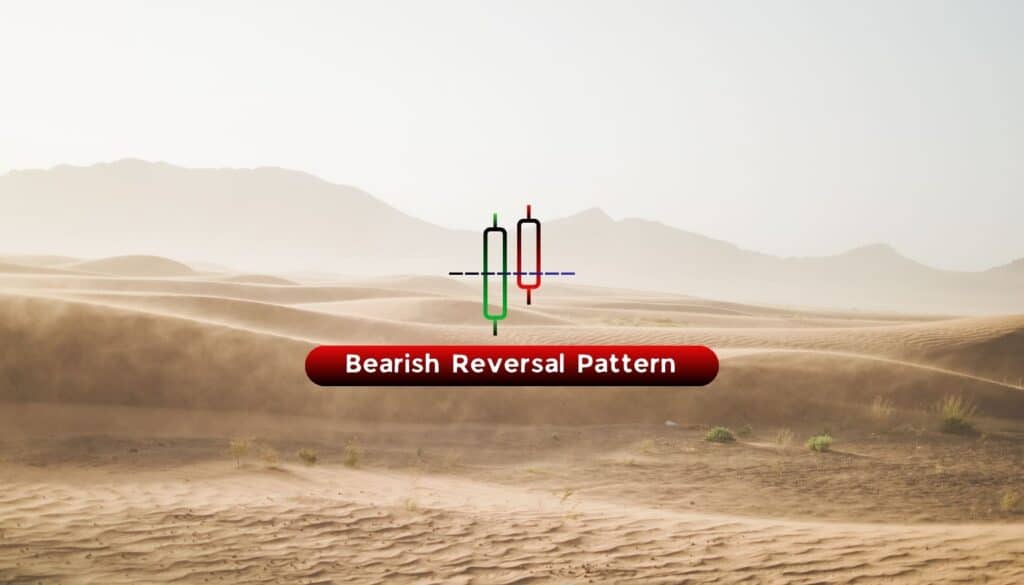
Visually, the shooting star candlestick pattern has three notable features: a long upper shadow or wick, a small candle body, and a tiny lower shadow. This pattern is found at the highs of a price move and typically appears at a resistance level.
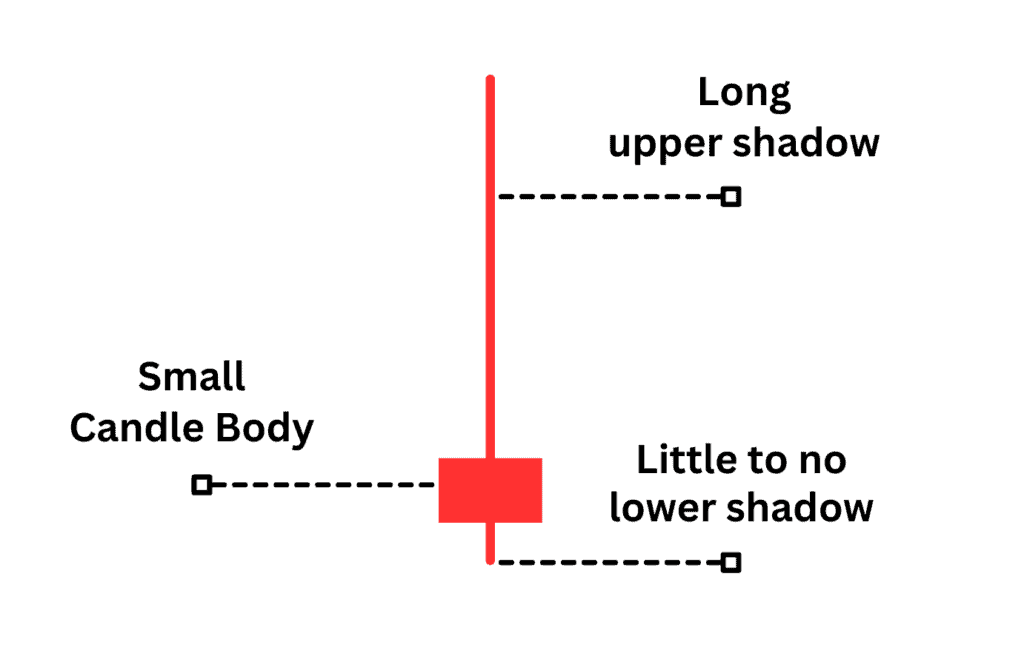
The shooting star’s body should be positioned near the bottom of the candle with little to no lower shadow (buying tail). The long upper shadow should have tapped the resistance level and should be at least twice the length of the shooting star’s body.
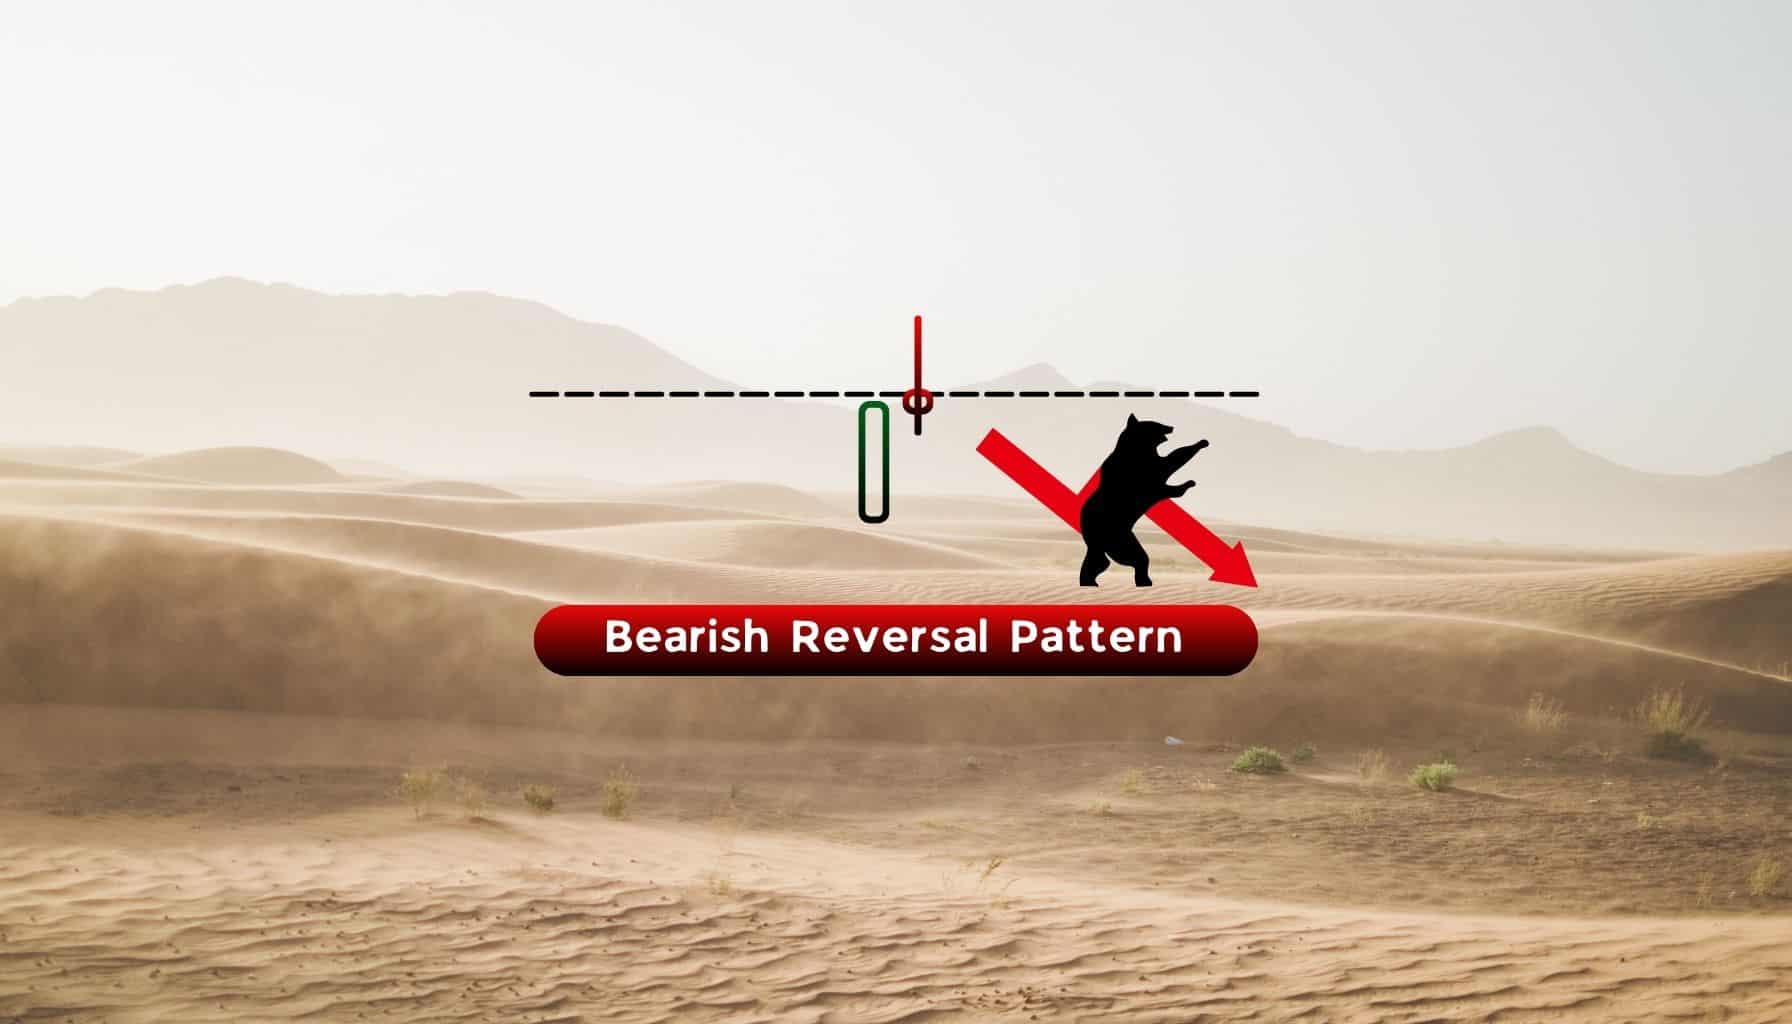
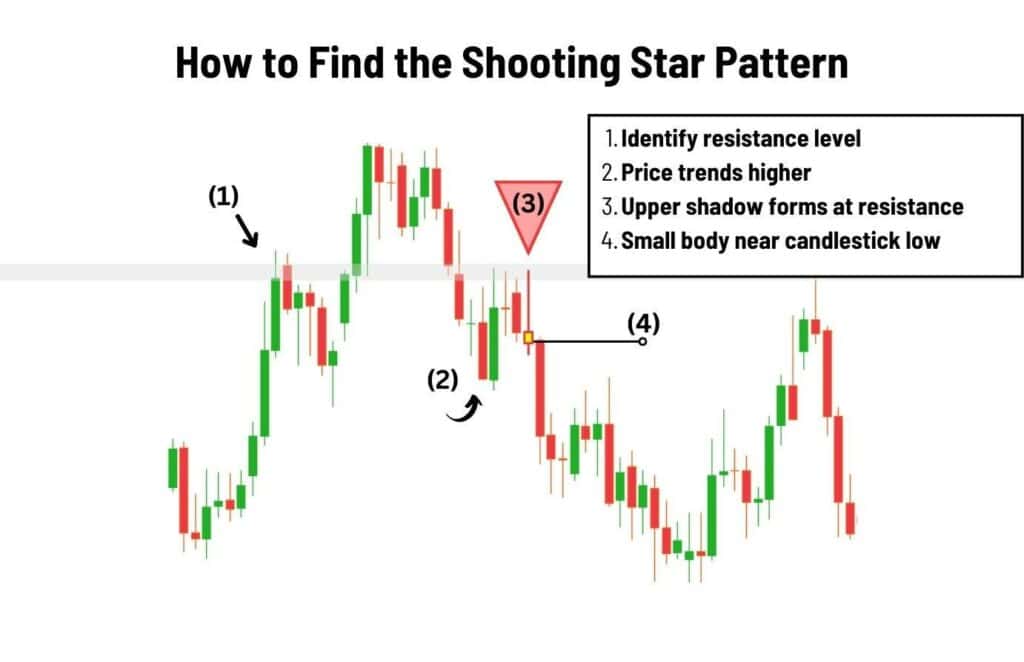
The image below illustrates how you can identify the shooting star pattern in four easy steps.
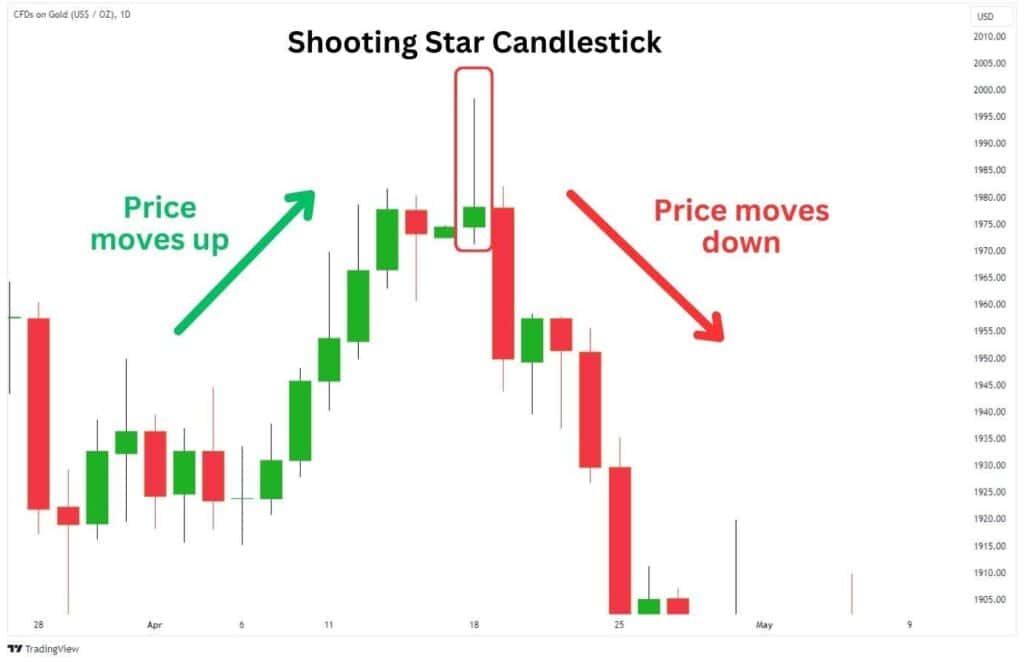
Shooting Star Example
A great example of a shooting star is the Gold Spot (XAUUSD) 1D chart. In this scenario, the shooting star occurs after a significant price advance when Gold’s price retested its previous high at $1358, signalling a trend reversal. As a result, the price declines back down to $1310.

For traders in a long trade, the shooting star formation could have acted as an exit signal to close the trade. Conversely, traders looking to get in a position could have entered a short on the close of the confirmation candle.
How to Set Stop Loss and Take Profit for Shooting Star
The shooting star is a highly versatile candlestick pattern in terms of how you can approach trading it. Depending on the trader’s risk appetite and personal strategies, the entry conditions will vary. In this section, we’ll go over the very basics of how you can enter a short trade using the shooting star.

Confirmation Candle
The shooting star candlestick can be treated as a short entry signal the moment it forms. A trader may prefer this approach if they have a bigger risk appetite, and don’t mind the potential for false signals as the shooting star offers a high risk-to-reward ratio.
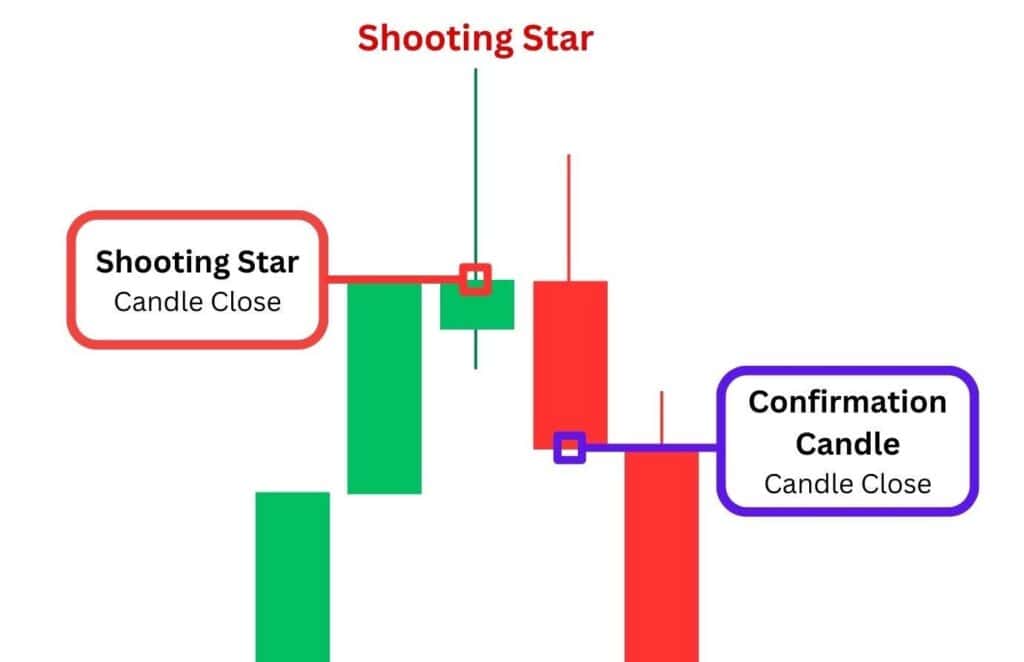
However, traders looking for a safer approach can opt to wait for a confirmation candle. This would be a following candle that closes below the shooting star’s candle body.
Where to Take Profit (TP) for the Shooting Star Candlestick Pattern
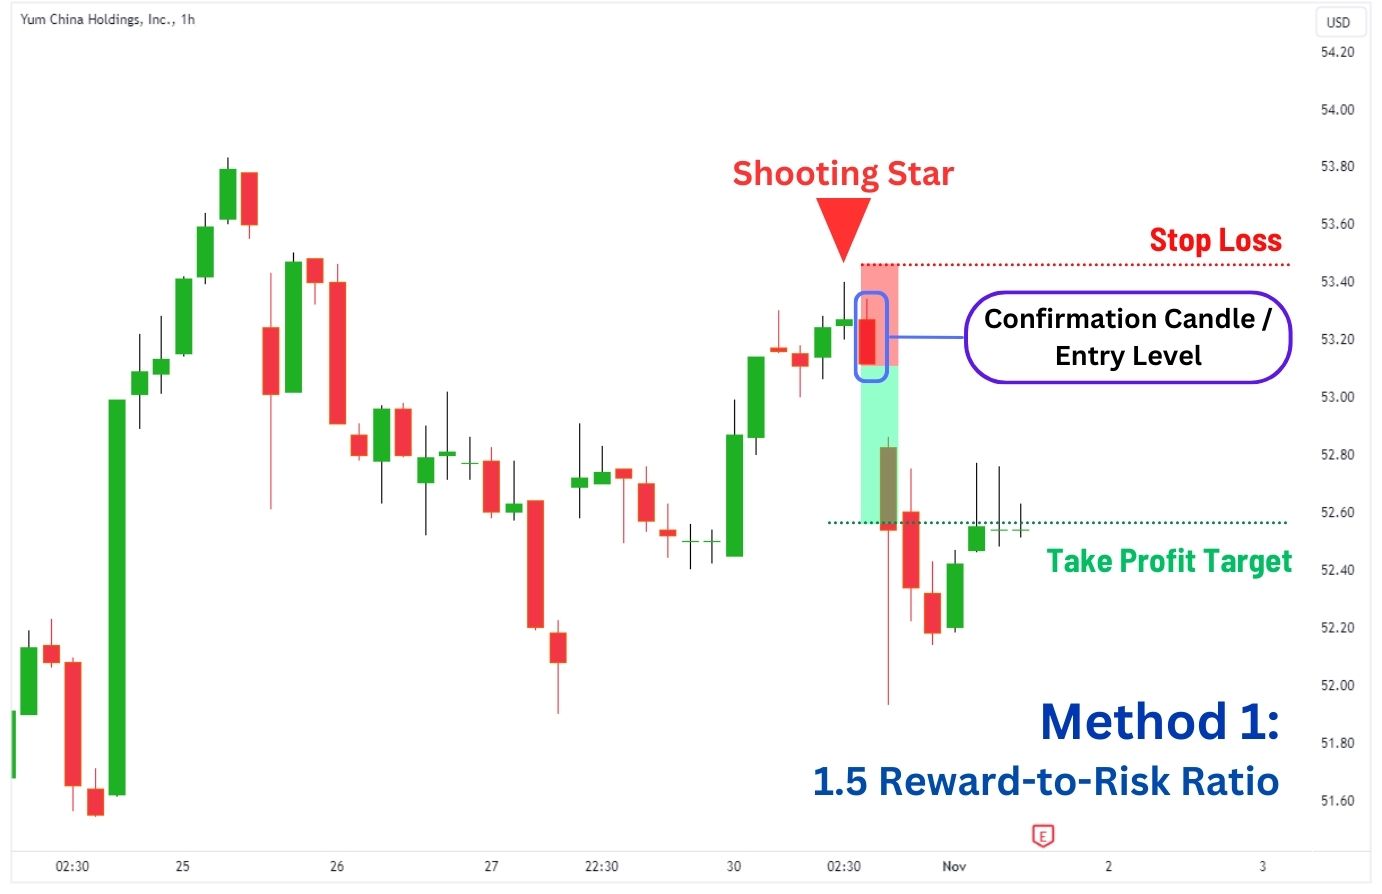
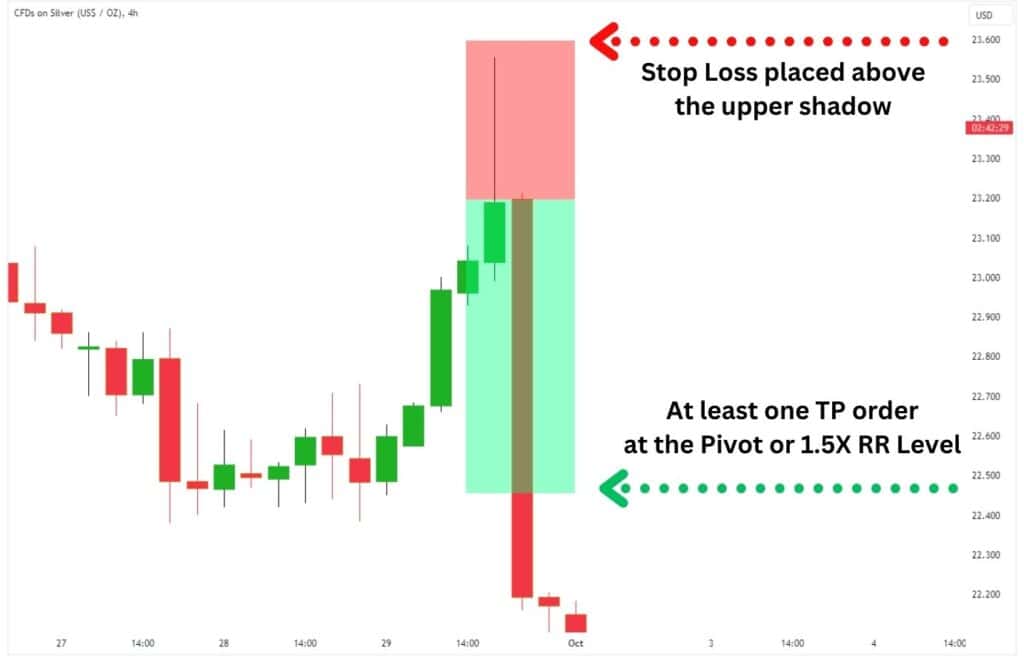
A shooting star candlestick pattern does not have a measured move target like traditional chart patterns. That means your take-profit targets would be placed at a 1.5 R/R ratio, or the next major support level.
Let’s get into it:
- Setting Your TP to 1.5x the distance of your SL:
One profit target to aim at is to select a standardised distance, like 1.5x the distance to your stop loss. For instance, if your stop loss was $10 away from your entry, then your take profit would be $15 away.
We recommend the 1.5 reward-to-risk ratio as it strikes a good balance between win rate and average gain per win. You can adjust this ratio to your liking, however, be warned that increasing the reward-to-risk will generally drive your win rate lower. - Previous Pivot Highs and Lows:
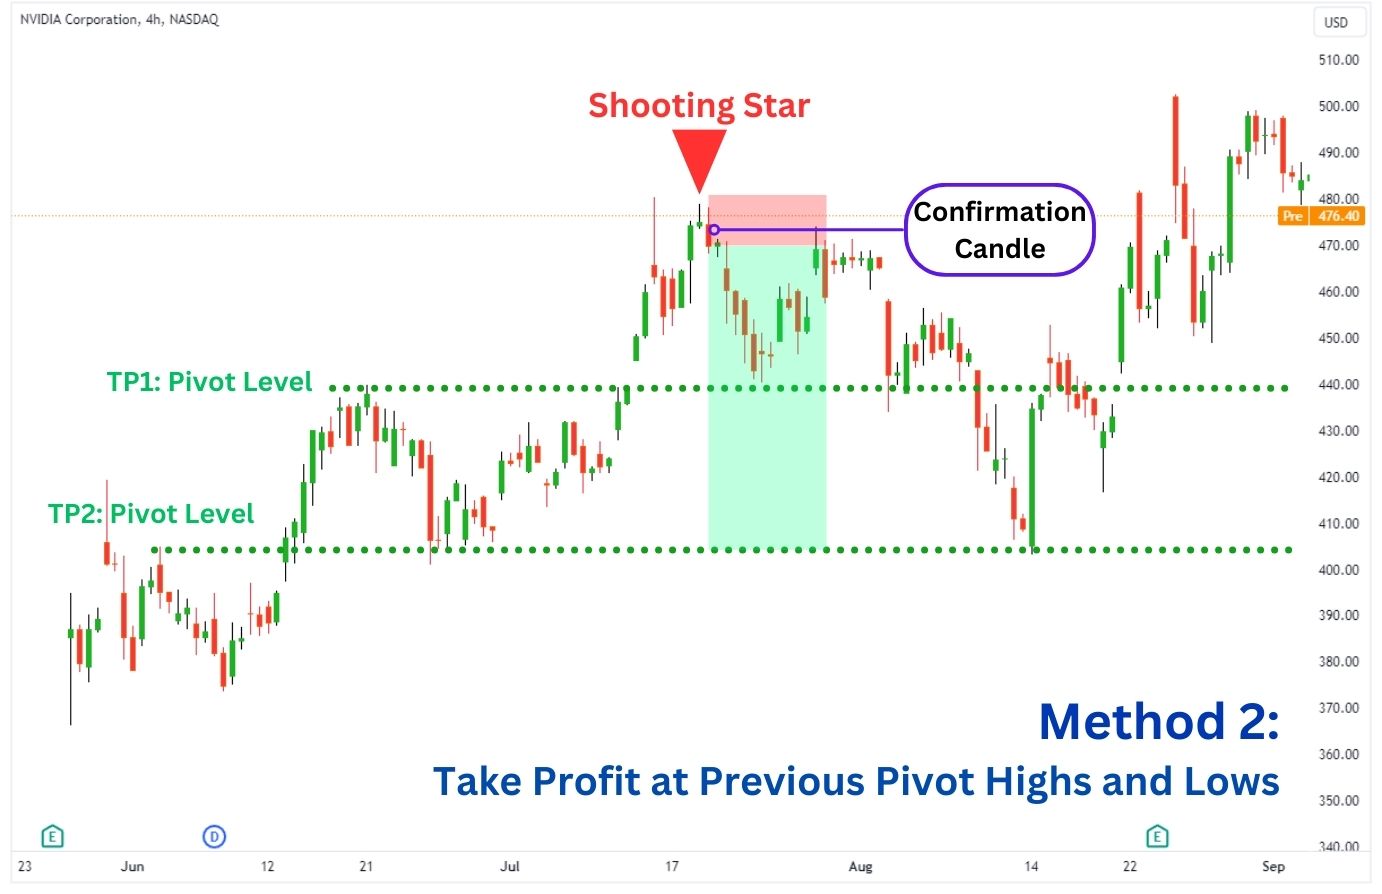
These are previous points in the chart where the price made a reversal and pivoted. Pivot levels are important to mark out as they communicate where traders are interested in buying or selling. If the price is dropping, we’re looking for a bullish reaction at these pivot levels. Conversely, if the price is rising, we’re looking for a bearish reaction.
To illustrate, take a look at our example of the NVDA stock on the 4H timeframe. See how the price has reacted to the previous high at ~$440 (TP1), and the previous low at ~$405 (TP2)?
Since we don’t know where the price could stop and reverse, it’s a good idea to set multiple take-profit orders based on the pivot levels. Eventually, we saw NVDA resume its uptrend after testing the TP2 Pivot Level. - Breakout Pattern Targets:
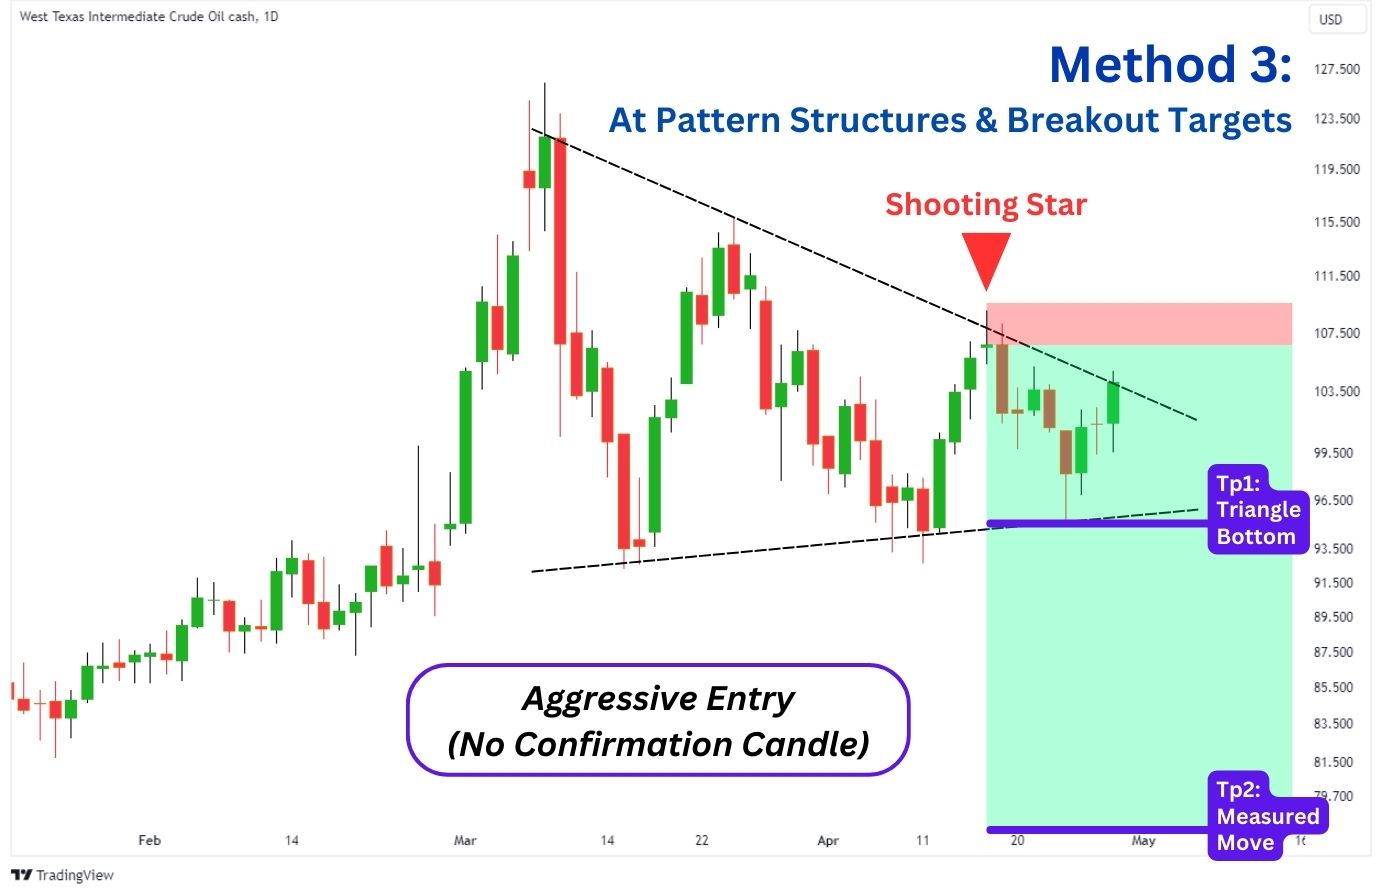
If your shooting star candlestick was formed within a breakout pattern, you can set your take profit targets according to the pattern’s trendline structures, and its measured move target.
This provides a wonderful hedge trade opportunity, and if you’re lucky, the pattern may break out in your trade direction giving you an incredible R/R ratio in a swing short position.
Stop-Loss (SL) Placement
When trading the shooting star candlestick, always set your stop loss above the candlestick’s upper shadow with a couple of extra points to accommodate the spread. This protects your trade from being wicked out too quickly, as the shooting star candle is prone to form a few times in a row.
What’s a Good Risk-To-Reward Ratio For The Shooting Star Pattern?
When trading the shooting star pattern, we recommend using a minimum of a 1-to-1 risk-to-reward ratio where you are targeting the same distance to your stop loss. We suggest this as a minimum because it offers a high enough win rate that you don’t get discouraged, but still allow yourself to be consistent. For example, not accounting for spread and commission, a 1-to-1 risk-to-reward ratio means a 50% win ratio is breakeven. Above a 50% win ratio, the trader is profitable and below the 50% win rate, the trader is at a loss.
You can also opt to use a 1-to-2 risk-to-reward ratio, where the reward is twice the amount you are risking. This setup allows you to lower your breakeven win rate to 33%. With our shooting star strategies, we found the 1 -to-1.5 risk-to-reward ratio works well as its breakeven rate is 40%.
Remember to keep your risked amount (per trade) at 2% or less of your total account balance. This prevents your account from experiencing an overblown drawdown due to a single bad trade.
Strategies To Trade The Shooting Star Candlestick Pattern
Traders use the shooting star candlestick to trade various strategies, each with its strengths and weaknesses. The opening and rise of the shooting star candle often indicate the same buying pressure as seen in the previous trading sessions. Let’s go over a few of them to get you started.
Sell the Rally Strategy
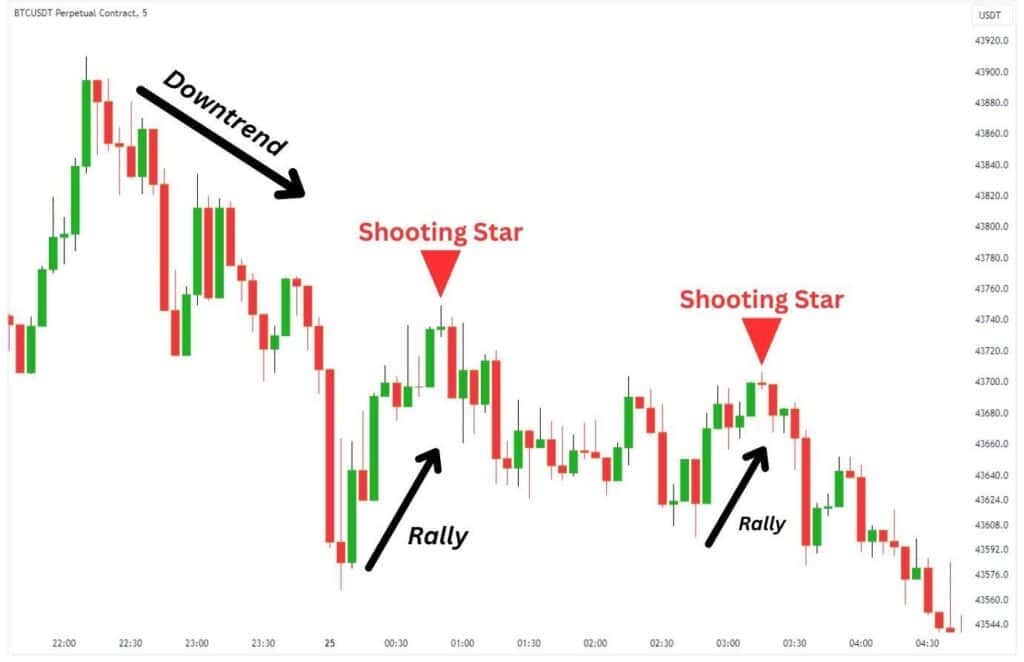
This is an easy strategy to employ during a downtrending environment. Visually, the market structure needs to be consistently forming lower highs and lower lows.
In such an environment, traders can look for the formation of shooting star candlesticks on rallies during a downtrend. Once the candlestick is formed with a confirmation candle, you may enter a short trade
You can take technical analysis of this strategy to the next level by finding the Fibonacci retracement areas on each pullback, and watch for shooting stars at key Fibonacci levels such as 0.382, 0.5, and most importantly the Golden Ratio level at 0.618.
Using Resistance Levels
The shooting star can be combined with the clear resistances you have charted out. These resistances can be identified with various techniques, and they can stack together in the same area.
Cheat sheet of resistance levels to look for a shooting star:
| Type of Resistance | How to Identify |
| Pivot Levels | Mark the exact levels where the price had made a reversal to the upside or downside. |
| Historical Levels | Mark levels where the price had reacted to on the Daily, Weekly, or Monthly timeframes. |
| Fibonacci Levels | Take the Fibonacci tool and connect the recent pivot lows and pivot highs. Pay attention to the 0.382, 0.50 and 0.618 levels. |
| Moving averages, vWAP | Technical indicators such as the moving average, and the vWAP (volume-weighted average price) can act as dynamic resistances. |
| Trendlines | Find obvious slants that the candlesticks are respecting, and draw a trendline over the top of the wicks across the candlesticks. |
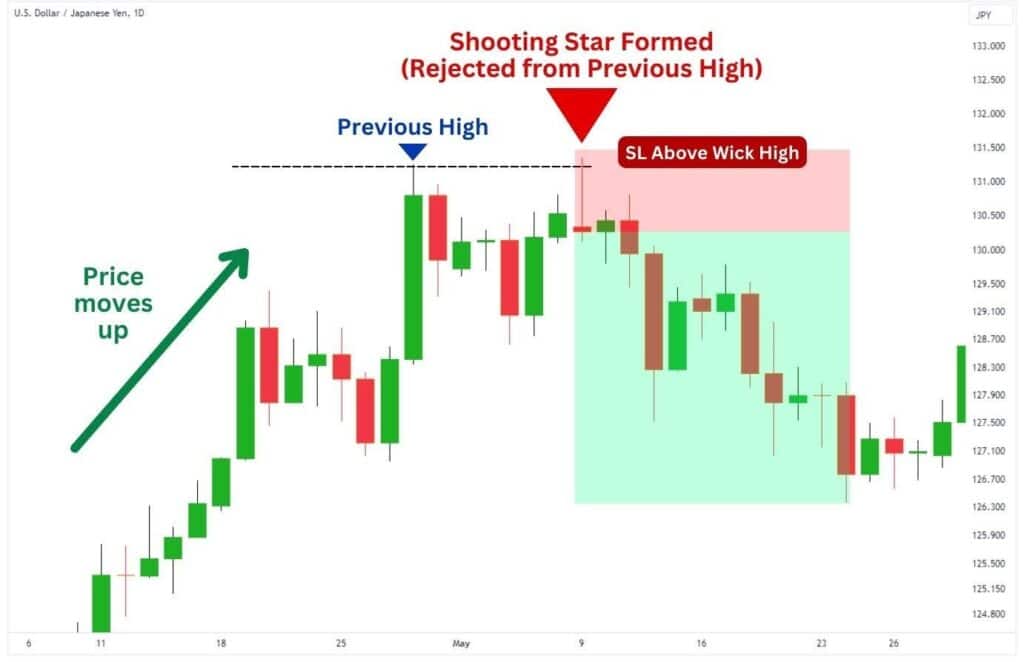
For our example, let’s take a look at how you can trade pivot levels with a shooting star pattern. By identifying a pivot, we know where to expect a shooting star, creating a potential bearish reversal.
Look at this opportunity on USDJPY 1D (May 2022) for example. After forming a pivot high at ¥131.26, the price retraces briefly, then makes another run at the pivot high level. It’s at this point that a shooting star candlestick is formed, confirming bearish pressure to be present at the pivot highs. From here, you can already take a short trade, with a stop loss placed above the wick high.
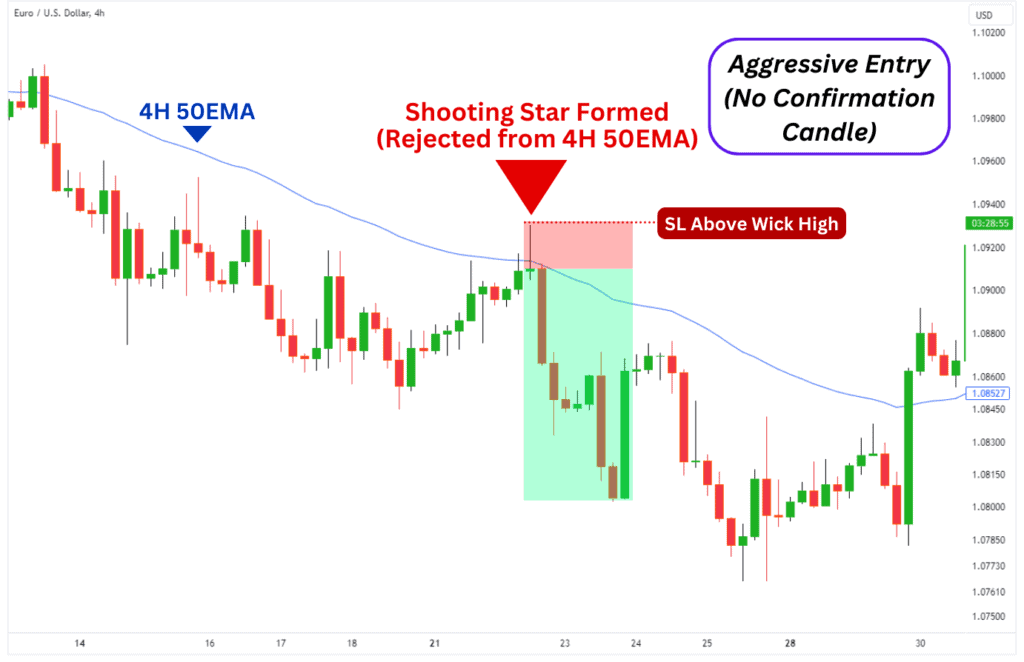
Here is another example, this time using moving averages as resistance on the EURUSD 4H chart in August 2023. As one can observe, a green shooting star had formed after tapping the 4H 50 period exponential moving average. With no time to spare, the price reverses to the downside by approximately 1.15%.
Advantages of Shooting Star Candlestick Pattern
Like everything in trading, the shooting star pattern has its merits and flaws. Let’s start with the four main advantages you get from actively trading this pattern:
| Easy to spot: | The pattern is only one candle’s length and easily recognisable on the chart. |
| High reward-to-risk short positions: | Trading the shooting star pattern can sometimes result in high R/R swing short positions, especially if you happen to catch the top for a traditional chart pattern like a triangle or double top. |
| Protects your existing trades: | The shooting star can inform traders to exit their current longs, protecting their profits before the price makes a bearish reversal. |
| Great hedging opportunity: | Alternatively, traders can use the candlestick pattern as a signal to enter a hedge short, which can be invaluable to a trader’s mental state. |
In a nutshell…
The most notable advantage of the shooting star pattern is that it allows you to preemptively trade traditional breakout patterns, which provides you with a good risk-to-reward ratio compared to the conventional method of breakout trading.
Disadvantages of Shooting Star Candlestick Pattern
Whilst the shooting star has its suite of benefits, there are also downsides to using this candlestick pattern…
| False signals: | This does not always trigger a trend reversal, especially when a confirmation candle isn’t used. |
| Confirmation candle can cause you to miss the move: | While waiting for a confirmation candle improves your win rate, it can also cause you to miss a major trade. There are instances where the price immediately starts dropping after forming a Shooting Star. |
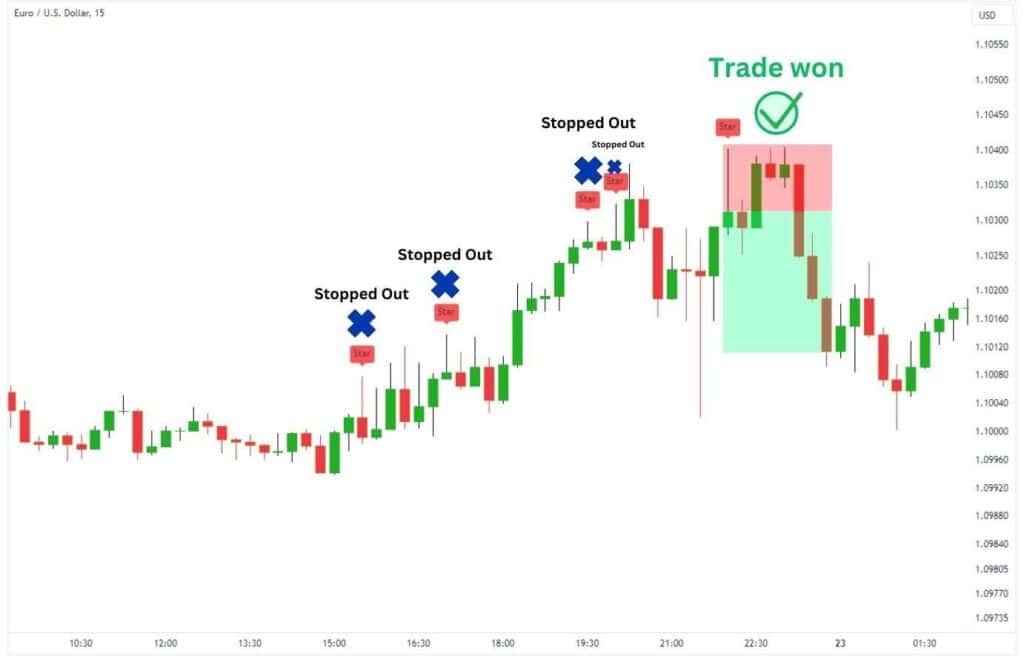
| Prone to being stopped out: | Price may chop around the shooting star, taking you out of your trade before moving in your favoured direction. |
| Need to trade alongside other factors: | As the shooting star pattern is prone to false signals and being stopped out, it requires the use of other confluences like resistance, Fibonacci, RSI, or other similar indicators to be effective. |
In a nutshell…
The key disadvantage of the shooting star is that it requires confluence from other factors, such as resistance levels, divergences, or a confirmation candle to improve the odds of your trade working out.
In the case of a shooting star, the confirmation would require the next candle to close below the candle body of the candlestick pattern. Although it’s not entirely foolproof, this mitigates the amount of false signals one receives with the shooting star alone.
What Makes A Shooting Star More Bearish?
If a shooting star candle closes in red instead of green, it signifies stronger bearish pressure from sellers at the price zone. When combined with other factors, a red shooting star candlestick can provide a great sell signal for traders to enter.
There is sound logic in why traders perceive a red shooting star as more bearish than a green shooting star. First, the shooting star tells that the candlestick closed lower in price than where it started in price. Second, the long upper shadow indicates that the buyers attempted to push the price higher, but just did not have adequate buying power to sustain it – adding to the list of bearish signs.
How To Spot Resistance With Shooting Star Patterns
The first step to finding resistance with a shooting star pattern is to observe where the wick has formed, and then… look left for any confluences!
Check for any trend lines, horizontal resistance levels, moving averages, pivots, or Fibonacci levels at where the shooting star was formed. A general rule of thumb is that the more confluences you can find, the more likely the shooting star will play out.
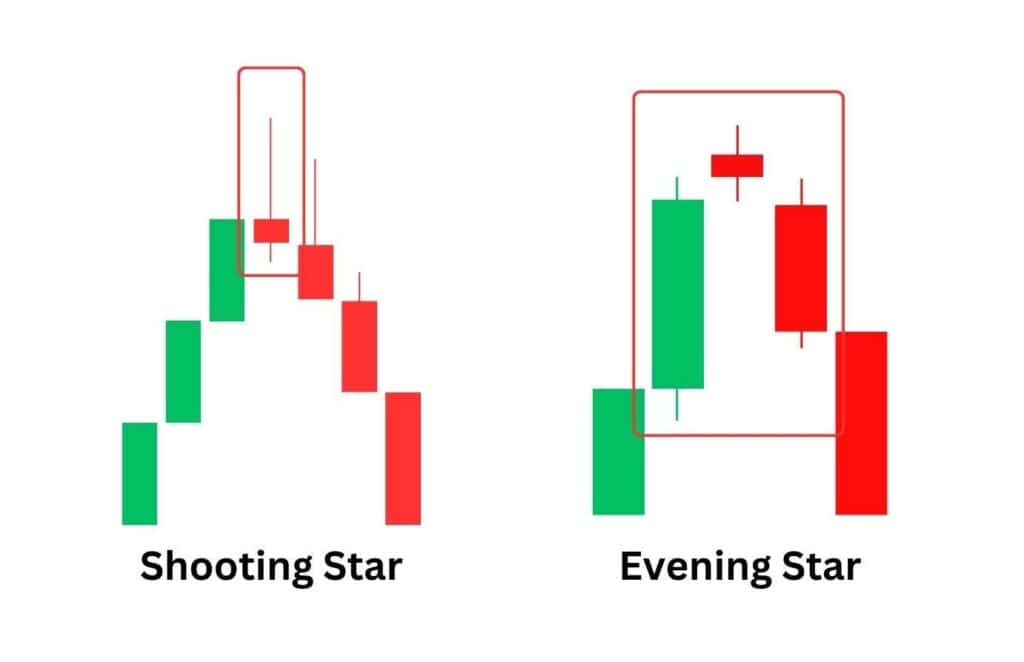
Shooting Star vs Evening Star
The shooting star is a singular candlestick pattern, while the evening star is a pattern that spans over three consecutive candlesticks. They are both patterns that are found at the end of an uptrend, and signal a bearish market reversal.
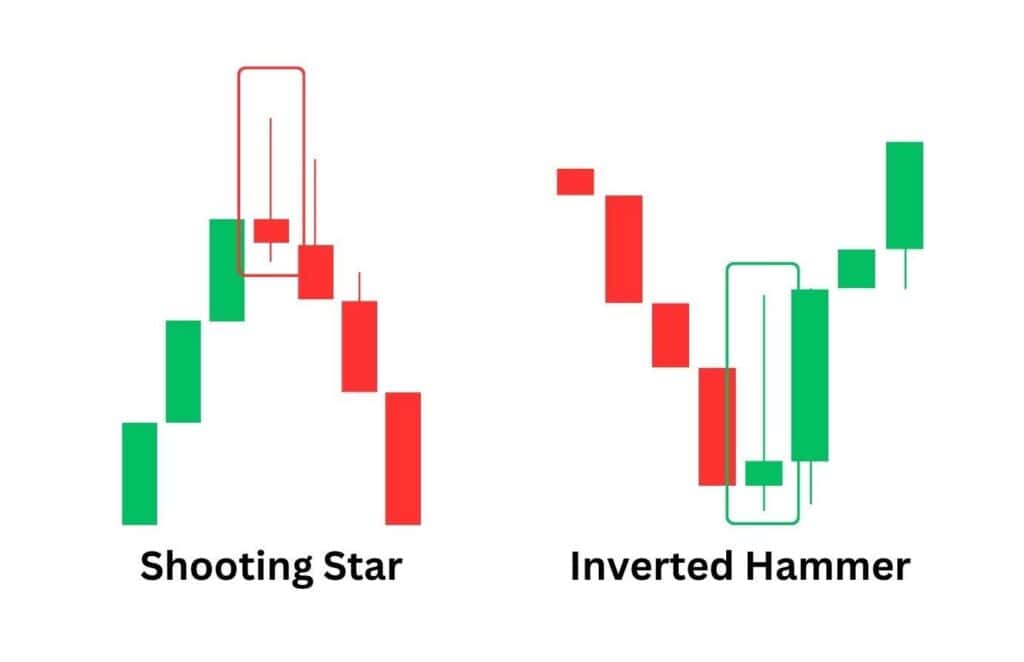
Shooting Star vs Inverted Hammer
The shooting star candlestick is visually indistinguishable from the inverted hammer candlestick. However, the key difference lies in where they are formed – the shooting star is formed only after the price has moved up, while the inverted hammer forms after the price has moved down.
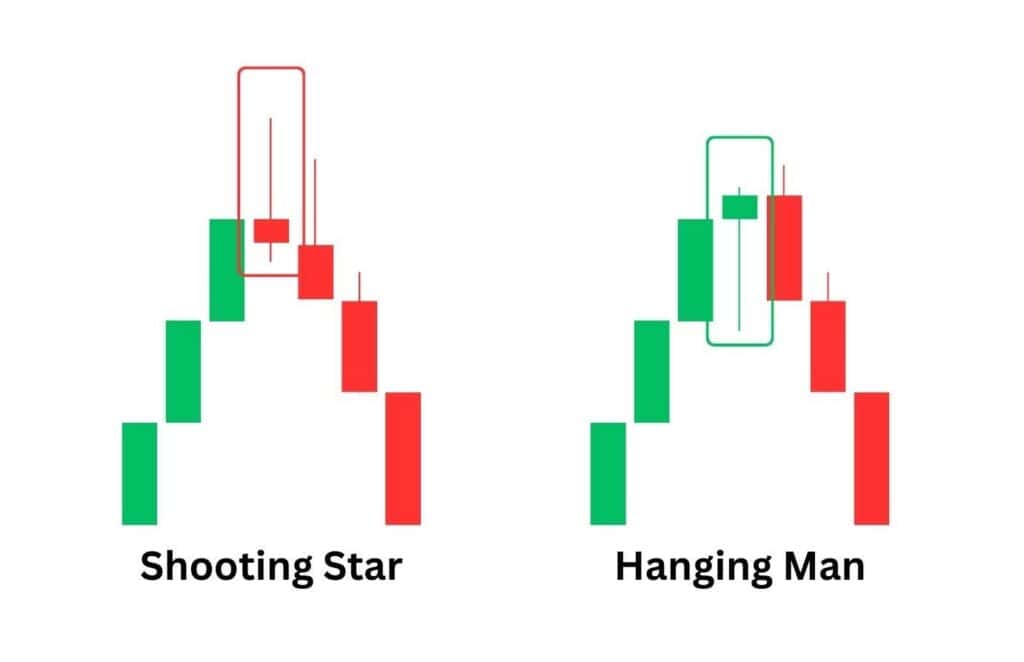
Shooting Star vs Hanging Man
Like the shooting star, the hanging man candlestick pattern appears at the top of a bearish trend. The key difference is how the candlestick forms; while the shooting star has a long upper tail, the hanging man has a long lower tail. Both patterns are indications of a possible bearish market reversal, which hints at lower prices in the upcoming movements.
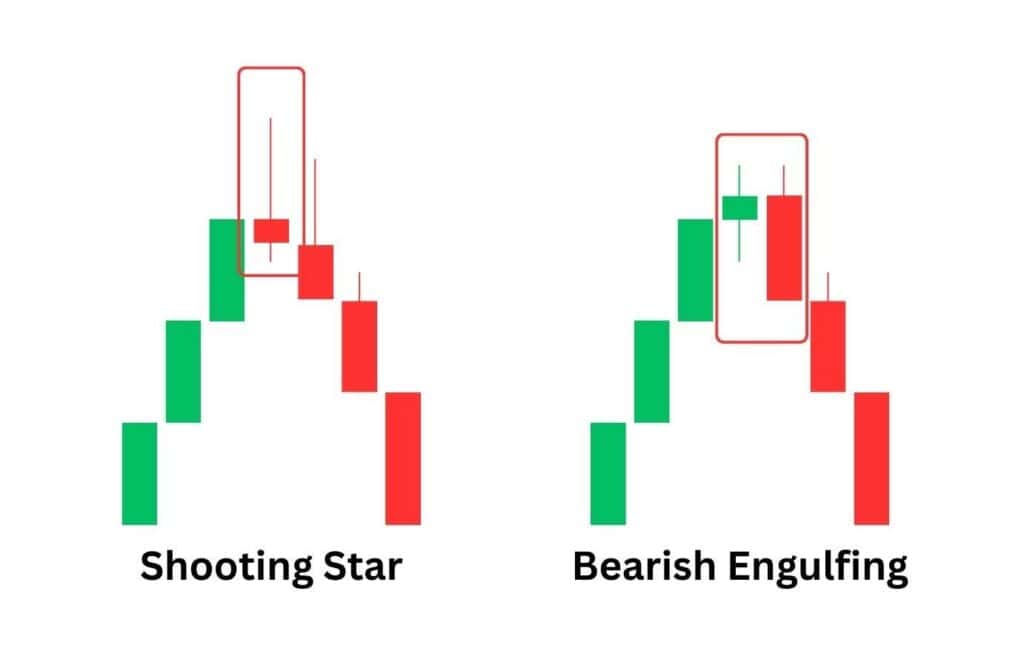
Shooting Star vs Bearish Engulfing
Both the shooting star and bearish engulfing pattern occur after a price move up. While the shooting star is a single candlestick, the bearish engulfing pattern considers the prior candlestick. A bearish engulfing candlestick must be bigger than the prior candlestick for the bearish signal to be valid.
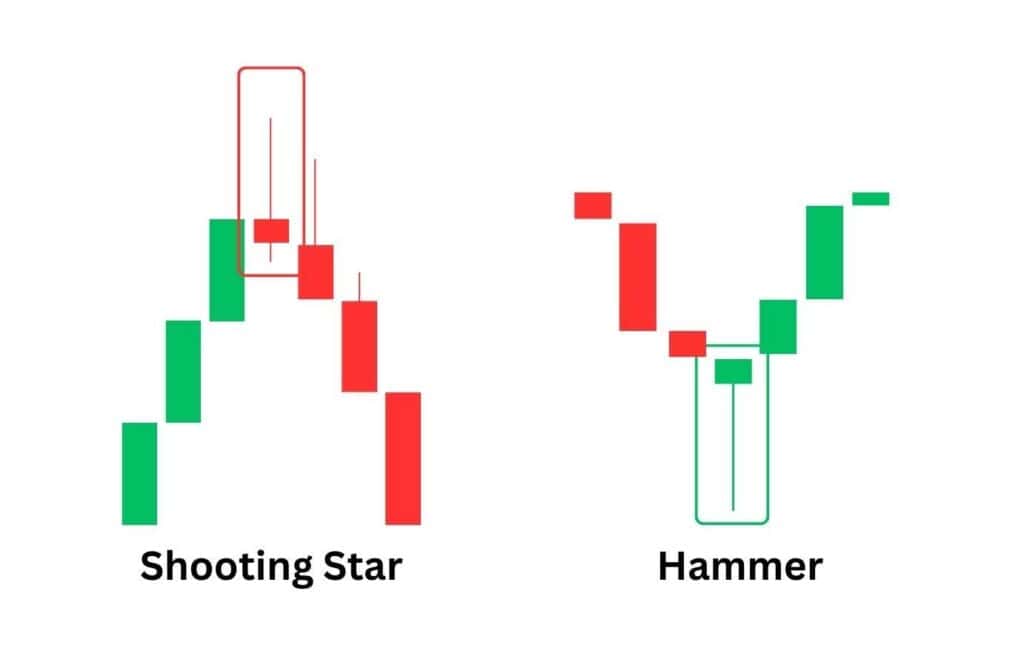
Shooting Star vs Hammer
The hammer is visually defined by a long lower shadow and a small candle body near the top of the candlestick, and it is a bullish reversal pattern. It’s the shooting star patterned mirrored, and signals a bullish direction instead of a bearish direction as an upcoming direction.
FAQ
How accurate is the shooting star pattern?
The shooting star offers a high-risk, high-reward type of signal. The pattern is prone to many false alerts, but the accuracy can be improved if you apply a confirmation candle and other factors to the pattern.
The fact it’s been traded since the 17th century and still is relevant today speaks volumes about its ease of use and effectiveness.
Is a shooting star candlestick pattern a bullish reversal?
The shooting star is a bearish candlestick pattern that could mark the temporary end of an uptrend. It’s a bearish market reversal pattern. Conversely, the cousin of the shooting star pattern – the inverted hammer – is a bullish reversal candlestick pattern.
Is there a bullish shooting star candlestick pattern?
A shooting star candlestick is inherently a bearish sign, so no, there are no bullish shooting star patterns. However, the shooting star’s cousin, the inverted hammer, is a bullish market reversal which looks identical to the shooting star pattern. The key difference is that a shooting star forms at the highs, while the inverted hammer forms at the lows of a price move.
What does an inverted shooting star candlestick show?
Whilst there is no pattern directly called the “inverted shooting star”, there are 2 patterns which look like a shooting star flipped vertically. They are the hammer candlestick pattern, and the hanging man candlestick pattern respectively.
The hammer candlestick is a bullish reversal pattern which forms at support levels after a price decline. Conversely, the hanging man is a bearish reversal pattern which forms at resistance levels after a price increase.
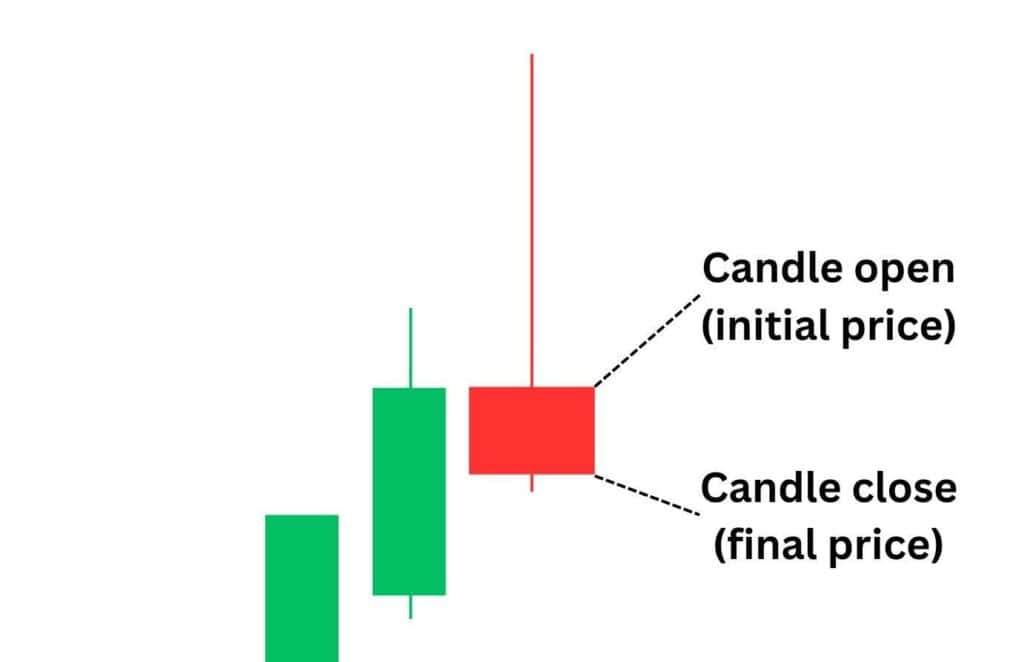
Red vs green shooting star candlestick – what’s the difference?
A red shooting star means the price has closed below its initial opening price. Conversely, the green shooting star implies that the price remains above its opening value. Generally speaking, the red shooting star is a stronger indication that the price may start to decline.
How reliable is a shooting star pattern in predicting market trends?
A shooting star pattern can be reliably traded when you apply other confluences with it. When paired with other factors such as resistance levels, momentum oscillators, and volume, the shooting star pattern can become a reliable signal of a market reversal.
Origins of the shooting star pattern?
It may be surprising, but the origins of the shooting star are rooted in Japanese candlestick patterns and charting techniques, which date as far back as the 17th century. This pattern’s continued use by traders speaks volumes about its effectiveness even in today’s market environments.