Written by:

Reviewed by:

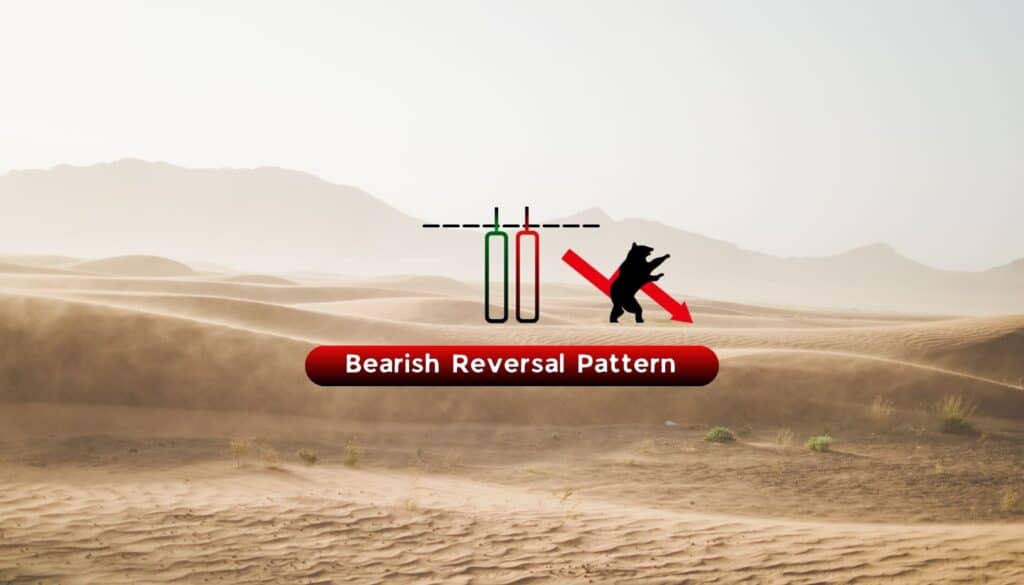
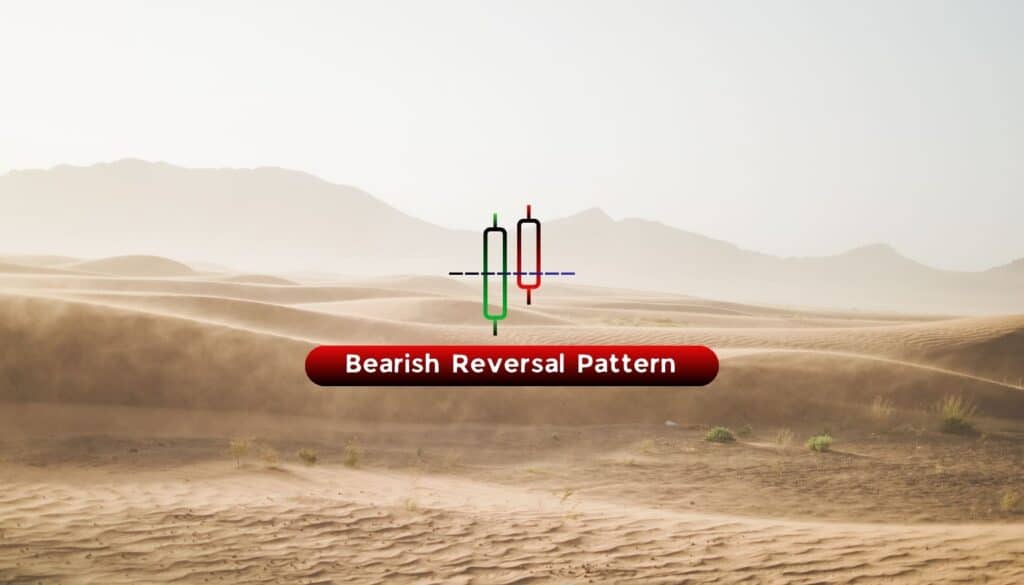
Bearish
Bullish
- July 9, 2024
- 32 min read
Pin Bar Candle Trading Guide: Spot Trades Quickly
What is a Pin Bar Candlestick?
A pin bar is a single Japanese candlestick pattern that signals a potential reversal in market trends. This pattern is identified by a small body at one end of the candlestick, with a long shadow or wick extending from the other end. The long shadow indicates a strong rejection of a specific price level, suggesting that the market may change direction. Named for its deceptive appearance, the term “pin bar” is an abbreviation of “Pinocchio bar” as the long wick signals a false move in one direction before reversing.
The pin bar candlestick pattern is a crucial tool in technical analysis, used to pinpoint possible entry and exit points in trading. Trading the reversal pin bar is particularly effective when they appear at key support or resistance levels and within the context of the prevailing market trend.
By identifying pin bars, traders can make more informed decisions and enhance their trading strategies by anticipating potential price movements based on these clear rejection signals.
Characteristics of a Pin Bar
A pin bar is identified by its long tail and a very small body. Both items together illustrate a severe rejection of prices at some point during the trading period. The tail of the pin bar should be much longer than the body, often at least three times the size of the body. It is the formation of this long shadow that represents a pin bar and it is very important for the understanding of the underlying market dynamics.
Anatomy of a Pin Bar
Understanding the anatomy of a pin bar is key to using this pattern effectively in trading. A pin bar features a small body, a long wick, and the position of the body has to be specific. This indicates strong price rejection and signals a potential market reversal. To trade pin bars effectively, it is crucial to understand the context and signs of a potential reversal.
Here is a breakdown of the pin bar to help you identify its key components and understand its significance in technical analysis.
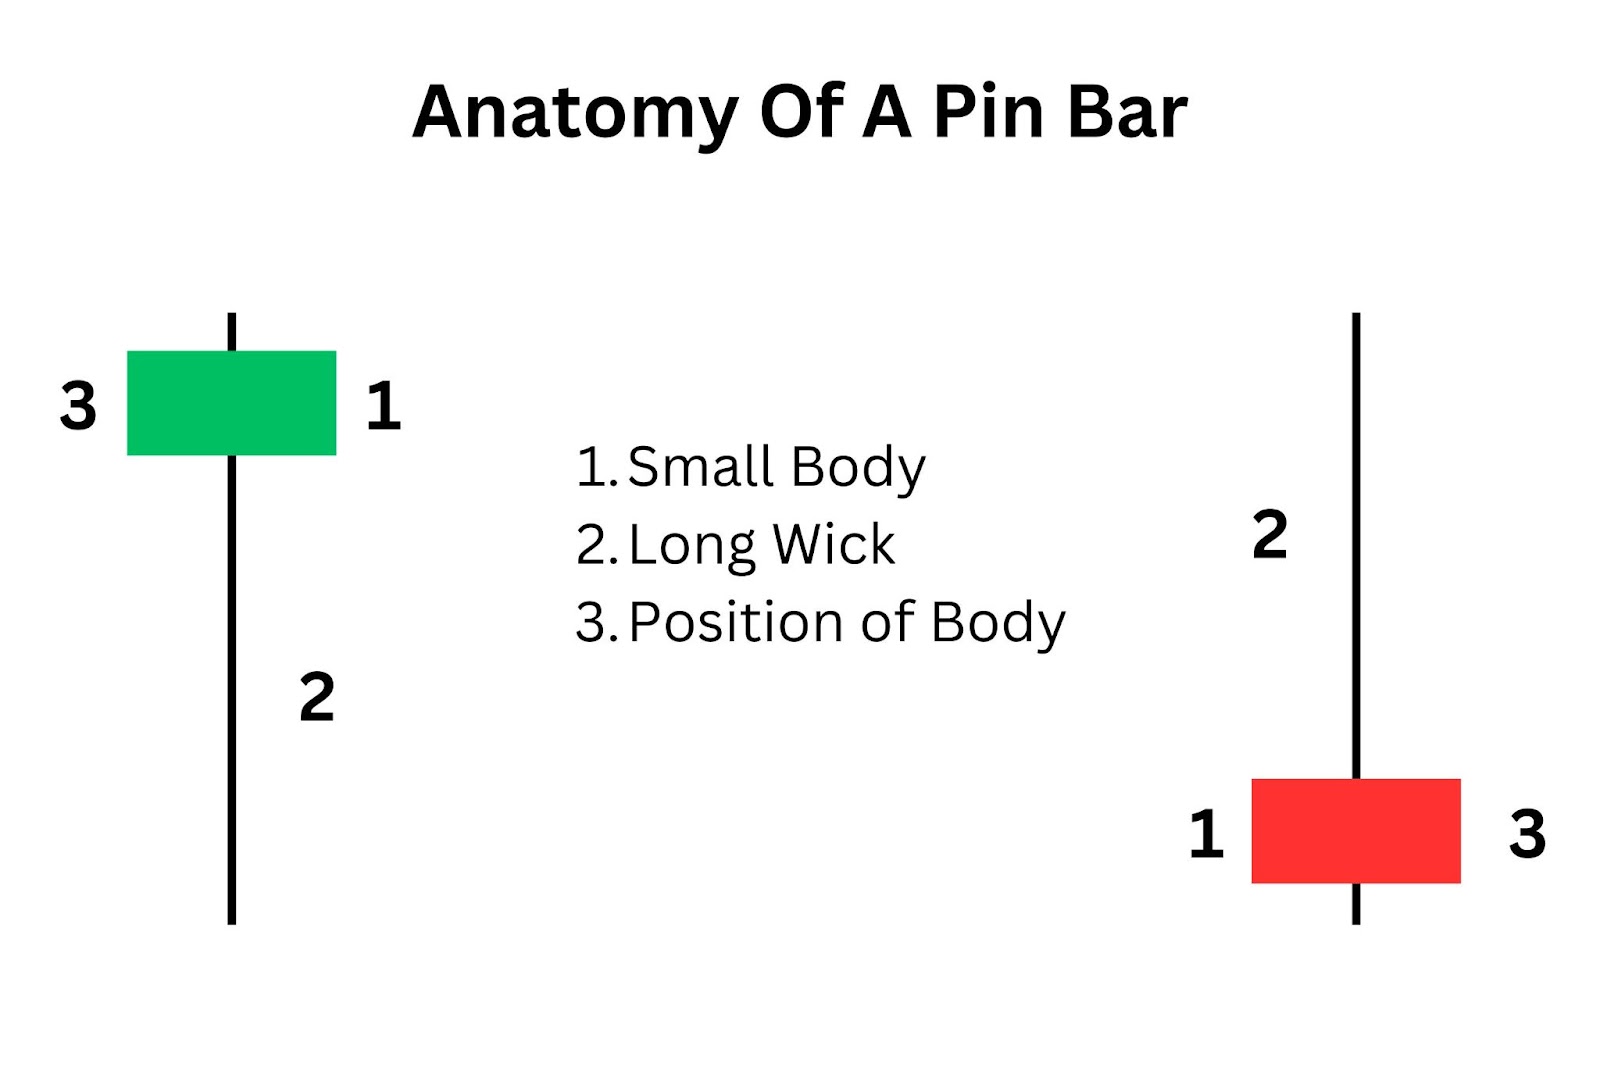
- The Long Wick: The shadow, also known as the “wick” or “tail,” points to one direction and shows strong rejection of prices. This is where the market has tested and rejected a certain price level during the trading period.
- Small Body: The distance between the open and the close of the candle is small and the body stands at one end of the candle. This small distance reflects the initial and final equilibrium between the buyers and sellers.
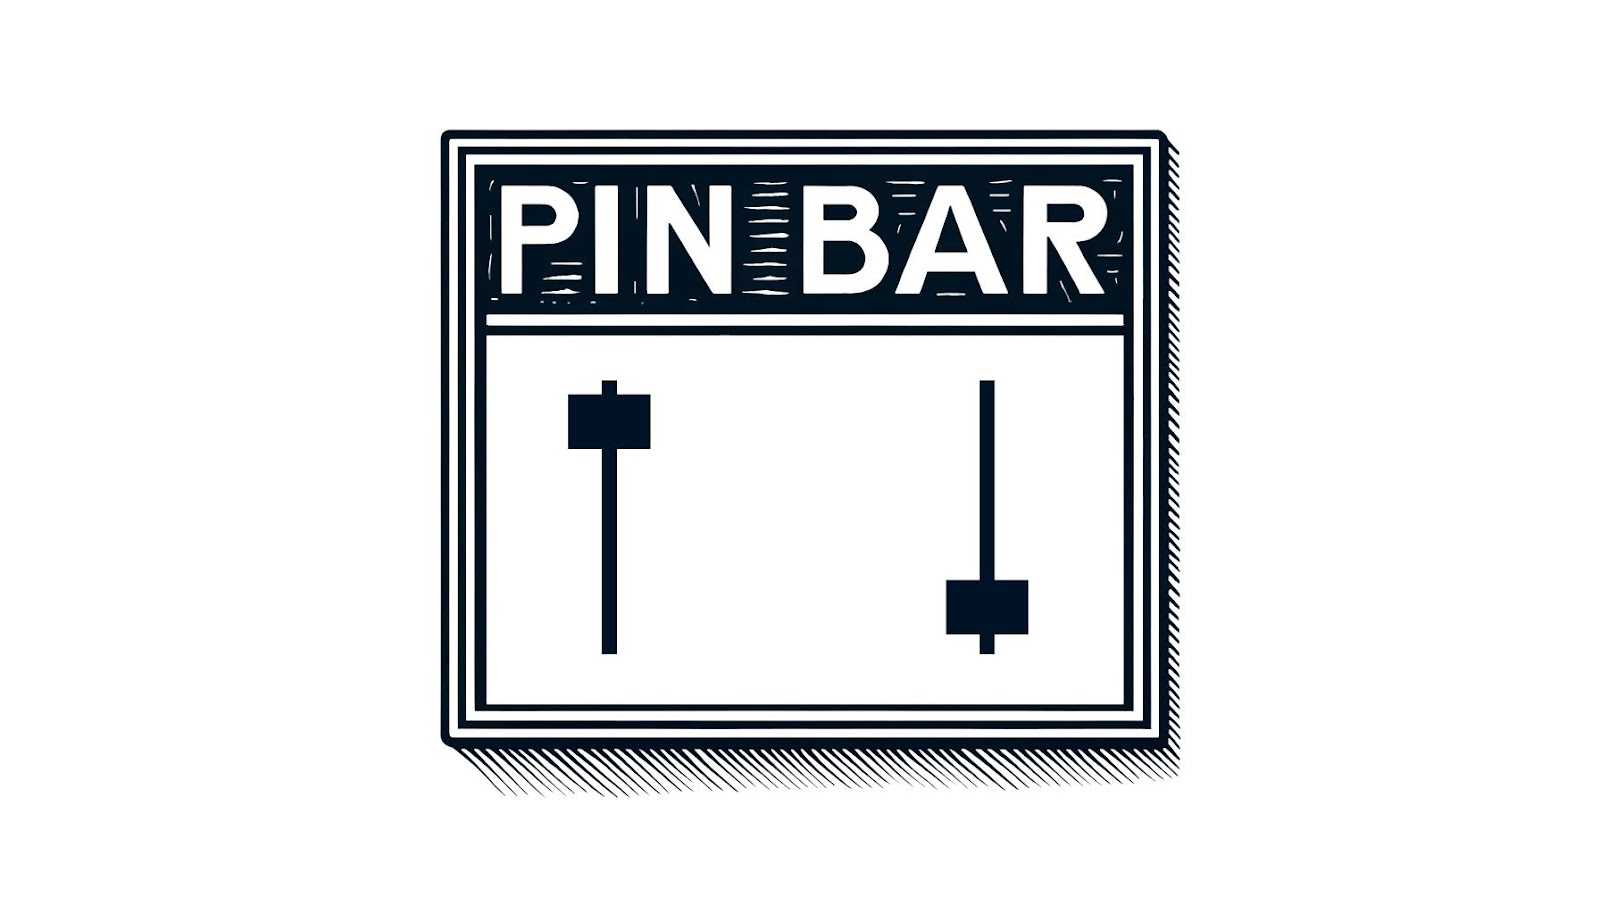
- Position of the Body: The body of the pin bar is positioned near one end of the candlestick. For a bullish pin bar, the body is near the top, with the long wick pointing downwards, indicating a rejection of lower prices. Conversely, for a bearish pin bar, the body is near the bottom, with the long wick pointing upwards, indicating a rejection of higher prices.
You may have noticed two different potential shapes of pin bars above. This is because there are two variations of pin bars: 1) bullish pin bars, and 2) bearish pin bars.
What is a Bullish Pin Bar
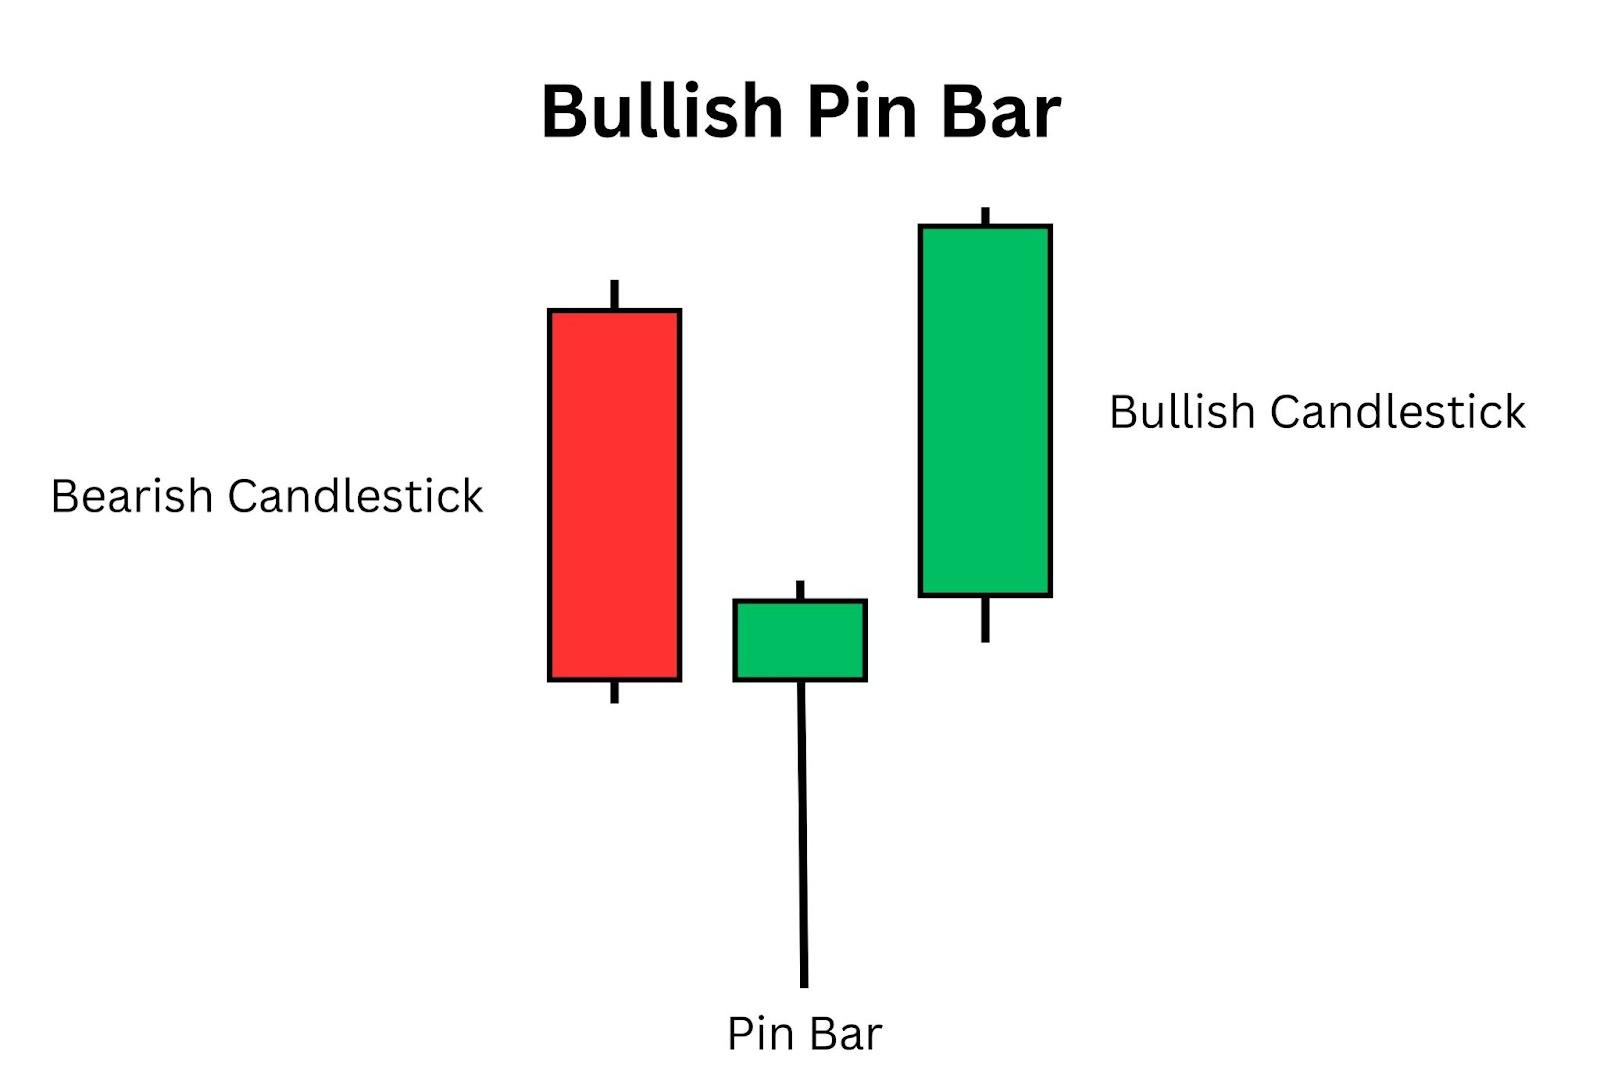
A bullish pin bar is a specific type of candlestick pattern that indicates potential upward price movement in the market. This pattern forms when prices are initially pushed lower, only to be rejected by buyers who then push the prices back up near the session’s high by the close.
As a result, the candlestick displays a long lower wick (shadow) and a small body near the top. The long lower wick signifies that sellers were initially in control, driving the price down, but buyers regained control and pushed the price swiftly higher, closing near the high of the session.
What is a Bearish Pin Bar
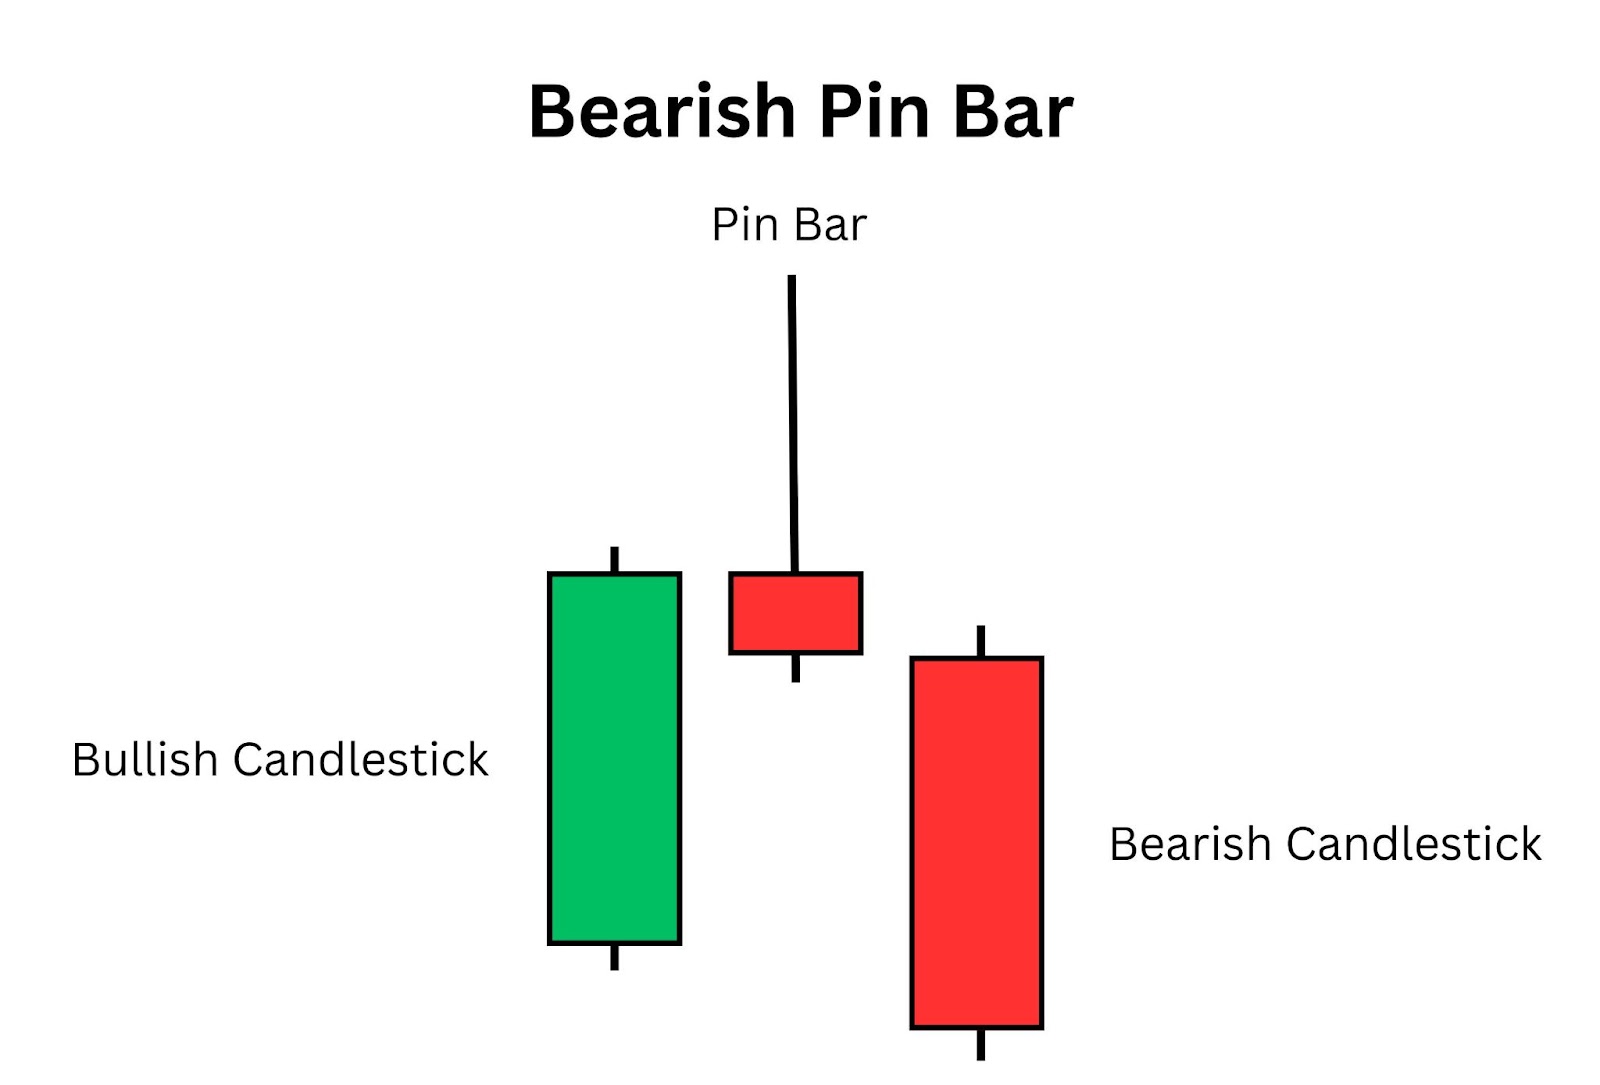
A bearish pin bar is a candlestick pattern that signals potential downward price movement in the market. This pattern forms when prices are pushed higher during a trading session, only to be rejected by sellers who then push the prices back down near the session’s low by the close.
This action results in a candlestick with a long upper wick (shadow) and a small body near the bottom of the candlestick. The long upper wick indicates that buyers were initially in control, driving the price up, but sellers regained control and pushed the price back down, closing near the low of the session.
What Does a Pin Bar Tell You?
A pin bar provides valuable insights into market sentiment and potential price reversals. The psychology behind the formation of a pin bar is essential to understand its significance.
Bullish Pin Bar:
In a bullish pin bar, prices initially trade drastically lower, creating a significant drop from the opening price. This downward movement forms a large candlestick range. However, as time progresses, buyers rush in, reversing the downward momentum. This buying pressure drives the price back up near the opening level, resulting in a small body near the top of the candlestick and a long lower wick.
The long lower wick indicates that, despite the initial selling pressure, the market found strong support at lower levels, and buyers took control, pushing prices higher. This pattern signals that buyers are now dominating and suggests a potential upward price movement.
Bearish Pin Bar:
In contrast, a bearish pin bar forms when prices initially trade significantly higher, creating a sharp rise from the opening price. This upward movement forms a large range from low to high. As time progresses, sellers come in forcefully, reversing the upward momentum and driving the price back down near the opening level. This results in a small body near the bottom of the candlestick and a long upper wick.
The long upper wick indicates that, despite the initial buying pressure, the market faced strong resistance at higher levels, and sellers regained control, pushing prices lower. This pattern signals that sellers are now dominating and suggests a potential downward price movement.
How to Spot a Pin Bar Pattern?
One of the benefits of pin bar trading is that the pattern is one of the easiest to spot. Here are three steps to help you identify a pin bar pattern:
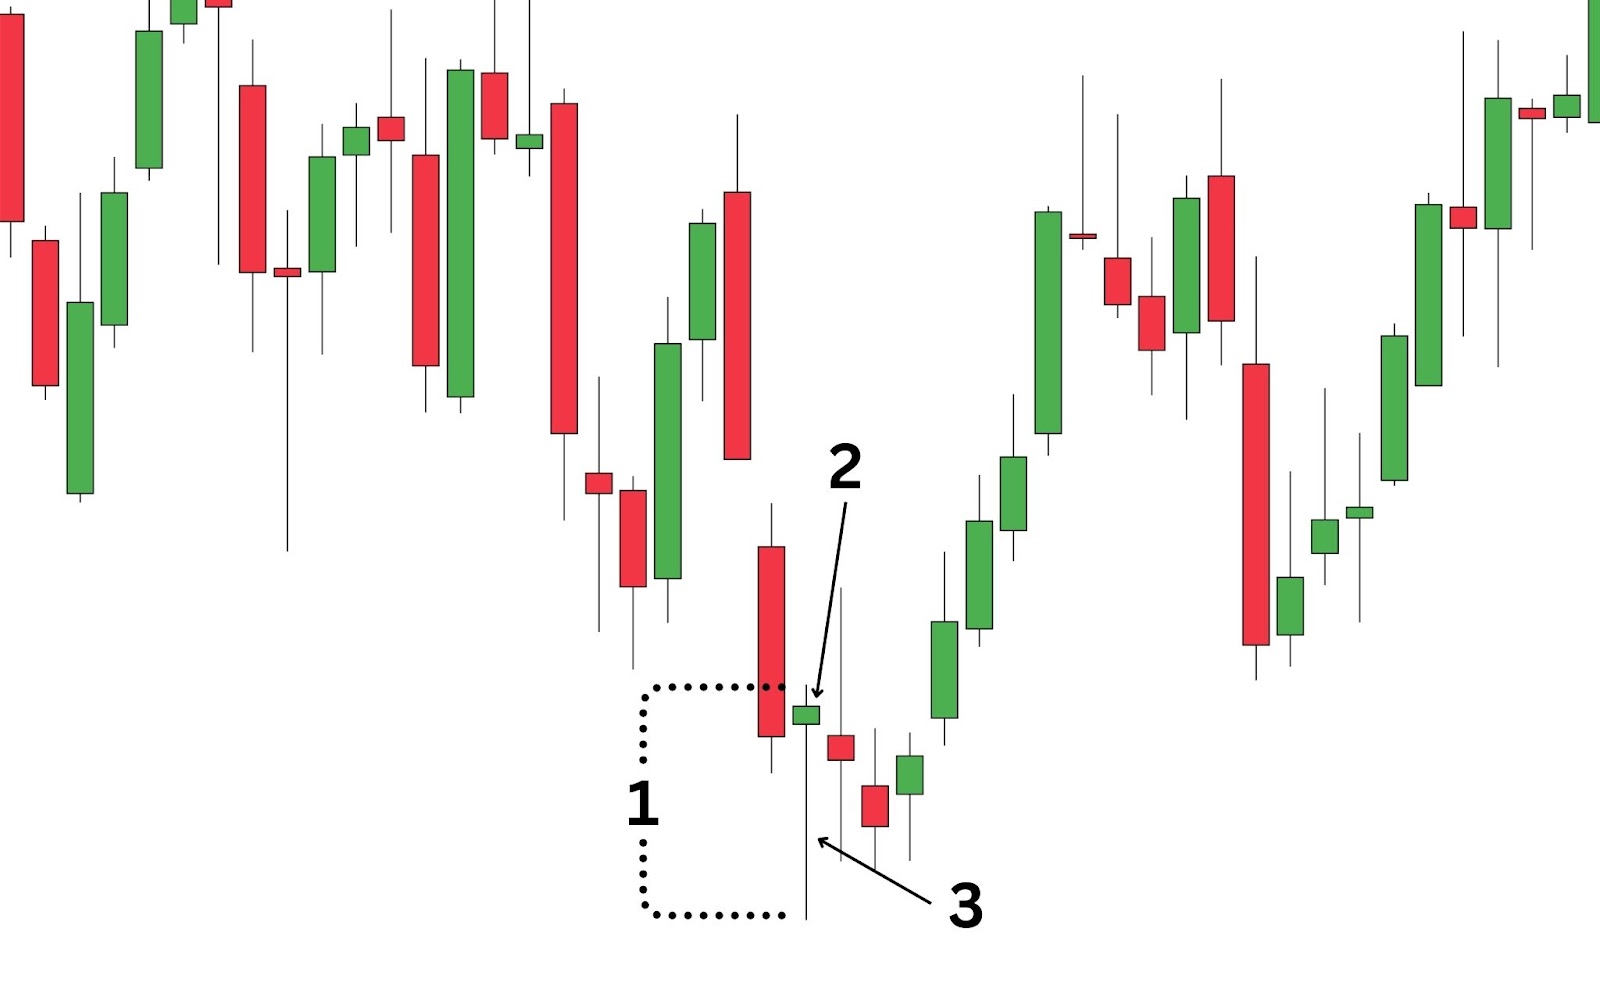
- Identify a Candlestick with a Large Range:
Look for a candlestick that is larger than average in terms of its range from high to low. This indicates significant price movement within the session, which is essential for a pin bar pattern.
- Locate the Small Body:
Next, observe the body of the candlestick. It should be small and located towards one end of the candlestick—either near the high (for a bullish pin bar) or the low (for a bearish pin bar). The small body shows that despite the significant price movement, the opening and closing prices are relatively close to each other.
- Check for a Large Wick:
Finally, look for a large wick protruding from one side of the candlestick. In the image above, there is a long lower wick indicating that prices traded much lower but were pushed back up by buyers. This resembles a bullish pin bar.
For a bearish pin bar, there should be a long upper wick, indicating that prices traded much higher but were pushed back down by sellers. The large wick signifies strong rejection of the price level, which is crucial for the pin bar pattern.
Practical Applications of the Pin Bar Pattern
Pin bars are widely used in trading for their ability to signal key market movements. Here are two common scenarios in which the pin bar is applied in real-life trading:
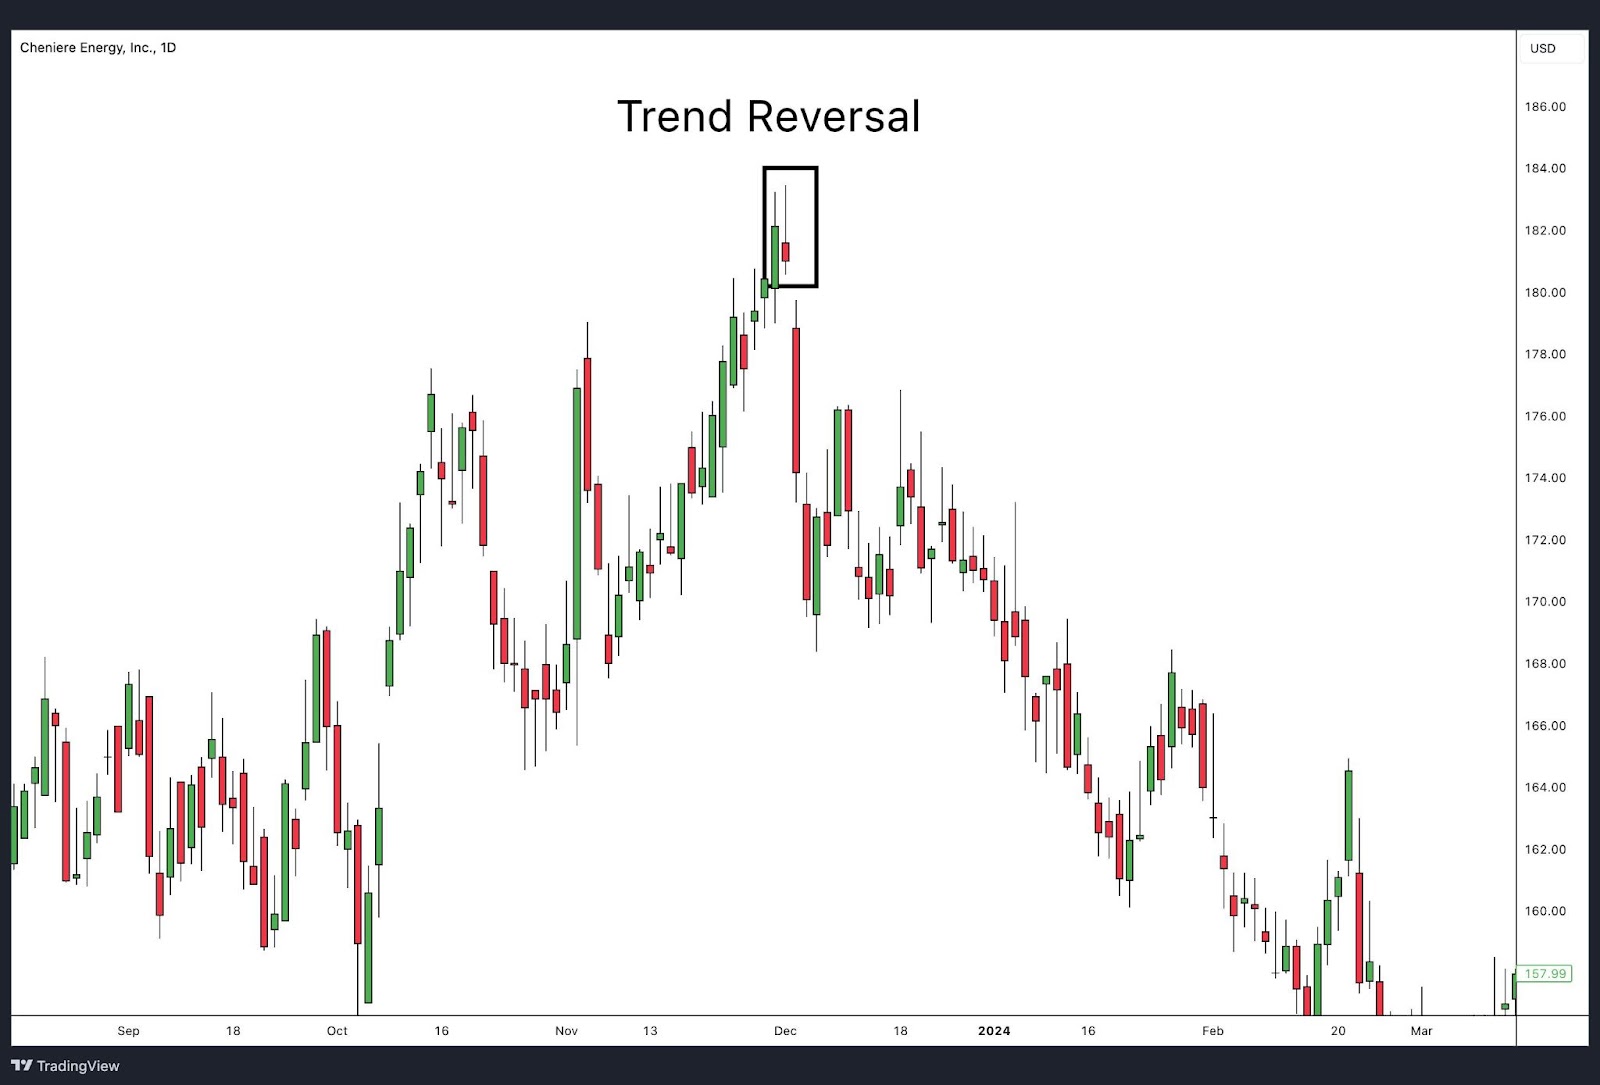
Signalling Overall Trend Reversals
A pin bar is going to act as a signal for a reversal of the trend that’s about to occur. For example, a bearish pin bar occurs right at the very peak of an uptrend, and it rejects higher prices, closes near its low, and has a long tail, showing there might be an exhaustion and a coming shift to the downside.
These signals can allow a trader to adapt their strategies to possible market movements either to continue following the current trend or to prepare for a trend reversal.
Identifying the End of Corrective Dips
A pin bar can signal the end of a short-term counter-trend or corrective dip within a larger ongoing trend. For example, in an uptrend, a bullish pin bar forms after a pullback, indicating that buyers are still in control. The long lower wick of the pin bar shows rejection of lower prices, and the close near the high suggests that the market is ready to resume its upward movement. This pin bar signifies that the corrective dip is likely over, and the larger uptrend is set to continue.
Pin Bar Examples
Gold XAU/USD
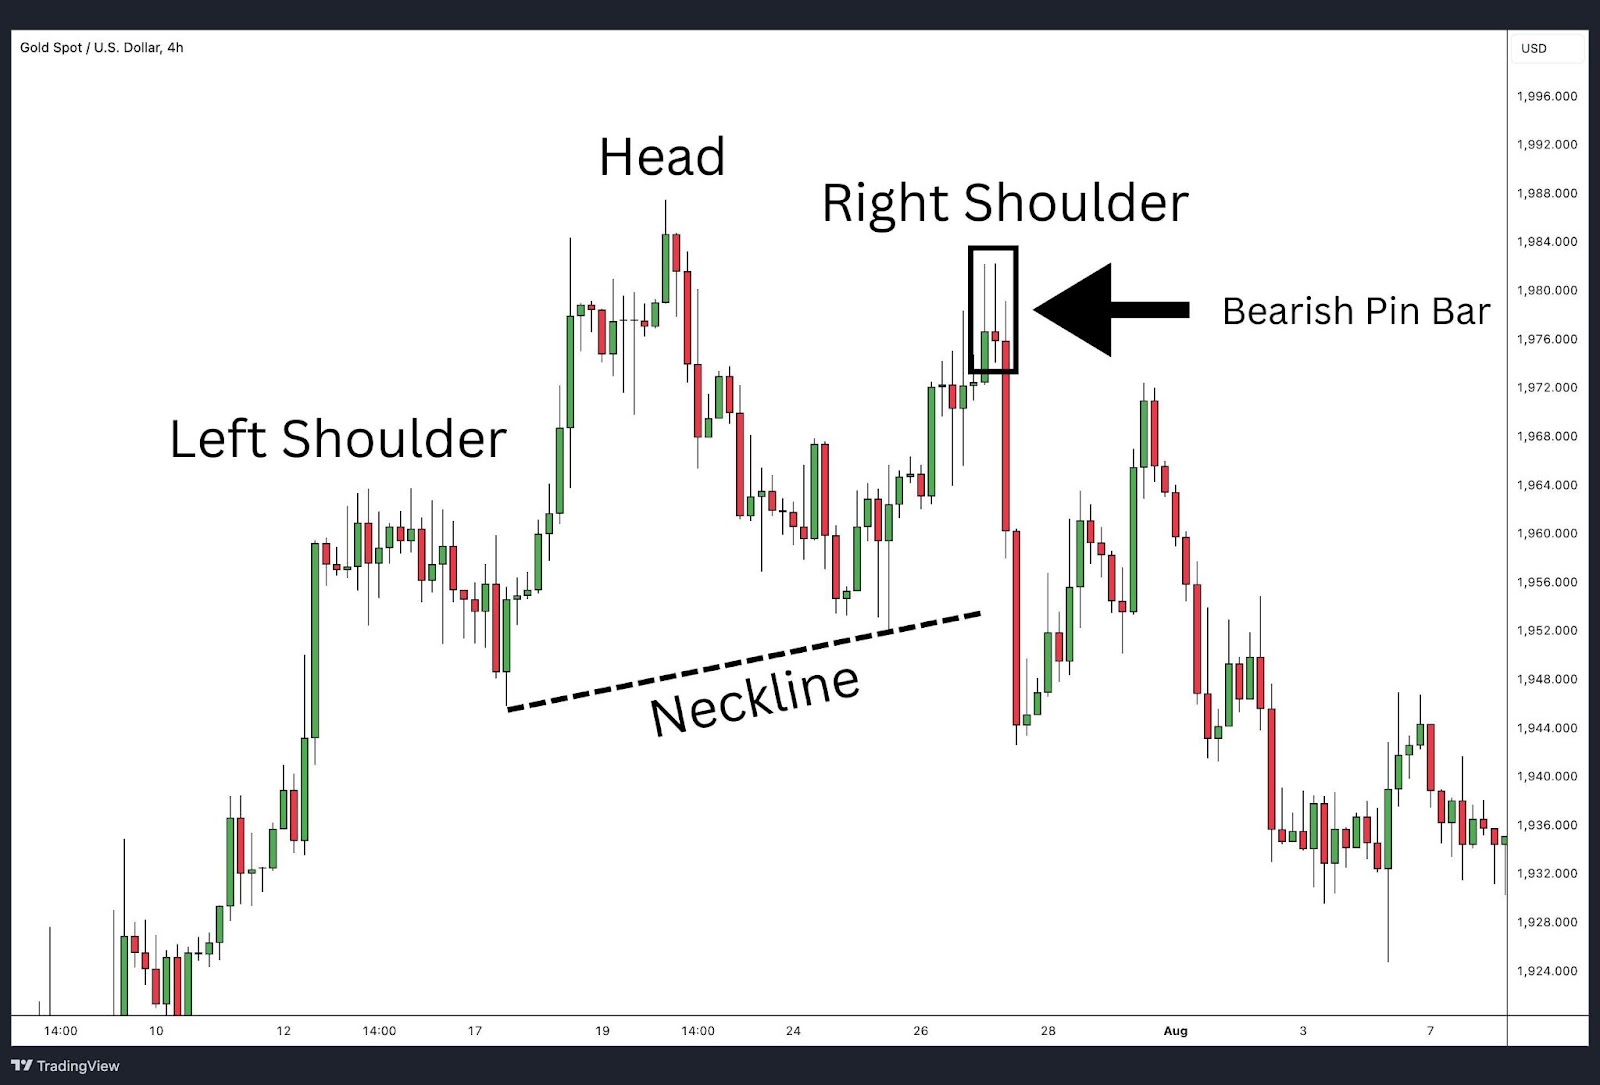
Above, we see a price chart of Gold (XAU/USD) on the 4-hour timeframe. As a bearish pin bar appears, it carves within a large bearish head and shoulders pattern indicating a change in trend direction. The left shoulder, head, and right shoulder are clearly marked, with the neckline sloping upward.
At the peak of the right shoulder, a bearish pin bar presented itself, characterised by a long upper wick and a small body near the bottom. This structure signals that higher prices were strongly rejected by sellers. Additionally, this bearish pin bar was a clear signal that the upward momentum was waning and that a reversal to the downside was likely.
Following the appearance of the bearish pin bar, the price of gold continued to drop by approximately 5%. The pin bar acted as a strong indication that the downtrend was likely to continue, providing traders with a signal to enter short positions in anticipation of additional price declines.
Bitcoin BTC/USD
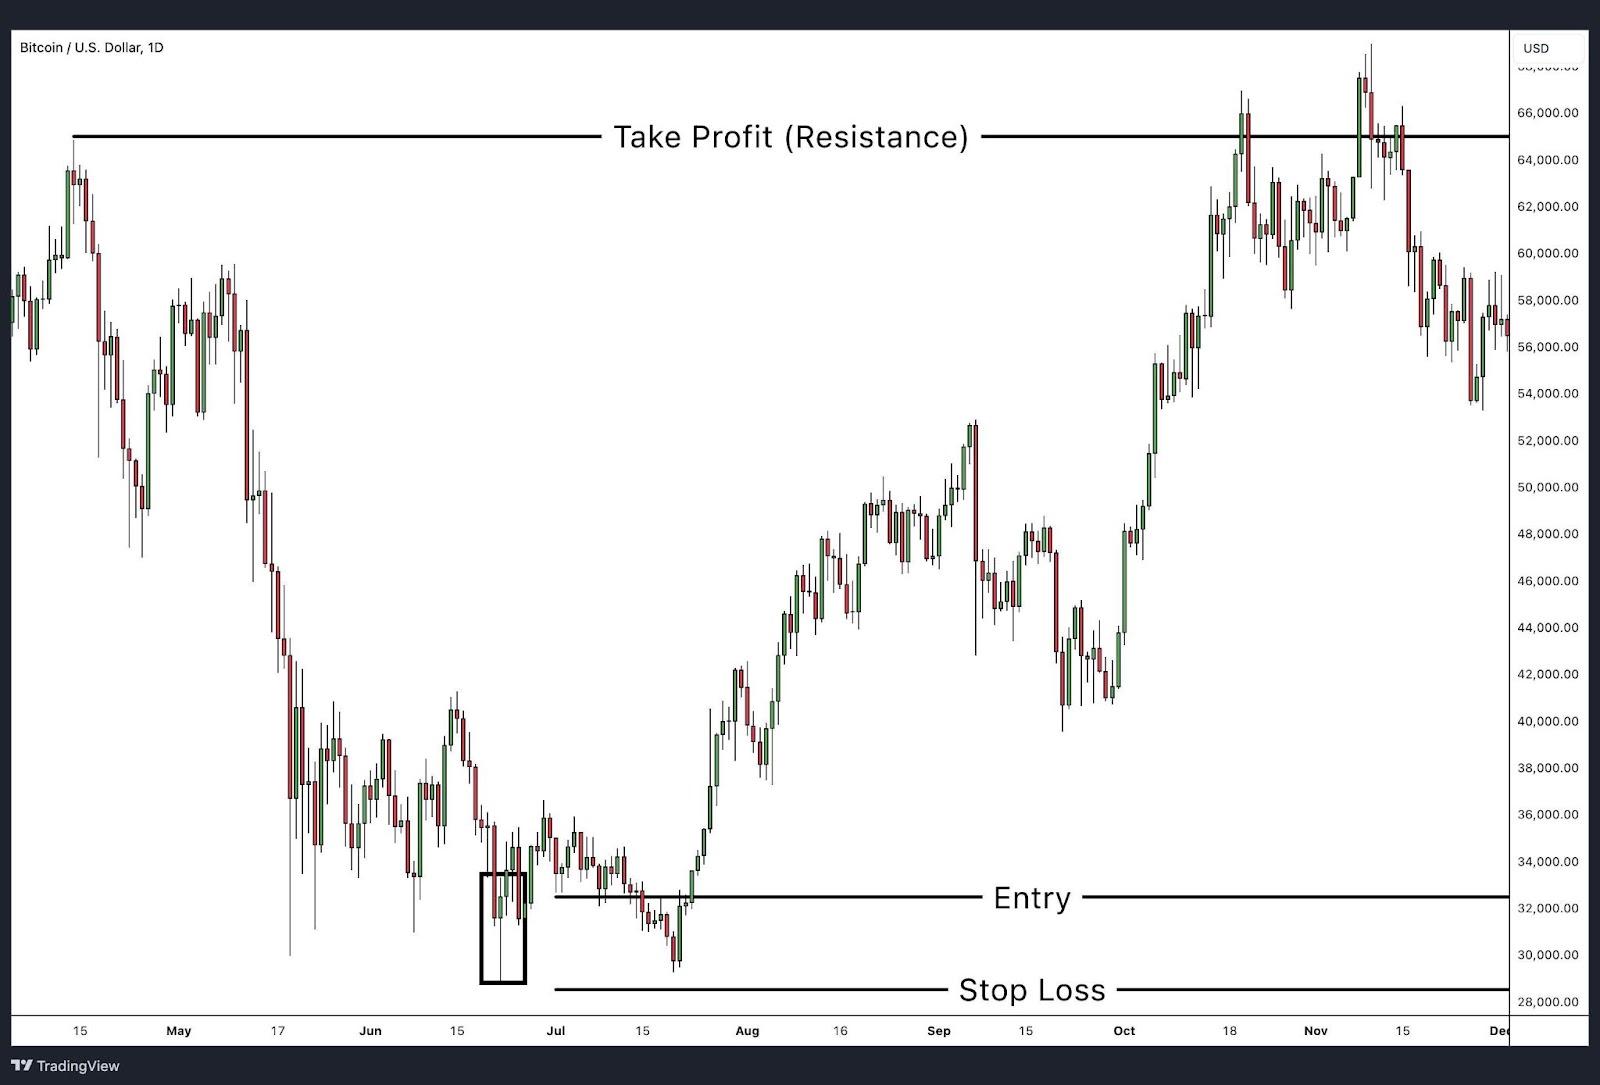
In 2021, Bitcoin experienced a famous move from $28,800 to $67,000, celebrated by both professional and retail traders. The lowest price of the retracement between April 2021 and June 2021 was marked by a bullish pin bar, signalling a potential reversal. This pin bar formed at the key support level around $28,800, with a long lower wick indicating strong rejection of lower prices. Following this pin bar, Bitcoin’s price surged approximately 132%, climbing from $28,800 to it’s all-time high of $67,000.
Traders who identified this bullish pin bar setup had a clear signal to enter long positions. Traders will view the previous high around $67,000 as a resistance zone and take profit level. The pin bar reversal acted as a strong indicator of the end of the multi-month decline leading to the resumption of the larger bullish trend.
Apple Inc
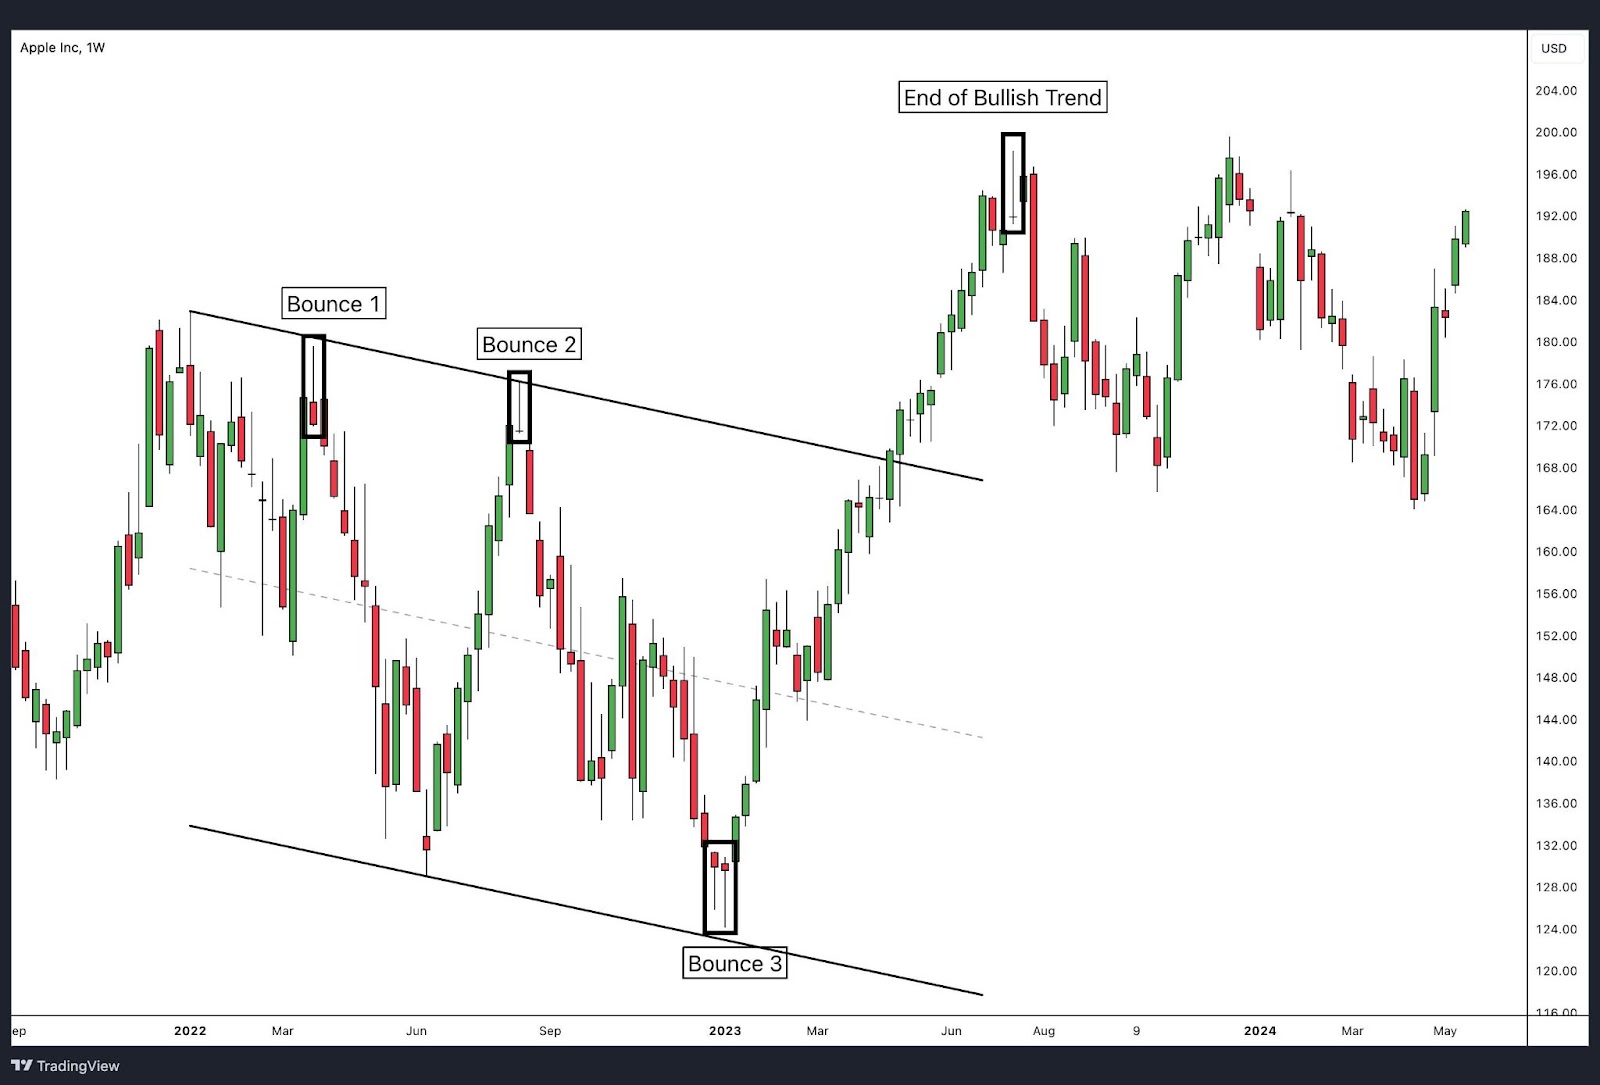
The price for Apple stock was correcting for one year within a descending channel. Most bounces off the upper and lower bounds of the channel ended with a pin bar, signalling near-term reversals. The first and second rejections from the upper boundary formed bearish pin bars, indicating resistance and a continuation of the downward trend. Similarly, the third bounce off the lower boundary formed a bullish pin bar, signalling the end of the downtrend and a potential reversal.
The final bounce from the lower boundary resulted in a significant upward movement, with the price shooting up by 74 points. This bullish trend lasted for seven months and also concluded with a pin bar at the price high, indicating the end of the bullish run. This consistent appearance of pin bars at key levels within the channel provided clear entry and exit signals, allowing traders to capitalise on these price movements effectively.
EUR/USD
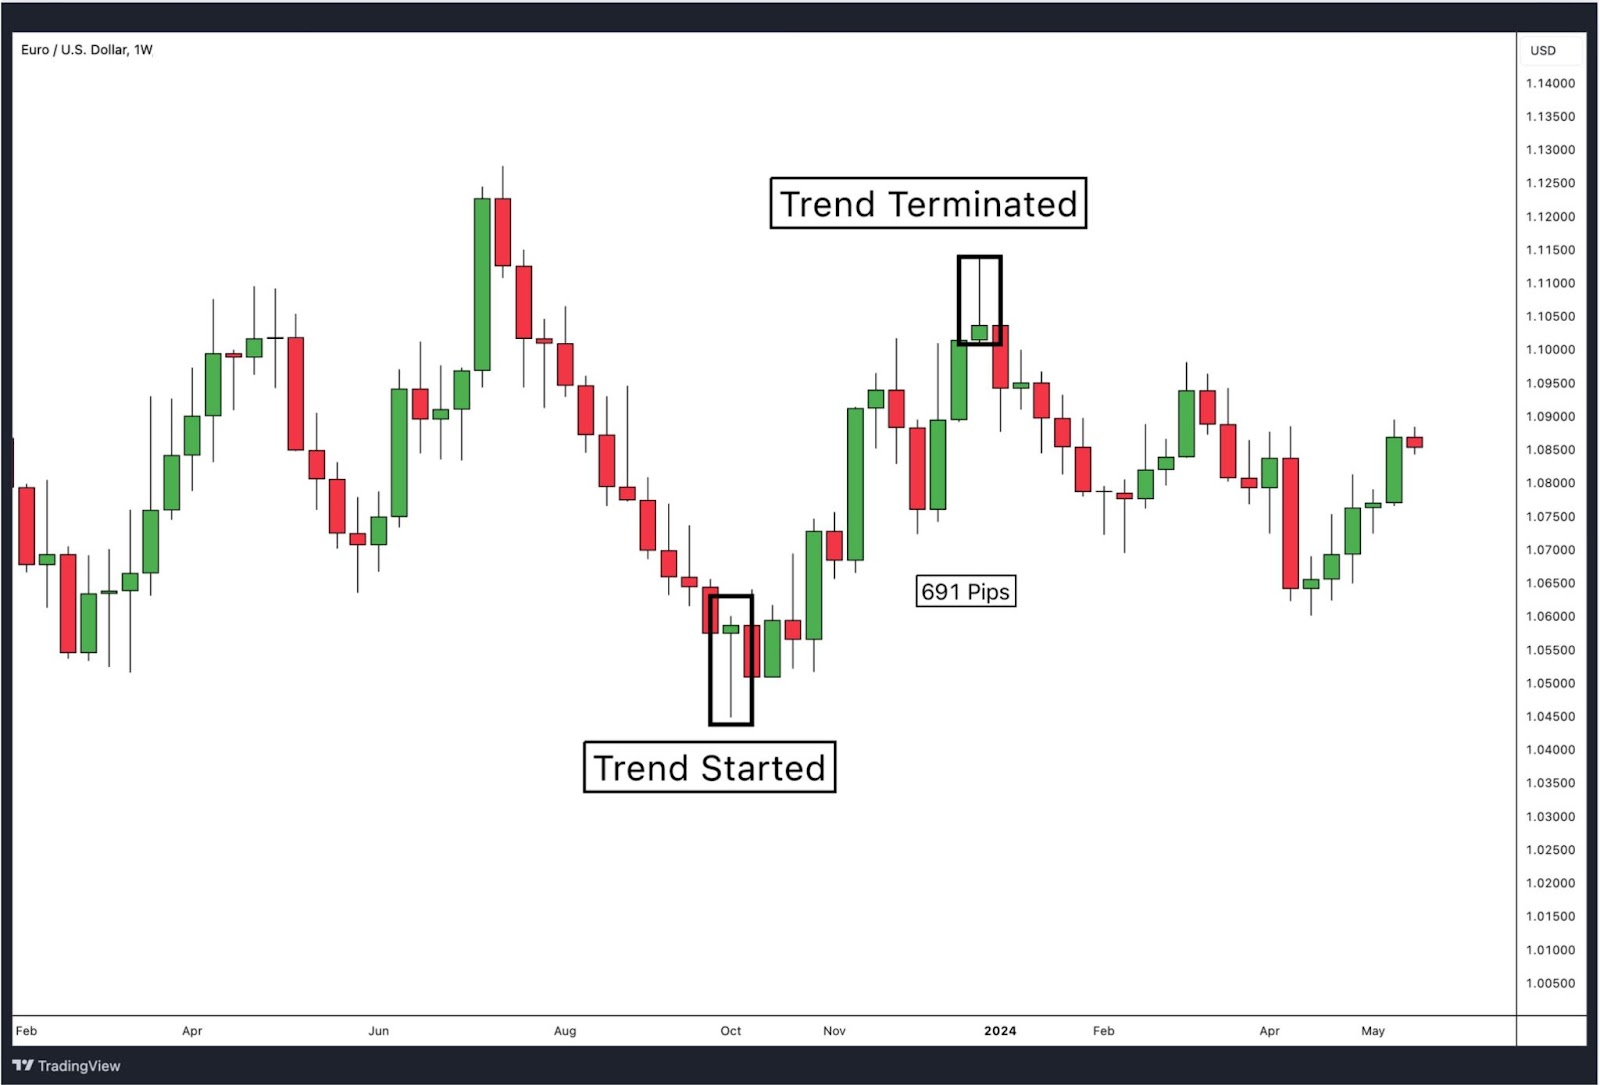
In this example on the EUR/USD weekly chart, a bullish pin bar marked the start of a significant uptrend, which lasted for three months. This trend moved 691 pips upwards before another pin bar signalled the end of the bullish trend. The initial pin bar indicated a strong reversal from a downtrend to an uptrend, providing a clear entry signal for traders.
When a pin bar appears on higher time frames like daily and weekly charts, their signals tend to be very strong and more reliable. This is because higher time frames filter out market noise with more data going into the creation of each price bar. More data tends to make the alerts and signals more meaningful. In this case, the bullish pin bar initiated a three-month trend.
Coca-Cola Company
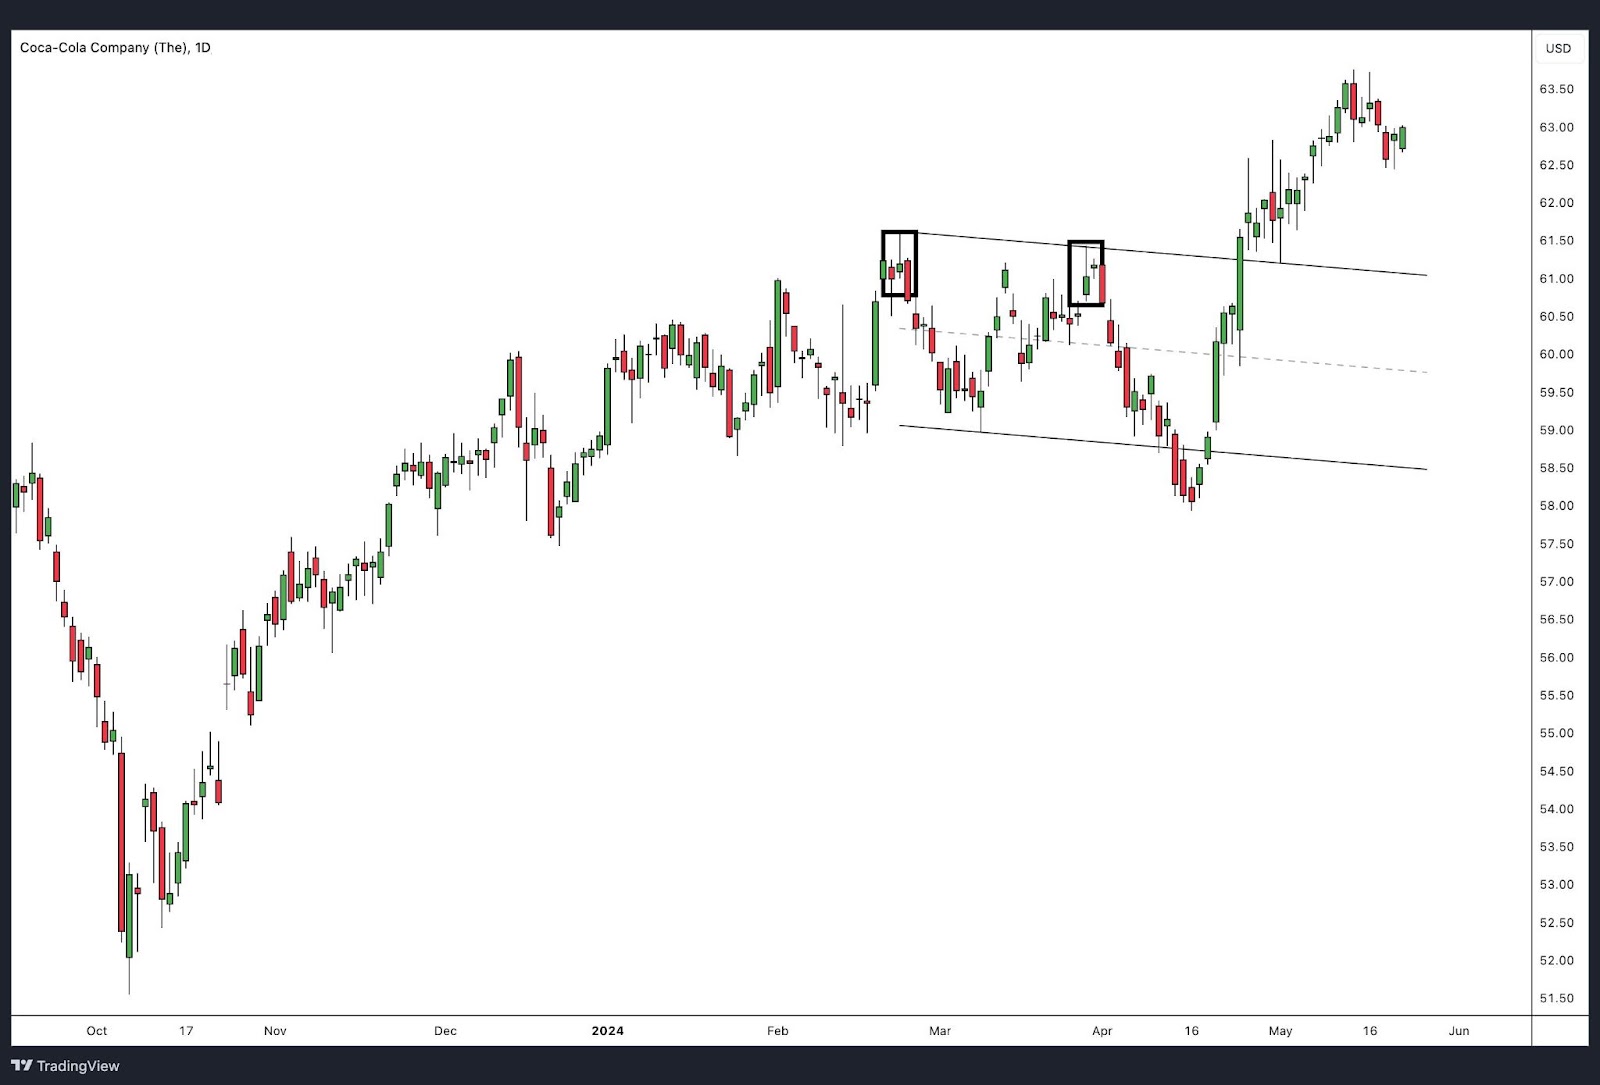
A pin bar can provide early clues that a bullish trend may be about to enter a retracement phase. In a strong uptrend, pin bars with long upper wicks often signify that the bullish momentum is waning, and sellers are starting to push back. This can be a leading indicator that the price is about to pull back before potentially resuming its upward trend.
In the chart above of Coca-Cola Company stock on the daily timeframe, the price was in a clear bullish trend. However, two bearish pin bars formed near the resistance levels, each with a long upper tail delivering a pair of reversal signals. These pin bars indicated strong rejection of higher prices, suggesting that the buying pressure was diminishing. Following these pin bars, the price entered a retracement phase, moving back down within the channel. These pin bars provided early signals of the impending retracement, helping traders anticipate and prepare for retracement.
Pin Bar Trading Strategies
A pin bar is one of several price action patterns that traders use to spot trades. Below, we’ll walk through a simple pin bar trading strategy plus several other ways to spot a pin bar trade.
Entering the market from a pin bar
Once a pin bar setup is spotted, there are a couple guidelines to follow before entering into the position. As the pin bar setup develops, pre-determine where you plan to enter the market, place your stop loss, and where you plan to set your take profit level.
Confirm the Pin Bar
Before entering a trade, ensure the pin bar meets the criteria: a long shadow, a small body, and appropriate positioning of the open and close.
Determine Entry Points
Traders of a professional level usually get involved in the market in one of the two following ways:
- At Market Open: Enter immediately after the pin bar candlestick pattern closes and the following candle opens. This method is easy to apply but it can carry some dangers if the price gaps significantly.
- Using a Pending Order: If it is a bullish pin bar, place a pending order just a few points/pips past the pin bar high, and in the case of a bearish pin bar, below the low of the pin bar. This helps confirm that momentum will continue in the anticipated direction.
Set Stop-Loss Orders
Another important risk management component is placing a stop-loss order. In the case of a bullish pin bar, put the stop loss a few points/pips below the low of the pin bar. If it is a bearish pin bar, put it a few points/pips above the high. The placement helps in protecting against market movements that might be unexpected and in limiting the potential losses.
Identify Profit Targets
Set your profit targets using key support and resistance levels, Fibonacci retracement levels, or trailing stop loss.. Using multiple profit targets may help you lock in some gains while letting the rest of the position ride if the trend continues to work out.
Pin Bar Risk to Reward
Calculating the risk to reward (R:R) ratio for a pin bar setup involves setting your stop loss just below the low of a bullish pin bar or above the high of a bearish pin bar. The target can be a Fibonacci extension level or the next significant resistance area.
For a conservative approach, ensure at least a 1:1 R:R ratio. This means if your stop loss is 10 points, aim for a minimum of 10 points profit. Adjusting your target based on market conditions can optimise your trading strategy and improve your overall risk management.
Enhancing Pin Bar Effectiveness with Technical Tools
While pin bars can provide valuable signals, relying solely on them isn’t always effective. However, when combined with other technical tools, your pin bar trading strategy can be improved. Here are some tools that, when used in conjunction with pin bars, can enhance the reliability of your trades:
• Moving Averages: A simple or exponential moving average can help identify the overall trend direction. Therefore, a pin bar forming near a moving average line can signify a strong reversal signal, adding more weight to the pattern.
• Relative Strength Index (RSI): RSI measures the speed and change of price movements. A pin bar appearing while the Relative Strength Index is in an overbought or oversold region can support the signal of a potential reversal.
• Support and Resistance Levels: Pin bars at significant support or resistance levels indicate a higher probability of a price reversal. These levels act as barriers where price action has historically reversed.
• Fibonacci Retracement Levels: Combining pin bars with Fibonacci retracement levels can enhance the accuracy of identifying potential reversal points. A pin bar at a key Fibonacci level can signal a high-probability trade setup.
• Volume Analysis: High trading volume accompanying a pin bar can validate the strength of the reversal or continuation signal, indicating strong market participation and sentiment.
Example of RSI Combined with Volume Indicator and Pin Bar
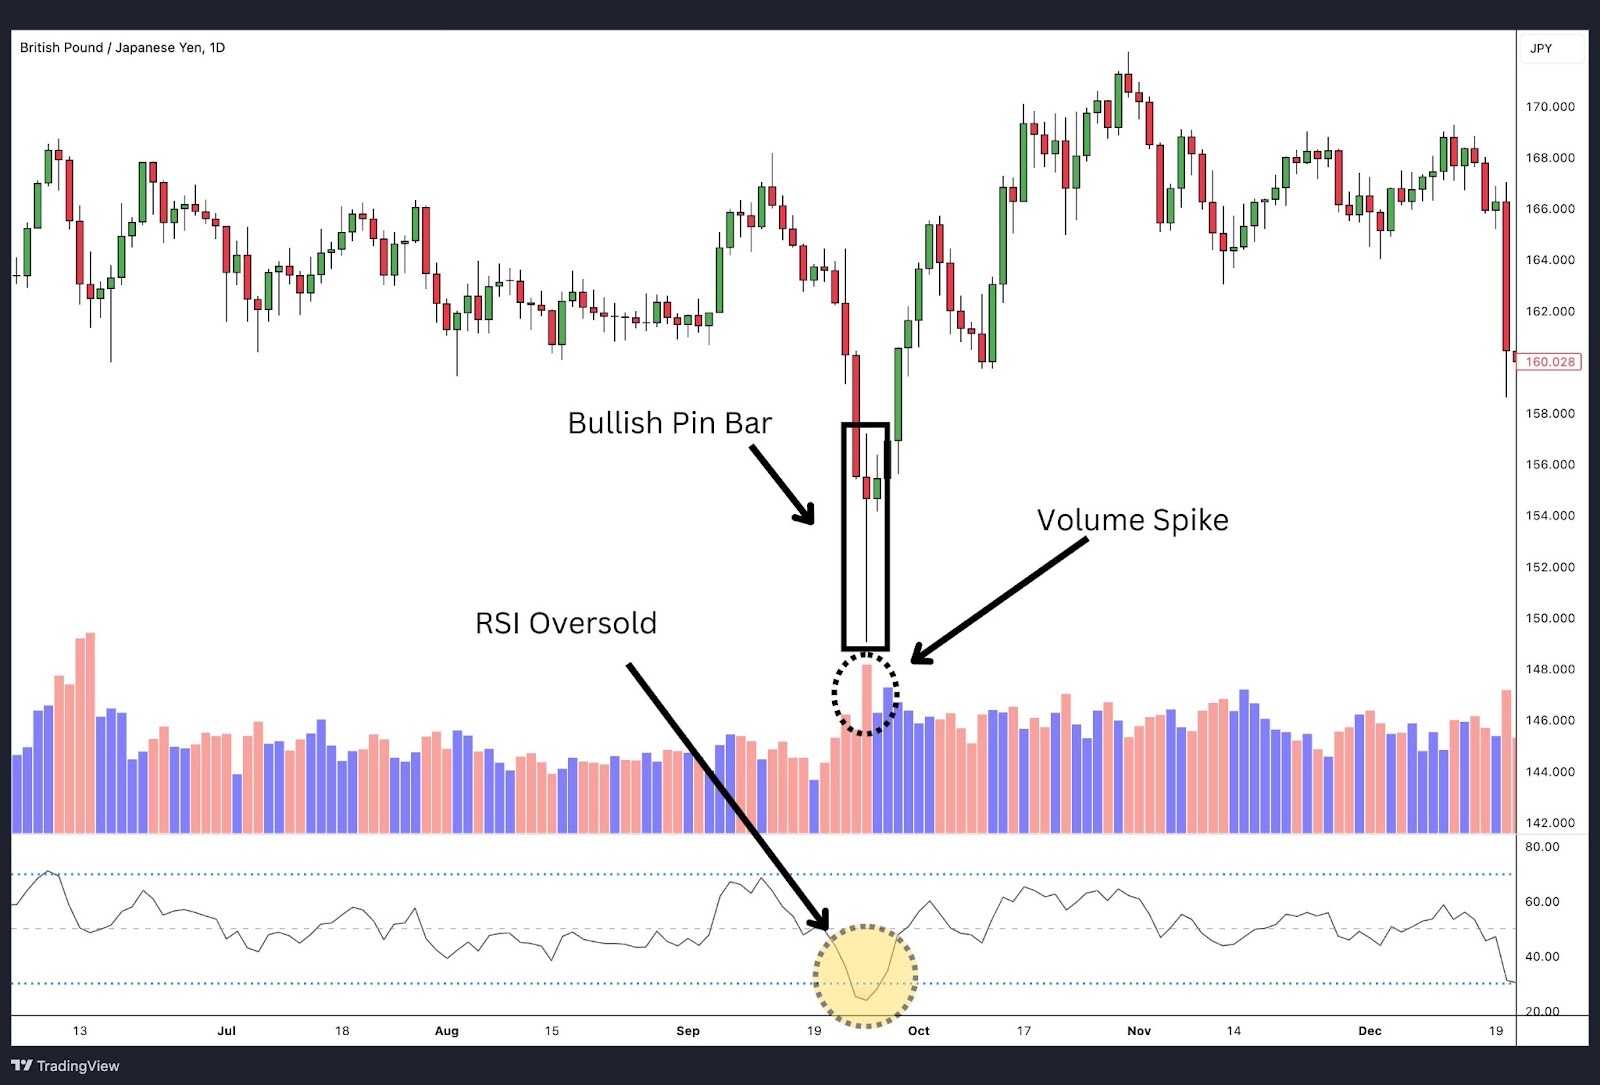
In the provided chart of GBP/JPY on the daily timeframe, we can see a bullish pin bar develop. The long lower wick of the pin bar indicates strong rejection of lower prices, suggesting a potential reversal.
RSI
The RSI reading coincides with the pin bar formation, showing an oversold condition. This suggests that the selling pressure may be exhausted, adding further weight to the potential for a bullish reversal.
Volume Indicator
Additionally, there is a noticeable volume spike at the formation of the pin bar. This increase in trading activity further validates the potential reversal indicated by the pin bar and RSI.
Conclusion
The confluence of these signals – the bullish pin bar, the RSI in oversold territory, and the volume spike – strongly suggests a potential bullish reversal in the GBP/JPY daily time frame chart. This combination of technical indicators provides a robust foundation for making informed trading decisions.
Trading Pin Bars with the Trend
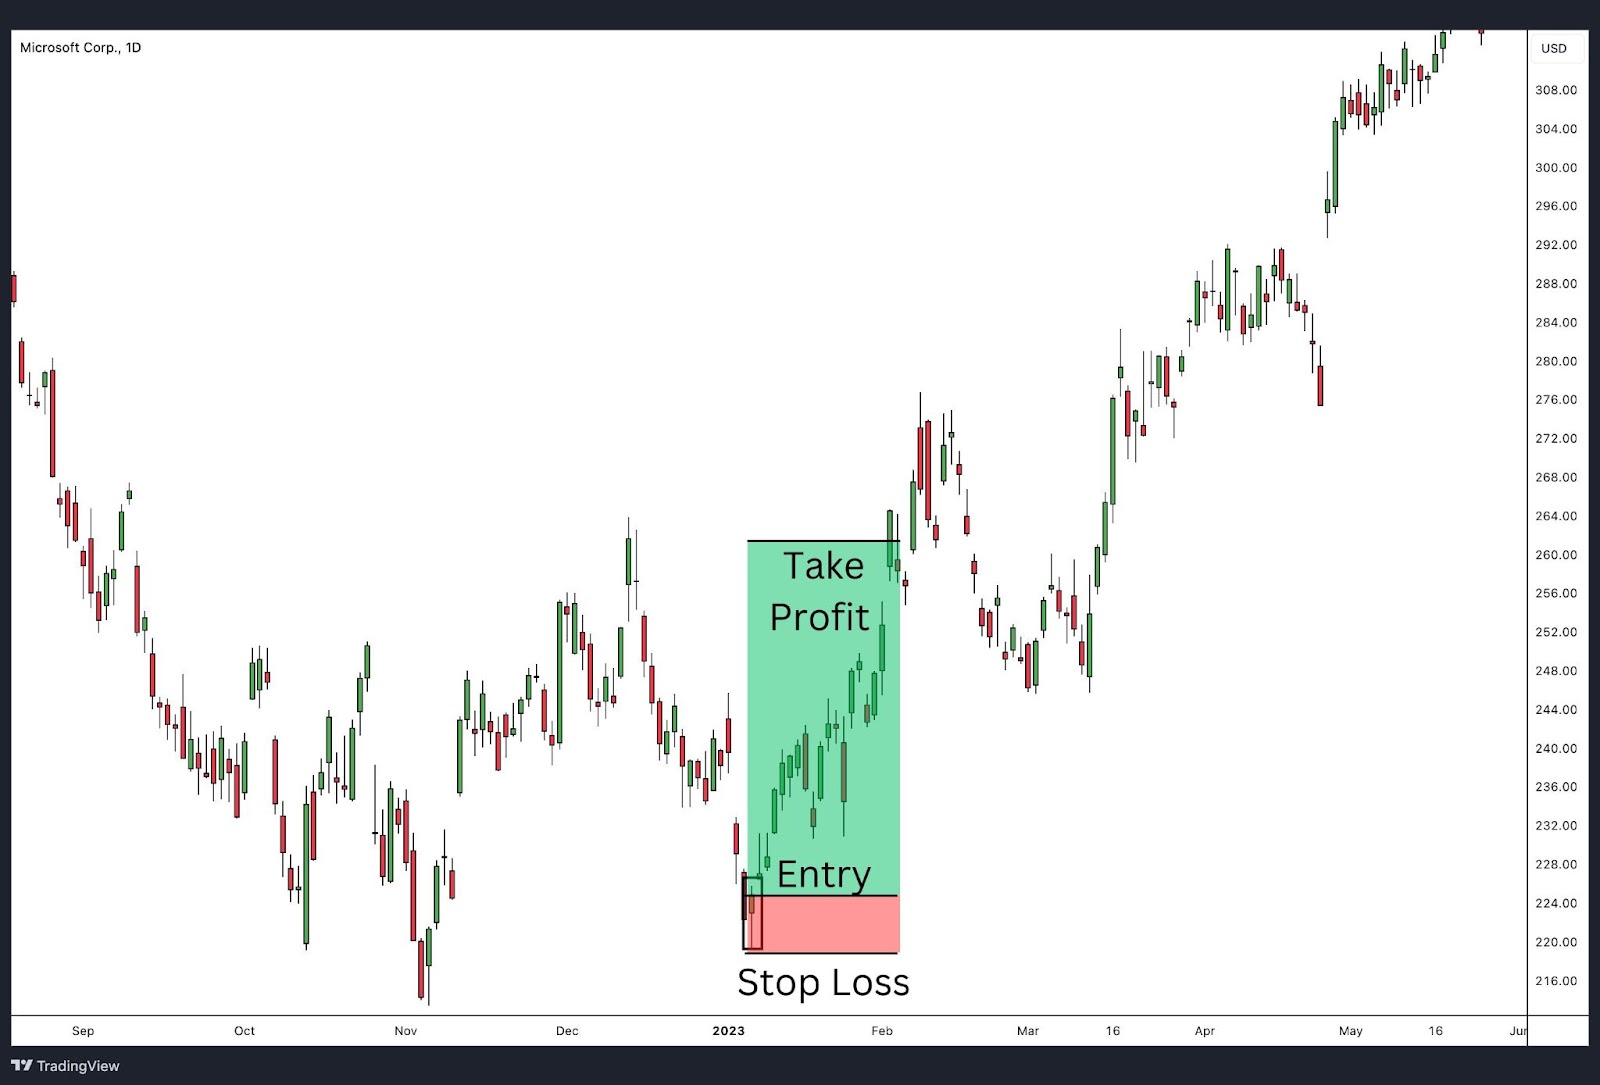
Trading the pin bar with the trend involves identifying pin bar formations that align with the prevailing market direction. In an uptrend, a bullish pin bar that forms as the market consolidates lower indicates strong buying pressure. A bearish pin bar, after a small rally within a downtrend, suggests more selling pressure may resume. This strategy helps traders capitalise on the existing market momentum, providing higher probability entry points.
In the provided chart of Microsoft Corp. on the daily timeframe, a bullish pin bar formed at the bottom of a pullback during an uptrend. The entry point was placed just above the high of the pin bar, indicating the resumption of the upward trend. A stop-loss was set below the low of the pin bar to manage risk. Following this setup, the price continued to rise, confirming the effectiveness of trading pin bars within the trend. By using this approach, traders can effectively time their entries and align their trades with the market’s dominant direction.
Trading Pin Bars with a Double Top
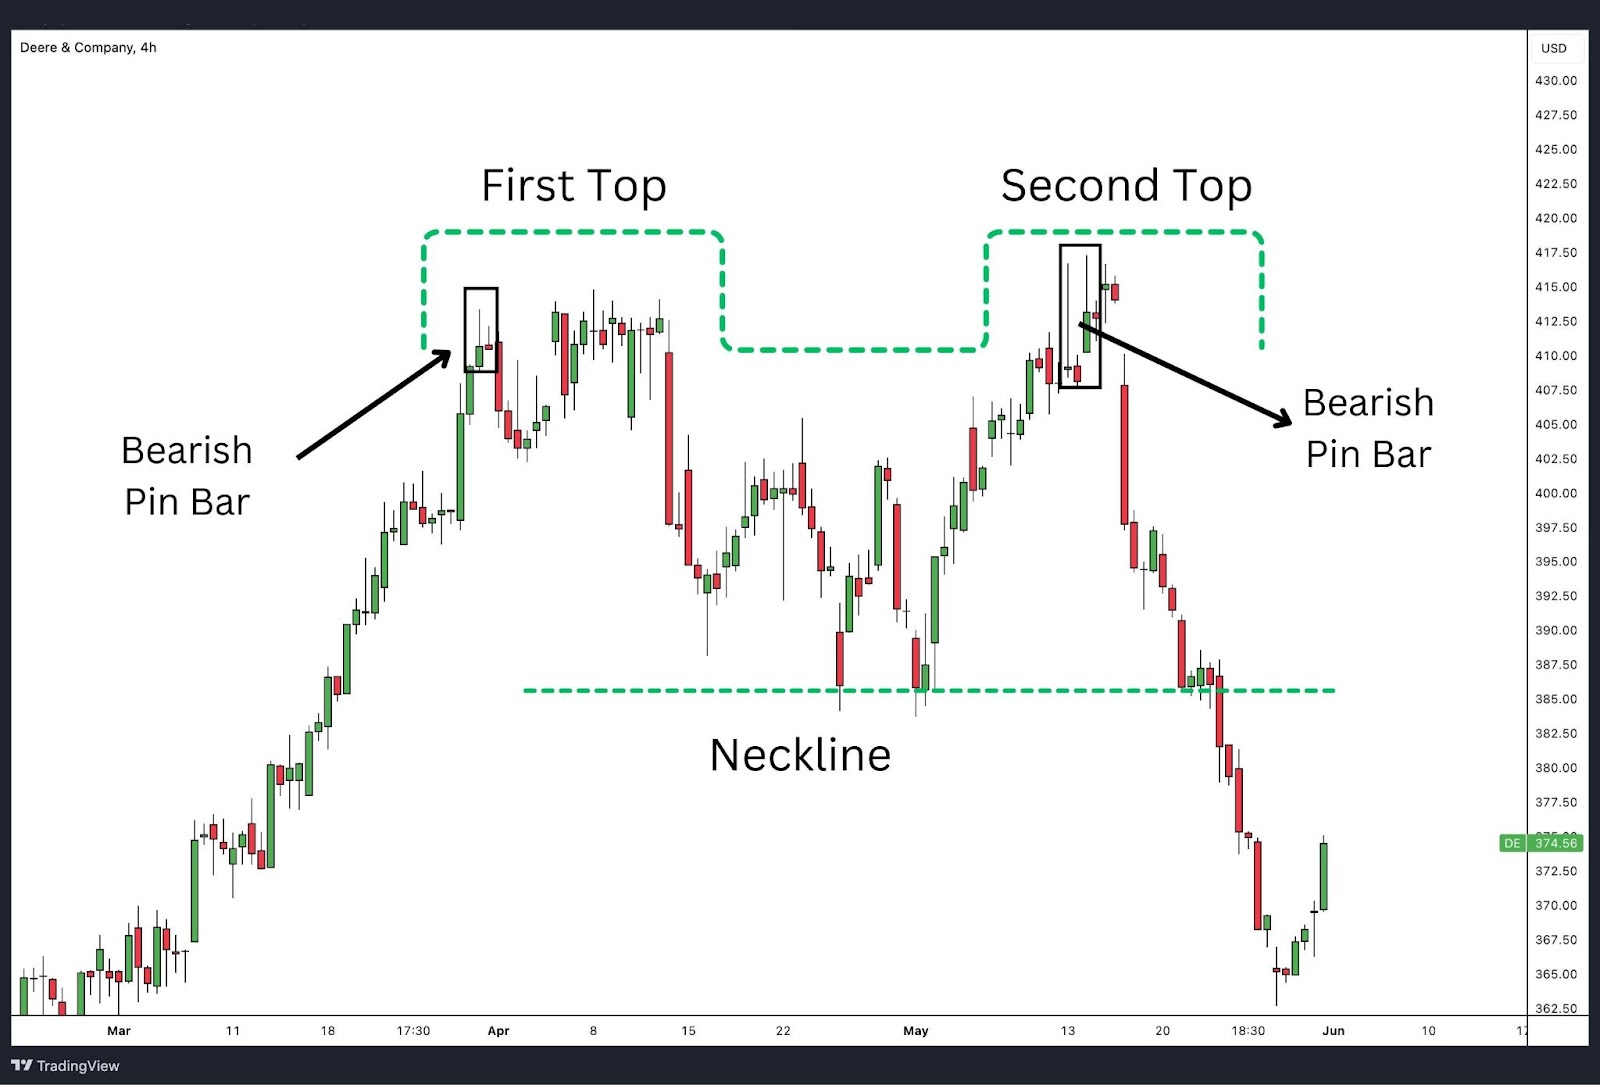
A double top pattern is a bearish reversal pattern that typically forms after an extended uptrend. It consists of two peaks at roughly the same price level, indicating resistance. When pin bars appear at these peaks, especially on the second top, they can provide a strong signal for potential price reversals. Pin bars at the top show rejection of higher prices and increased selling pressure, reinforcing the bearish reversal signal of the double top.
In the provided chart of Deere & Company (DE) on the 4-hour timeframe, the double top pattern is clearly visible with bearish pin bars at both the first and second tops. The first top shows a bearish pin bar, indicating initial rejection of higher prices. After a pullback, the price rises again to form the second top, where another bearish pin bar appears. This second pin bar reinforces the double top pattern and signals a strong potential for a downward reversal.
Following the formation of the second top with the bearish pin bar, the price breaks below the neckline, confirming the double top pattern. Traders can use this setup to enter short positions, placing stop-loss orders above the pin bar’s high and targeting lower support levels. This combination of the double top pattern with bearish pin bars provides a high-probability setup for traders looking to capitalise on market reversals.
Trading Bearish Pin Bar In Range Trading
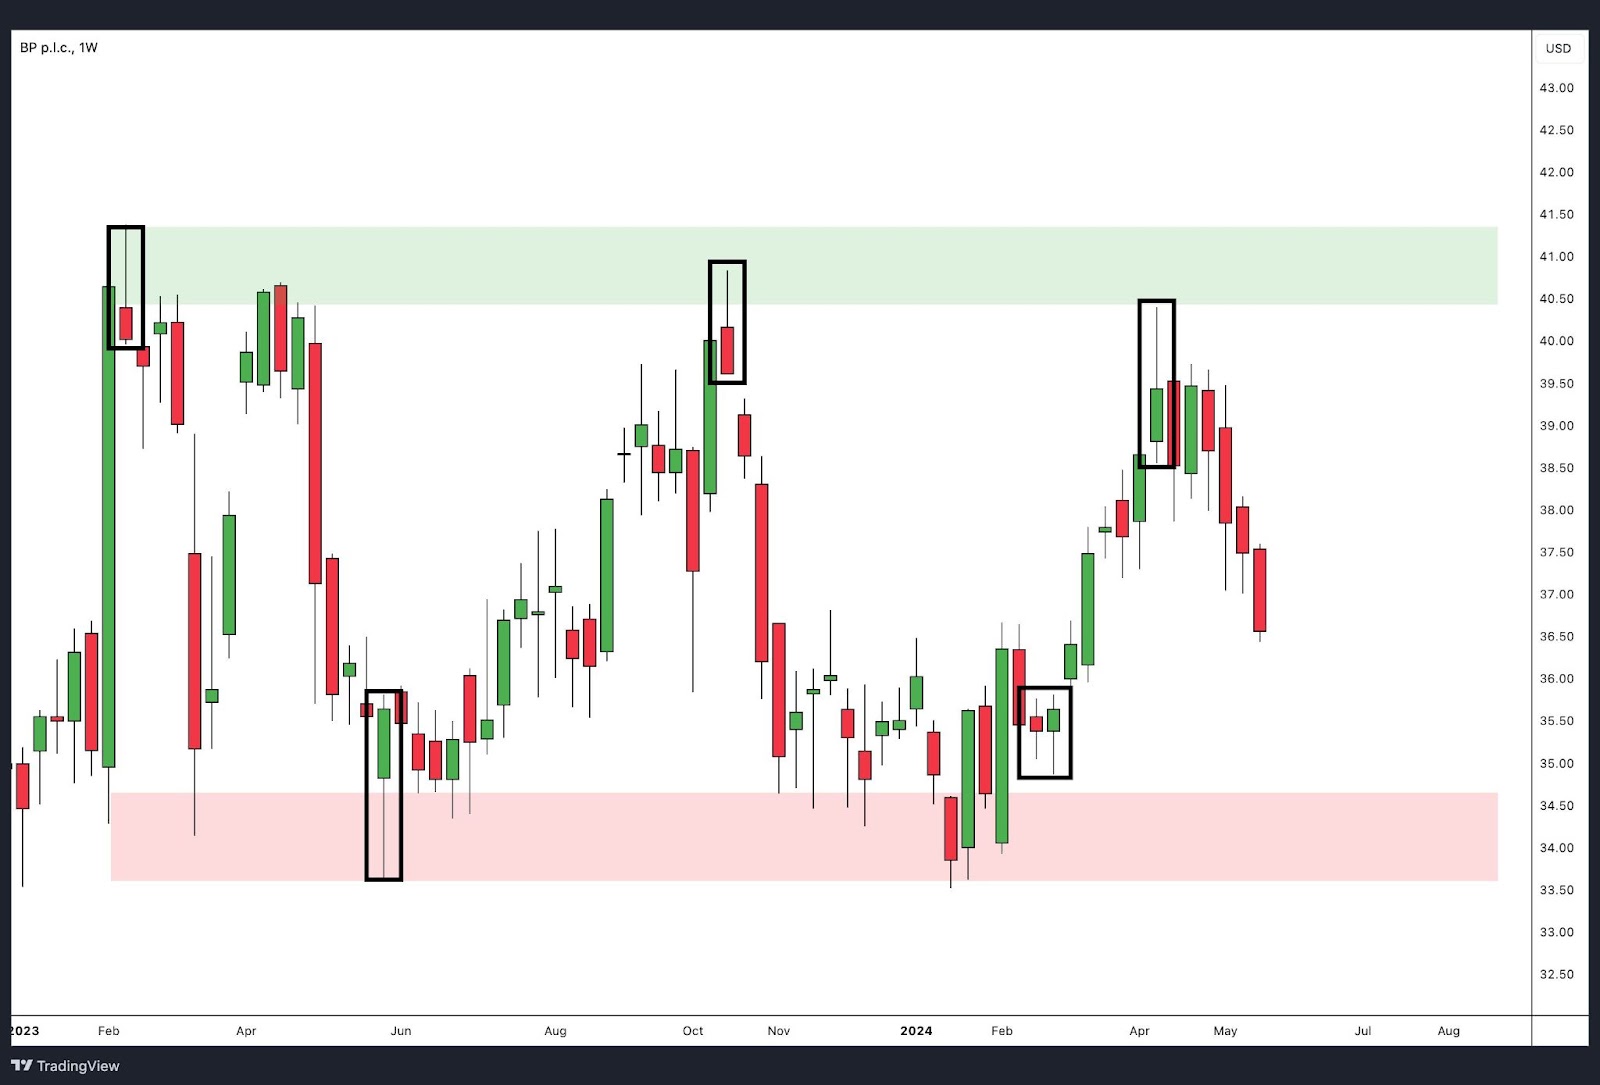
Range trading involves identifying key support and resistance levels where the price oscillates within a horizontal channel.
A bearish pin bar is a powerful signal in this context, indicating a potential reversal from the resistance level back towards the support. The long upper wick of the bearish pin bar signifies strong rejection of higher prices, suggesting a shift in market sentiment from bullish to bearish at the resistance level. This provides clear entry points for short trades, aligning with the market’s cyclical behaviour.
In the provided chart of BP p.l.c. on the weekly timeframe, several bearish pin bars formed at the resistance level around $41. Each pin bar indicated a rejection of higher prices and was followed by a downward move towards the support level near $35. These pin bars marked the upper boundaries of the trading range, offering more market structure context as the price reversed at resistance, demonstrating the effectiveness of using bearish pin bars in range trading.
Trading Bearish Pin Bar In Elliott Wave Theory
Trading pin bars in the direction of the trend is one of the most effective ways to trade, since it aligns your trade with the current market flow. One way to determine trend flow is using Elliott Wave Theory.
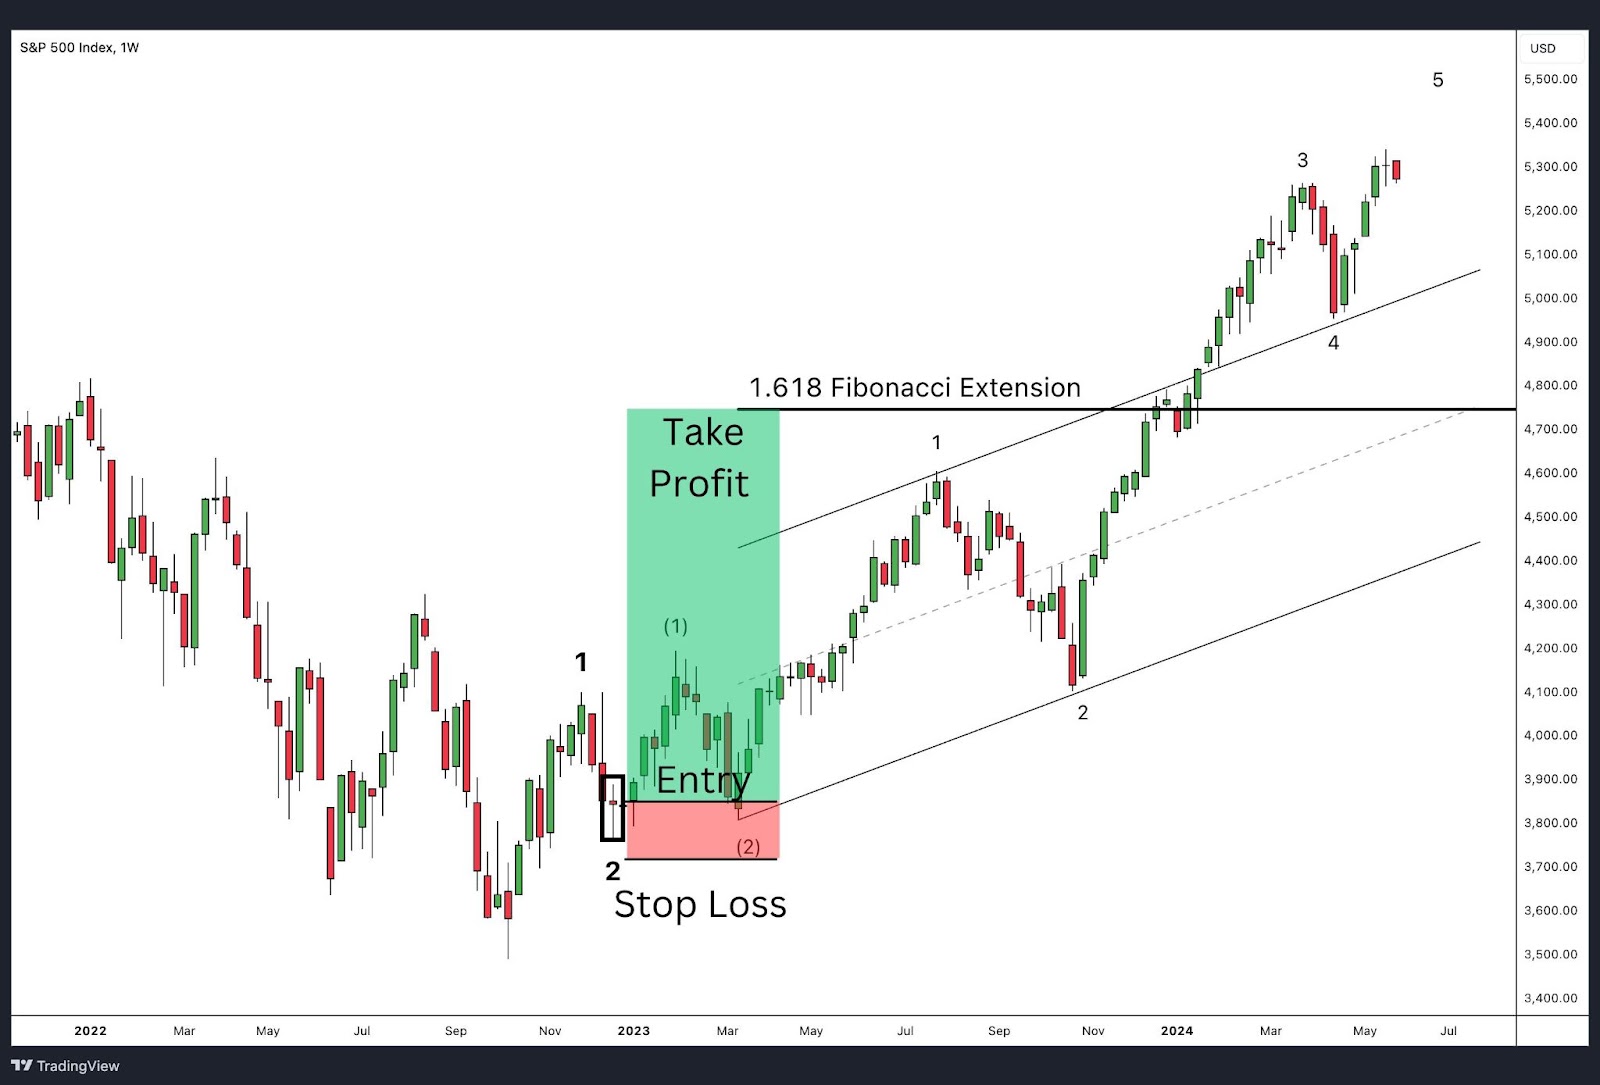
Pin bars can often be found at the end of corrective sequences, such as waves 2 and 4, indicating the end of a corrective phase and resumption of the main trend. For instance, a bullish pin bar at the end of the wave 2 correction in an uptrend may point to the beginning of an impulsive wave 3.
Equally, a bearish pin bar at the end of a wave 4 rally within a downtrend may be calling the change, but with yet another impulsive move to come in wave 5. In this way, traders can find key entry points on the Elliott Wave structure such that their trades are not only compatible with the trend but with the wave pattern as well.
In the S&P 500 chart attached, the extreme of wave 2 is shown; the pinned bar shows strong rejection of lower prices and indicates the correction phase is over and wave 3 might potentially start. The pinned bar further confirms the long position a trader has to take in the expectation that the uptrend may get extended after that. It is such pattern recognition skills that allow a trader to trade with a lot more confidence. Target was 1.618 Fibonacci Extension of wave 1 as this is the conventional extension level for wave 3 in a Motive wave.
Trading a Pin Bar Reversal Pattern
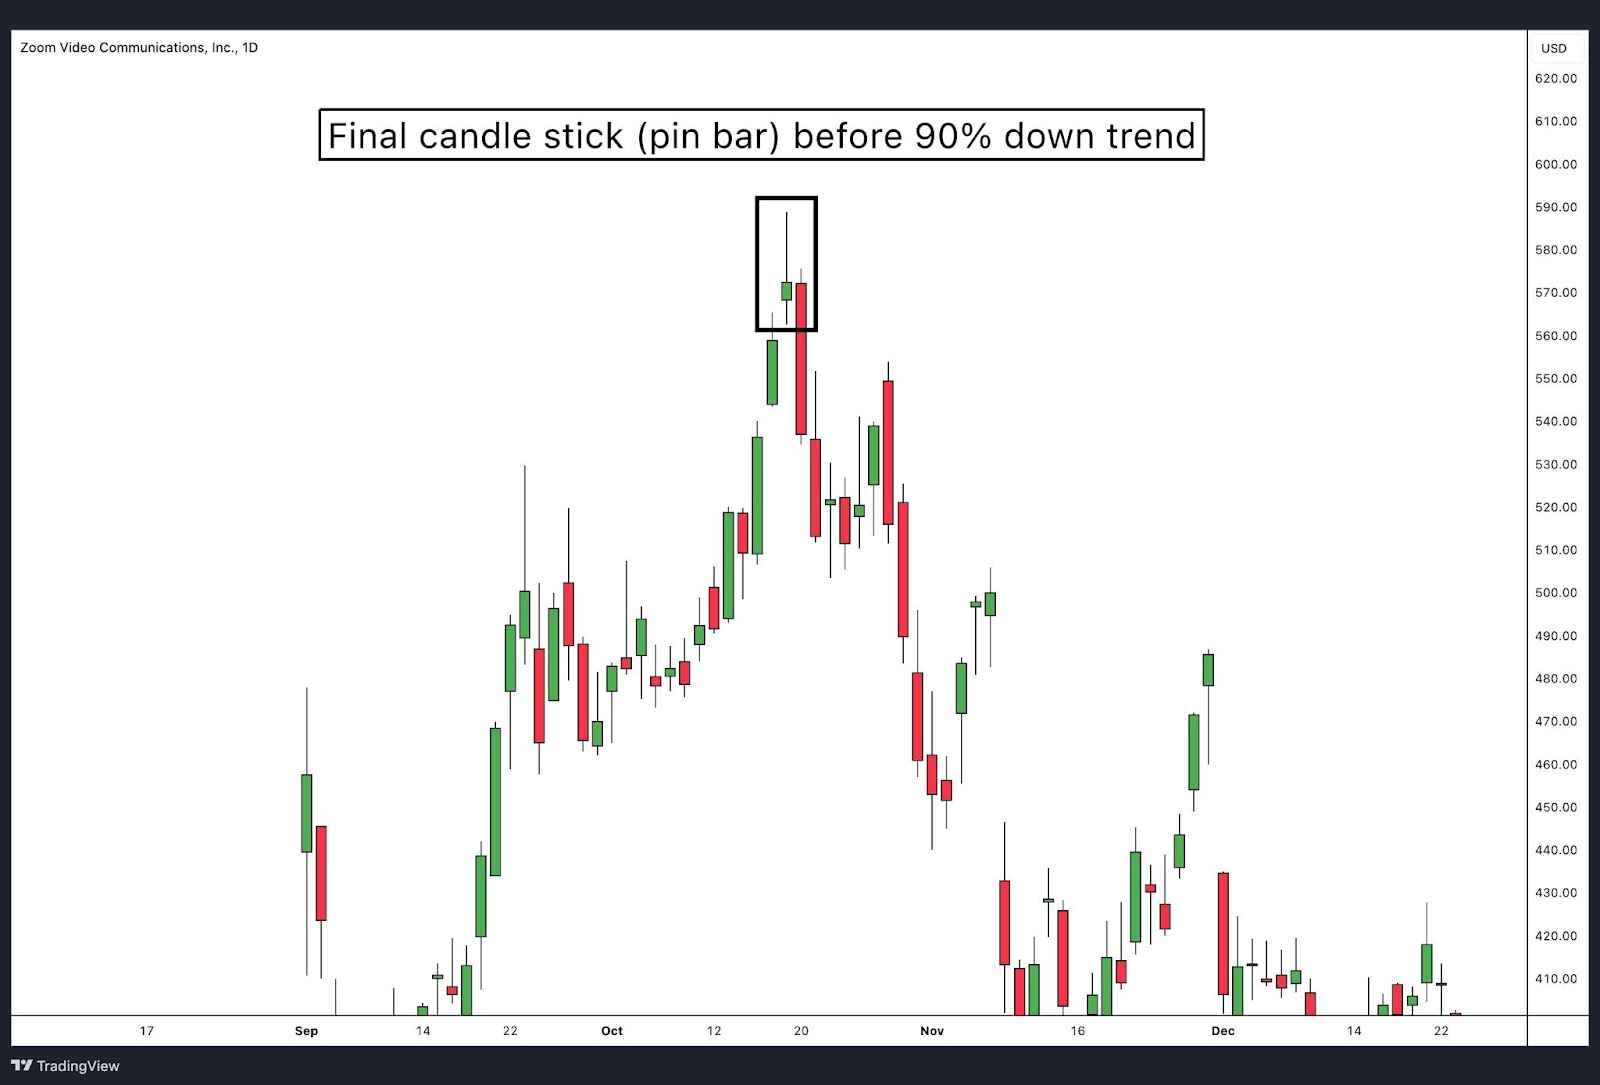
Zoom Video Communications was a hot stock during the COVID-19 pandemic due to the surge in remote work and online meetings. However, as the pandemic began to ease and people returned to offices, the stock faced a significant correction.
On the daily timeframe, at the peak of its uptrend, a bearish pin bar formed, signalling a potential reversal. This pin bar, characterised by a small body and a long upper wick indicated strong rejection of higher prices and foreshadowed the impending downtrend.
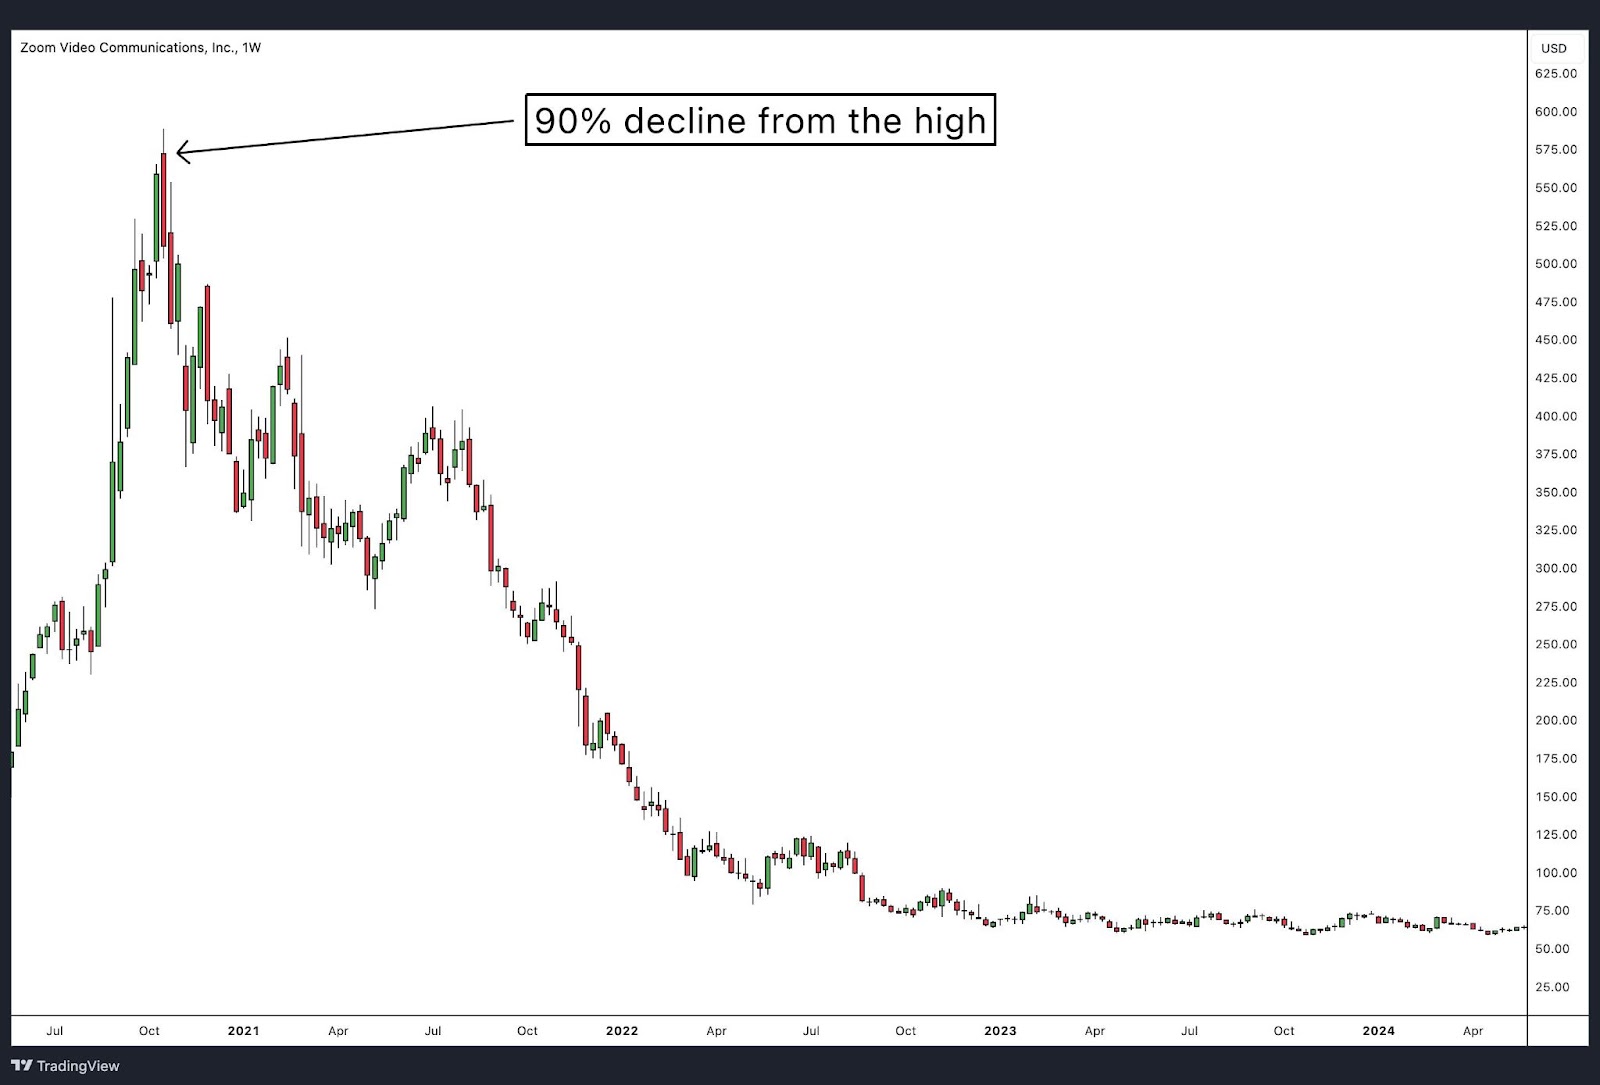
The end result of this daily pin bar was a dramatic decline in Zoom’s stock price. Following the signal, the stock reversed and experienced a continuous downtrend, ultimately declining by 90% from its high.
This significant drop, as shown on the weekly timeframe below, illustrates the powerful predictive nature of pin bars when they appear on higher time frames. The bearish pin bar marked the end of Zoom’s bullish trend and the start of a prolonged bearish phase.
Trading a Pin Bar Continuation Pattern
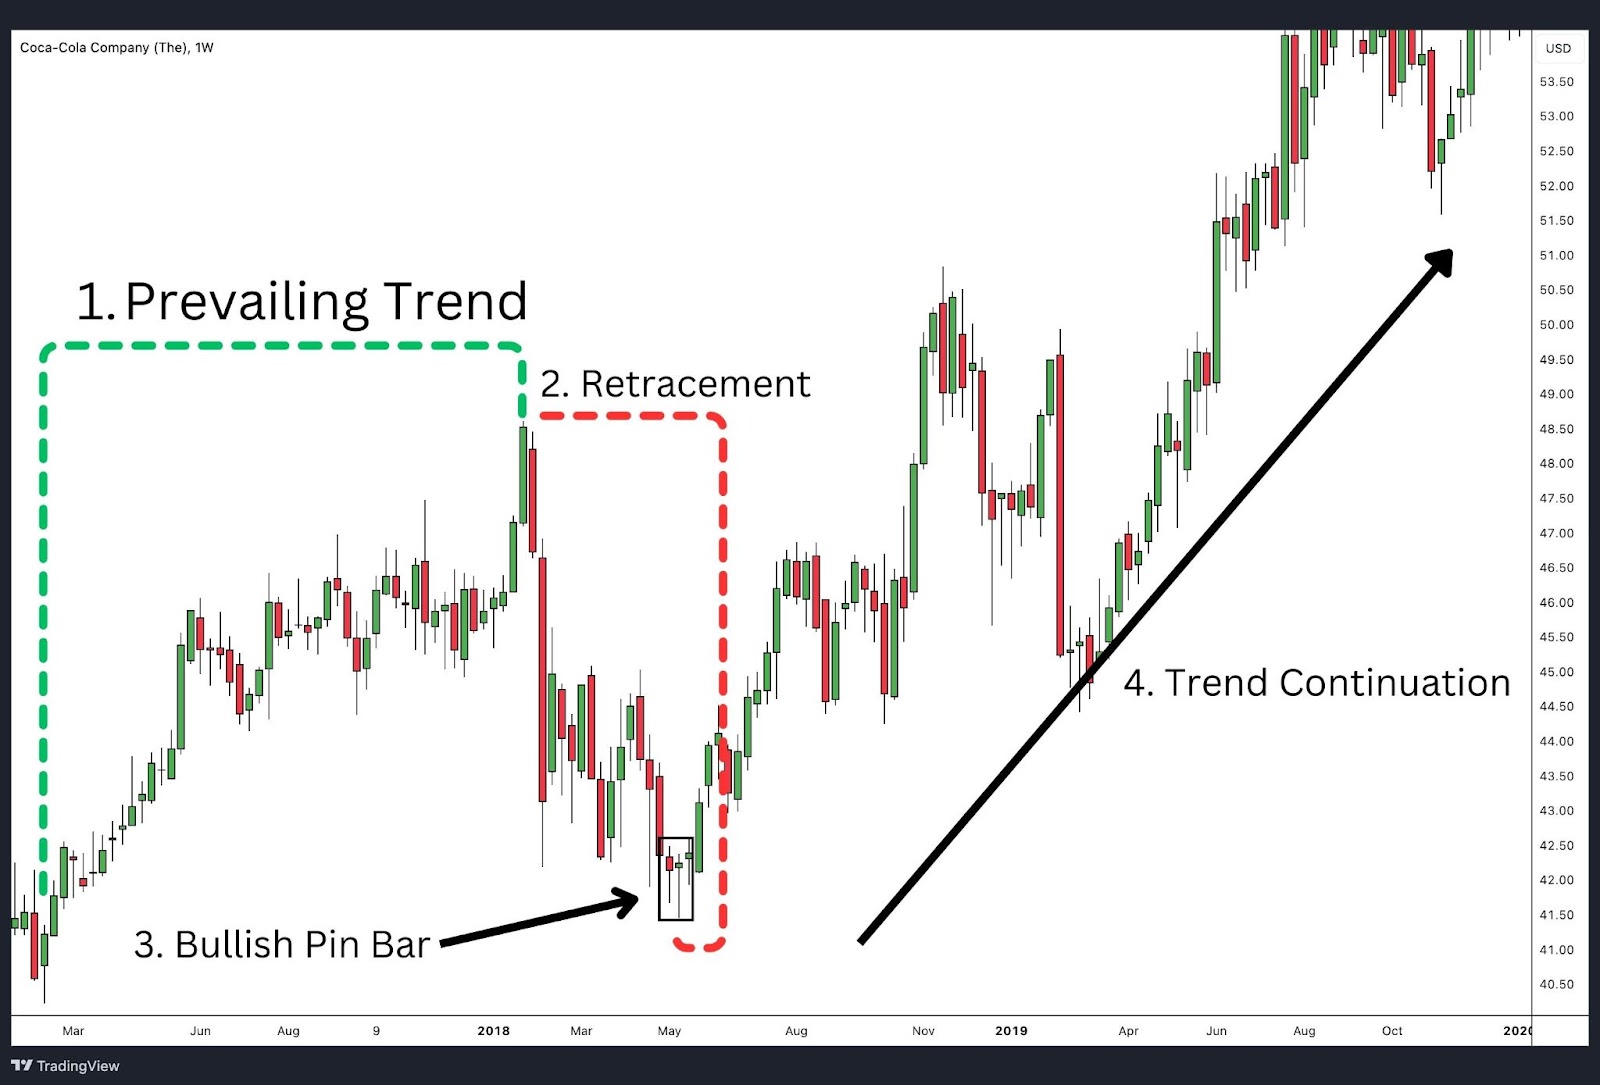
The pin bar continuation pattern occurs when a pin bar forms in the direction of the prevailing trend, indicating a temporary pause or retracement before the trend resumes. This pattern is used by traders to identify potential entry points to join the existing trend after a brief pullback. The pin bar’s long wick shows a rejection of lower prices in an uptrend or higher prices in a downtrend, reinforcing the strength of the trend.
In the provided chart of Coca-Cola Company on the weekly timeframe, a bullish pin bar forms after a short retracement within a broader uptrend. The pin bar’s long lower wick and small body signify rejection of lower prices, suggesting that buyers are stepping back in.
Following the formation of the pin bar, the price continues to rise, validating the continuation pattern and offering traders a high-probability entry point to capitalise on the ongoing uptrend.
Steps to follow as per demonstrated in the Coca-Cola Company chart below:
- Spot the existing trend
- Wait for price to retrace
- At the extreme of the Retracement you will potentially spot a pin bar
- Trend will continue and form new highs (or lows in a bearish scenario)
Pin Bar with Fibonacci Retracements – Halfway Backs
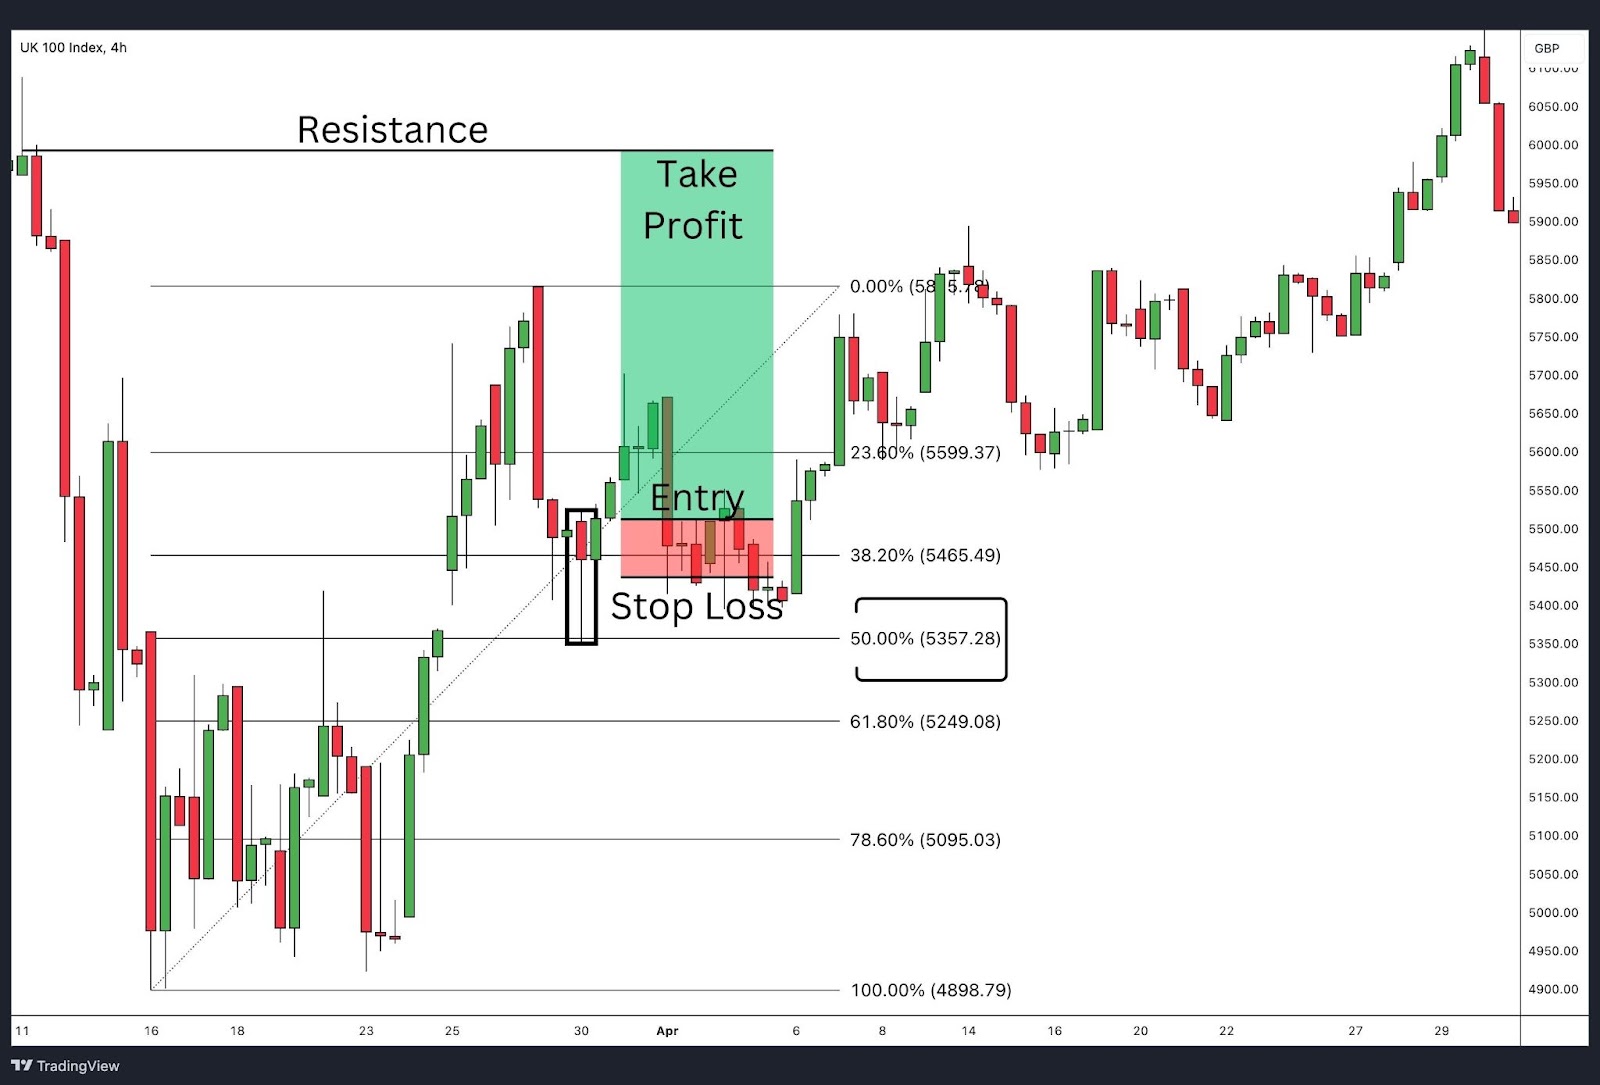
Fibonacci retracement levels help traders find hidden levels of support and resistance. When a pin bar forms near a significant Fibonacci retracement level, such as the 50% level, it indicates a strong potential for price reversal. The 50% retracement level is a key area where traders expect the price to find support or resistance, and the presence of a pin bar provides additional confirmation of this reversal, making it a high-probability trade setup.
In the provided chart of the FTSE 100 Index on a 4-hour timeframe, a bullish pin bar forms at the 50% Fibonacci retracement level. This pin bar, characterised by its long lower wick and small body, indicates strong rejection of lower prices at this key support level.
Following the formation of this pin bar, the price continued to rise, demonstrating the effectiveness of combining pin bar patterns with Fibonacci retracement levels to identify high-probability trading opportunities. This confluence provided a clear signal for traders to enter a long position, anticipating the continuation of the uptrend.
Pin Bar with VWAP Bounce
The Volume Weighted Average Price (VWAP) is a trading benchmark that calculates the average price of a security based on both volume and price. Traders use VWAP to understand the security’s true average price during a trading day, making it a valuable tool for traders to identify trends and potential entry or exit points.
VWAP Bounce Technique Explained
The VWAP bounce technique is commonly used for intraday trading to identify potential reversal points and confirm trends. This strategy involves observing the price action as it retraces to the VWAP level and then reverses, using the VWAP as a dynamic support or resistance line. A pin bar forming at the VWAP level can provide a strong confluence signal for a potential trend continuation.
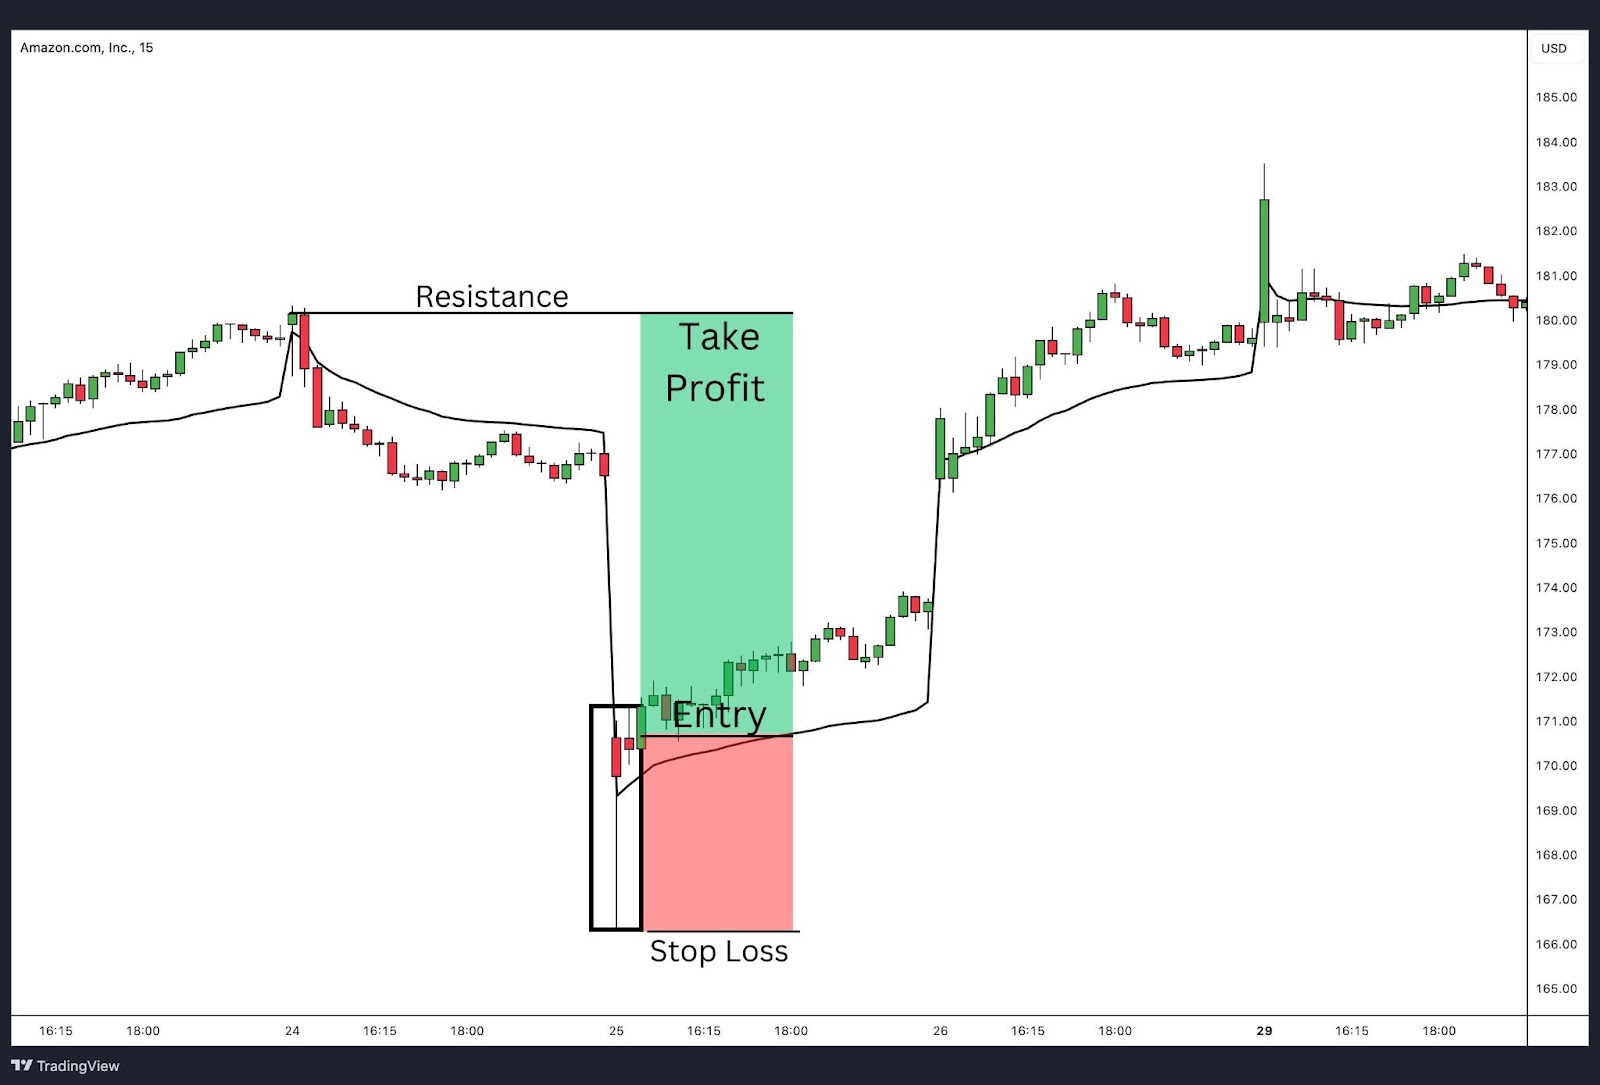
Example: Pin Bar VWAP Bounce
In the provided chart of Amazon.com, Inc. on a 15-minute timeframe, the price declined and retraced to the VWAP. At this point, a pin bar with a long lower wick formed, indicating rejection of lower prices at the VWAP level. This pin bar signalled a VWAP bounce, leading to a continuation of the upward trend, confirming the VWAP as a support level and the pin bar as a reliable reversal indicator.
Pin Bar with Moving Average Bounce
Combining pin bars with moving averages can also improve the reliability of your pin bar trade. Moving averages, such as the 50-day or 200-day moving average, act as dynamic support and resistance levels.
When a pin bar forms near one of these moving averages, it indicates respect for the moving average as a support or resistance level, suggesting a continuation of the longer trend.
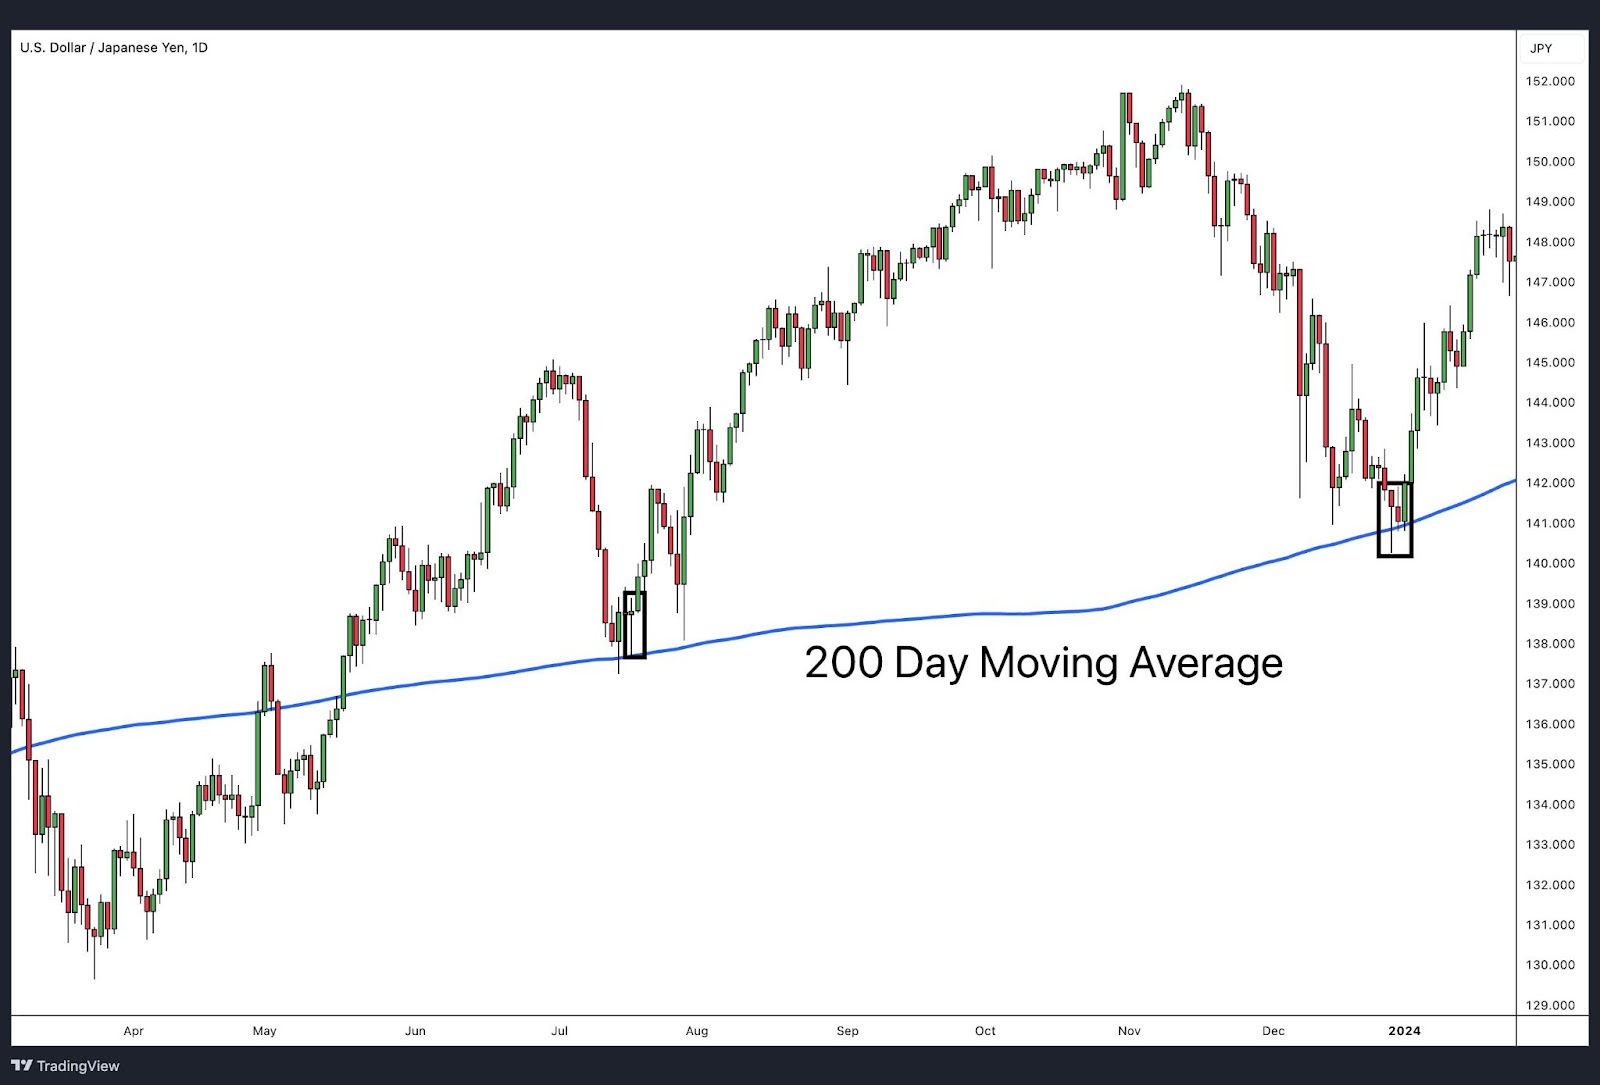
In the daily USD/JPY chart above, two pin bars are seen near the 200-day simple moving average. The first pin bar forms at the moving average, with a long lower wick leading to an upward continuation. The second pin bar similarly forms at the moving average, reinforcing the moving average’s role as a strong support level.
Both instances demonstrate how combining pin bars with moving averages can effectively identify high-probability entry points in line with the dominant trend.
The choice of moving average depends on the timeframe you are trading. If you trade on smaller time frames, then consider using shorter-period moving averages such as 10 or 20 day Moving Average. If you are a swing or position trader, longer-period averages may be more useful like 50 or 200 day Moving Average.
Using a pin bar as a confluence adds strength to the signal, providing a high-probability trade setup.
Advantages of Trading Pin Bar
• Clear and Reliable Signals: Pin bars provide distinct signals that can be easily identified on candlestick charts, making them accessible even for beginners.
• Confluence with Other Tools: They work exceptionally well when used in conjunction with other technical analysis tools, such as support and resistance levels, trend lines, and Fibonacci retracement levels, enhancing the accuracy of trade setups.
• Trend Identification: Pin bars are effective in identifying potential trend reversals, helping traders align their strategies with the prevailing market sentiment.
• Versatility: Pin bars can be applied across various markets, including forex, stocks, commodities, and cryptocurrencies, making them a versatile tool for technical analysis.
Disadvantages of Trading Pin Bar
• Noise on Lower Time frames: On lower time frames, pin bars can be less reliable due to increased market noise and volatility, leading to false signals and potential trading mistakes.
• Over-reliance Risk: Relying solely on pin bars without considering other market factors or technical indicators can result in poor trading decisions, emphasising the need for a comprehensive analysis.
• Context Dependency: The effectiveness of pin bars largely depends on their context within the overall market structure. Without proper context, pin bars might not provide meaningful or actionable signals.
• Requires Confirmation: Pin bars often need confirmation from subsequent price action or additional indicators to validate their signals, adding a layer of complexity to the trading strategy.
Types of Pin Bar Candlestick Patterns
Hammer Candlestick
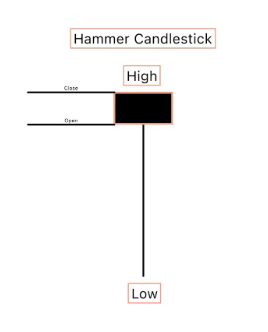
The hammer candlestick pattern is a type of pin bar characterised by a small body at the upper end of the trading range and a long lower shadow, indicating strong rejection of lower prices and potential bullish reversal. Like other pin bars, hammers signal a shift in market sentiment, often forming at the bottom of a downtrend to suggest an upcoming upward move.
Inverted Hammer
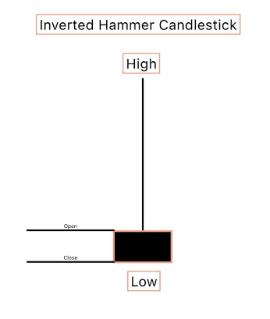
Opposed to the hammer candlestick, the inverted hammer has a small body at the lower end of the trading range and a long upper shadow, signalling a potential bearish reversal. This pattern typically appears at the top of an uptrend or during a pullback, indicating strong rejection of higher prices and a possible shift to downward momentum.
Hanging Man
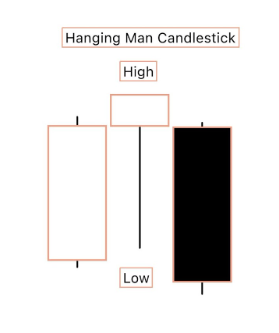
Opposed to the hammer candlestick, the hanging man candlestick appears at the top of an uptrend and signals a potential bearish reversal. It features a small body at the upper end of the trading range and a long lower shadow, similar to the hammer, but its location at the peak of a trend indicates the market’s potential rejection of higher prices, suggesting a downward shift might follow.
Shooting Star
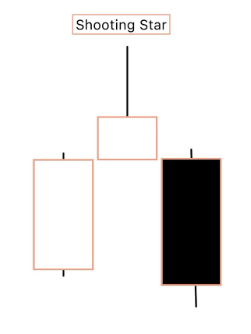
The shooting star candlestick pattern is another type of pin bar but differs from the hammer and hangman patterns. It has a small body at the lower end of the trading range and a long upper shadow, indicating a strong rejection of higher prices. The shooting star typically forms at the top of an uptrend, signaling a bearish reversal.
Unlike the hammer, which indicates bullish potential, and the hangman, which suggests a bearish turn at the trend’s peak, the shooting star specifically marks the potential end of a bullish trend and the start of downward momentum.
Pin Bar vs. Doji
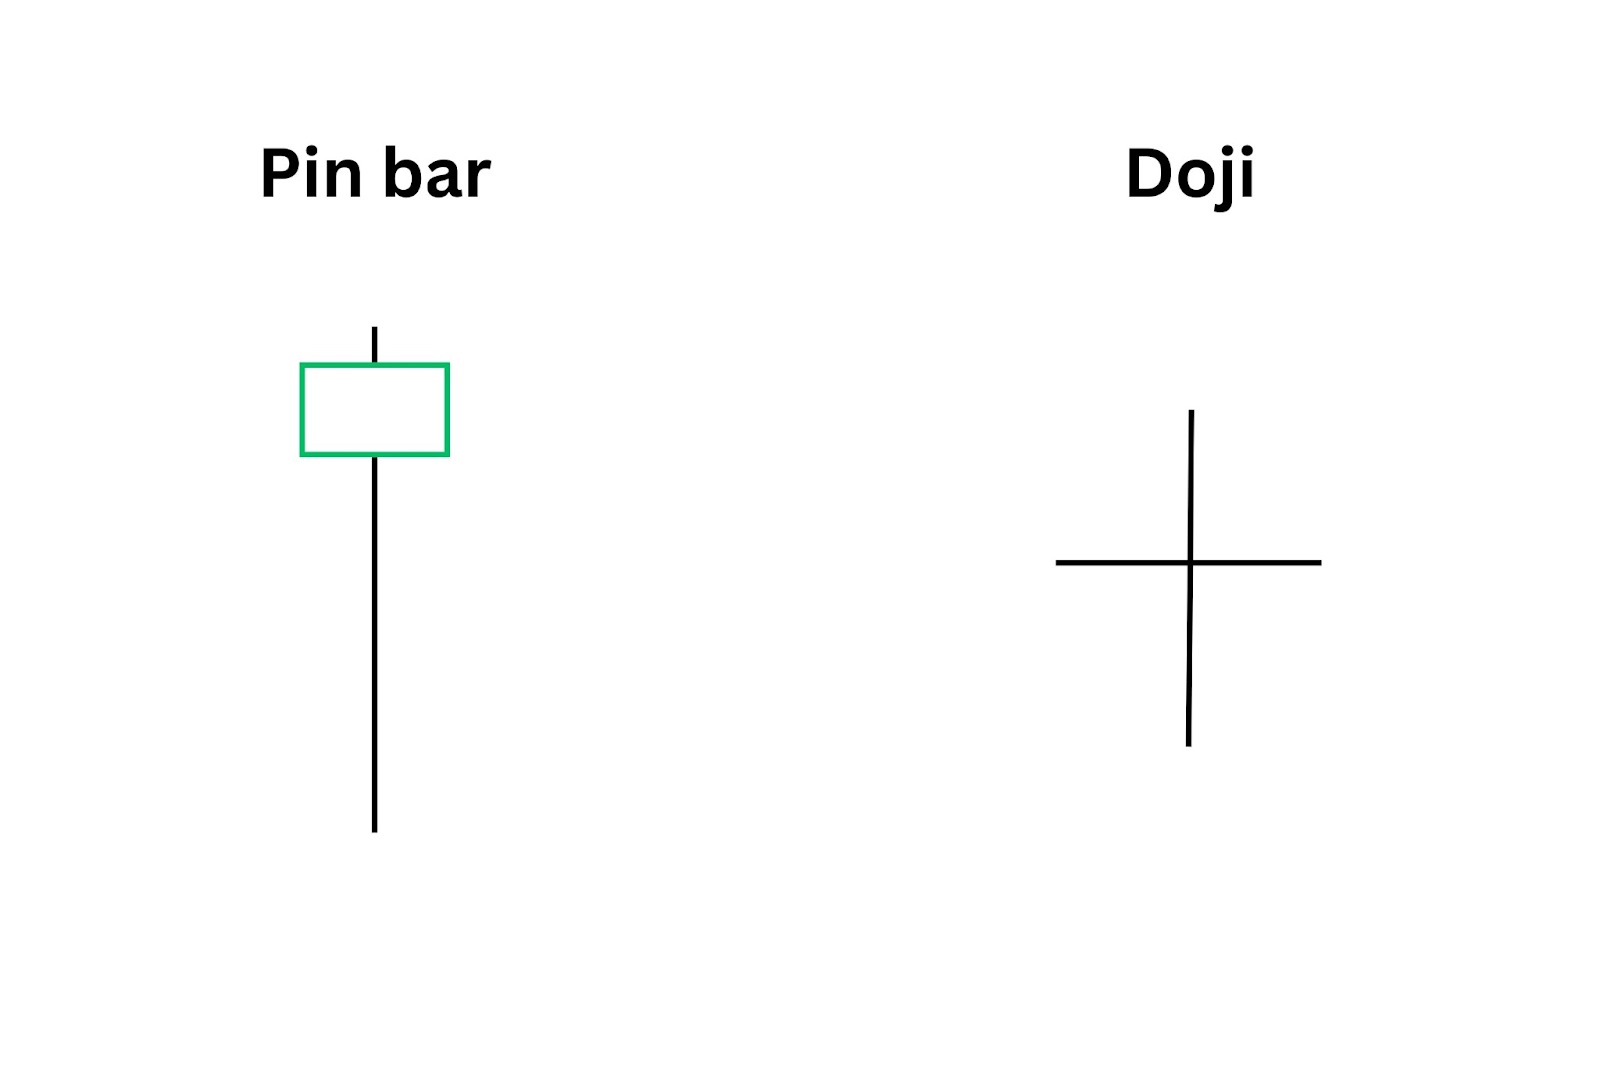
Pin bars and doji candlesticks are both important tools in technical analysis, but they convey different information. A pin bar has a small body with a long wick, indicating a strong price rejection and a potential reversal. The direction of the wick suggests the likely future price movement: a long lower wick implies bullish potential, and a long upper wick implies bearish potential.
In contrast, a doji has a very small body, where the opening and closing prices are nearly identical, signalling market indecision. Additionally, you’ll typically see wicks push out of the top and bottom of the doji, though the wicks tend to be shorter than on a pin bar.
Dojis suggest that the current trend may be weakening, but they require confirmation from subsequent candles to determine the future direction.
Pin Bar vs. Gravestone Doji
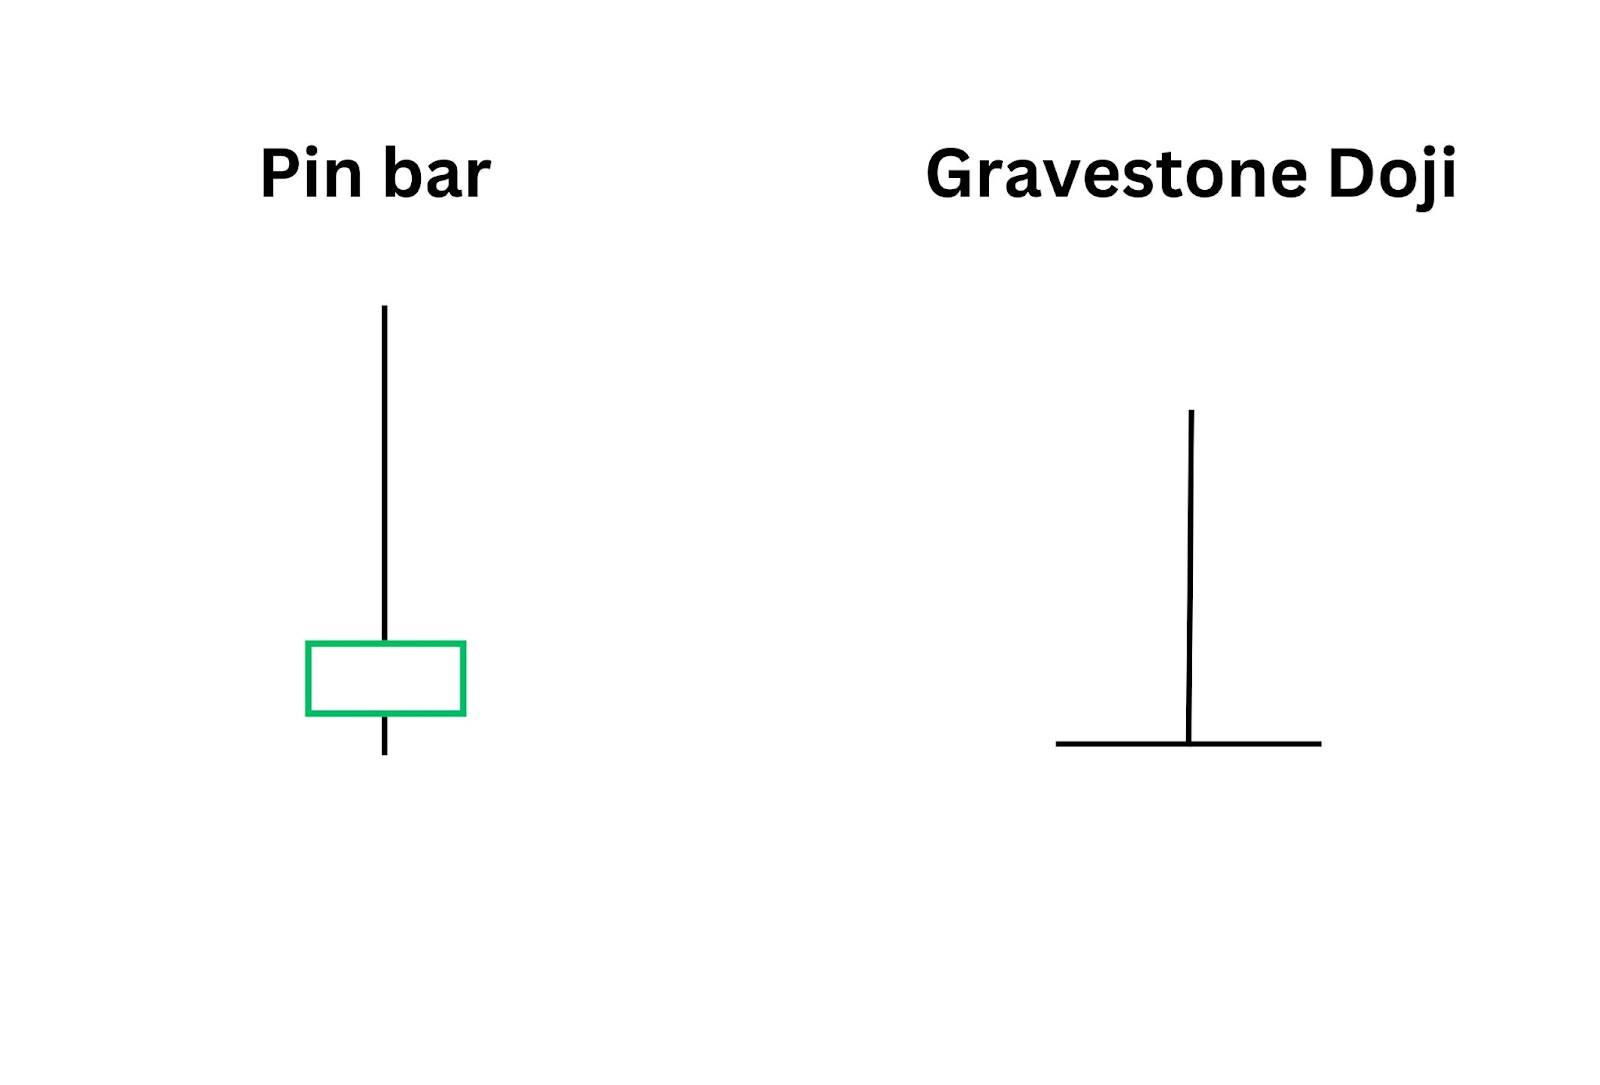
A gravestone doji is a specific type of doji characterised by a small or non-existent body at the lower end of the trading range and a long upper wick. This formation indicates a potential bearish reversal, as it shows that buyers were unable to maintain higher prices.
Compared to a bearish pin bar, which also indicates a potential downtrend with a long upper wick and small body, the gravestone doji suggests even greater indecision and the need for additional confirmation before taking a trading position.
You’ll notice the gravestone doji has virtually no body at all while the pin bar has a relatively small body.
Pin Bar vs. Dragonfly Doji
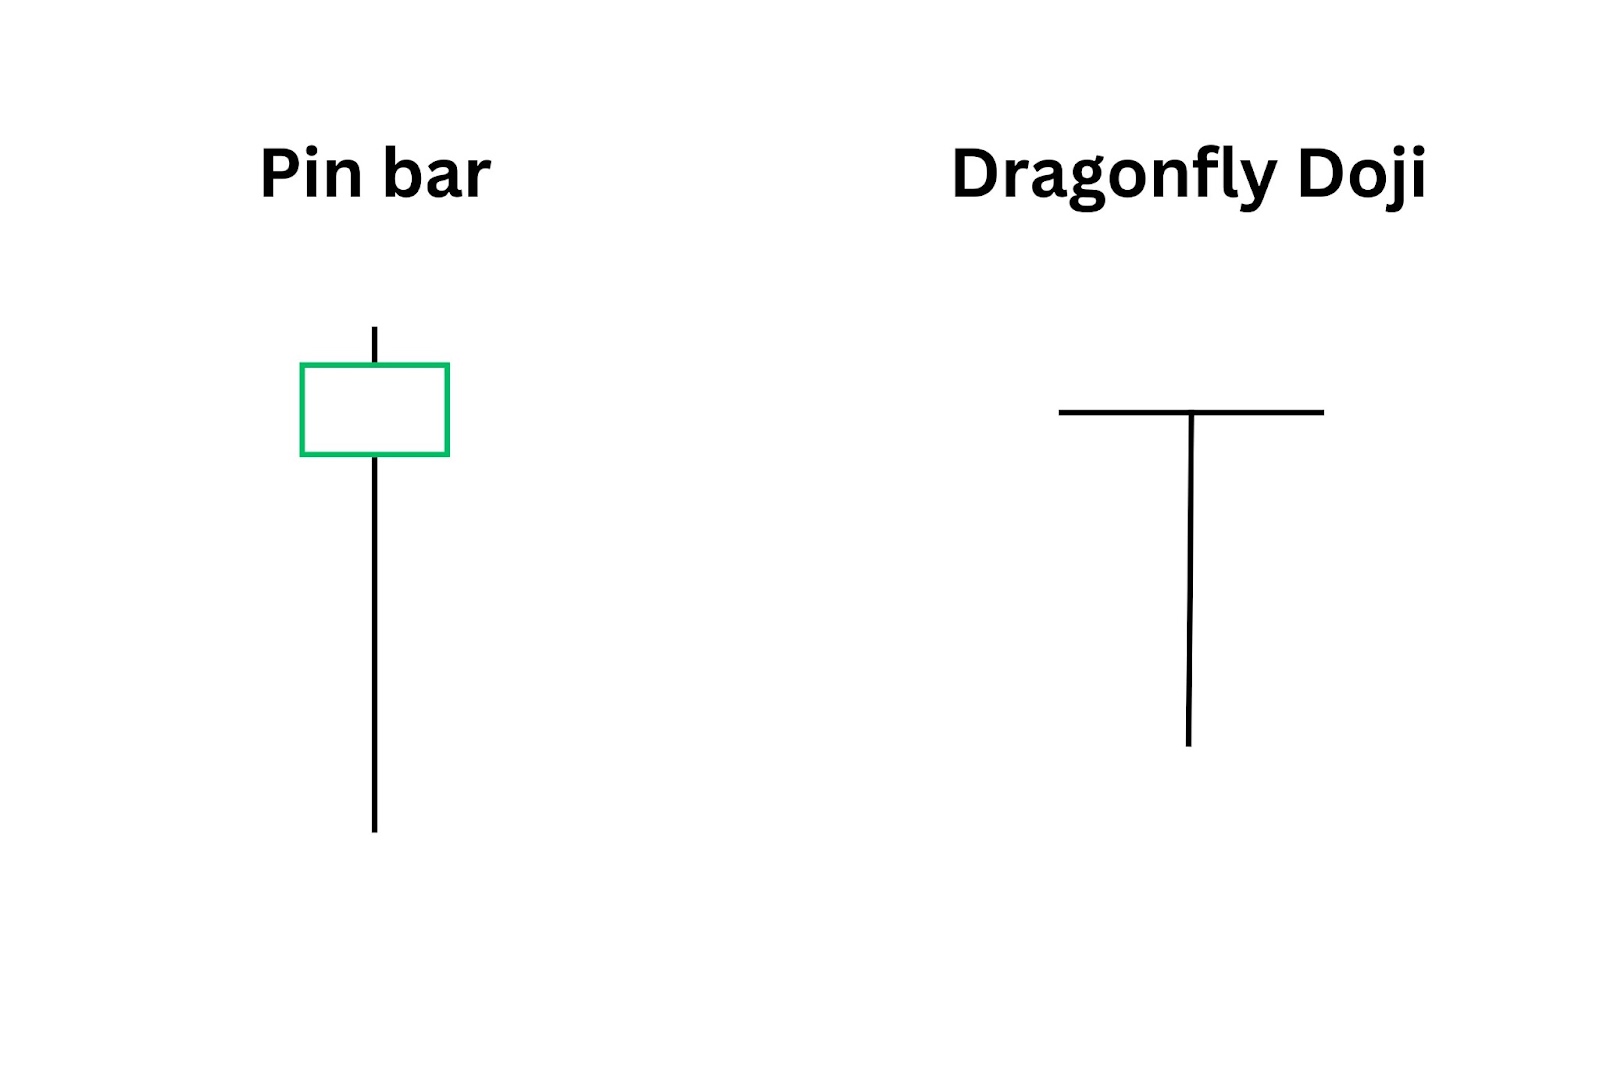
A dragonfly doji is another type of doji with a small or non-existent body at the upper end of the trading range and a long lower wick. This formation suggests a potential bullish reversal, showing that sellers failed to sustain lower prices.
In comparison to a bullish pin bar, which also indicates a potential uptrend with a long lower wick and small body, the dragonfly doji reflects a higher degree of market uncertainty. The biggest difference between these two formations are the size of the bodies. A pin bar will have a relatively small body while the dragonfly doji will have virtually no body at all.
Traders often look for further confirmation with subsequent candles before entering a trade based on a dragonfly doji.
Can The Banks Use Pin Bars Against You?
The idea that banks can use pin bars against retail traders suggests that large financial institutions might manipulate market prices to create misleading candlestick patterns. While it’s theoretically possible for banks to influence prices, the highly liquid and regulated nature of major financial markets makes consistent manipulation difficult and costly. Regulatory bodies, particularly after the Volcker Rule, have implemented strict controls on banks’ trading activities, further reducing the likelihood of such manipulation.
However, it’s essential to understand that different types of pin bars form for various reasons, and not all pin bars signal the same thing. Banks often need large volumes of orders in the same direction to take profits from their trades. They achieve this when traders react to large-range candles, believing the price will continue in that direction. Once enough traders have placed their orders, banks take profits, causing the price to move in the opposite direction, resulting in a pin bar.
Retail traders often misinterpret these pin bars as reversal signals, not realising they were formed by profit-taking. Understanding why pin bars form and considering broader market context can help traders avoid pitfalls and improve their trading strategies.
Frequently Asked Questions
What is the best timeframe to use the pin bar?
The best timeframe to use the pin bar pattern is generally the daily or higher timeframes, such as the weekly chart. These higher time frames provide more reliable signals and help reduce the noise and false signals that are often found on lower timeframes.
How reliable is the pin bar?
The pin bar has moderate reliability, especially when combined with other technical indicators and used within the overall market trend. The long wick is a big clue towards price rejection and indicates a potential trend change in the opposite direction of the wick.
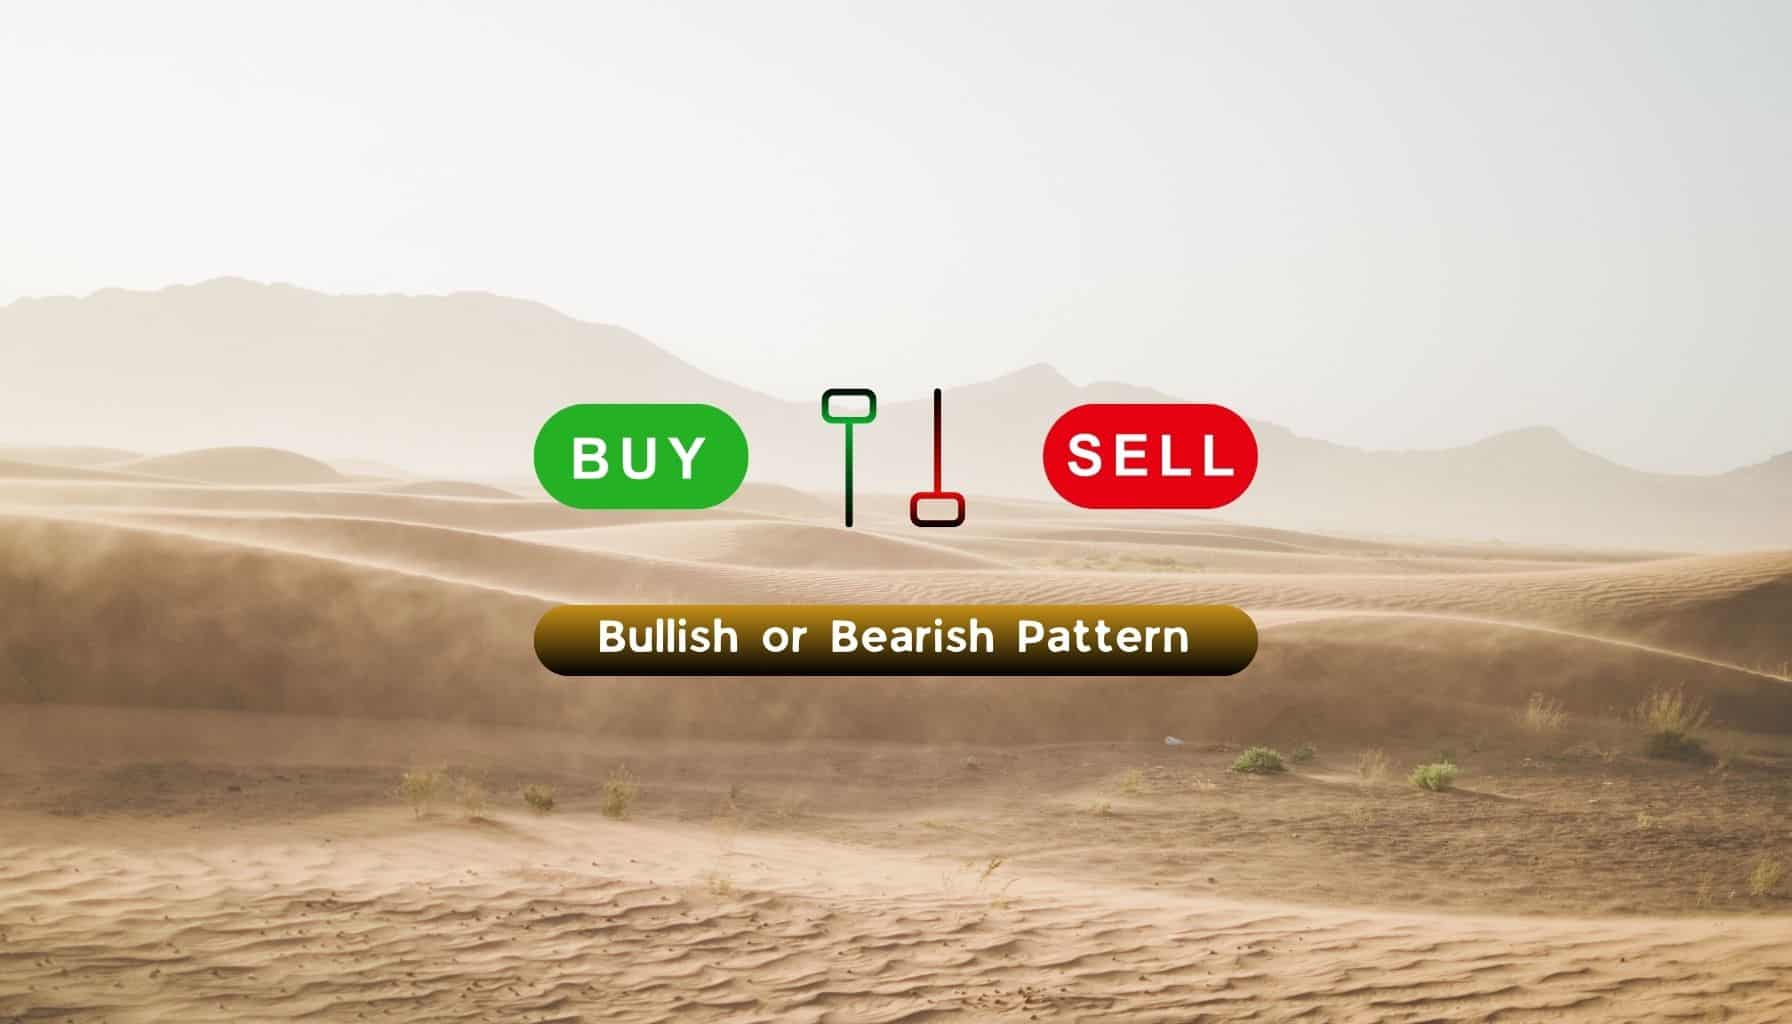
Is a pin bar candle pattern bullish or bearish?
A pin bar candle pattern can be either bullish or bearish. A bullish pin bar typically forms at the bottom of a downtrend, indicating potential upward movement, while a bearish pin bar forms at the top of an uptrend, signalling potential downward movement.
What is the difference between a pin bar candlestick and a hammer candlestick?
The pin bar and hammer candlestick patterns are similar, but a hammer specifically forms at the bottom of a downtrend with a small body at the upper end and a long lower shadow, indicating a bullish reversal. A pin bar can form at either the top or bottom of a trend, signaling a reversal or continuation.
What is the difference between a pin bar and inside bar?
A pin bar is a single candlestick pattern with a long wick and a small body that signals rejection of price levels, while an inside bar is a two-candle pattern where the second candle is contained within the range of the first candle, indicating consolidation before a breakout.