


Written by:

Reviewed by:

Bearish
- September 19, 2024
- 22 min read
Gravestone Doji Trading Guide
What is a Gravestone Doji?
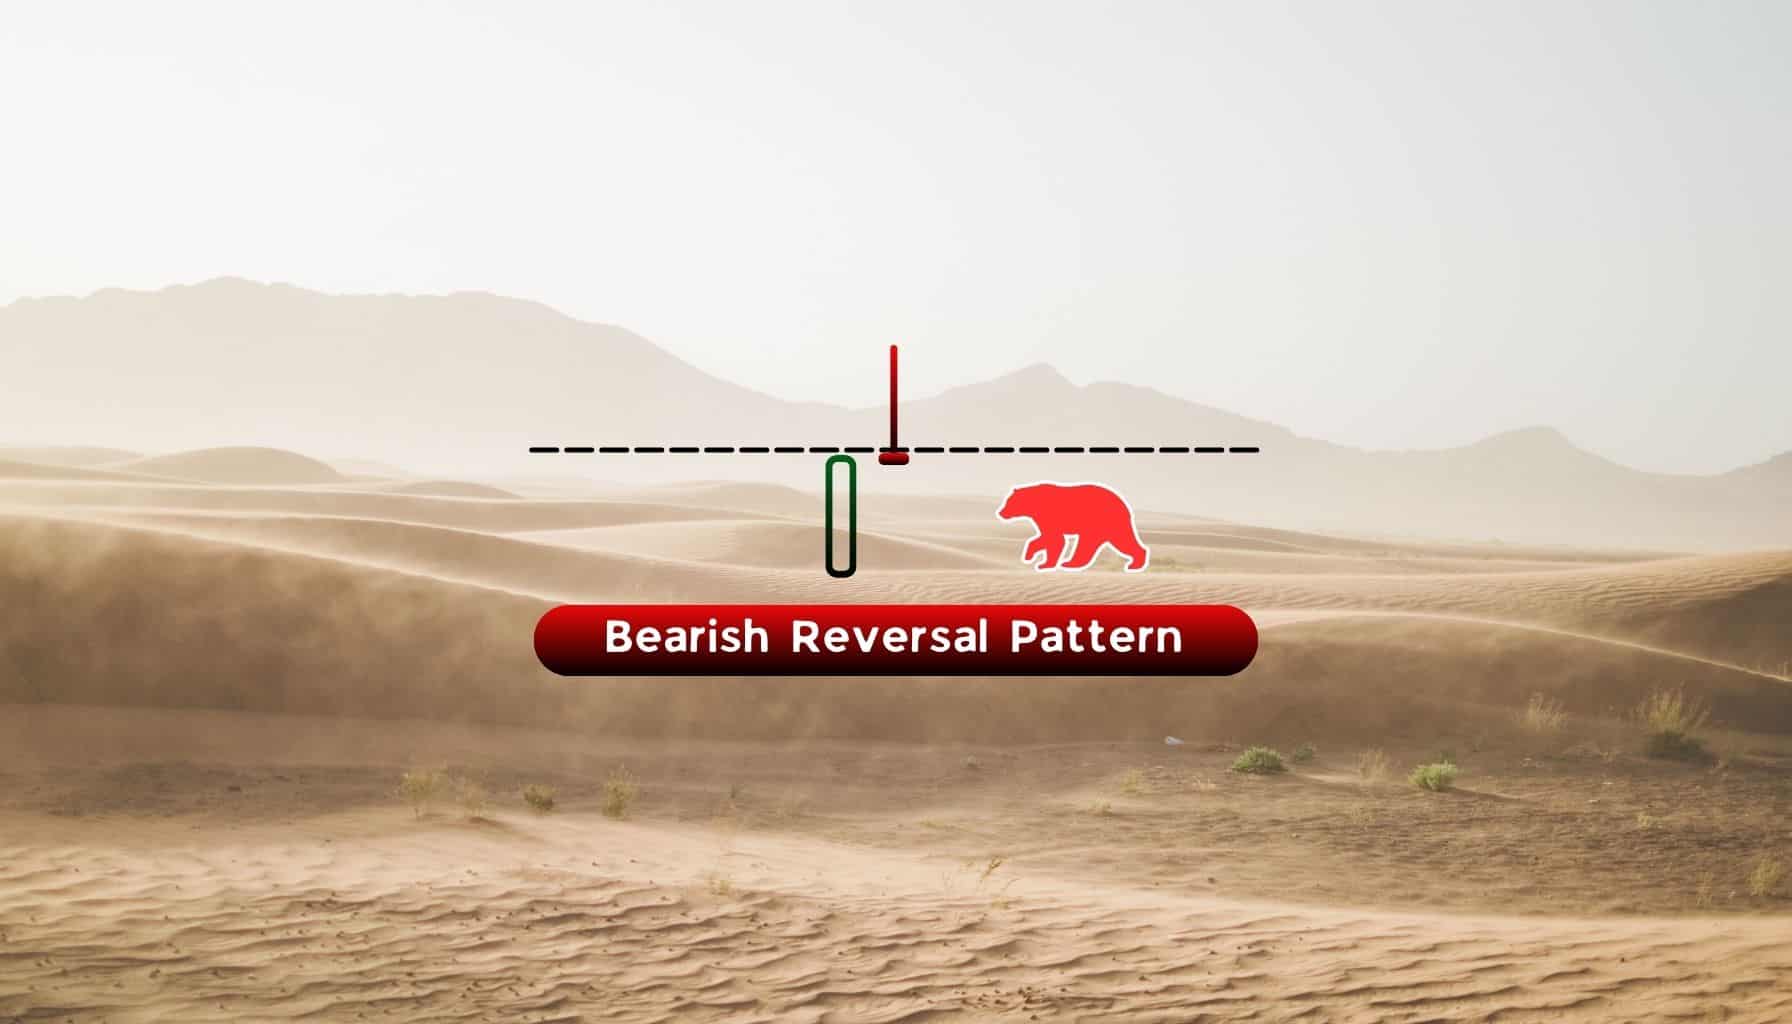
A gravestone doji is a Japanese candlestick pattern used by traders to identify a potential bearish reversal in price direction. This candlestick pattern is made up of a single candle with a long, upper wick (or in other words, shadow), and a small candle body at the bottom.
In technical analysis, the gravestone doji is used to predict when the price of an asset will “make a U turn” during a bullish trend – making it a bearish reversal pattern. This predictive edge helps traders exit buy positions at an opportune time, or trade the price to the downside.
What Does a Gravestone Doji Tell You?
The gravestone doji is a bearish candlestick pattern that occurs at the end of an uptrend, and hints at the possibility for a brief pause in bullish momentum, or a reversal towards the downside.
The formation of a gravestone doji tells us that a smaller price reversal has already happened, and implies that a larger trend reversal could be on the horizon.
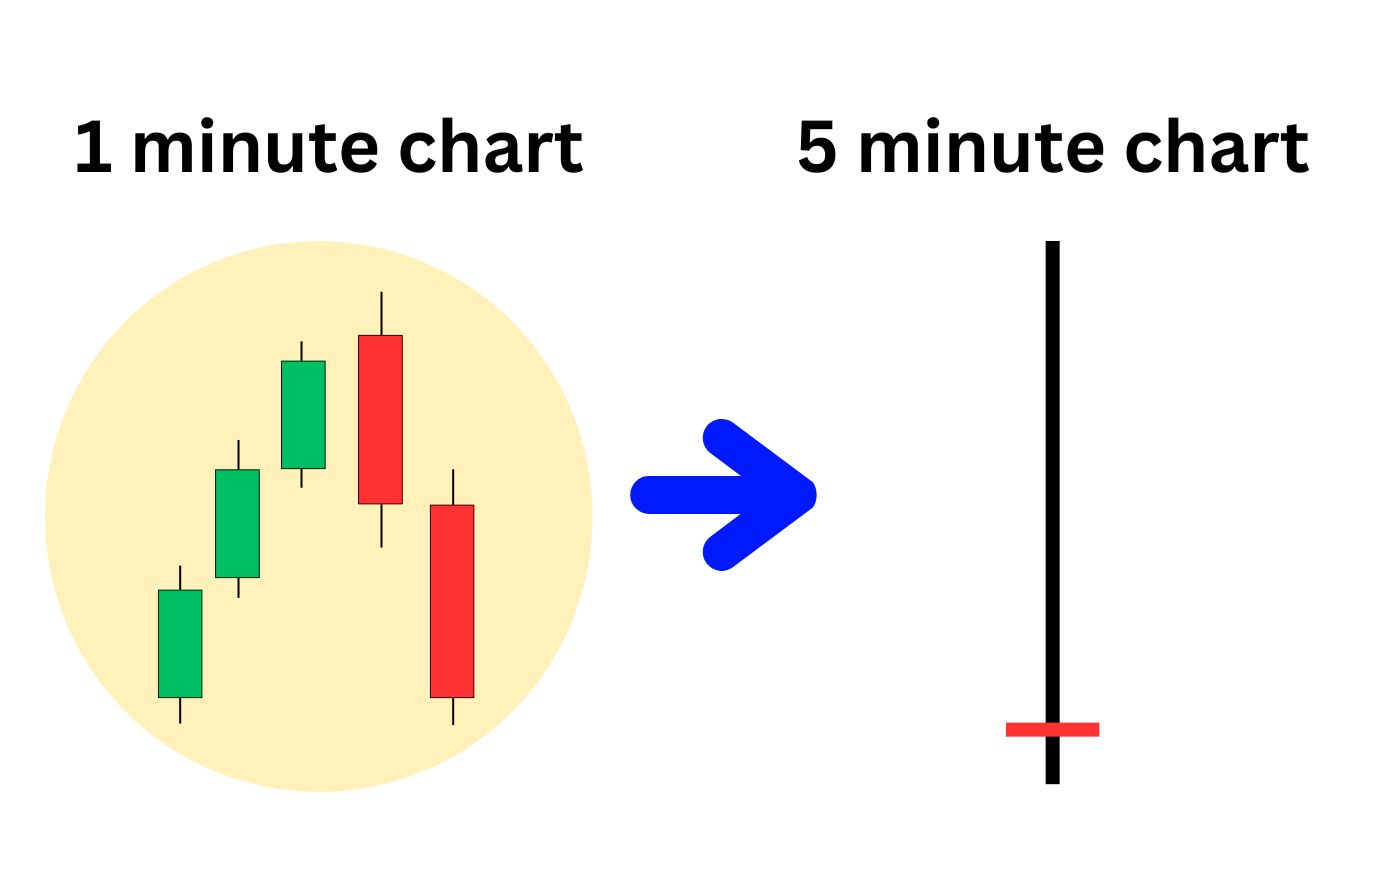
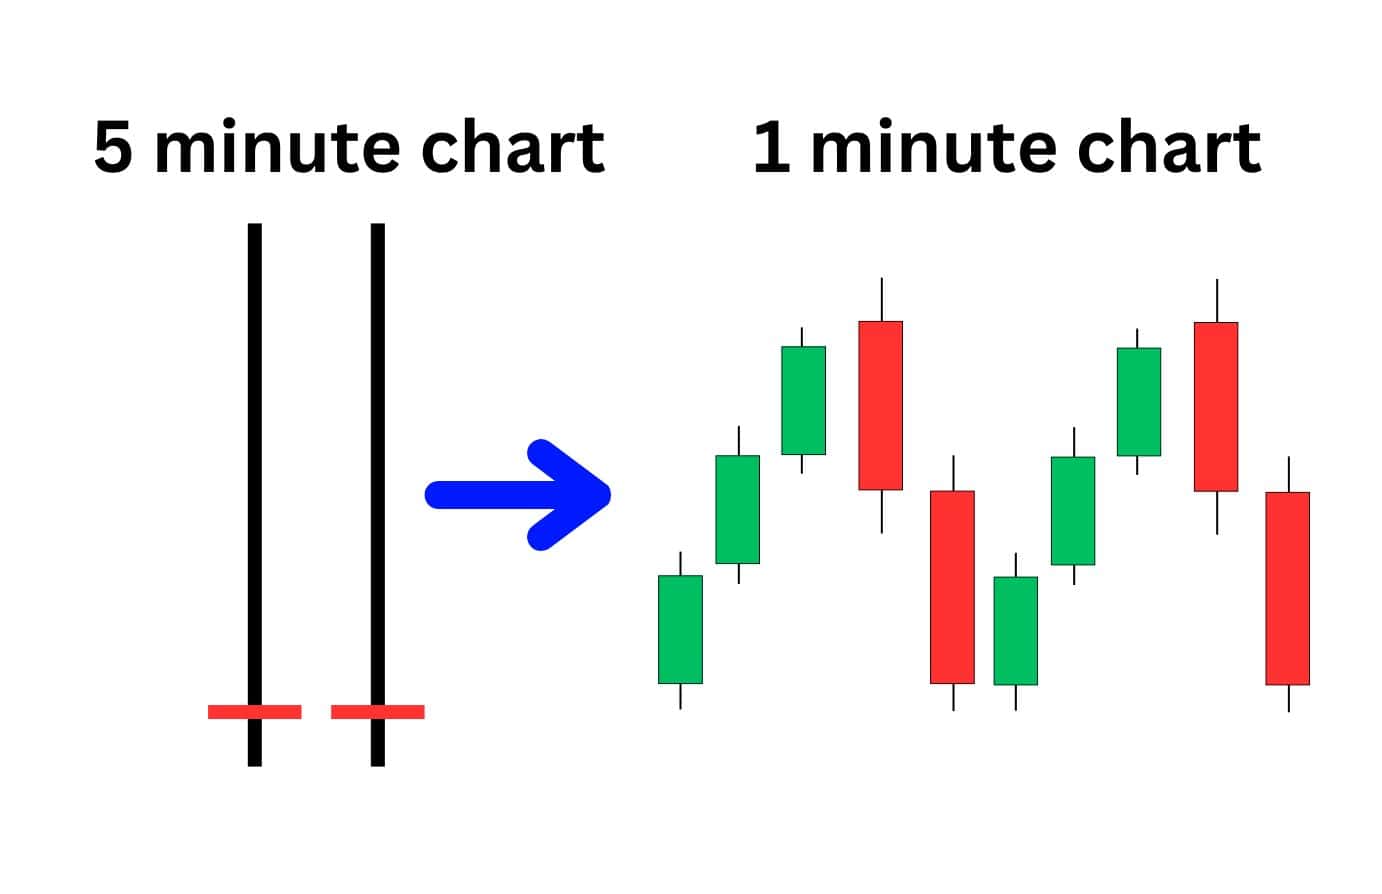
When you break down a single gravestone doji candle into a series of candlesticks, this smaller reversal becomes apparent. Two explanations for this occurrence are:
- Not enough interested buyers were present at the highs of the candlestick to maintain the price level.
- Too many interested sellers were at the highs, which resulted in selling pressure overwhelming the buying pressure.
Either way, this price action creates a gravestone doji with the characteristics of a long upper shadow and a narrow candle body. The narrow candle body tells us that buyers have ended up back at their starting point over the candlestick’s elapsed time period – ultimately halting buyers in their tracks.
However, being a doji candlestick pattern, the gravestone doji also signals indecision, and can be fairly inaccurate as a signal. It requires additional confluences and confirmations to be traded with consistency.
How to Identify the Gravestone Doji Pattern?
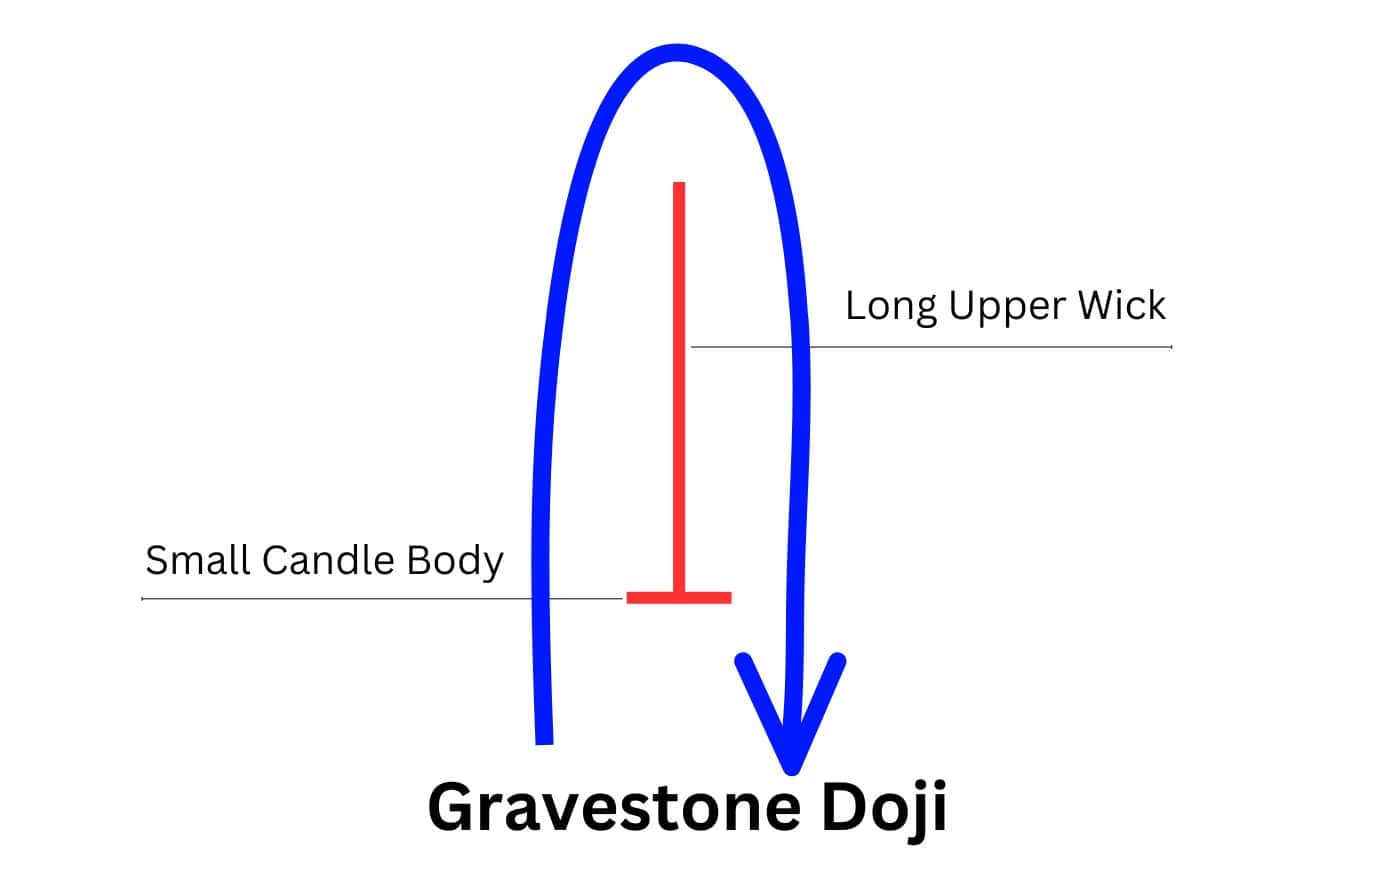
All gravestone doji patterns on a candlestick chart have the following characteristics:
- The candlestick has a long upper shadow or wick that is larger than most candles on the chart.
- The candle body is small and narrow, resembling a horizontal line.
- The candlestick has little to no lower shadow.
There is also a fourth key factor to keep in mind when it comes to identifying gravestone dojis, and that’s the location at which the pattern has formed. A gravestone doji can only be considered bearish if it’s formed after an uptrend, therefore it’s easier to find valid gravestone doji patterns at key resistance levels.
By only paying attention to key resistances, you can efficiently identify areas where a gravestone doji chart pattern might occur, saving time and effort in searching for it across various market conditions.
Importance of Gravestone Doji Pattern
The gravestone doji chart pattern is one of the bearish candlestick patterns, which indicates a loss of buying momentum at the highs. This is represented by the formation of a long upper wick. At the same time, the formation of this candlestick paints a story about the market dynamics occurring in the market.
- The long upper shadow suggests that the selling pressure from higher has overwhelmed the buyers, denying the price from moving any higher.
- Buyers from lower prices took profits aggressively at the highs, leading to a collapse in buying pressure and bullish momentum. This is less bearish.
- The price spiked higher to trigger stop-loss orders for short sellers or to catch traders who entered short positions prematurely.
Traders can use indicators such as volume, pivot points, and momentum divergences to pinpoint which scenario has occurred, giving them an edge in trading the gravestone doji pattern.
What Does the Red Gravestone Doji Candlestick Indicate?
A red gravestone doji is a bearish signal that indicates bears managed to push the price below its opening level, closing slightly lower. The red colour is helpful in highlighting this minor detail, as the opening and closing prices are very close to each other, and can be difficult to visually discern.
What Does the Green Gravestone Doji Candlestick Indicate?
A green gravestone doji indicates that bulls briefly succeeded in pushing the price above its opening level. However, don’t let this fool you into thinking the gravestone doji is a bullish sign – it is actually a strong indicator of a bearish reversal due to the candlestick’s long upper shadow.
This shadow shows a strong but ultimately unsuccessful attempt by buyers to raise the price, resulting in a close near the opening level.
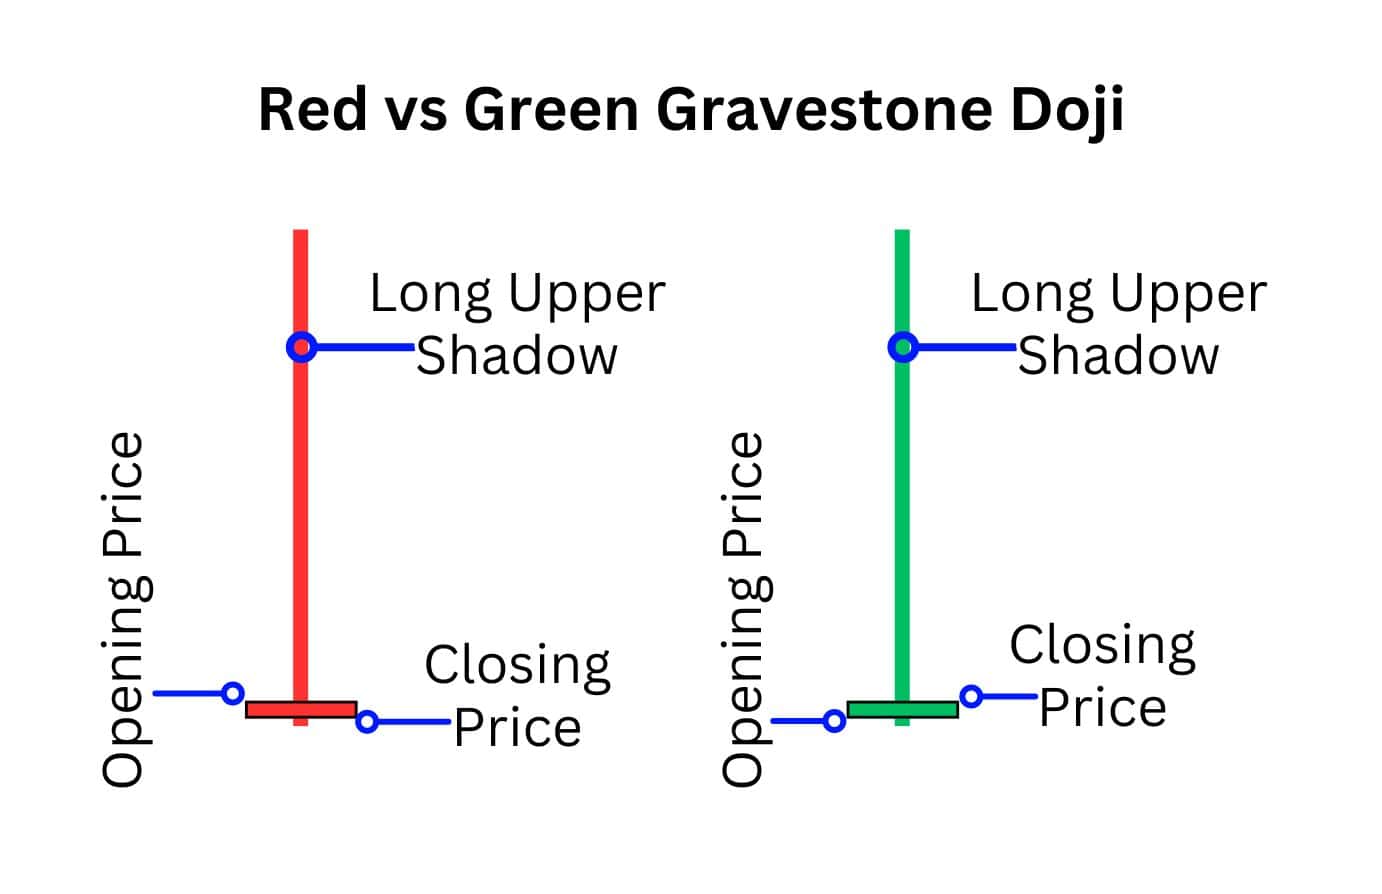
Does It Matter if A Gravestone Doji Candlestick Is Red or Green?
Overall, the colour of gravestone doji candlestick patterns has little impact on the bearish signal it provides.
The main indicator of bearishness comes from the candlestick’s shape: the long upper shadow, small candle body, and little to no lower shadow.
When Does Gravestone Doji Candlestick Happen?
A gravestone doji candle typically appears after an uptrend, often at a resistance level/zone. These are critical areas above the current price that have previously triggered price reactions, causing the price to pivot direction after reaching them.
Resistance levels can be categorised into two types: Static and Dynamic.
Static resistances are horizontal levels that remain constant and can be easily identified by simply observing the chart. Conversely, dynamic resistances are constantly changing, and are usually identified through the use of indicators.
Here is a cheat list for the types of resistances you can trade a gravestone doji with:
| Static Resistances | Dynamic Resistances |
| -Pivot / Swing Highs -Previous Highs and Lows -Psychological Levels (Round numbers) -Fibonacci Levels -Trend Lines | -Moving Averages -Bollinger Bands -Volume-Weighted Average Price -MACD Indicator -Volume Profile |
When a strong attempt is made at pushing price higher through these resistance levels, but then prices are quickly rejected, a gravestone doji candlestick pattern may form. This indicates market indecision and the potential for a bearish reversal.
How Often Does Gravestone Doji Candlestick Occur?
Although it can be found on any timeframe and on any asset, the gravestone doji is an infrequent pattern. This rarity is due to its unique specification of a thin candle body that resembles a horizontal line and extra long upper wick.
What appears to be a gravestone doji oftentimes forms into a shooting star candlestick pattern, as they are both rejection candles with a long upper shadow. The key distinction between them is that a shooting star’s candle body can be bigger, which is what usually occurs.
This distinction is important to make as the gravestone doji signals more indecision than the shooting star, making it a less accurate bearish signal. According to Thomas Bulkowski, a renowned analyst, the gravestone doji candlestick pattern only results in a reversal 51% of the time, making it a coin toss.
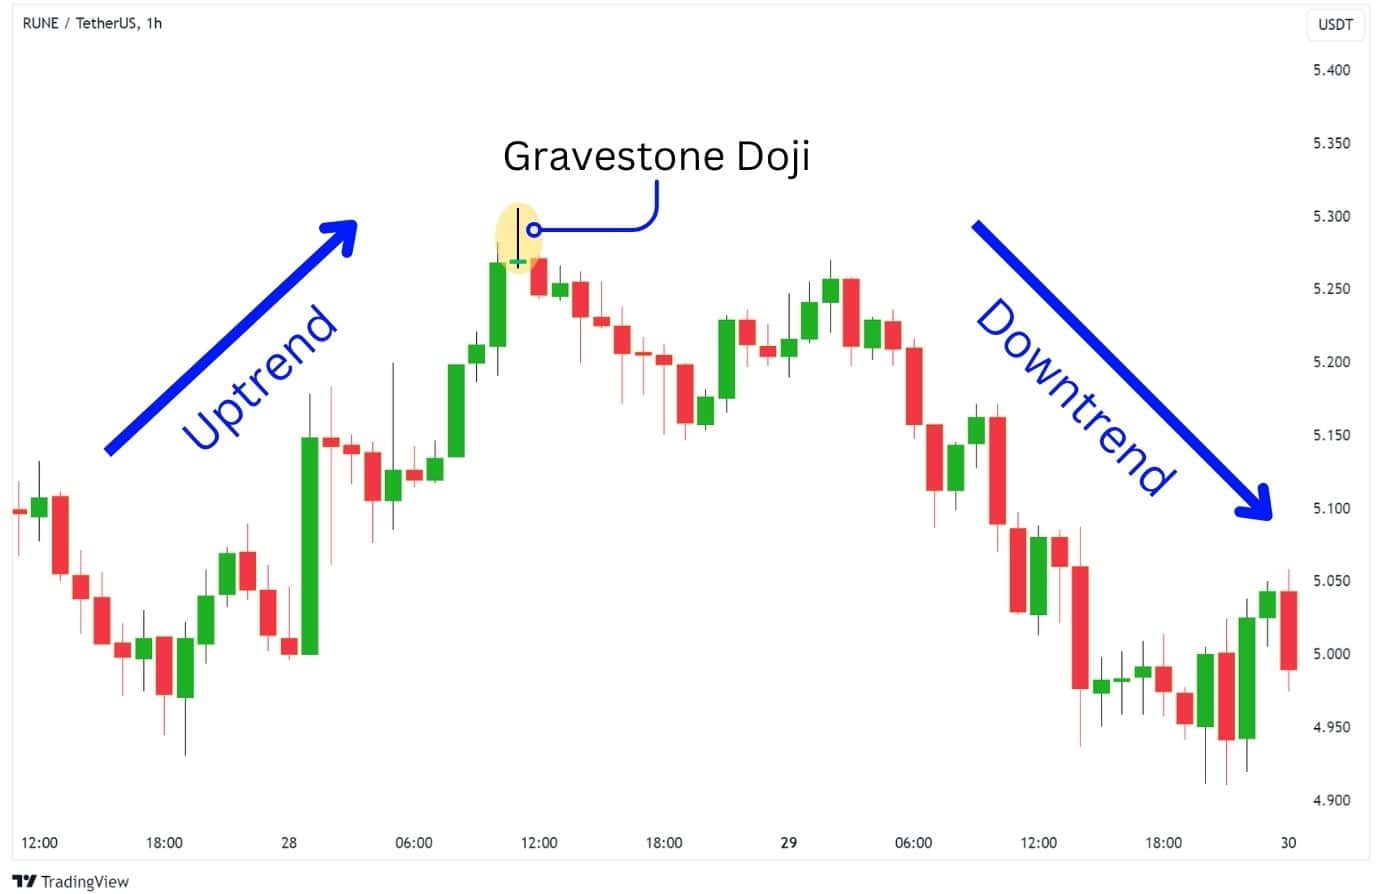
Gravestone Doji Candlestick Pattern Example
Below is an example of a gravestone doji candlestick pattern on the 1H timeframe:
- The price initially rises from $4.950 in an uptrend, creating higher lows and higher highs.
- A gravestone doji emerges at $5.300, signalling weakness in buying momentum.
- The price eventually creates a bearish trend – forming lower highs and lower lows.
- We fall back down towards $4.950, the initial starting point of the uptrend.
Gravestone Doji in Uptrend
A gravestone doji often appears at the end of an uptrend, signalling market indecision and a potential slowdown in buying momentum. When used as a standalone bearish signal, the pattern has a success rate of approximately 51%, giving only a slight edge for a bearish reversal.
However, when paired with other bearish indications, the gravestone doji can provide a great short entry with higher probability. These factors include:
- Bearish momentum divergences in play, such as a bearish RSI divergence.
- The significance of the price zone at which the gravestone doji has formed – is it at resistance?
- The presence of a bearish chart pattern, such as the rising wedge.
Gravestone Doji in Downtrend
When a gravestone doji appears at the end of a downtrend, it is not typically used as a reversal signal. However, it can act as a bearish continuation signal if the price has broken down from a support line.
In such a scenario, the emergence of a gravestone doji at the former support, now turned resistance, tells us that the markets are unable to regain strength and bearish continuation is likely.
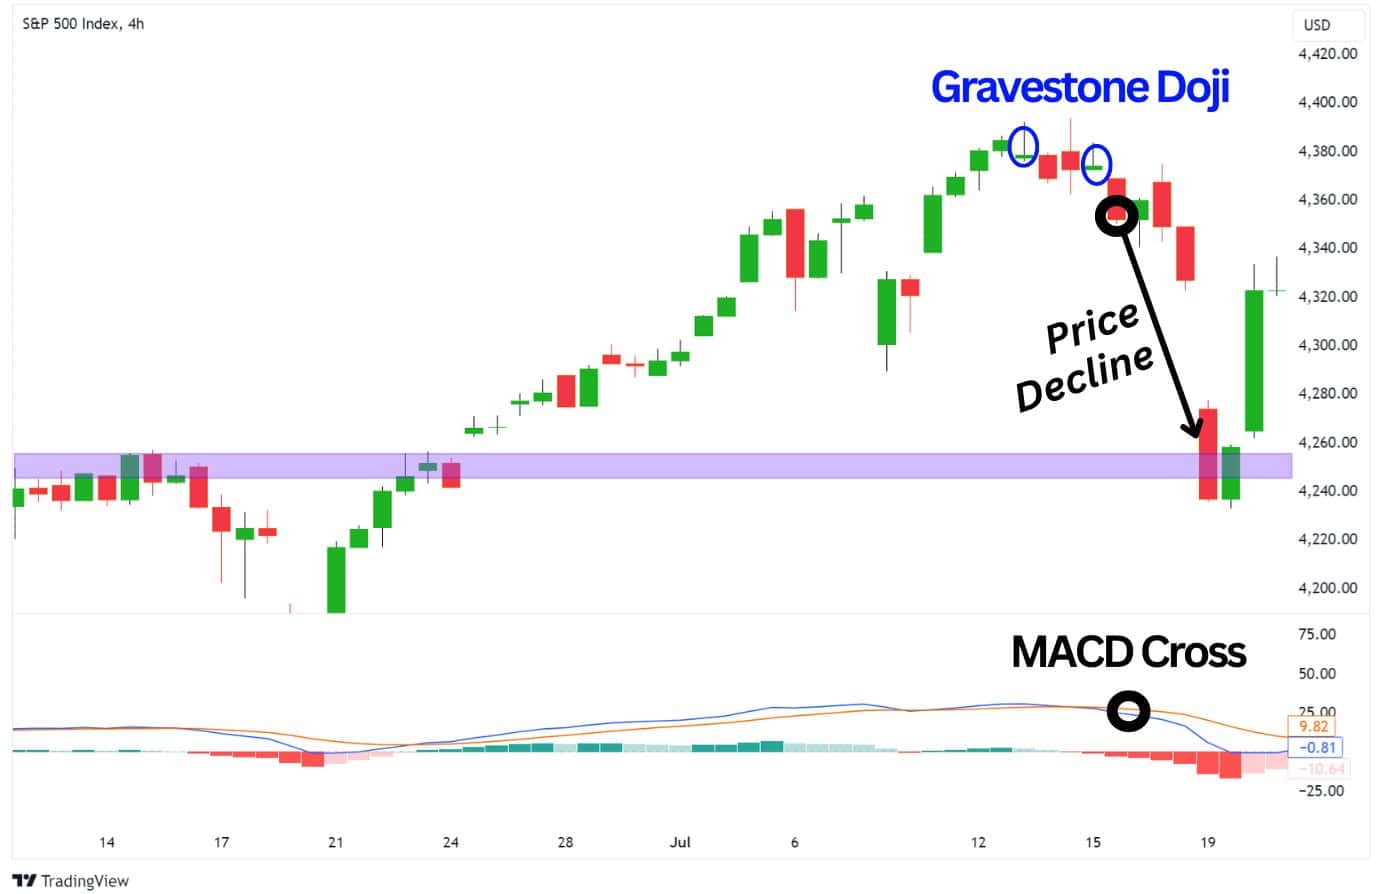
Double Gravestone Doji
Double gravestone dojis are rare occurrences where two gravestone dojis appear right next to each other. It is essentially a double top pattern contained within two candlesticks, making this a powerful bearish reversal signal.
Gravestone Doji Trading Strategies
As we’ve discussed, the gravestone doji candlestick pattern can be a rather unreliable bearish reversal pattern, with only a 51% rate of playing out. However, by applying our understanding of market structure and indicators, we can more confidently trade the gravestone doji.
Here are a few strategies to consider when trading this pattern.
Pullbacks On Naked Charts
In trading, there’s a popular saying: “The trend is your friend, until it ends.” This emphasises that during a trending environment, that price is likely to continue moving in an overall direction.
The pullback strategy takes advantage of this old adage, and provides a higher probability short opportunity when a gravestone doji appears during a pullback in a broader bearish trend.
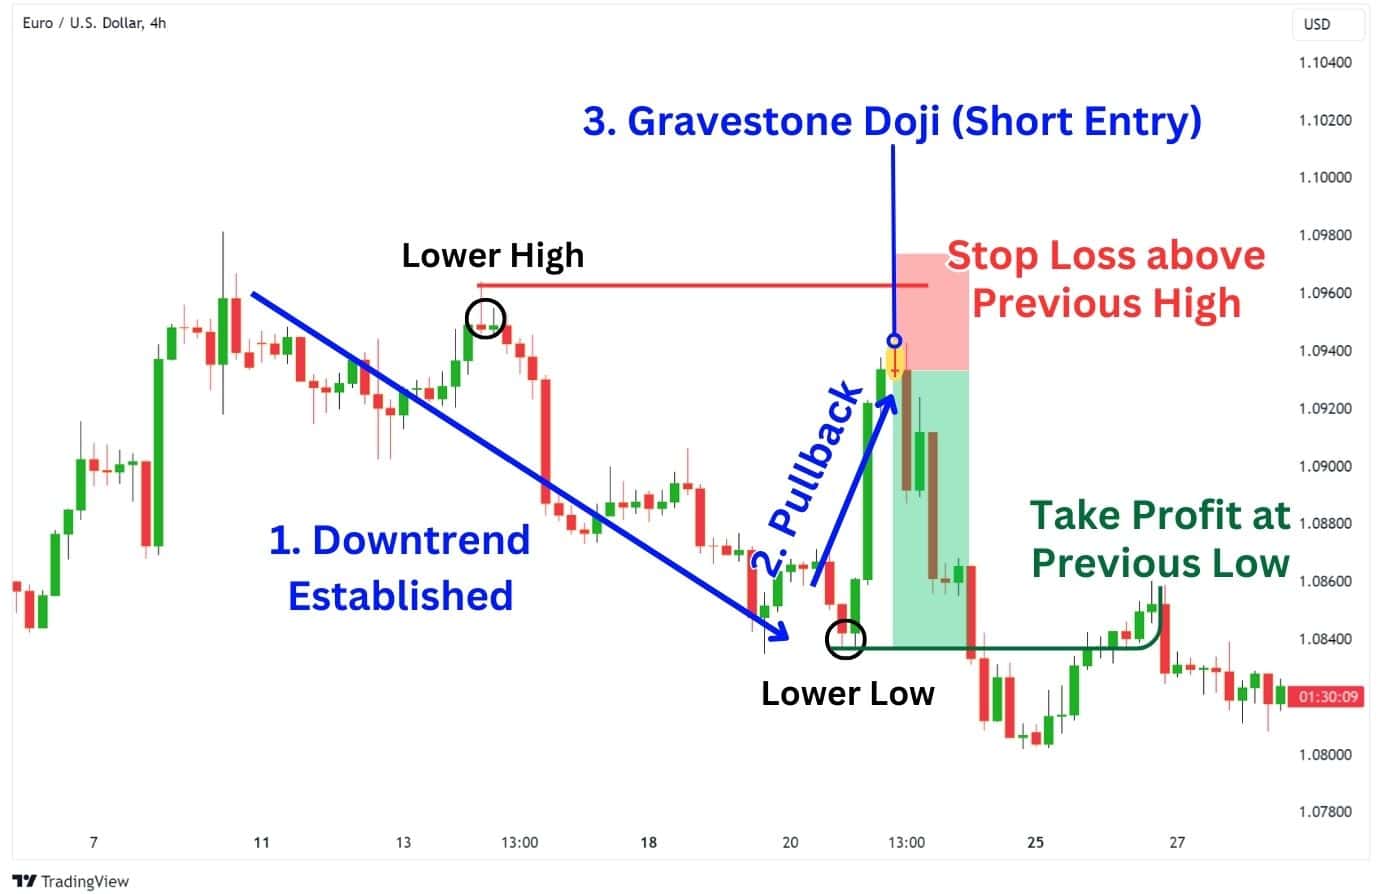
Enter a short trade when these conditions are met:
| The gravestone doji must form below the previous high. |
| A downtrend was established: The previous high must be a lower high, followed by a lower low. |
For the stop loss and take profit, consider these options:
| Stop loss (SL) placed above the previous high. This is a smart SL placement because if the pullback breaks above the lower high, it is no longer a pullback but a reversal. |
| Take profit (TP) placed at the previous low, as this is an area where a reversal could occur. |
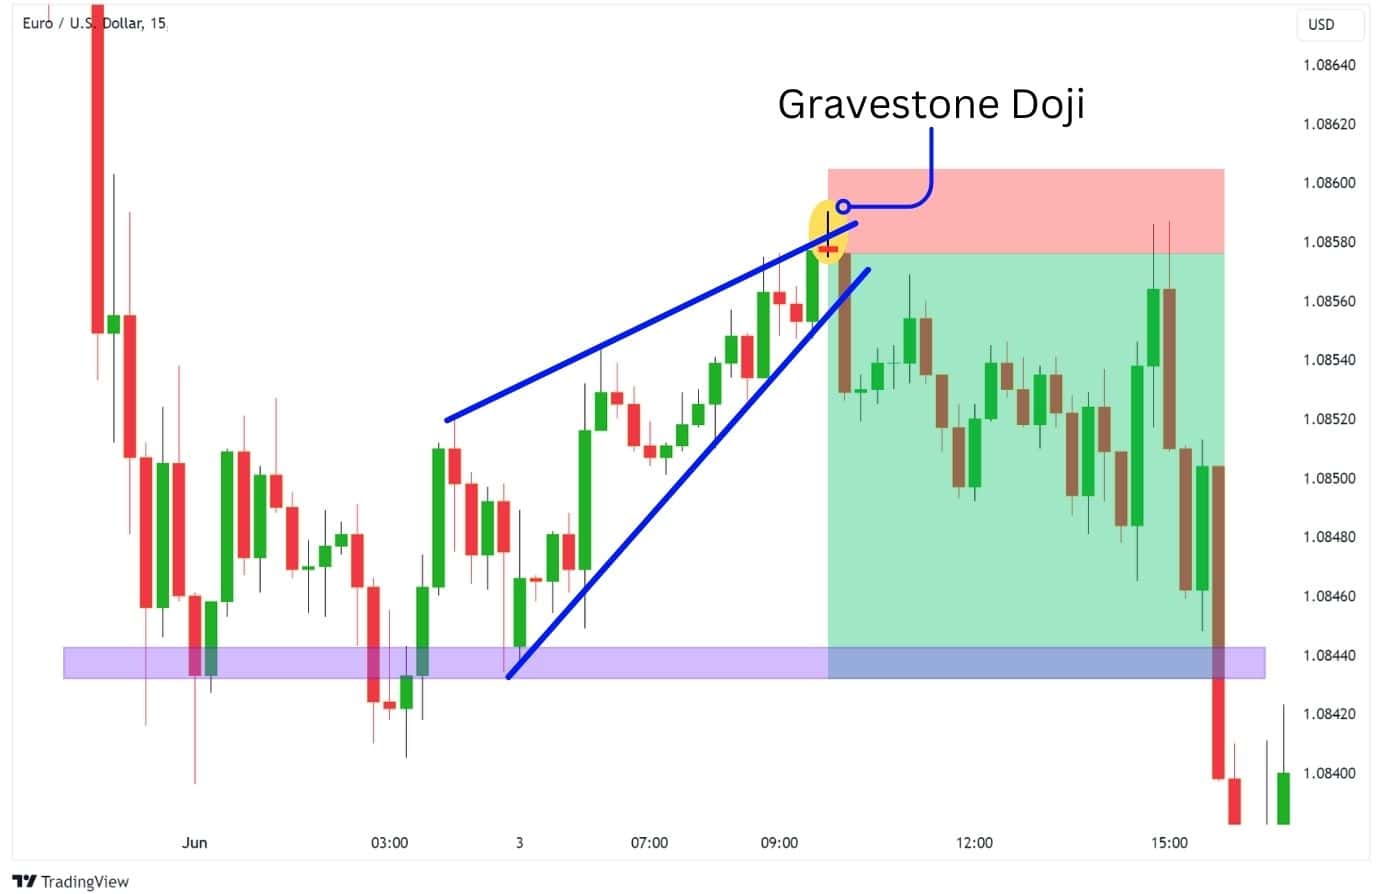
Trading the Gravestone Doji With Resistance Levels
Resistance levels are prices where investors and traders are interested in selling from. Therefore, the emergence of a gravestone doji in these areas lends weight to the idea of a bearish reversal.
Just like the pullback strategy, the application of a resistance level with the gravestone doji can help traders find a higher probability trade.
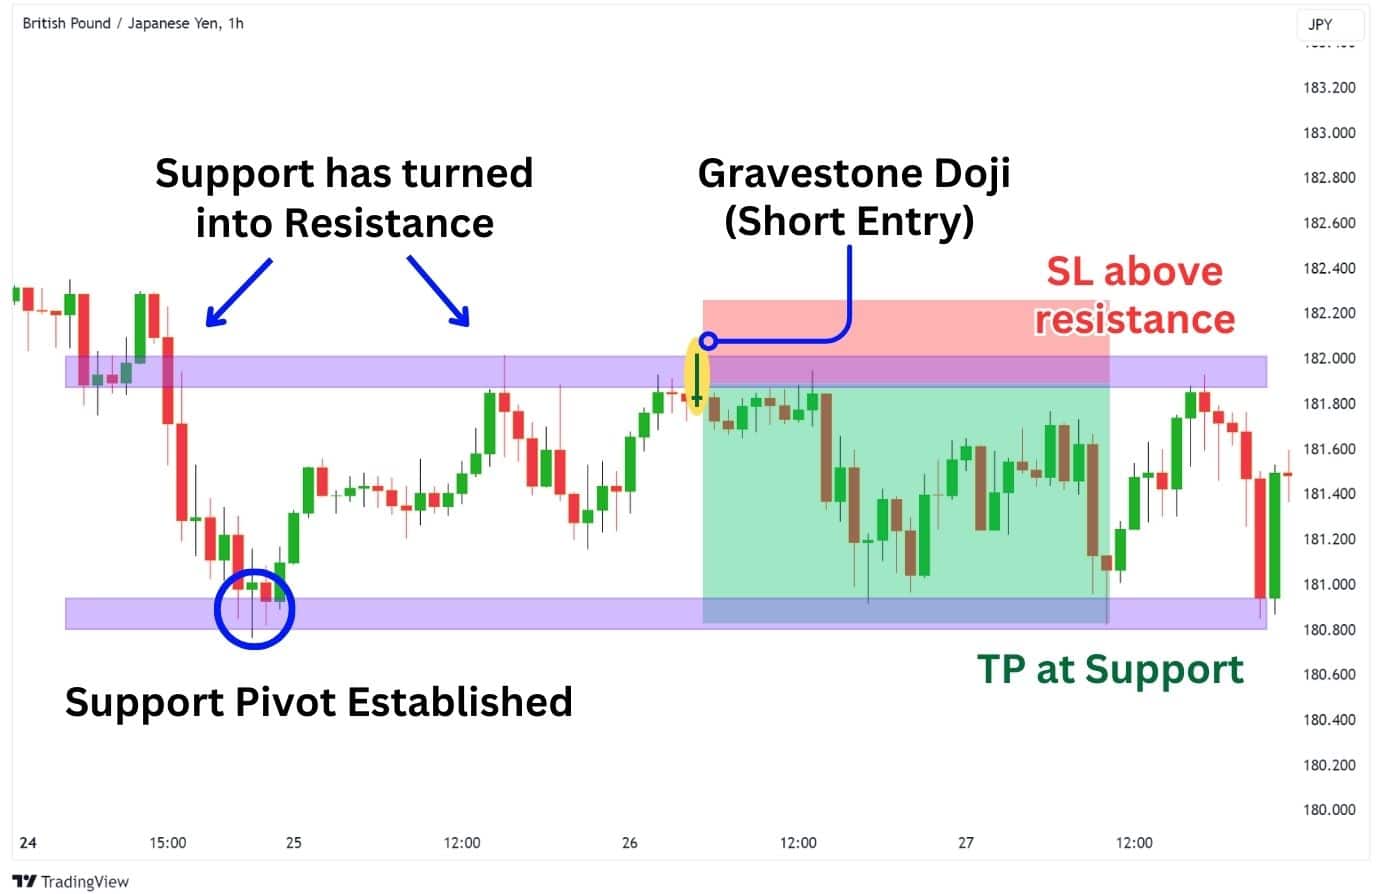
Enter a short trade when these conditions are met:
| The gravestone doji must form at a resistance level. These can be previous highs, previous lows, or horizontal levels where the price has previously acted as support, now turned resistance. |
For the stop loss and take profit, consider these options:
| Stop loss (SL) placed above the resistance level or gravestone doji – whichever is higher. |
| Take profit (TP) placed to a significant support level, such as a price zone that was able to reverse a strong price decline. |
Trading the Gravestone Doji With Moving Averages
Moving averages are indicators that map out the average price of an asset, spread across a period of time. Moving averages are displayed as a moving, wavy line on the price chart that constantly adapts to price changes – acting as a dynamic level of support and resistance.
When the price is under a moving average (MA), the MA acts as a resistance level. This is how we can apply the concepts of gravestone doji, and resistance level trading with moving averages.
The general concept of this strategy is to enter a short trade when a gravestone doji forms at the moving average. However, you must be mindful when using this strategy as different assets will react to different types and lengths of moving averages.
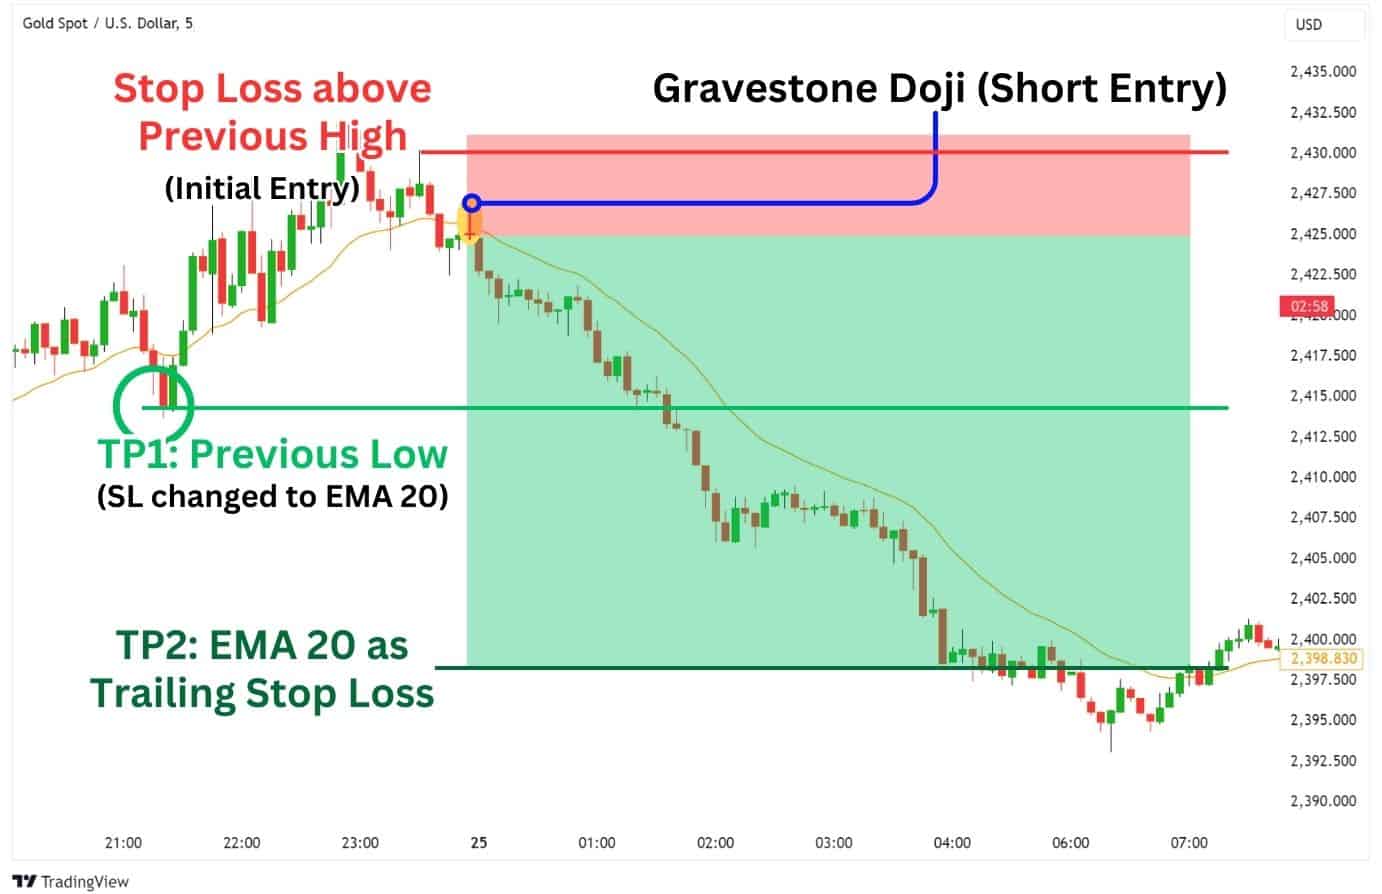
For this strategy, we will be using the exponential moving average (EMA), a type of moving average that puts more weighting on recent price changes. This makes the strategy suitable for scalping, or finding low time frame trade opportunities.
Enter a short trade when these conditions are met:
| The price is below the EMA 20 on the 5-minute chart. |
| The price taps the EMA 20 and closes a gravestone doji candle (enter here). |
For the stop loss and take profit, consider these options:
| On your initial entry, place the:Stop loss (SL) above the previous high. Take profit (TP) set at the previous low, only taking 25%-75% of profits. |
| After TP1 has been hit, change your SL and take profit to a trailing stop loss, using the EMA 20: When the price breaks and closes above the EMA 20, exit the trade. |
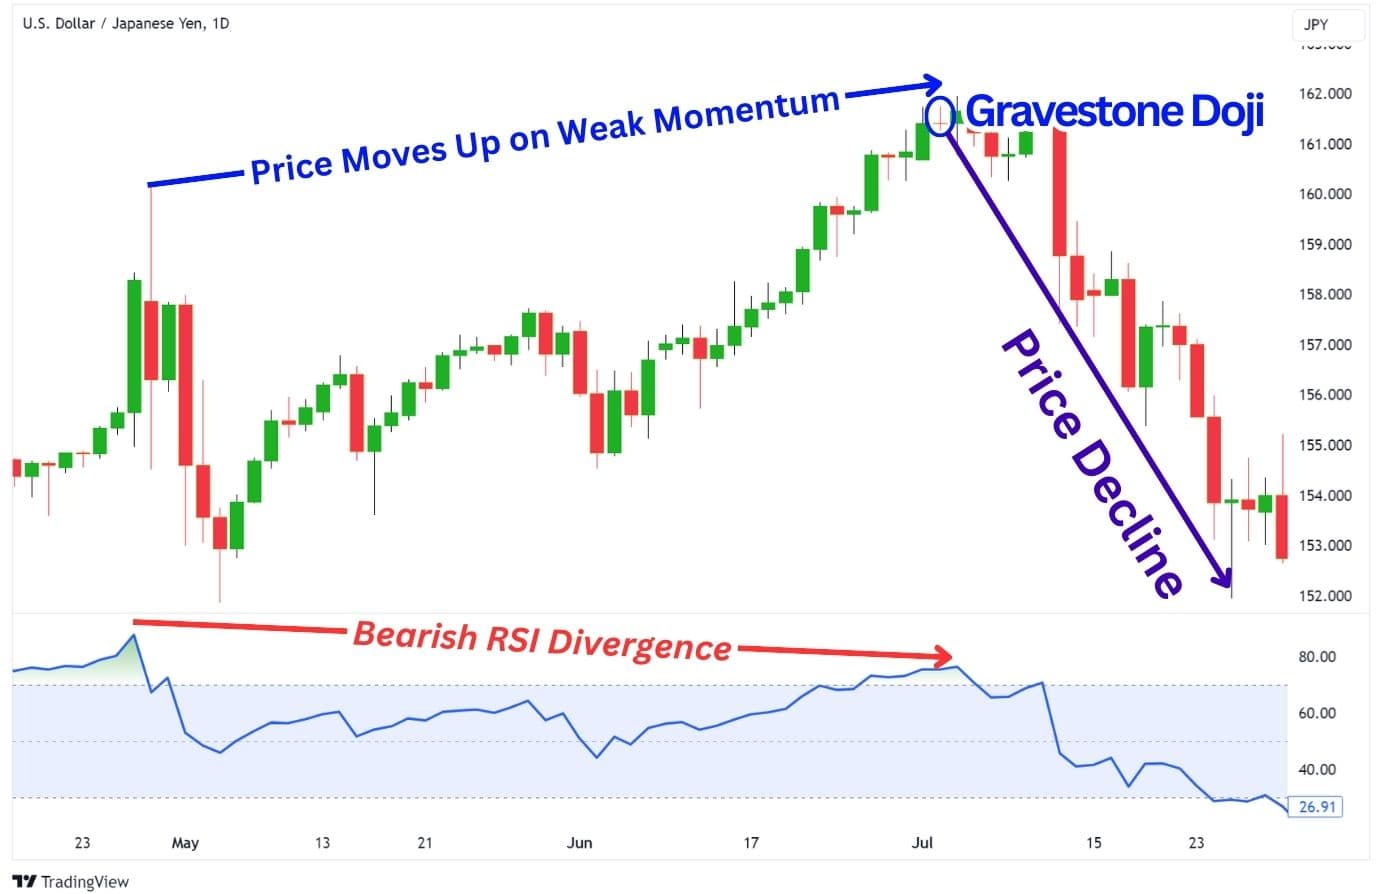
Trading the Gravestone Doji With RSI Divergences
The Relative Strength Index (RSI) is a momentum oscillator that measures the speed of price movements. When momentum slows, the RSI declines, making it useful for spotting potential reversals through divergences.
In this strategy, we’re looking for a regular bearish divergence, which is observed when the price is forming higher highs, and the RSI is forming lower highs. This signals weakening buying momentum and sets the stage for a potential bearish reversal.
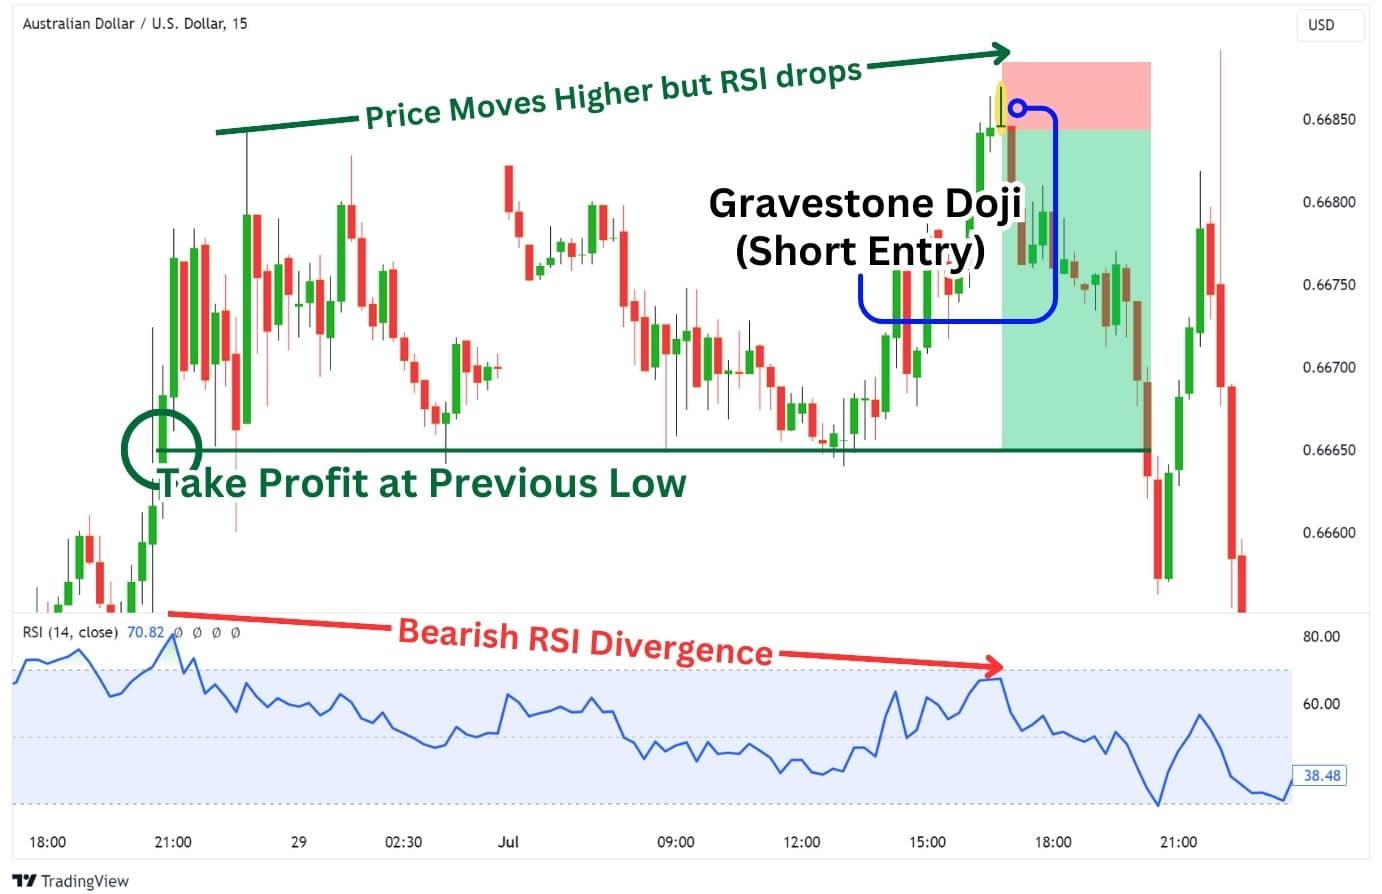
Enter a short trade when these conditions are met:
| There is a bearish RSI divergence in the chart – price is forming higher highs, but the RSI is forming lower highs, indicating slowing bullish pressure. |
| The price creates a gravestone doji candle (enter here). |
For the stop loss and take profit, consider these options:
| Stop loss (SL) placed above the gravestone doji candle. |
| Take profit (TP) placed at the previous low. |
Trading the Gravestone Doji With Fibonacci
The Fibonacci is an amazing tool that plots out hidden resistance levels to look for a long or short position, especially when in a trending market structure.
To use this tool for finding bearish trades, draw the Fibonacci retracement from the recent lower high, to the recent lower low. It’s important to look for a move that has a lower high and lower low, as it implies that a broader downtrend is in play.
From there, multiple Fibonacci retracement levels will be marked out for you – but the key levels we want to look at are the 0.382, 0.618, and 0.768 levels. These are the most popular Fibonacci levels to look for a pullback trade.
On the pullback, look for the formation and close of a gravestone doji candlestick at one of these levels. That will be your short entry.
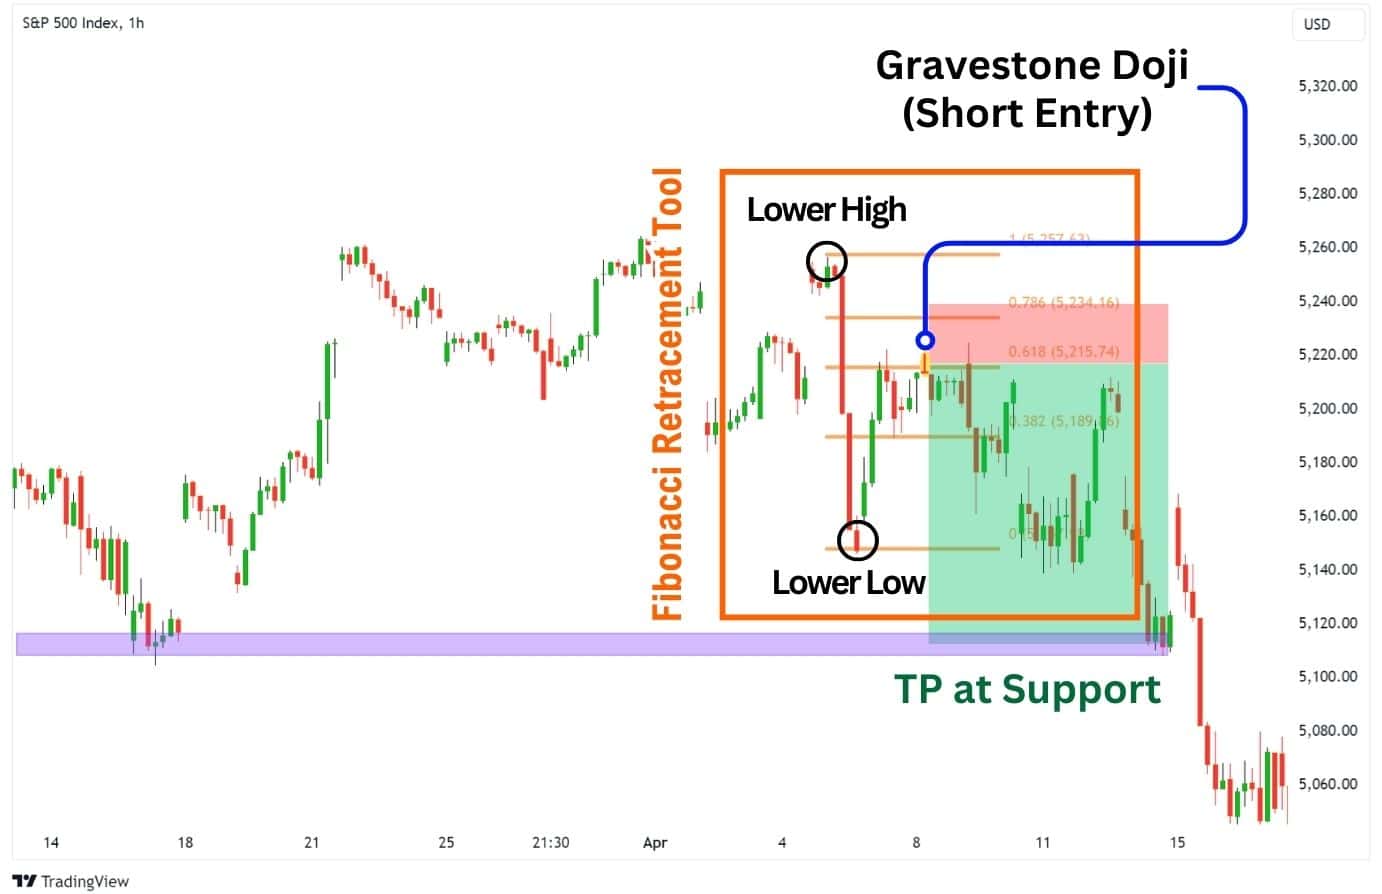
Enter a short trade when these conditions are met:
| The price has formed a gravestone doji at either the 0.382, 0.618, or 0.768 Fibonacci levels. |
| The Fibonacci retracement was drawn from the lower high, to the lower low of the recent move. |
For the stop loss and take profit, consider these options:
| Stop loss (SL) placed above the gravestone doji candle. |
| Take profit (TP) placed at the previous low, or a significant previous low. |
Trading the Gravestone Doji With Pivot Points
Pivot points, as we’ve covered prior in this article, are essentially just support/resistance levels. They are areas in the chart where price has previously reacted to, and made a reversal from. For example, if the price of – let’s say, oranges, reached $5 and then quickly shifted back lower, then $5 is a pivot point.
In this section, we’ll go over how you can identify key pivot points. These are pivot points on the Daily, Weekly, and Monthly timeframes, making them a significant price zone to watch for a potential gravestone doji short entry.
To mark out the key pivot points, use a top-down approach on your candlestick charts. Start with a monthly chart, then move down to the weekly, then the daily chart. Mark out all obvious areas where you see a sharp turn in price occur.
Once marked out, we have clearly laid out significant levels of resistance to look for a gravestone doji reaction. Then, once a gravestone doji forms, enter a short position targeting the next pivot point.
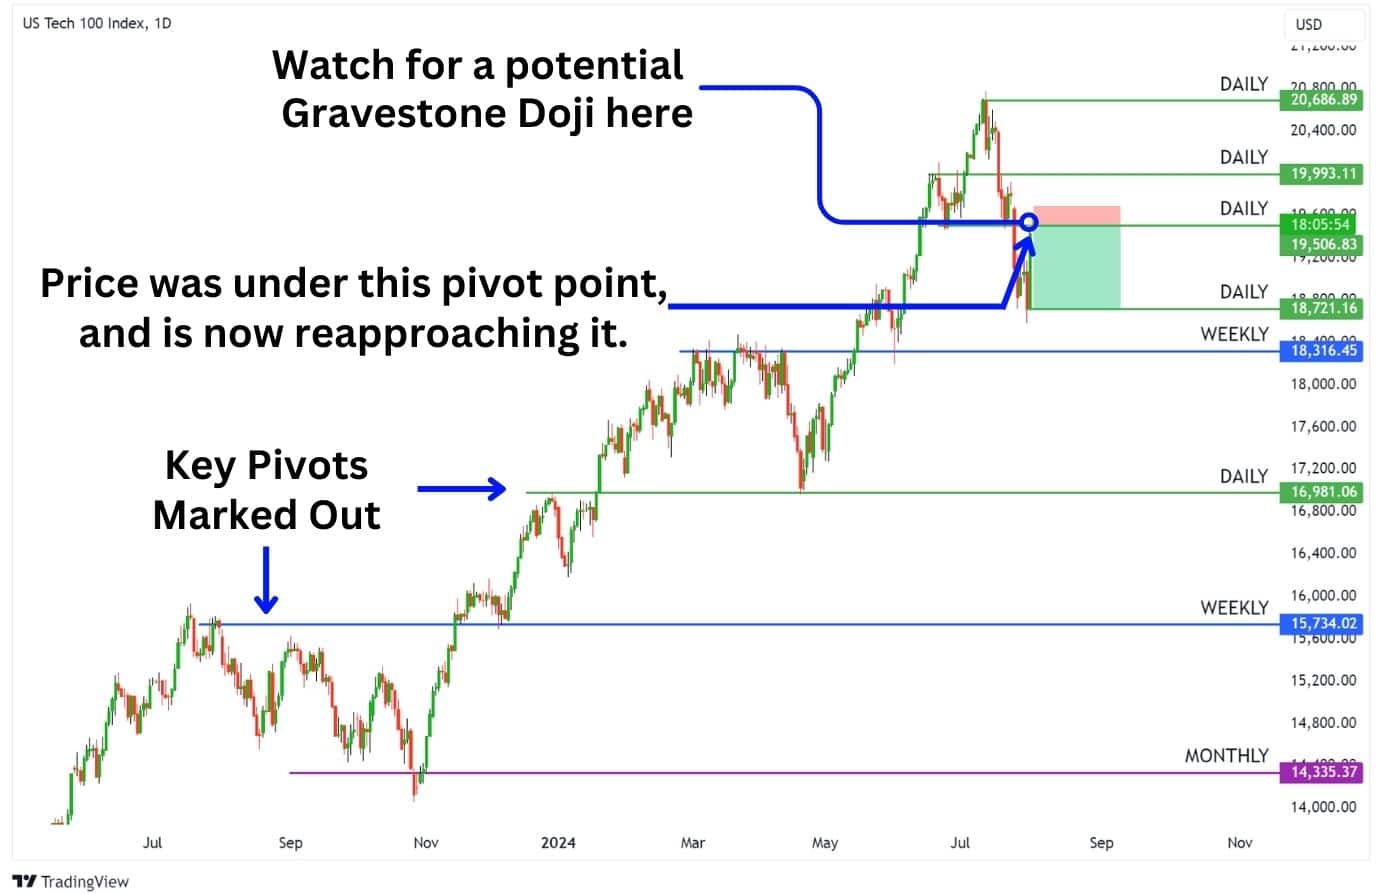
Enter a short trade when these conditions are met:
| When price rises from under a key pivot point, touches it, then creates a gravestone doji candle. |
For the stop loss and take profit, consider these options:
| Stop loss (SL) placed above the gravestone doji. |
| Take profit (TP) placed at the closest next key pivot point support. |
Advantages of Trading the Gravestone Doji Pattern
There are several advantages to trading the gravestone doji candlestick pattern:
- High Risk-to-Reward Ratio: Trading gravestone dojis from a resistance level, to the next key support level can offer a favourable risk-to-reward ratio compared to using a fixed RRR.
- Optimal Entry with Chart Patterns: When combined with chart patterns, a gravestone doji at the upper trendline can provide an ideal entry point.
- Can Capture Potential Trend Reversals: As rare as the gravestone doji pattern is, the emergence of this pattern is able to identify potential trading opportunities.
Disadvantages of Trading on the Gravestone Doji Pattern
There are several disadvantages to trading the gravestone doji candlestick pattern:
- Exceedingly Rare Pattern: The gravestone doji is not exactly a pattern you’d purposely seek out, as its formation is highly infrequent.
- Poor Consistency: When used without additional bearish signals, the gravestone doji offers only a slight edge, with a success rate of around 51% for predicting bearish outcomes.
- Wider Stop Loss Needed: To avoid premature stop-outs, set your stop loss farther above the wick high of the gravestone doji, accounting for potential false moves before a bearish reversal.
Gravestone Doji vs. Dragonfly Doji
The bearish gravestone doji typically appears when price rises to a resistance level and attempts to break it, only to fall back below. This indicates a bearish trend reversal could be in the making.
On the other hand, the dragonfly doji is a bullish reversal pattern which forms when the price falls onto a support level, only to fail in breaking it and begins to rise above.
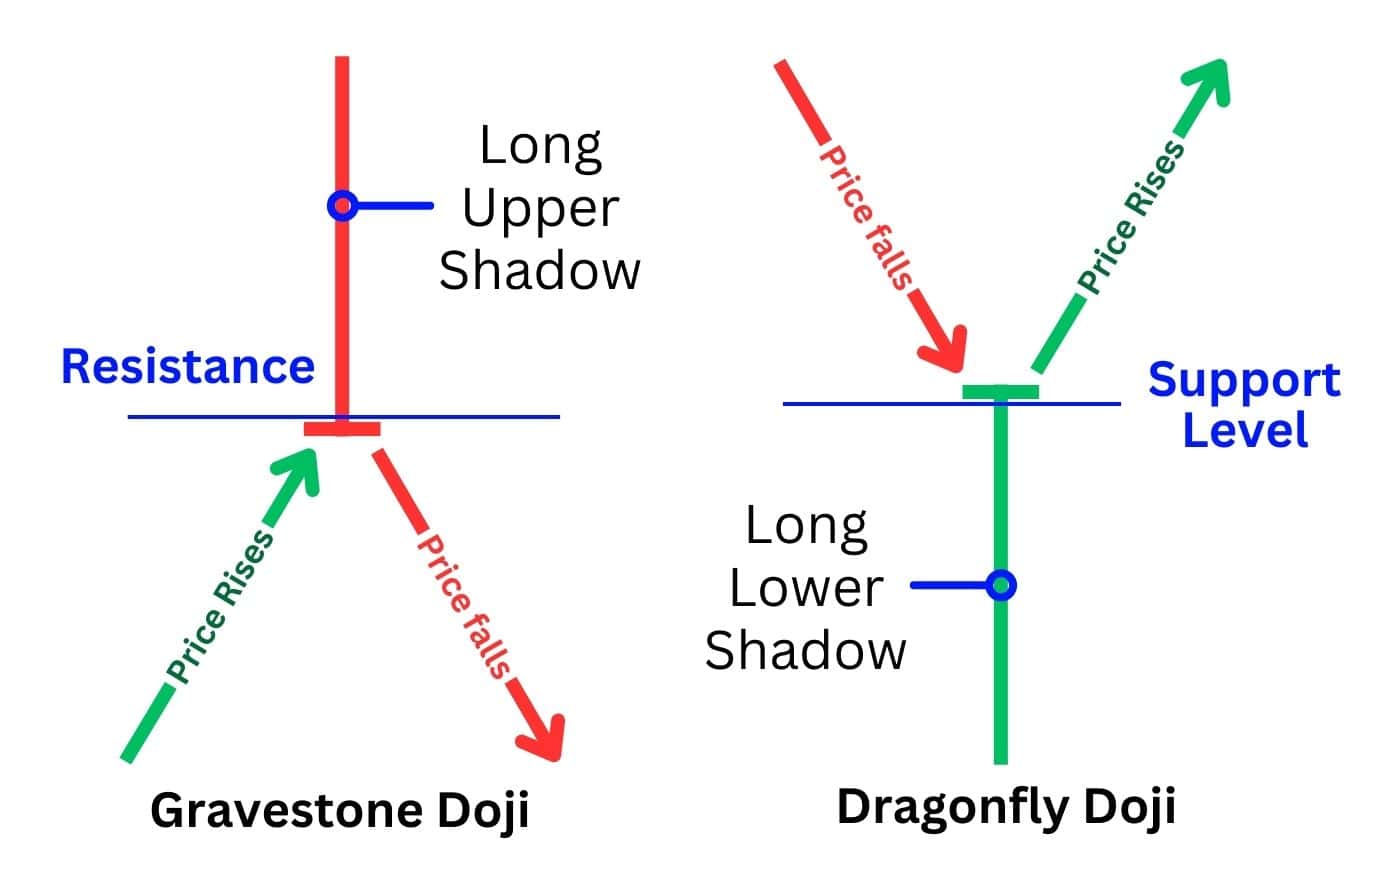
Visually, the gravestone doji pattern features a long upper shadow, whereas the dragonfly doji pattern has a long lower shadow. Both, however, share the characteristic of having a small candle body resembling a single line, appearing at the very end of the pattern.
Gravestone Doji vs. Shooting Star
The gravestone doji pattern resembles the shooting star pattern as they both feature long upper shadows and a small candle body. The tiny difference between them is that a shooting star will have what’s considered a “real body”, where the candlestick’s opening and closing price is far enough to visually draw a rectangle on the chart.
Functionally, both these bearish patterns signal a trend reversal, with the red shooting star providing a stronger bearish signal.
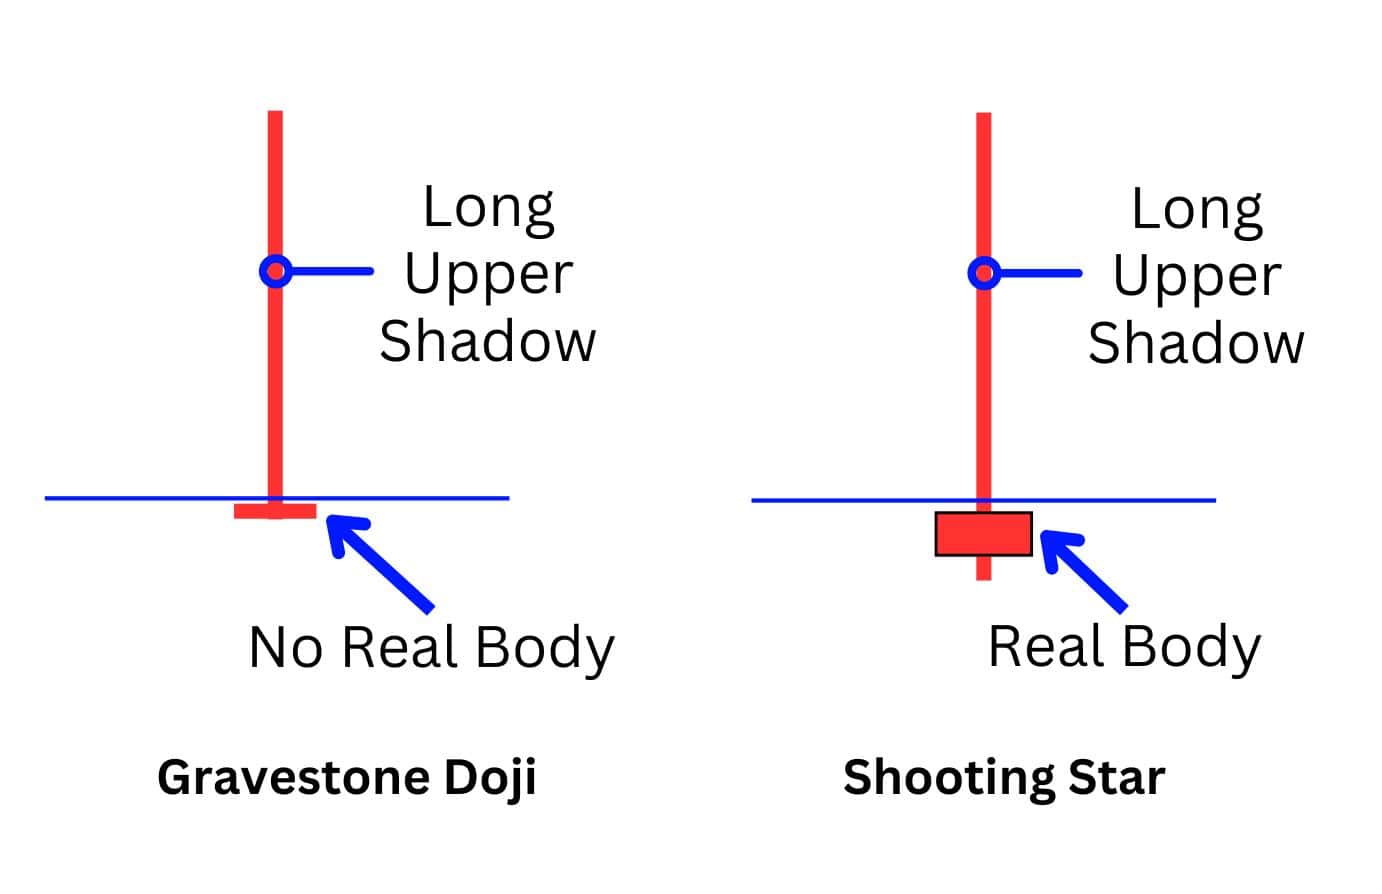
A lower shadow can be present for both of these patterns as well, but it’s less strict for the shooting star pattern. The gravestone doji on the other hand should have little to no lower shadow at all.
Gravestone Doji vs. Long-Legged Doji
The gravestone doji and long-legged dojis are visually distinct doji candlestick patterns, and both of them paint a different story in the charts.
While the gravestone doji only has a long upper shadow, the long-legged doji features an equally long upper shadow and lower shadow. This candlestick pattern signals there was a fierce battle between the bulls and bears within the candlestick’s formation, eventually returning to neutral grounds where neither bulls or bears have the upper hand.
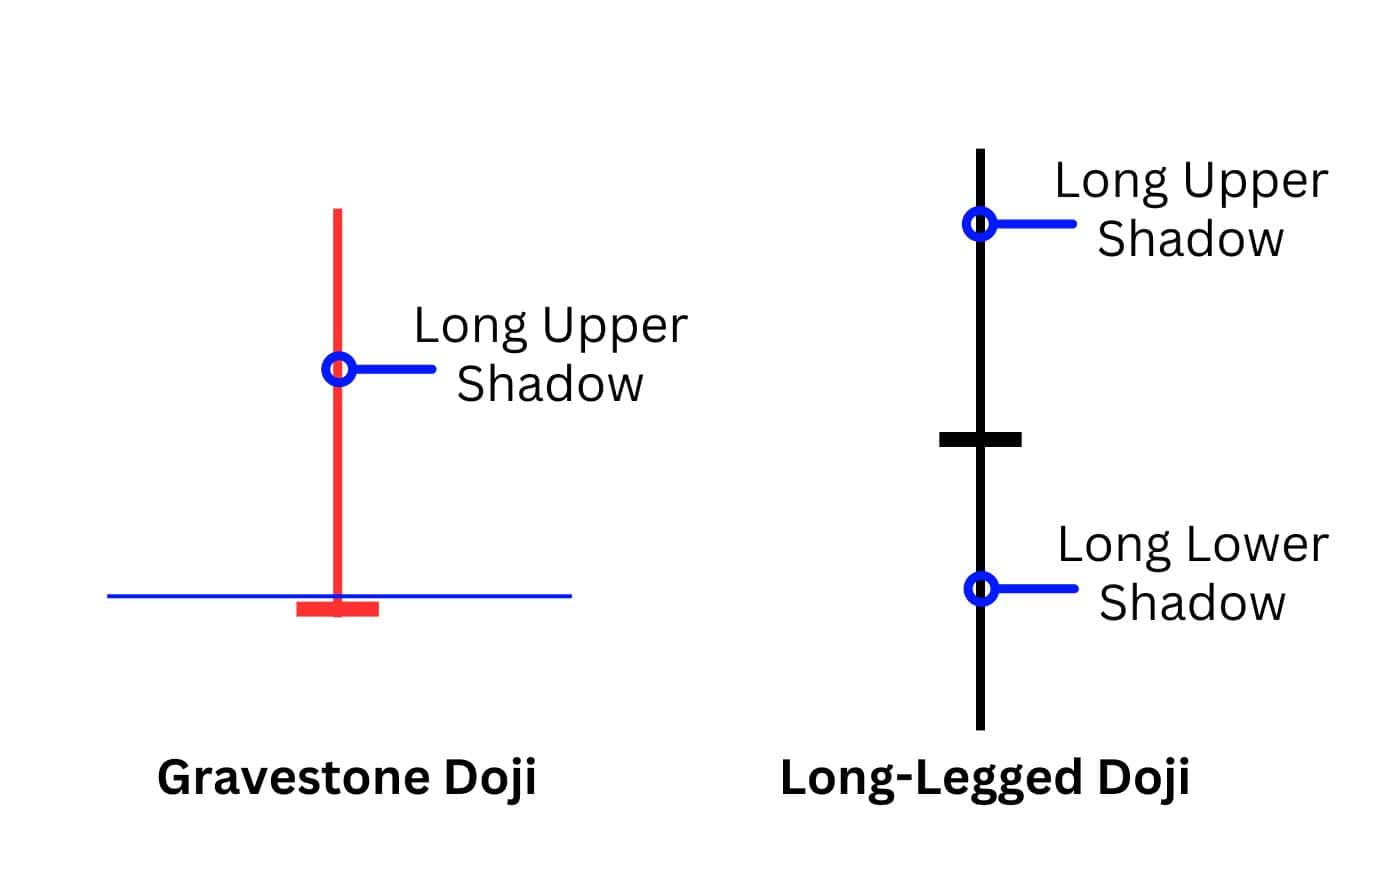
Unlike the gravestone doji, the long-legged doji can appear at the support or resistance level, indicating indecision in the markets. This pattern requires the subsequent price movement to confirm the direction of the next emerging trend.
Gravestone Doji vs Pin Bar
The gravestone doji is one amongst many pin bar candlestick patterns. Pin bar patterns are candlestick patterns used in technical analysis to anticipate a trend reversal. Visually, all pin bars have a small candle body with extremely close opening and closing prices. Secondly, they have a long buying or selling tail. The gravestone doji belongs in the bearish pin bar category, as it has a long upper shadow (selling tail).
What Momentum Indicator Works with Gravestone Doji Candlestick?
Momentum indicators can detect divergences, which signal weakness in the movement of price. These divergences can add conviction to our idea for a short trade using the gravestone doji.
For example, if a gravestone doji forms while there is a bearish divergence, this suggests that even though price is moving up, the buying momentum is weak and the trend can be reversed at any moment.
Some of the momentum indicators we recommend are:
- RSI (Relative Strength Index)
- MACD (Moving Average Convergence Divergence)
- Stochastic Oscillator
Gravestone Doji Candlestick with RSI
The relative strength index shows the rate at which the price is changing. If the RSI is moving lower as the price is creeping higher, that means the move up is likely not facilitated by strong buying pressure. This is called a regular bearish RSI divergence, and it gives bears the perfect environment to reverse the price from a more advantageous position.
Gravestone Doji Candlestick with MACD
The MACD is a little slower than the RSI in signalling a divergence, but it can also be utilised in the same way. It can be done by observing the MACD Line (blue line) forming a lower high, while the price forms a higher high. The MACD histogram bars, which resemble waves, can also be used in such a manner.
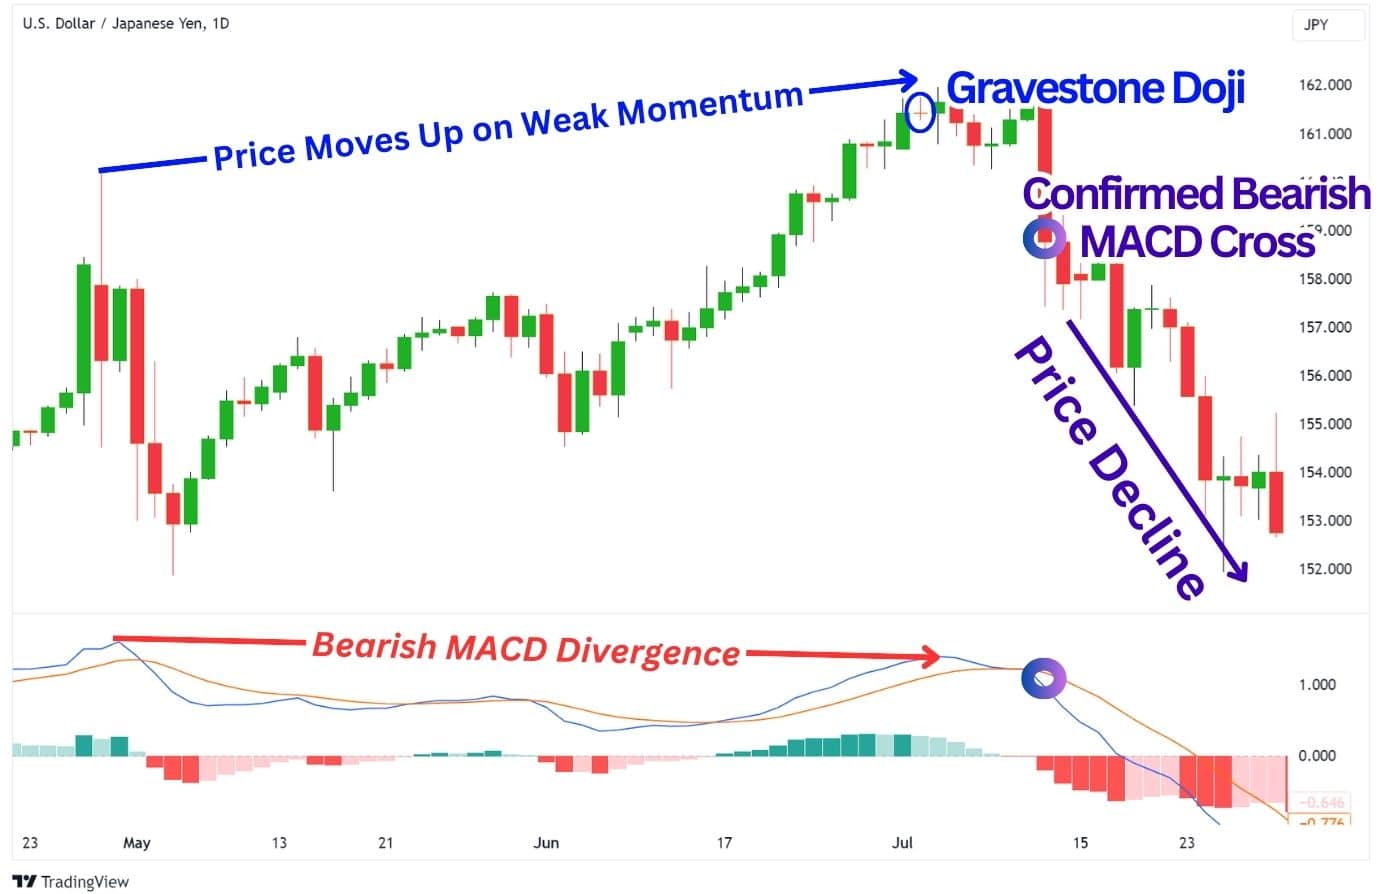
Additionally, you can also use the bearish MACD Cross to confirm the start of a bearish move. This methodology can find you extra short trade opportunities with the gravestone doji without the need for a momentum divergence. However, it is a lagged confirmation, which will net a lower risk-to-reward.
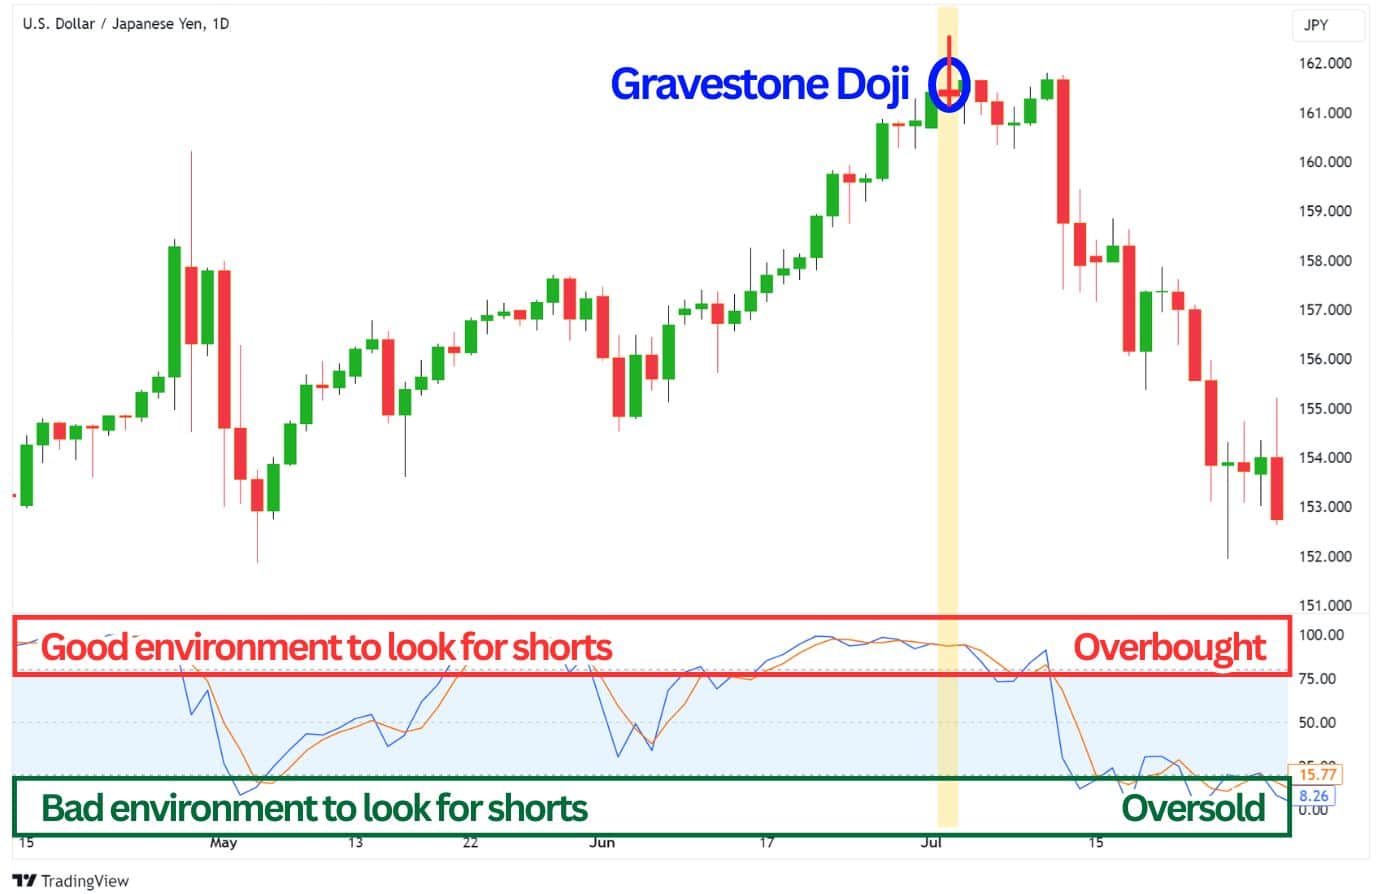
Gravestone Doji Candlestick with Stochastic Oscillator
The stochastic oscillator is not particularly useful for identifying divergences but excels at indicating overbought and oversold conditions. When the stochastic reading exceeds 80, it suggests that the asset is overbought and potentially overvalued in the short term. By using this indicator as a filter, traders can decide whether to enter a short position based on the stochastic level when the gravestone doji formed.
Conversely, whenever the stochastics are not overbought, traders will know to ignore any signals from the gravestone doji. This is important because the gravestone doji is prone to giving false signals – we need every bit of confirmation that we can get for consistency in trading this bearish pattern.
FAQ
What are common gravestone doji pattern trading mistakes?
Here are a few mistakes to avoid:
- Trading the gravestone doji signal without other bearish indications: Given its roughly 50/50 reliability, the gravestone doji requires additional confirmations for consistent trading.
- Not observing the price level at which the gravestone doji formed: It should be at the highs of an uptrend, or at a significant resistance level to be considered a valid short signal.
- Ignoring the Broader Market Trend: The gravestone doji is best traded in the context of a broader downtrend; this improves the probability of a bearish reversal after the candle formation.
What is the best chart time frame to use for the gravestone doji pattern?
Generally speaking, the larger the timeframe, the more significant the candlestick formation will be. However, it is still risky to trade the gravestone doji based on the candle’s formation alone due to its 50/50 nature to reverse or continue.
Regardless of timeframe, it’s simply more effective to trade the gravestone doji when there are other bearish confluences lined up – the most important being the overall market trend.
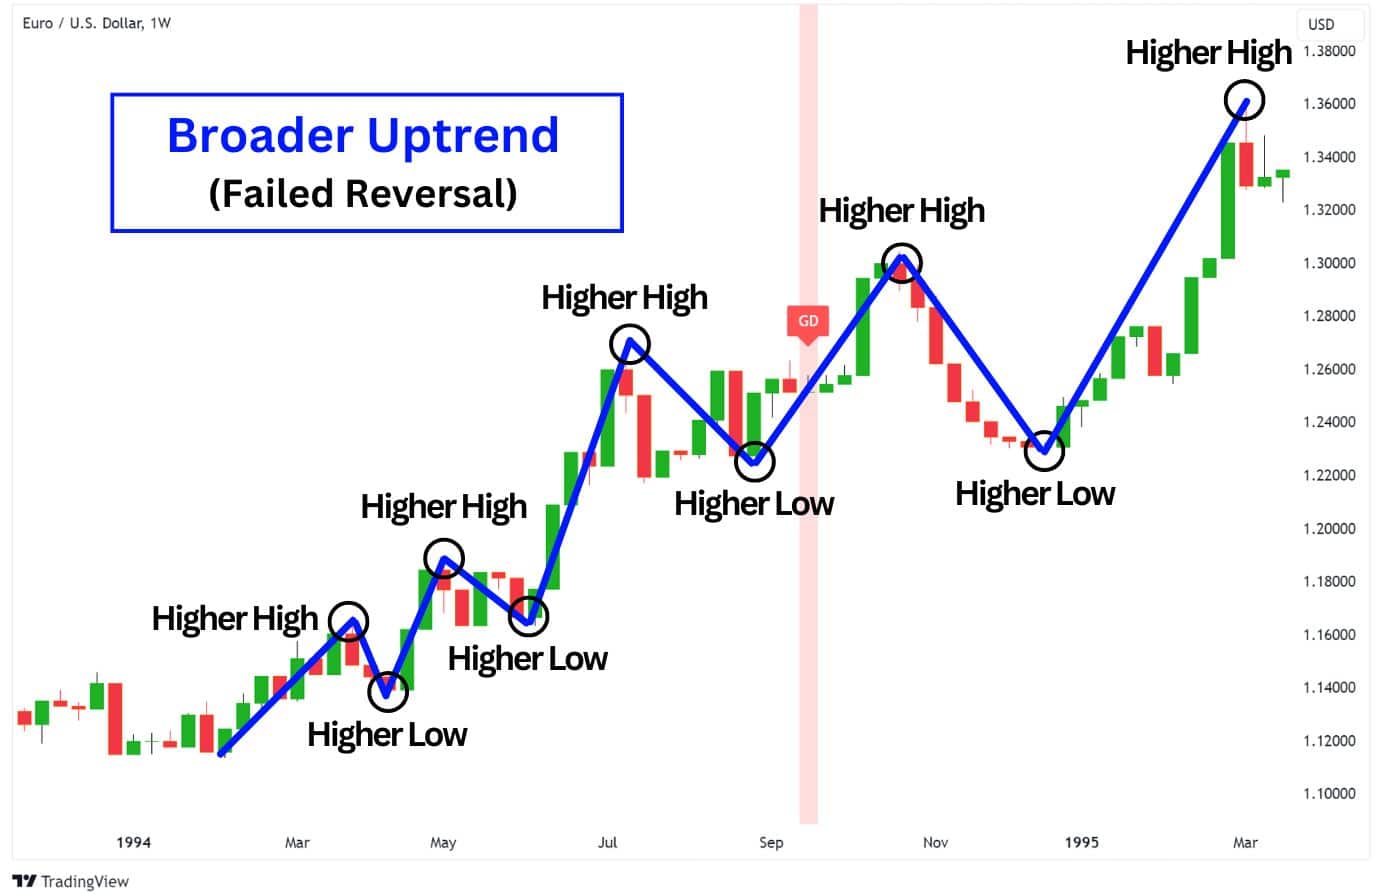
Consider this example below – as significant as the weekly gravestone doji candle was, it provided a false signal for reversal on EURUSD because the asset was in an overall uptrend.
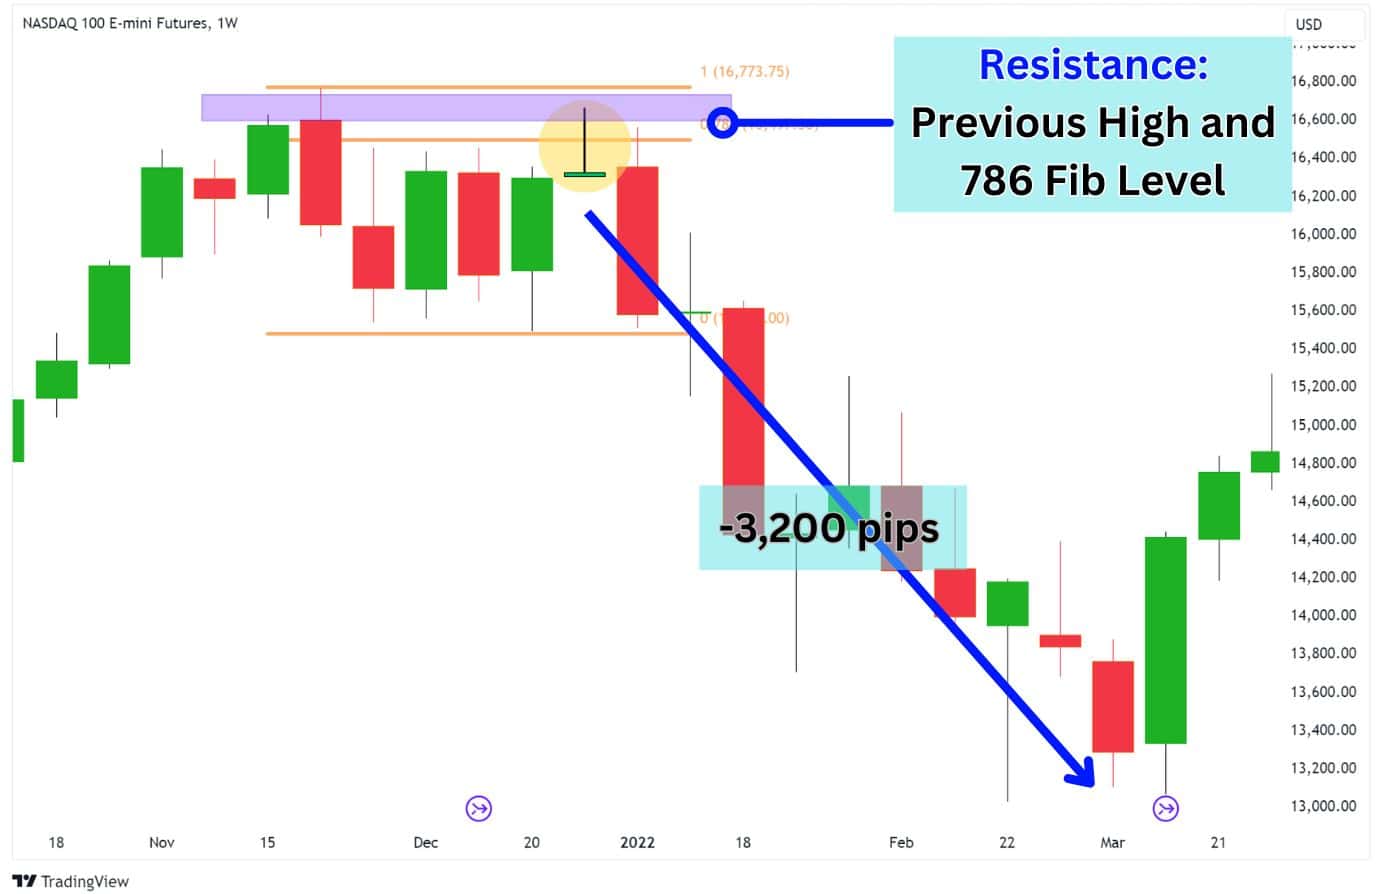
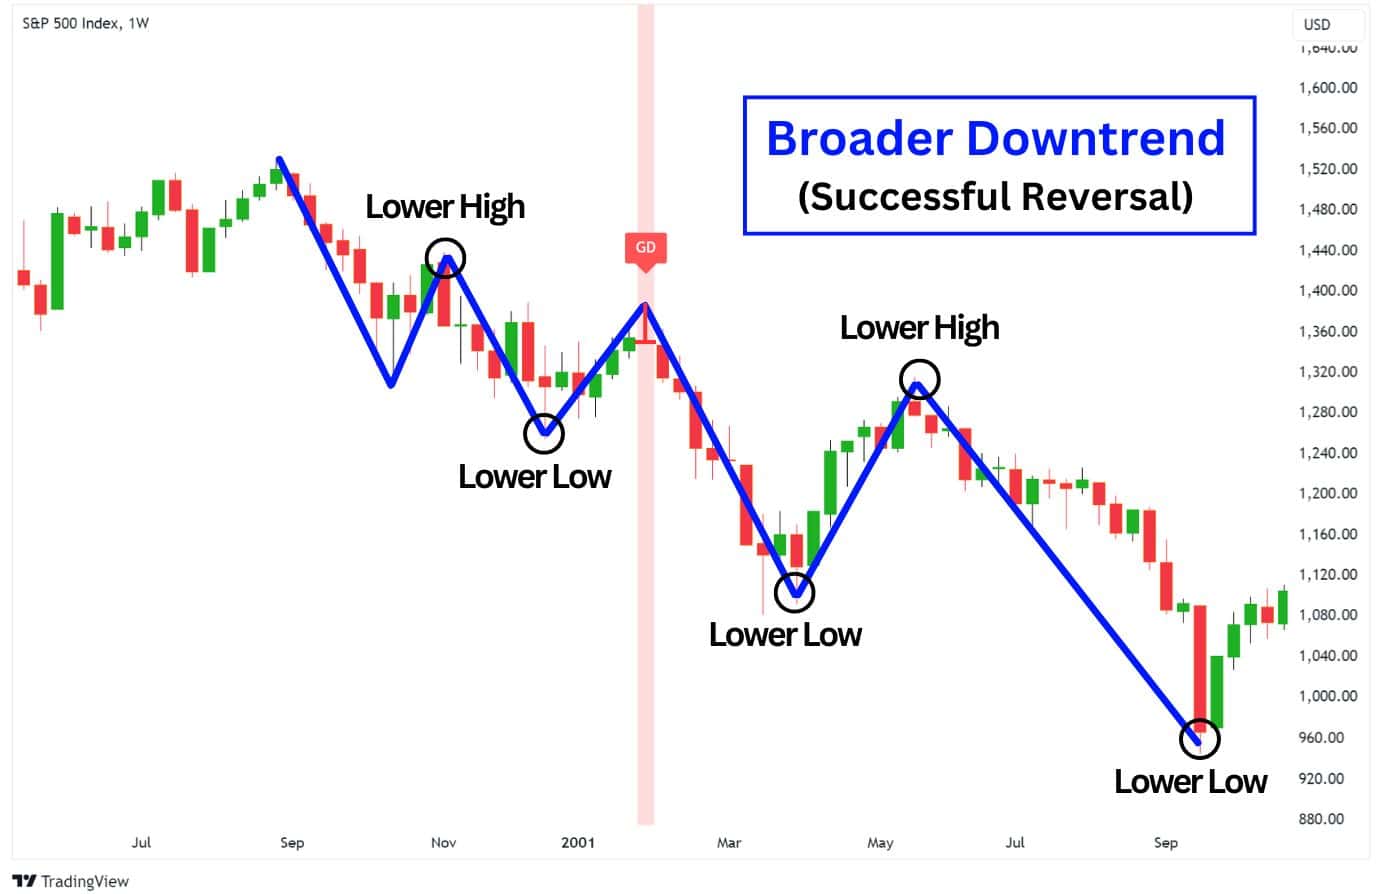
Conversely, when we observe an overall downtrending asset, the weekly gravestone doji played out perfectly. On this 1W chart on S&P 500, the gravestone doji candle perfectly signalled the short term reversal on the pullback.
In short, the specific time frame used to trade the gravestone doji pattern is less significant than other factors. The most important aspects to consider include the overall market trend, key resistance levels, and the specific location where the candlestick pattern forms. These surrounding factors will provide crucial context for interpreting the pattern and making sound trading decisions.
What are other types of doji candlestick patterns besides gravestone doji?
Besides the gravestone doji, there are the following doji patterns:
- Dragonfly Doji – A bullish reversal pattern with a long lower shadow.
- Star Doji – A neutral candlestick that signals indecision, and also a slight chance for a reversal.
- Long-Legged Doji – A neutral candlestick that signals indecision and high volatility in the market.
- 4 Price Doji – A doji candlestick with no vertical line, implying that the price stayed completely flat.
Who first identified the gravestone doji Pattern?
The gravestone doji pattern, like many other candlestick patterns, is a part of Japanese technical analysis traditions. It doesn’t have a specific individual credited with its discovery.
The pattern was developed and refined by Japanese rice traders over centuries, then later brought into broader recognition in the West by analysts like Steve Nison, the author of the book: “Japanese Candlesticks Charting Techniques” (2001).
How reliable is the gravestone doji pattern?
According to legendary technical analyst Thomas Bulkowski, the gravestone doji pattern is not very reliable as it only has a 51% chance to properly signal a reversal. It requires additional confluences from other technical indicators to be traded with consistency.
Is a gravestone doji bullish or bearish?
The gravestone doji is a bearish reversal candlestick found on a Japanese candlestick chart, typically at the highs or at resistance. It signals indecision, and a slight possibility for a bearish downturn.
What does a long-legged doji mean?
The long-legged doji is a neutral candlestick pattern characterised by long upper and lower shadows with a small real body positioned near the centre of the candlestick’s range. This pattern suggests that buyers and sellers were equally strong during the trading period, with significant price movements in both directions, but neither side managed to dominate by the close.
Where is a gravestone doji most effective?
A gravestone doji is most effective when it forms at a resistance level or when other technical indicators suggest bearish conditions. It is particularly significant when it appears during a broader downtrend, indicating that sellers are in control and likely to push prices lower.


