Bearish
- August 10, 2024
- 21 min read
Three Black Crows Pattern: Key Characteristics and Strategies
What is the Three Black Crows Candlestick Pattern?
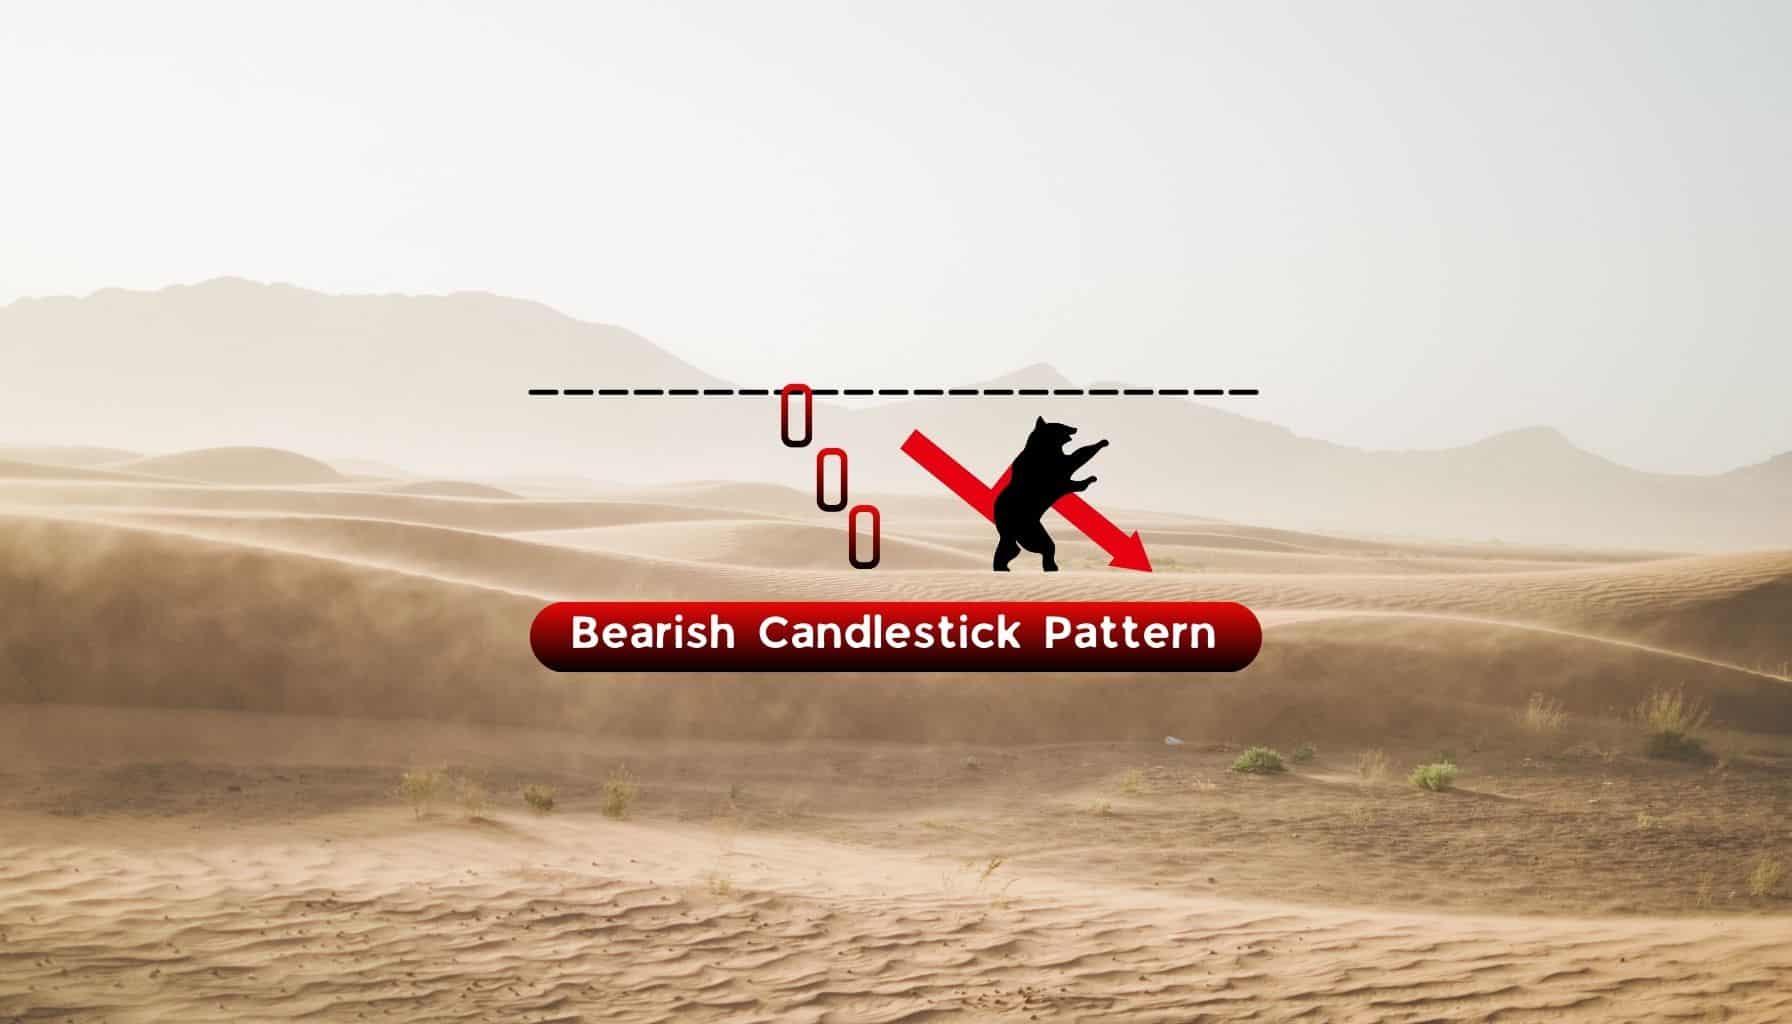
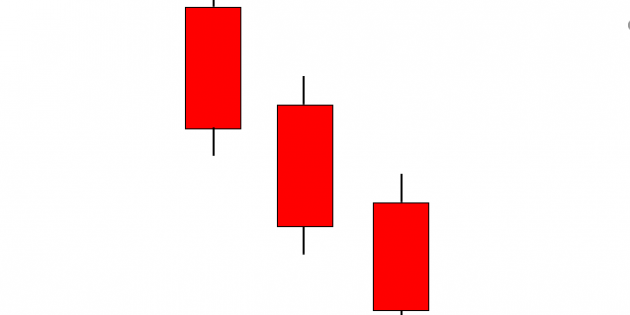
The Three Black Crows is a bearish candlestick pattern that signals a potential reversal of the current uptrend. This pattern is characterized by three consecutive long-bodied bearish candlesticks that close progressively lower. This consistent decline in price reflects increasing selling pressure and profit-taking, potentially ending the trend’s upward momentum.
What Does the Three Black Crows Tell You?
The Three Black Crows pattern shows that sellers are gaining power over buyers, diminishing the bullish momentum of the ongoing uptrend and creating a strong bearish sentiment toward a possible trend reversal. It may also be interpreted as market participants considering the previous upward move as “too high” and having approached the uptrend’s price ceiling. Thus, selling pressure has overwhelmed buyers as many traders take profit and open a short position.
How to Identify the Three Black Crows?
Whether in the standard daily chart or in another timeframe of your preference, the Three Black Crows is one of the easiest candlestick patterns to spot in a chart. Essentially, it’s just three successive bearish candles (in the color red or black, depending on your chart settings) that close at a lower price each time. However, note that this candlestick pattern must appear during an ongoing uptrend to be considered a bearish reversal pattern. Hence, you should ignore if this pattern occurs in either a downtrend or a sideways (consolidation) market period, as it does not serve as a bearish reversal signal.
Key Characteristics of Three Black Crows Pattern
The following are the key characteristics of a Three Black Crows pattern:
- The pattern must have three consecutive bearish candlesticks (in three consecutive trading sessions).
- The candlestick pattern must occur during an uptrend (or at the end of it if the pattern has been successful as a reversal signal).
- The first candle must be relatively long-bodied, closing below the previous candle’s last price.
- The second and third candles must also be relatively long-bodied and have a lower high and lower low than the previous candle.
- All three candles must open below the opening price of the previous candle.
- All three candles preferably have relatively small or no wicks.
Importance of Three Black Crows Pattern
One of the most significant purposes of black crows candlestick pattern is to point out a major shift in market sentiment. Being an easy-to-spot pattern, seeing it develop in an uptrend signifies that the trend’s bullish sentiment is diminishing and is now transitioning toward a potentially strong bearish sentiment—indicating an upcoming downtrend. However, relying on the black crows pattern exclusively can be limiting, as it is important to consider other chart patterns and technical indicators for confirmation and interpretation.
Hence, supported by external confirmation, this allows a broad base of market participants, including long-term investors, to exit their long positions and traders to potentially take up short positions.
Three Black Crows Candlestick example
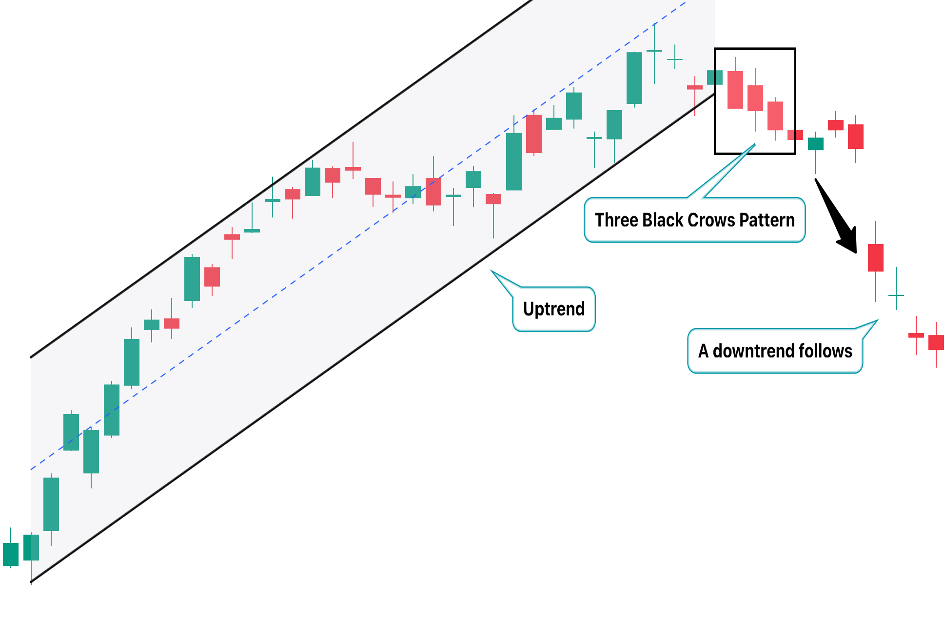
Here is an example of using a Three Black Crows candlestick pattern in an actual market. As shown, a strong uptrend was established beforehand. Afterward, three bearish, long-bodied candlesticks occurred, signifying the uptrend’s demise. We can then observe that this pattern successfully served as a bearish reversal pattern, as an eventual downtrend followed suit.
Three Black Crows Trading Strategies
Here are different ways to utilize the Three Black Crows pattern in an actionable trading strategy:
Three Black Crows with Moving Averages
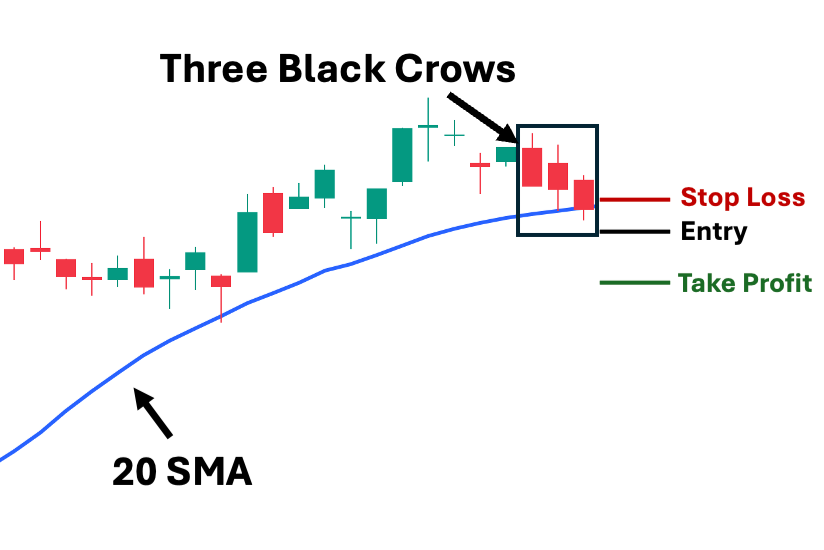
First, one of the most common technical indicators you can use with the three black crows pattern is the moving average (MA), either a simple moving average or exponential moving average. The moving average can serve as your entry and a dynamic trail stop level.
- Suggested Entry: A few ticks below the third candle’s low. It must also be below your chosen MA.
- Take Profit (TP) Area: Set your first TP a few ticks above the nearest structural resistance area. Then, use an MA (preferably short-term, such as MA 20 or EMA 20) as a trailing stop moving forward.
- Stop Loss (SL) Level: A few ticks above the your chosen MA
- Risk-Reward Ratio: We recommend not taking trades with a risk/reward ratio lower than 1:1. The higher the potential reward compared to risk, the better.
Note: Do not manipulate your stop loss or target price to achieve a higher risk/reward ratio and justify the trade. Adjusting your stop loss closer may kick you out of the trade due to normal volatility, and adjusting your target price further can set an unrealistic price goal. Hence, both your TP and SL must be rooted in an objective evaluation, such as market structure.
Three Black Crows with MACD
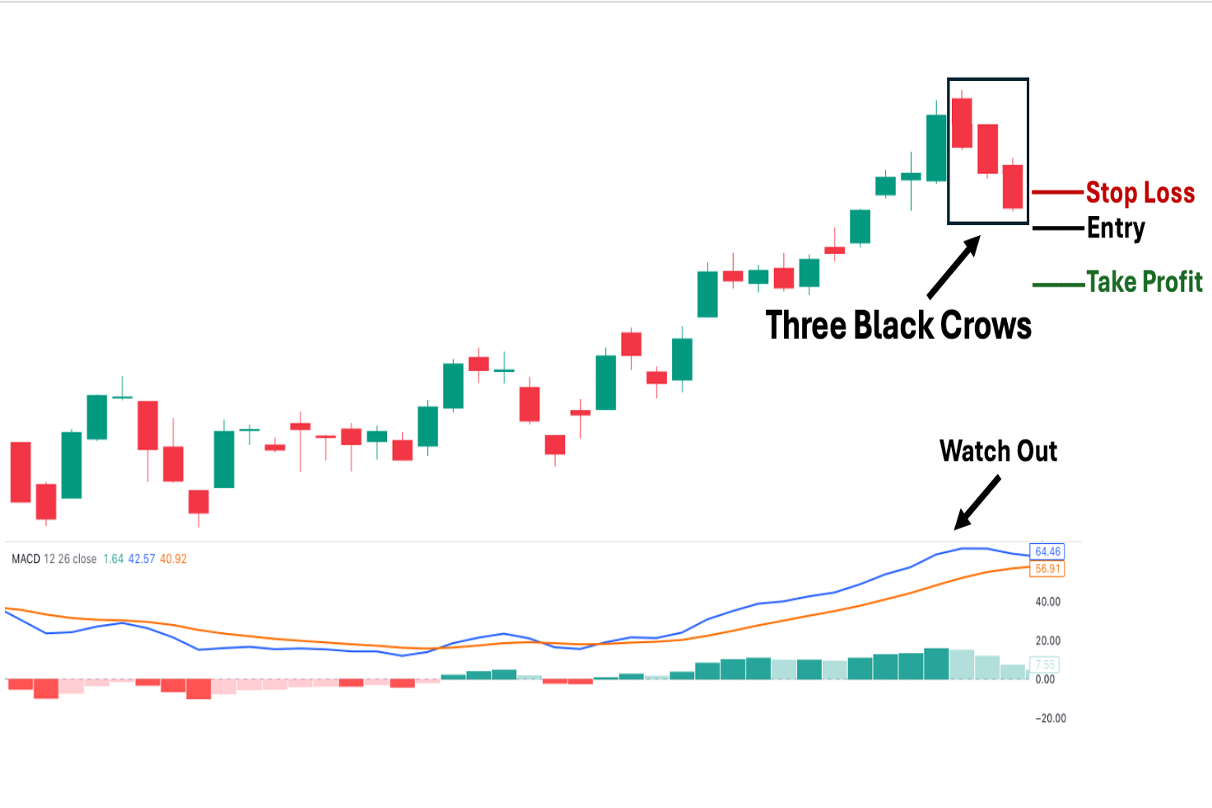
One of the most prominent technical indicators, the Moving Average Convergence Divergence (MACD), can be used with the three black crows pattern to signal possible shifts in market sentiment. As shown, the blue line is below the orange line, which—similar to the pattern’s meaning—signals a bearish trend in momentum. Hence, the MACD can serve as a dynamic take-profit area after you reach your first TP (which we suggest be set at the nearest structural resistance area).
- Suggested Entry: A few ticks below the low of the third candle
- Take Profit (TP) Area: Set your first TP a few ticks above the nearest structural resistance area. Then, use the MACD as a trailing stop (consider selling the rest when the blue line crosses the orange line).
- Stop Loss Level: A few ticks above the third candle’s closing price
- Risk-Reward Ratio: We recommend not taking trades with a risk/reward ratio lower than 1:1. The higher the potential reward compared to risk, the better.
Three Black Crows with Relative Strength Index (RSI)
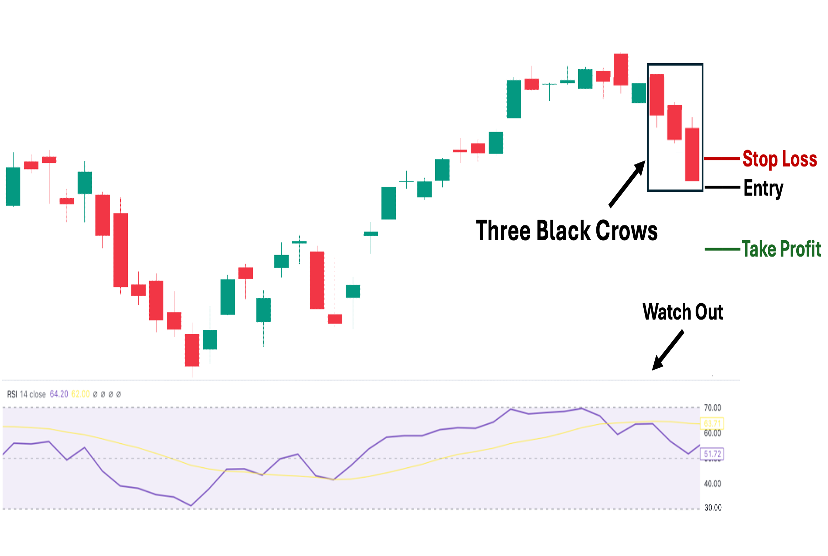
When trading black crows candlestick patterns, you can use the Relative Strength Index (RSI) to signal possible shifts in market sentiment and as a divergence tool to identify your next TP area after reaching your first TP.
- Suggested Entry: A few ticks below the third candle’s low
- Take Profit (TP) Area: Set your first TP a few ticks above the nearest structural support area. Then, use the RSI as a trailing stop by selling when it diverges from the price action (the price is going down, but RSI is already pointing up). Hence, RSI, in this case, is used as a leading indicator rather than a mere tool for confirmation.
- Stop Loss Level: A few ticks above the third candle’s closing price
- Risk-Reward Ratio: We recommend not taking trades with a risk/reward ratio lower than 1:1. The higher the potential reward compared to risk, the better.
Three Black Crows with Bollinger Bands®
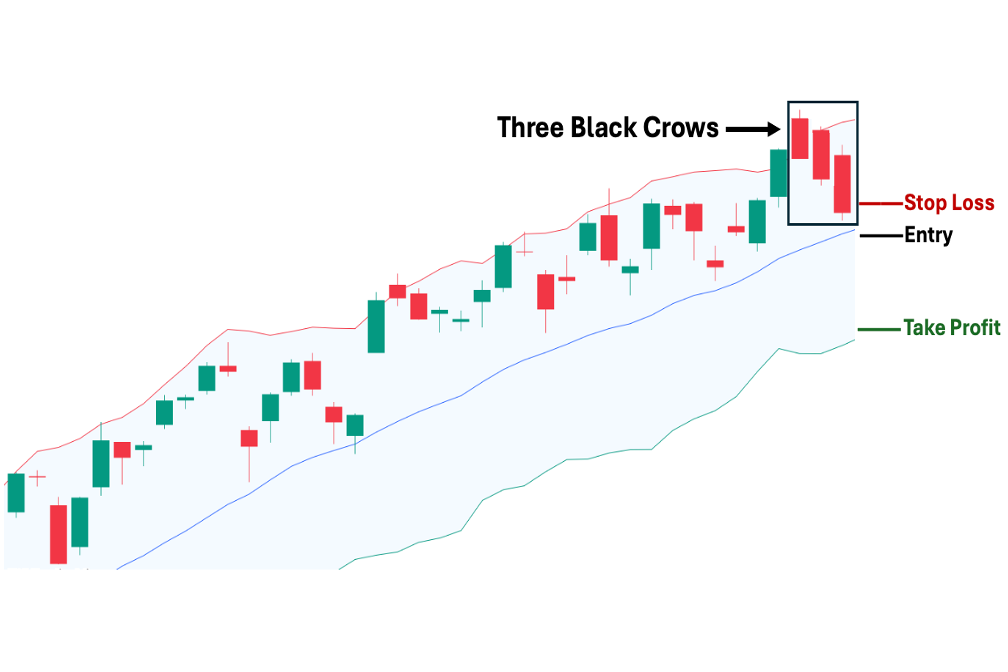
The Bollinger Bands middle band can indicate the general direction of the trend. Therefore, it is useful to incorporate with the three black crows pattern.
If price action is above the middle band, it suggests an uptrend. If price action is below, it indicates a downtrend. Hence, the middle band can act as a dynamic support or resistance level. As shown, the price action has been above the middle band for the duration of the uptrend. However, it is now hovering around the close of the pattern’s third candle.
- Suggested Entry: A few ticks below the third candle’s low. Also, it must be under the Middle (blue) band.
- Take Profit (TP) Area: A few ticks above the nearest structural resistance area.
- Stop Loss Level: A few ticks above the Middle (Blue) band. This is because breaking it signifies a possible return of the uptrend’s bullish momentum.
- Risk-Reward Ratio: We recommend not taking trades with a risk/reward ratio lower than 1:1. The higher the potential reward compared to risk, the better.
Three Black Crows with Fibonacci Retracement Levels
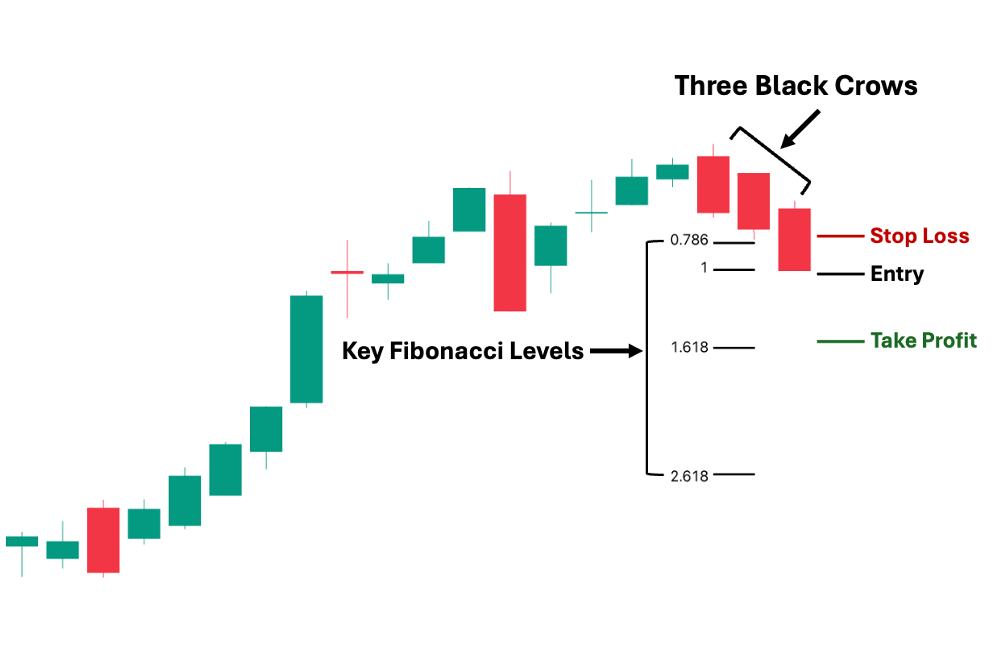
The three black crows pattern and the Fibonacci retracement (Fib) work well together. The Fibonacci retracement provides key levels where the price may likely ‘retrace’ or pull back before continuing its move. Additionally, we can use Fib to extrapolate possible resistance levels along the way. Hence, we can identify both our potential SL and TP areas.
- Suggested Entry: A few ticks below the third candle’s low
- Take Profit (TP) Area: Set your first TP a few ticks above the nearest Fib resistance at 1.618 and your potentially second TP a few ticks above the 2.618 resistance level.
- Stop Loss Level: A few ticks above the Fib’s 0.786 level.
- Risk-Reward Ratio: We recommend not taking trades with a risk/reward ratio lower than 1:1. The higher the potential reward compared to risk, the better.
Three Black Crows with Stochastic Oscillator
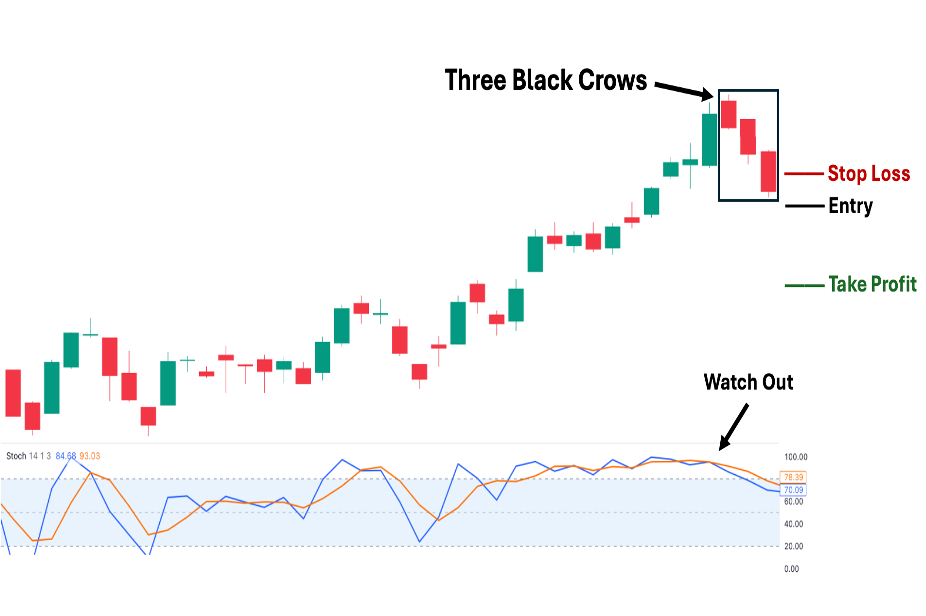
Similar to the MACD, when the orange line is above the blue line in the Stochastic oscillator (STS), it signifies ongoing bearish momentum. Therefore, when the three black crows pattern appears as Stochastics is turning lower, then you have a confirmed reversal. Also, the Stochastic oscillator can serve as a dynamic take-profit area after you reach your first TP, which we suggest setting at the nearest structural resistance area.
- Suggested Entry: A few ticks below the third candle’s low
- Take Profit (TP) Area: Set your first TP a few ticks above the nearest structural resistance area. Then, use the STS as a trailing stop (consider closing the rest of the position when the blue line crosses above the orange line).
- Stop Loss Level: A few ticks above the third candle’s closing price
- Risk-Reward Ratio: We recommend not taking trades with a risk/reward ratio lower than 1:1. The higher the potential reward compared to risk, the better.
Three Black Crows with Volume Oscillator
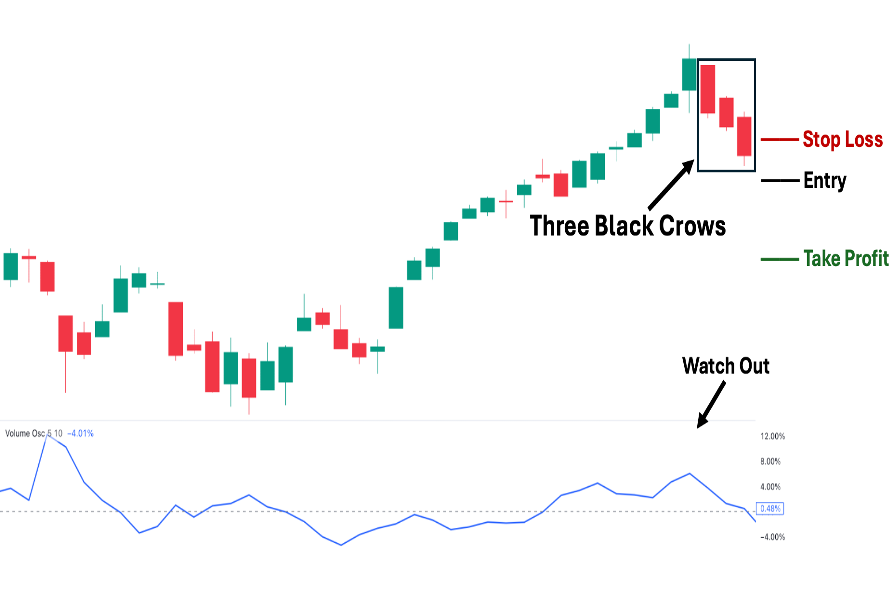
The Volume Oscillator reveals the volume dynamics of an asset. For instance, we can see that the volume has been increasing as the uptrend creates new highs, making a noticeable peak at the end of the uptrend. Then, the volume dwindles continuously, indicating a potential trend reversal. This happens as the Three Black Crows pattern forms.
- Suggested Entry: A few ticks below the third candle’s low
- Take Profit (TP) Area: Set your first TP a few ticks above the nearest structural resistance area. Then, watch for volume breaking the dotted midpoint into the upper half, as this can indicate a possible momentum shift. When this happens, consider offloading your entire position.
- Stop Loss Level: A few ticks above the third candle’s closing price
- Risk-Reward Ratio: We recommend not taking trades with a risk/reward ratio lower than 1:1. The higher the potential reward compared to risk, the better.
Three Black Crows with Pivot Points
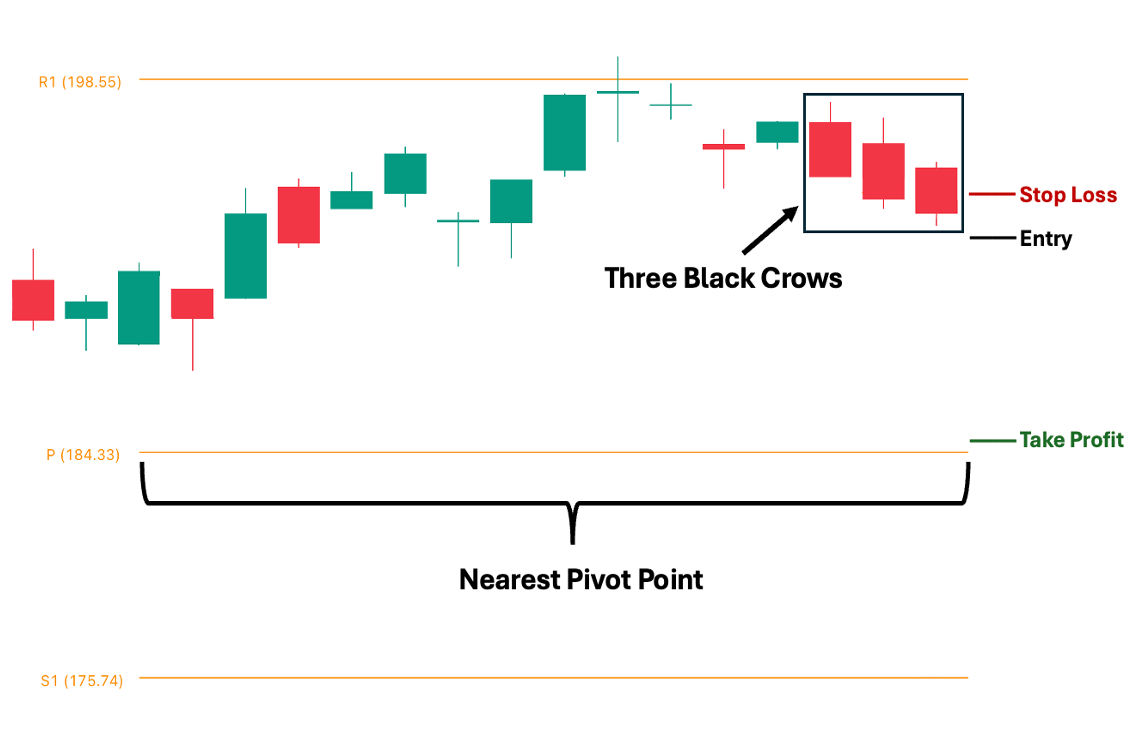
Compared with other technical indicators, pivot points are automated calculations of support and resistance levels based on the highs, lows, and closing prices of recent candles. You can use pivot points as objective areas to set your key levels.
- Suggested Entry: A few ticks below the third candle’s low
- Take Profit (TP) Area: You can set your first TP just a few ticks above the nearest pivot area, which is at P (value).
- Stop Loss Level: A few ticks above the third candle’s closing price, or resistance pivot level if nearby.
- Risk-Reward Ratio: We recommend not taking trades with a risk/reward ratio lower than 1:1. The higher the potential reward compared to risk, the better.
Trading The Three Black Crows Based on Support and Resistance Levels
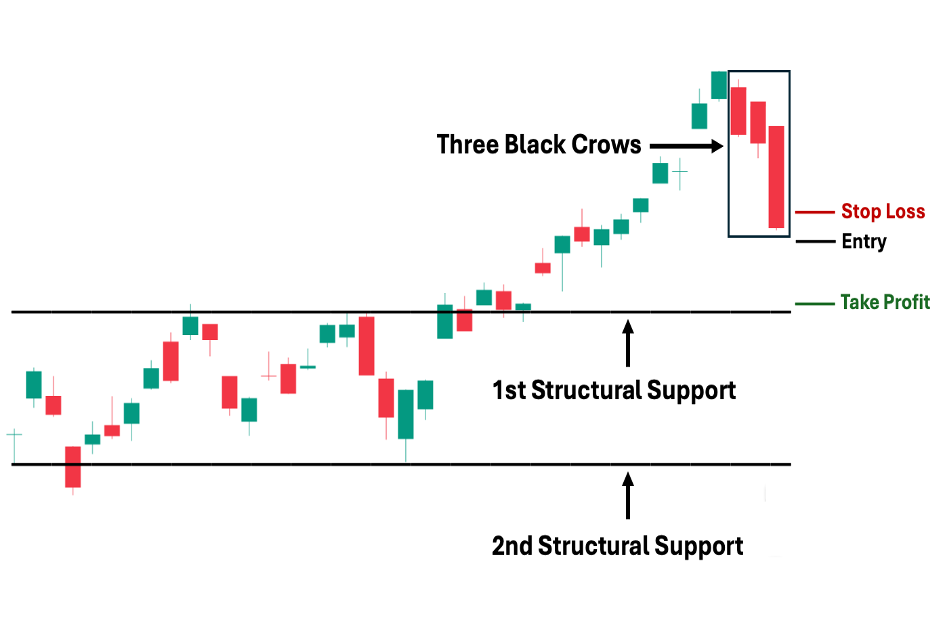
Finally, you can use the asset’s market structure to determine the support and resistance levels for your orders. Similar to Fibonacci levels and Pivot Points, support and resistance areas based on market structure are static (unlike other technical indicators, where they can be dynamic). Market structure uses historical price action data to determine key price levels.
- Suggested Entry: A few ticks below the third candle’s low
- Take Profit (TP) Area: Set it a few ticks above the previous trend’s resistance area (1st structural support). In an uptrend, the previous key resistance level becomes the future support level for both a pullback and when transitioning to a downtrend.
- Stop Loss Level: A few ticks above the third candle’s closing price
- Risk-Reward Ratio: We recommend not taking trades with a risk/reward ratio lower than 1:1. The higher the potential reward compared to risk, the better.
Advantages of Trading on the Three Black Crows Pattern
The following are the three key advantages of using the Three Black Crows Pattern:
1. You can integrate it into a proper Sentiment Analysis
While fundamental and technical analysis are the two most regarded types of analysis in financial markets (such as the stock market), sentiment analysis is crucial for connecting the dots in the broader market context. Experienced traders and investors can intuitively incorporate this, but it’s not as easy for novices in the market. Hence, one of the overlooked advantages of using the Three Black Crows pattern is its potential to serve as a valuable case study in learning how and why market sentiment changes.
2. You can exploit its universally-accepted pattern meaning
Since the Three Black Crows pattern is widely recognized and understood as a bearish reversal signal, it can easily trigger herd behavior—where many market participants follow the same signal and act on it. The thing is, the ones who hold the greatest power to move the markets are not retail traders or investors like us but rather the ‘whales,’ as they are commonly referred to. These are mainly institutions that exploit common technical analysis patterns to their benefit. Hence, in the last section of this guide, we will show a more unorthodox use of this pattern from their lens.
3. Provides scalping opportunity—expect increased volatility as the pattern forms
Again, since the Three Black Crows pattern is universally recognized, you can expect increased volatility when it develops, especially on the daily chart (the most common timeframe used). This creates scalping opportunities on lower timeframes (i.e., seconds, minutes, or hourly) to take advantage of the heightened volatility.
Disadvantages of Trading on the Three Black Crows Pattern
The following are the key disadvantages of using the Three Black Crows Pattern:
1. You may be too late
The thing is, even if the Three Black Crows pattern is successful (meaning the trend indeed reverses to the downside), a substantial portion of the downtrend may already have transpired. This is especially true if the third candle’s close is nearing a key support level based on market structure. Hence, this can leave you in an awkward situation where the risk-reward is simply not worth the trade.
2. You may become over-reliant and biased
Since the Three Black Crows pattern is easy to spot in an uptrend, you may become over-reliant and biased—ignoring other factors, such as market structure and other technical indicators, in favor of acting upon this pattern. After all, if there is a high likelihood that you may be too late, waiting for confirmation may further limit your potential returns, right? Unfortunately, this tunnel vision can compromise your risk management efforts by disregarding proper risk management techniques to chase a potential “winner.”
3. You may be part of the herd that is being exploited
If you utilize the Three Black Crows pattern in its traditional and universally accepted use case—as a bearish reversal pattern—then you are one of the many traders susceptible to being exploited by market participants who can actually move markets (i.e., institutional investors). These ‘whales’ can take advantage of the expected response from retail investors and traders. To avoid this, read the final section of this guide to see their perspective.
Three White Soldiers vs. Three Black Crows
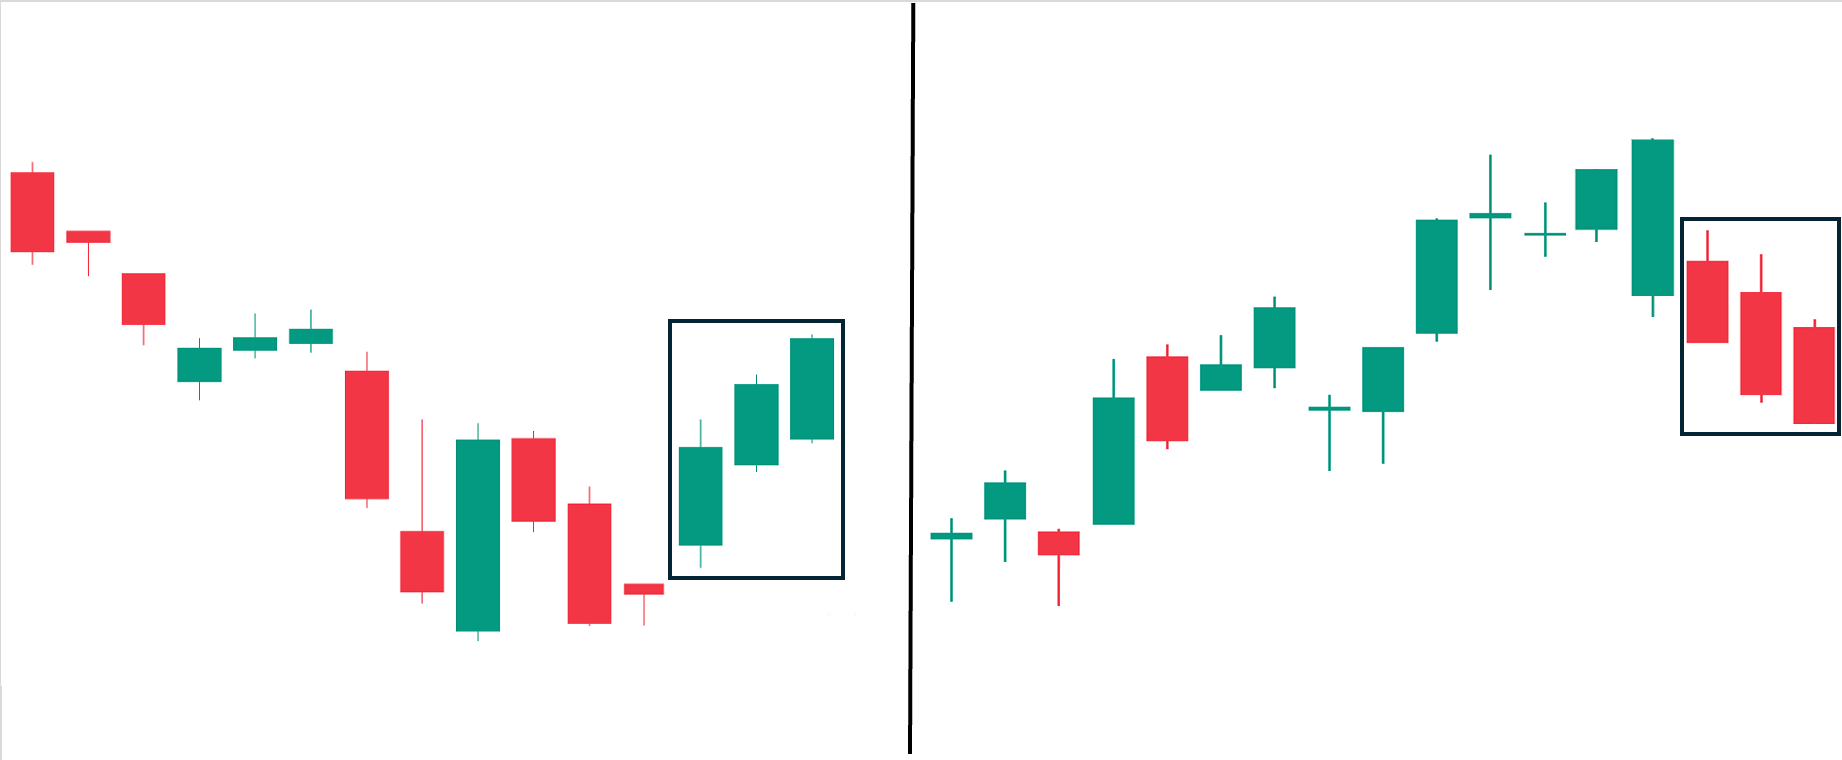
The Three White Soldiers is a bullish reversal pattern that is the direct counterpart to the Three Black Crows pattern. Hence, the characteristics of the Three White Soldiers are similar to those of the Three Black Crows, but in reverse. Instead of having three consecutive long-bodied bearish candles, the Three White Soldiers pattern is composed of three consecutive long-bodied bullish candles.
Condition for Validity: The Three White Soldiers pattern must appear during a downtrend to be considered a bullish reversal pattern. In contrast, the Three Black Crows must occur during an uptrend to be considered a bearish reversal pattern.
Bearish Engulfing Pattern vs. Three Black Crows
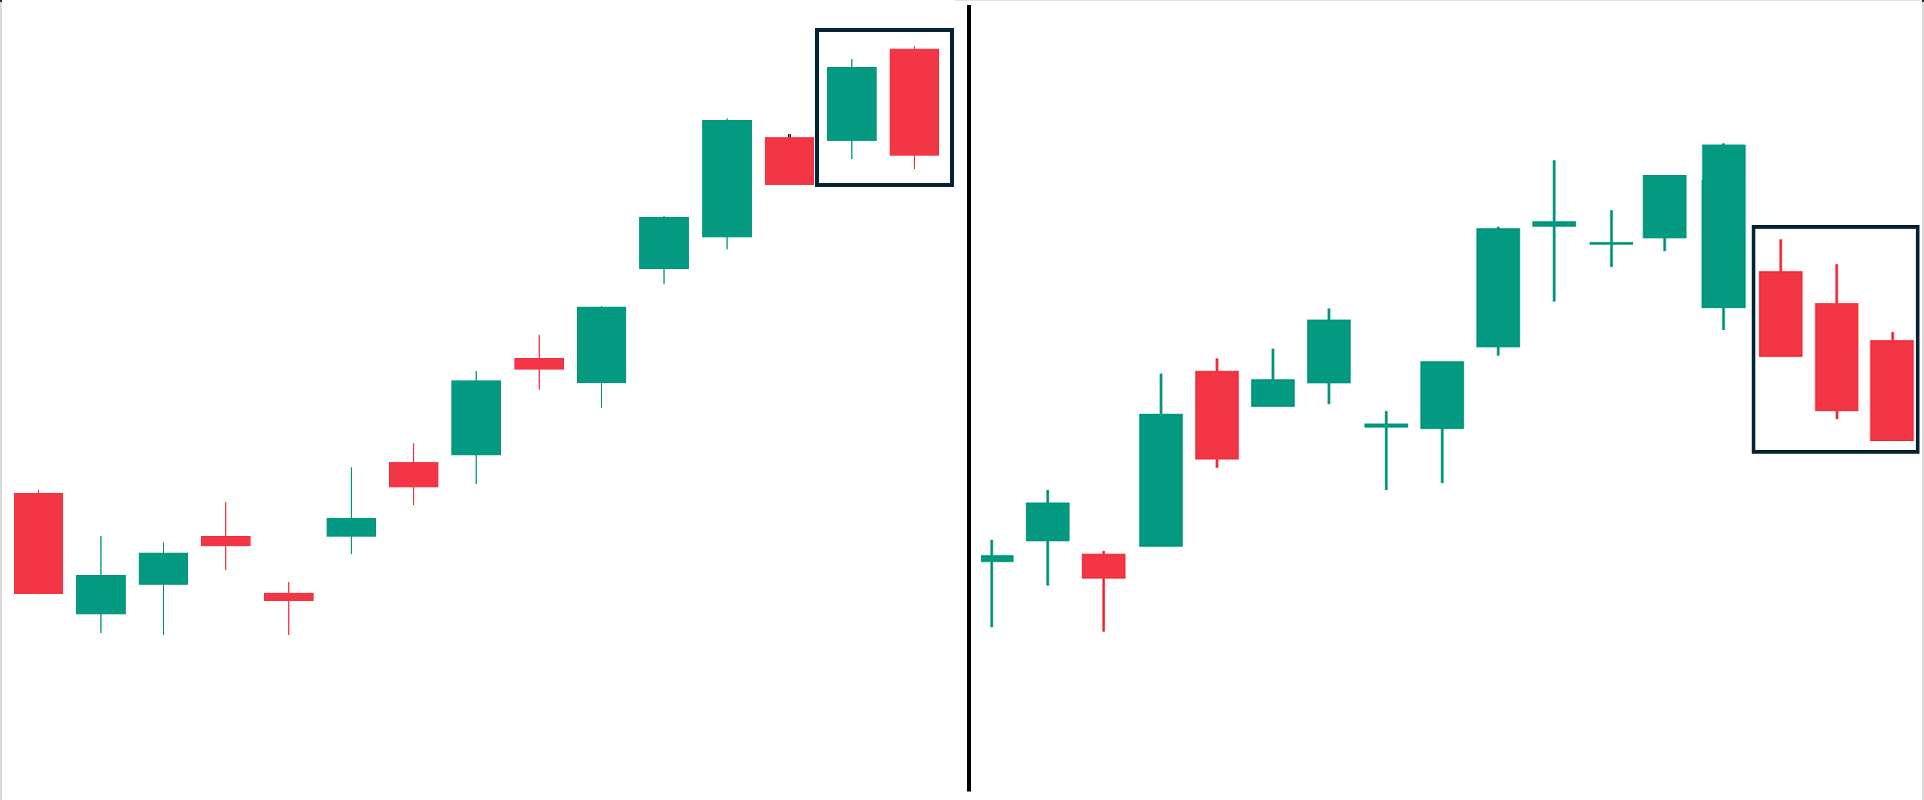
Both the bearish engulfing and Three Black Crows are considered bearish reversal patterns. However, the biggest difference is that the Three Black Crows is a three-candlestick pattern while the bearish engulfing pattern is a two-candlestick pattern. The bearish engulfing is characterized by the second candle being a long-bodied bearish candlestick that completely ‘engulfs’ or covers the body of the previous (first) bullish candle.
Comparatively, the Three Black Crows is considered a “stronger” bearish reversal signal due to its three-candle formation compared to the bearish engulfing’s two-candle formation.
Condition for Validity: Both patterns must appear during an uptrend to be considered bearish reversal patterns.
Piercing Line vs. Three Black Crows
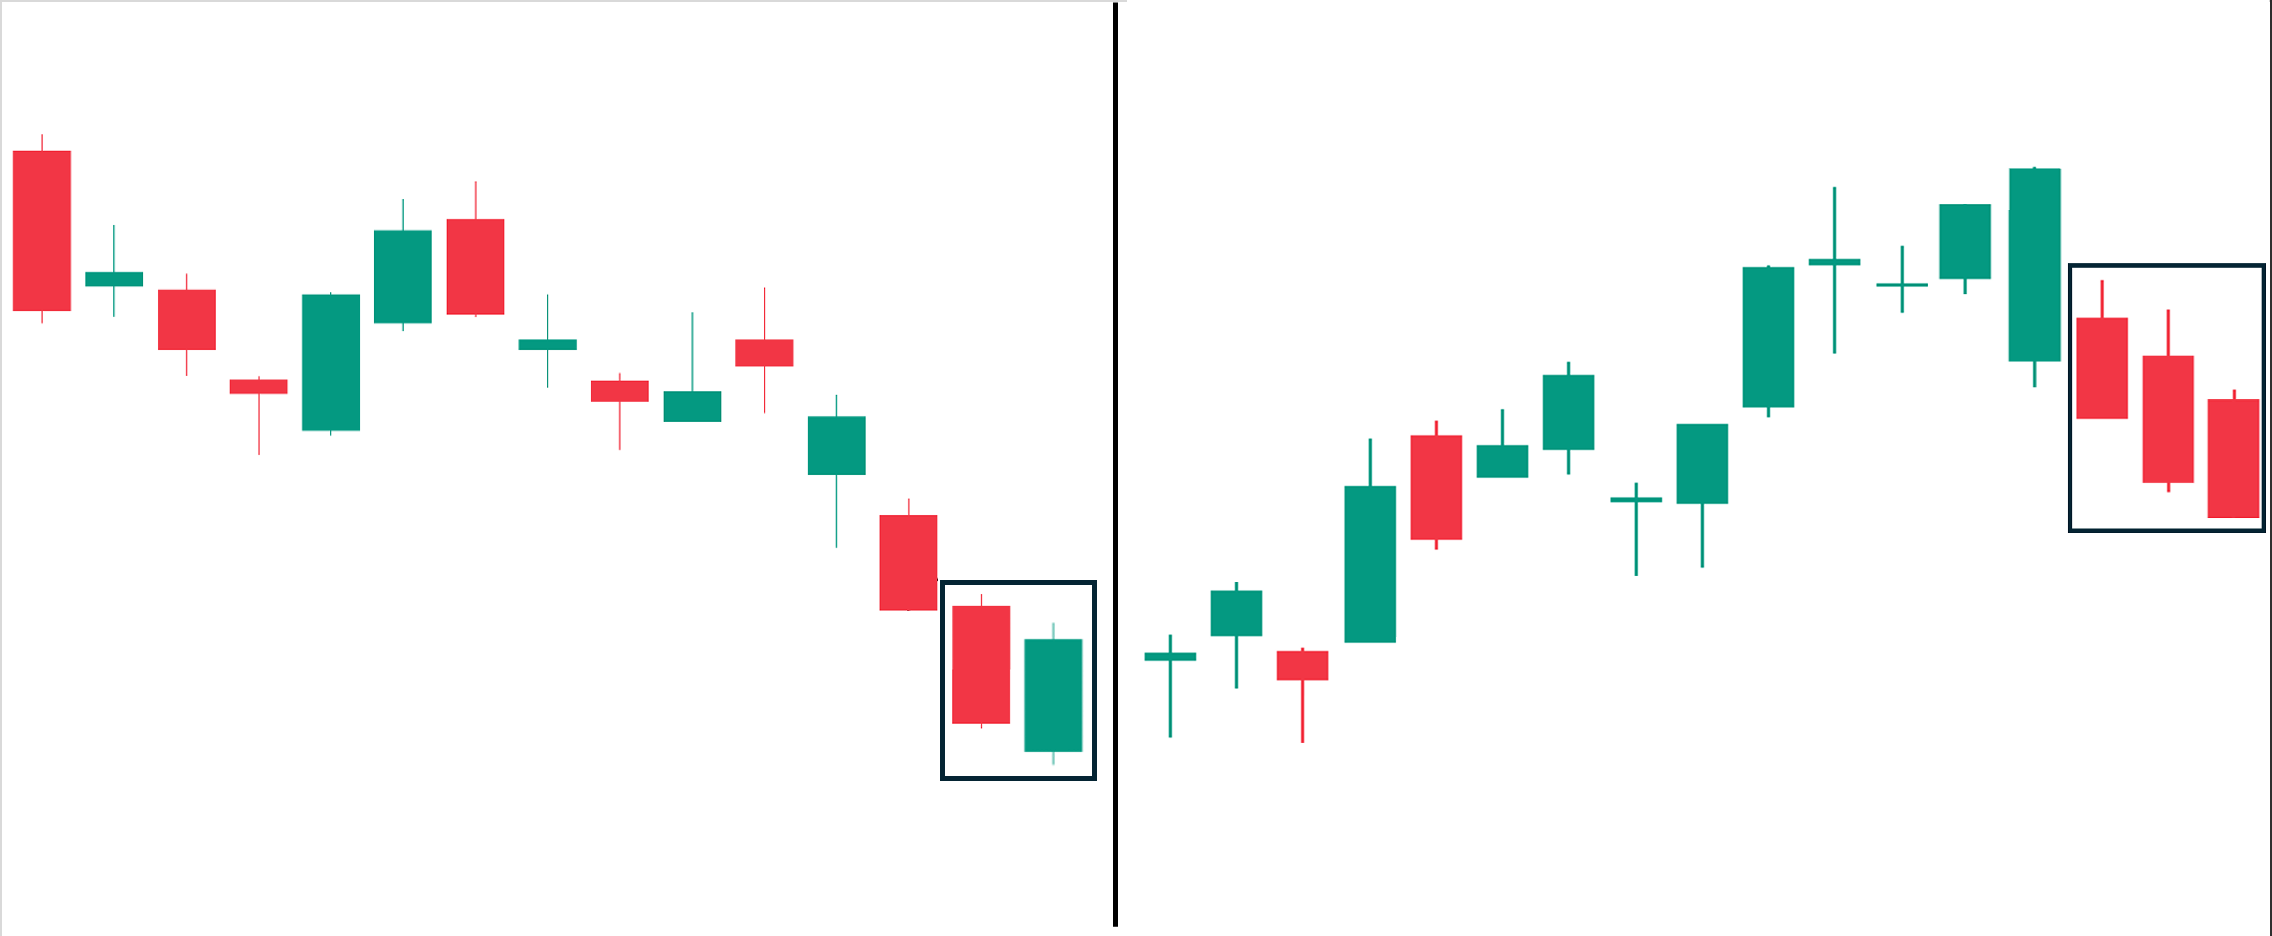
Compared to the Three Black Crows (which is a bearish three-candlestick pattern), the piercing line is a bullish two-candle pattern. The piercing line is characterized by the first candle being a bearish long-bodied candle followed by a bullish long-bodied candle that opens below (gap down) the first candle’s close but manages to close above 50% of the previous candle’s body. This indicates a rejection of further price drop and signifies a possible build-up of bullish momentum for a potential reversal.
Condition for Validity: The piercing line pattern must appear during a downtrend to be considered a bullish reversal pattern.
Evening Star vs. Three Black Crows
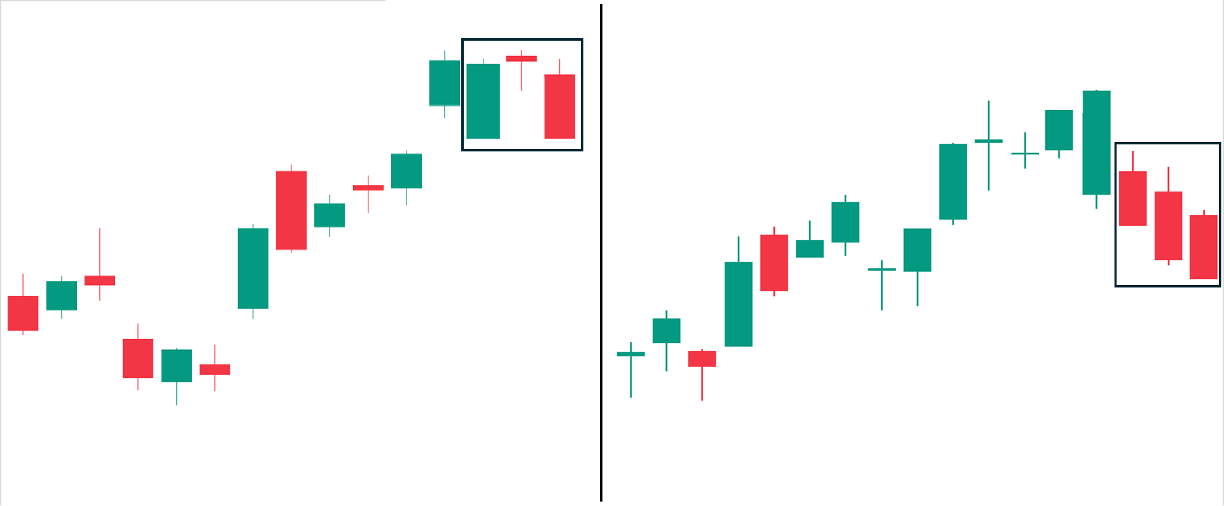
Similar to the Three Black Crows pattern, the evening star pattern is also a three-candlestick bearish reversal pattern. The evening star is characterized by a long-bodied bullish candle, followed by a thinly-bodied candle that punches a new high. Note that the color of this second candle does not matter—it can be green or red, ideally with a gap up from the first candle. Finally, the third candle is a long-bodied bearish candle that retraces most of the distance created by the first candle.
Overall, unlike the Three Black Crows, which has a simple condition of three consecutive long-bodied bearish candles, the evening star pattern is more nuanced.
Condition for Validity: Similar to Three Black Crows, the evening star must also appear during an uptrend to be considered a bearish reversal pattern.
Abandoned Baby vs. Three Black Crows
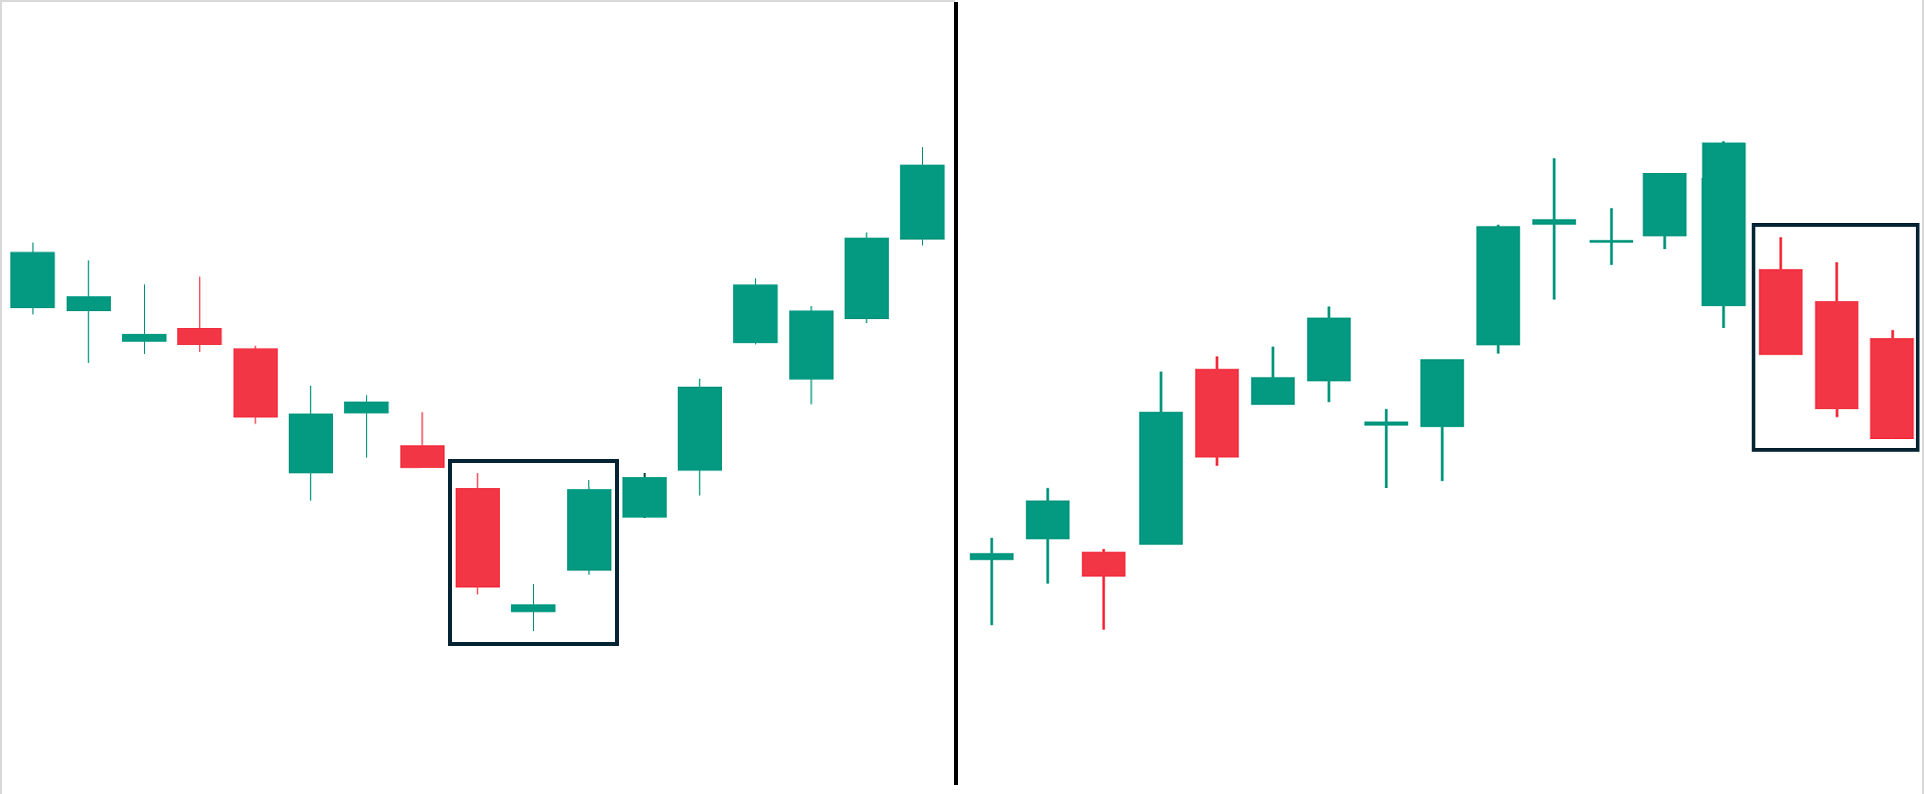
Both the abandoned baby and Three Black Crows are three-candlestick pattern formations. In fact, the abandoned baby is even more nuanced than the evening star. The abandoned baby can be found in either a bullish or bearish direction.
In the image above (left side), is a bullish abandoned baby. The first candle is a large bodied candle that continues in the direction of the previous trend.
Then, the second candle is also a thinly-bodied or doji candle with the important characteristic of gapping on the opening in the direction of the previous trend. The color of this second candle does not matter.
Finally, the third candle of the abandoned baby pattern is a long-bodied candle that gaps on the open in the opposite direction of the previous trend. This confirms the previous trend has lost momentum and is reversing.
Condition for Validity: The abandoned baby pattern must appear during a downtrend to be considered a bullish reversal pattern.
Tweezer Tops vs. Three Black Crows
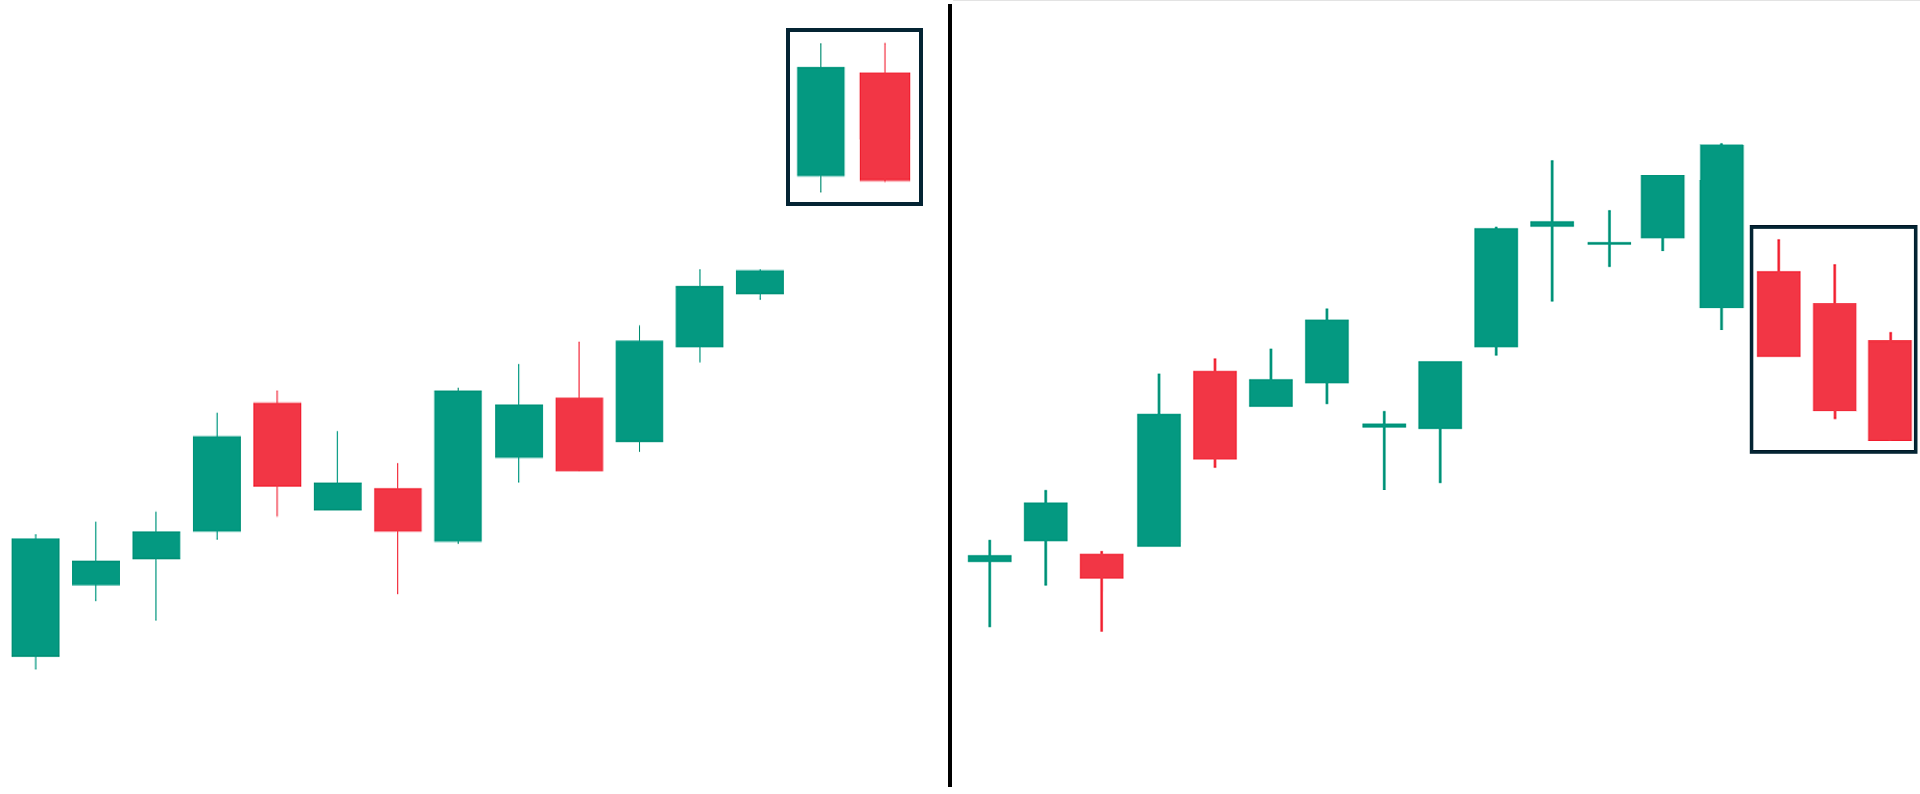
Similar to the Three Black Crows pattern, the tweezer top pattern is also a bearish reversal candlestick pattern. However, compared to the Three Black Crows—which is composed of three long-bodied bearish candles—the Tweezer Top is characterized by only two candlesticks: a long-bodied bullish candle creating a new high, followed by a long-bodied bearish candle reaching approximately the same high but closing lower than the first candle’s opening price.
This pattern’s formation can be interpreted as buyers being unable to overcome the selling pressure at the top, which potentially developed as a key resistance level, suggesting that bearish momentum may soon follow.
Condition for Validity: The Tweezer Top pattern must occur during an uptrend to be considered a bearish reversal pattern.
Double Top vs. Three Black Crows
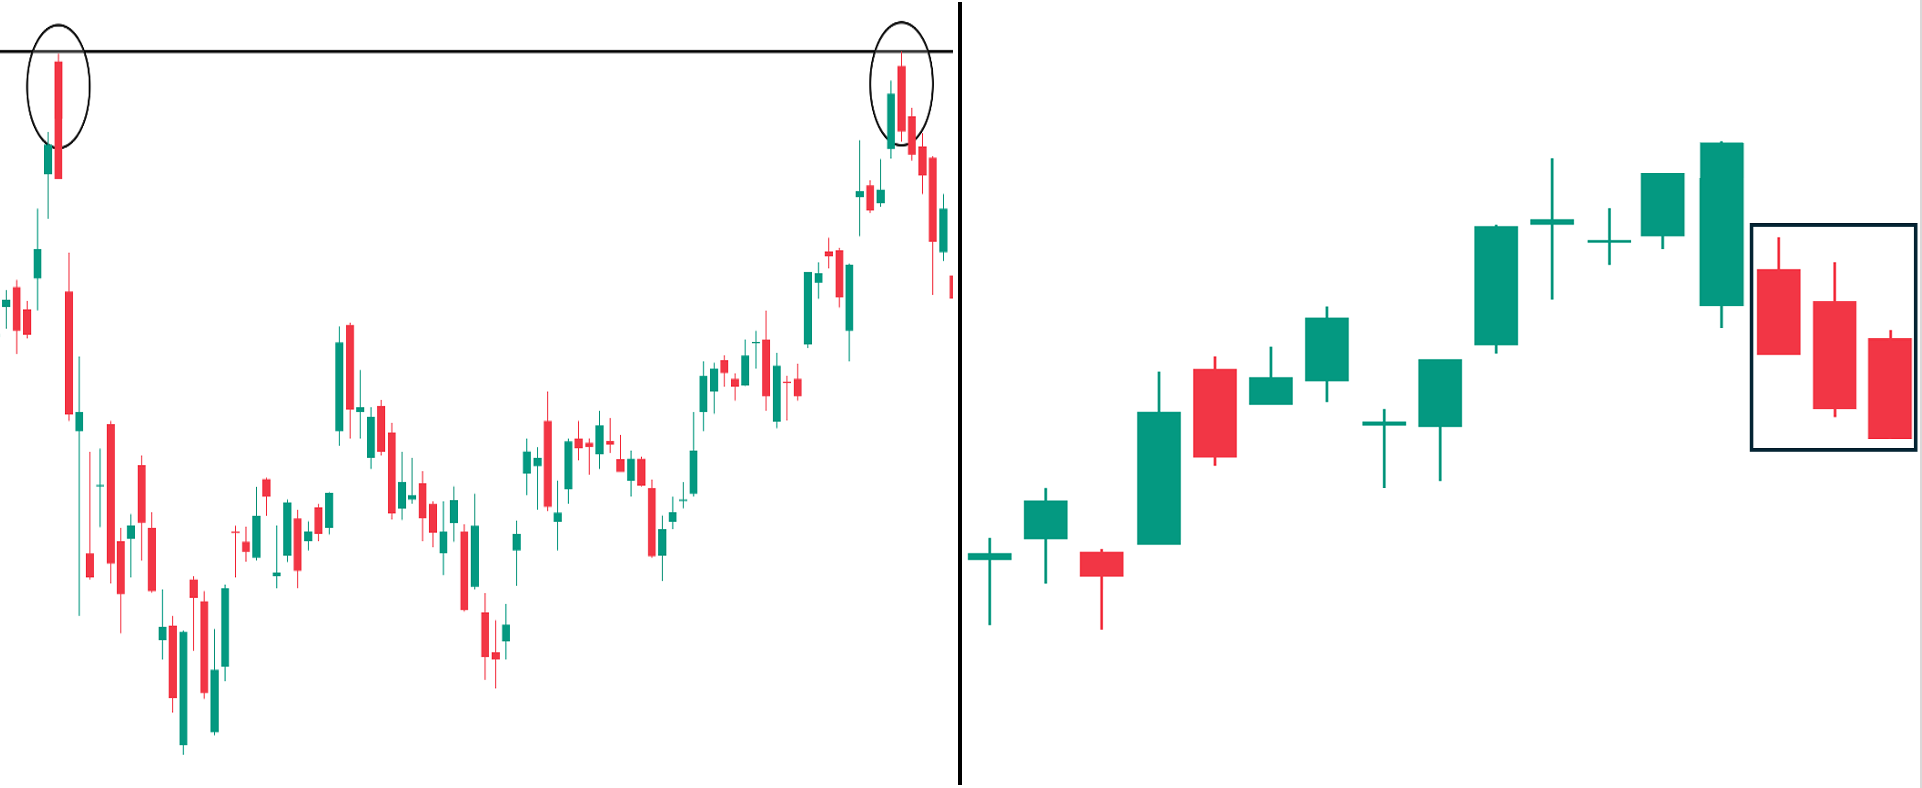
Similar to the Three Black Crows, the double top is also a bearish reversal pattern, conceptually the same as the tweezer top. However, instead of two candlesticks forming next to each other, a double top occurs when the asset makes an identical high over a certain period.
Thus, many traders consider it a stronger bearish reversal pattern, even compared to three-candle reversal patterns, such as the Three Black Crows. This is because the double top signifies that the previous high remains a significant resistance level and that the price will lose momentum again as selling pressure overwhelms its previous bullish momentum.
Condition for Validity: Both tops must occur during an uptrend—the first top must be followed by an eventual downtrend and/or consolidation before transitioning to a new uptrend and creating the second top.
How Pros Use The Three Black Crows Candlestick Pattern:
Now that you understand how most market participants view and use the Three Black Crows candlestick pattern, we’ll discuss how professional traders and investors—particularly institutions—exploit this common chart pattern to their advantage (this also applies to other candlestick chart patterns). With that said, consider doing these three things when the Three Black Crows pattern occurs:
1. Pros Prioritize Market Structure Over any Candlestick Pattern
First, professionals prioritize the broader market context in their trading decisions. For example, if they see the Three Black Crows candlestick pattern occurring at the end of an uptrend, yet simultaneously, the third candle’s low is also approaching the asset’s structural support level based on its historical price action—the market structure prevails. In this case, instead of placing a short order since the Three Black Crows is considered a bearish candlestick pattern, pros prepare to buy close to this support level, irrespective of the candlestick pattern that may transpire.
2. Pros Watch Out For Volume
One of the most underutilized tools among retail traders is volume. Yes, the “volume” that literally only shows the total amount traded in a given candle. So why is this crucial? Well, it’s because volume completes the naked chart picture. Looking at the chart without volume is like looking at a picture without context.
To illustrate, suppose the Three Black Crows candlestick occurs in an uptrend. If you’re not looking at volume, this may appear like a de facto bearish reversal signal. Yet, if you see below-average volume turnover on the first, second, and third candles, this might actually be a bullish signal, especially if the previous bullish moves had above-average volumes. This indicates that major market participants (i.e., institutions) hold on to their positions. Hence, in this scenario, they may exploit the lower prices to further accumulate before the next further move to the upside.
3. Pros Watch Who Buys and Sells
This is a standard practice among institutional investors. Essentially, they look at who is buying and selling a given asset, such as a stock. For example, in an uptrend, they watch the brokers and parties who accumulate over a given period of time. Suppose a specific party has been buying aggressively and constitutes a significant percentage of the total volume turnover. If, despite the Three Black Crows candlestick pattern, they do not dispose of their position and may, in fact, even accumulate further. This indicates a high likelihood that the trend will continue, as major market participants still hold while retail traders panic selling.
FAQs
What is the best time frame for the three black crows pattern?
There is no single best time frame to use the three black crows pattern. However, the general rule is that patterns occurring on higher time frames are more reliable than their lower time frame counterparts. Hence, you may consider performing a multiple timeframe analysis, where you analyze and compare each time frame to confirm a specific price pattern.
How reliable is the three black crows as a bearish reversal pattern?
On its own, the three black crows pattern has questionable reliability at best. Hence, for better results, we recommend using other confirmation tools, such as analyzing the general market structure and using volume and other technical indicators to verify the reversal signal.
Can a three black crows pattern occur in both uptrends and downtrends?
Technically, the pattern itself, which is composed of three consecutive bearish candles, can develop in any trend direction—be it an uptrend, downtrend, or sideways price action movement. However, to be considered a “valid” three black crows pattern and to serve its purpose as a potential reversal signal, it must occur during an uptrend.
Is three black crows a bullish or bearish candlestick pattern?
The three black crows is traditionally and universally viewed as a bearish candlestick pattern. Its counterpart, the three white soldiers pattern, which consists of three bullish candles that occur during a downtrend, is considered a bullish reversal pattern.


