


Written by:

Reviewed by:

- September 5, 2025
- 38 min read
Volume Profile Effective Trading Guide
Volume Profile is a well-known yet often underused indicator found across most modern charting platforms.
Let’s break down how it works — and how you can start using it to identify better support and resistance levels in your trading.
What is a Volume Profile?
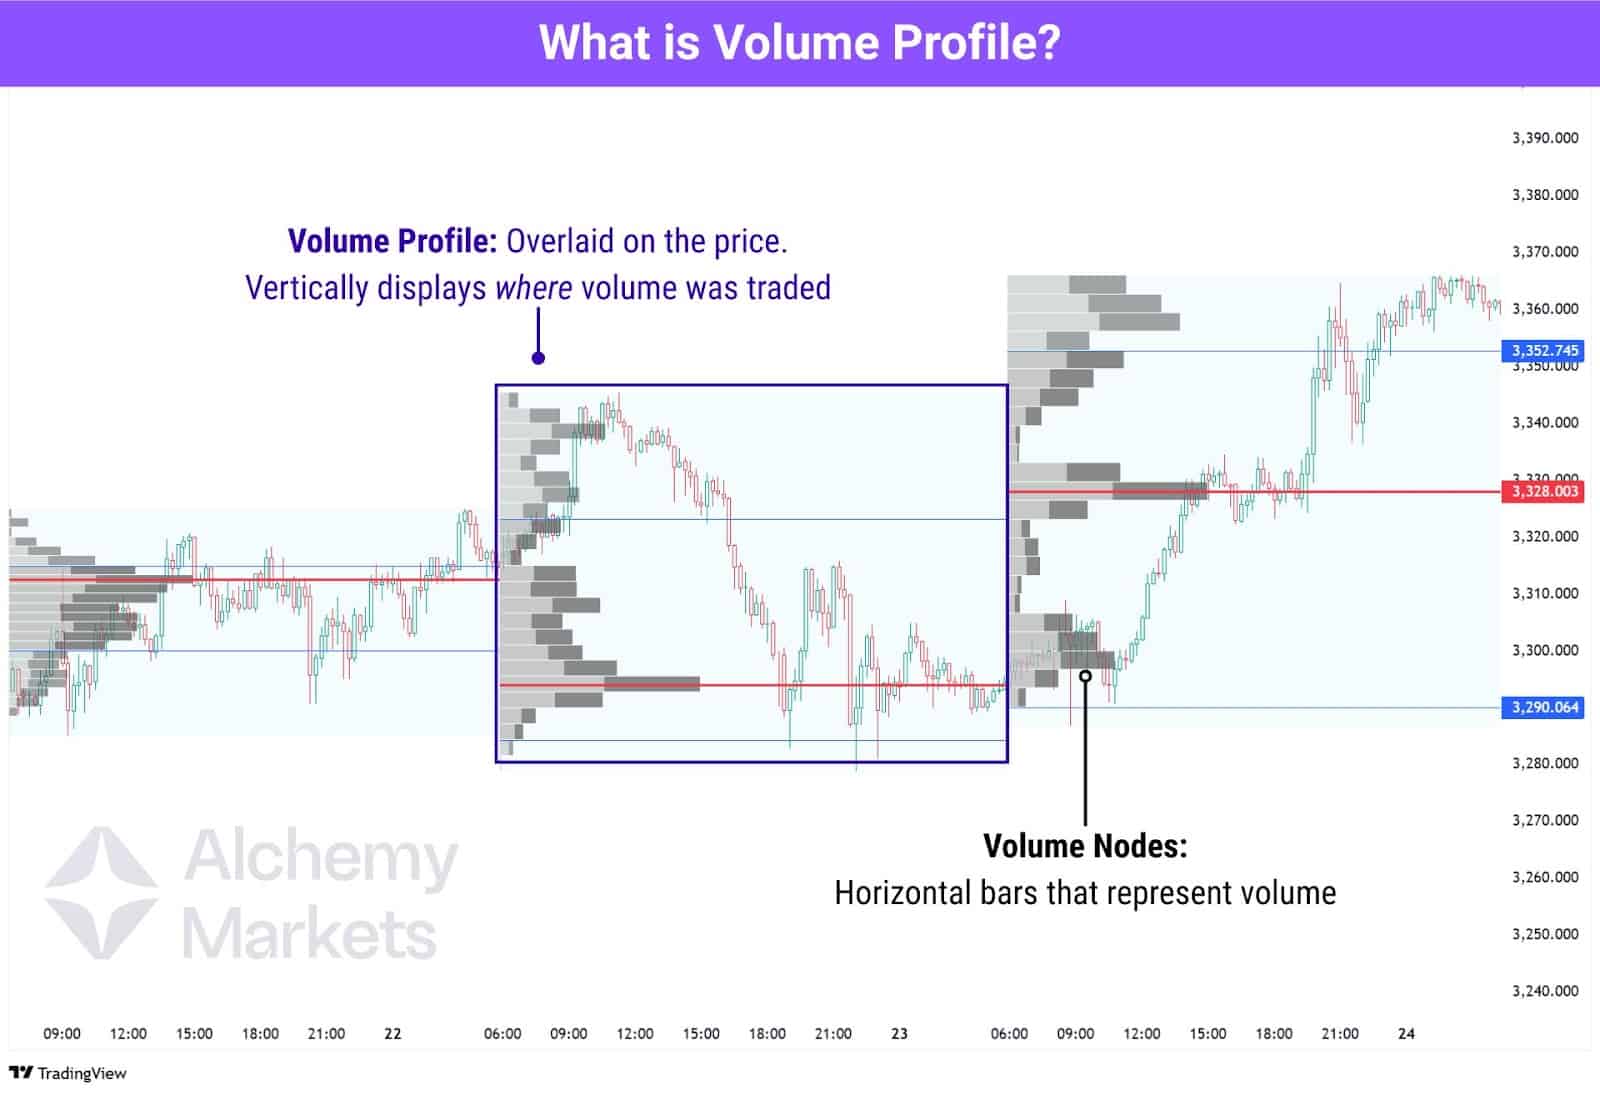
Volume Profile is a technical analysis tool that scans historical price action and maps out how much volume was traded at each price level, forming a visual distribution on the chart. Volume bars are displayed horizontally, stacked directly on top of the price chart to show where the most buying and selling activity has occurred.
These horizontal bars are known as Volume Nodes and form the foundations of the volume profile. Traders analyse price levels with large volume nodes to spot key areas for potential trades.
How Does the Volume Profile Indicator Work?
As price moves through different levels during a session or a selected range, the indicator keeps track of how much volume was traded at each price, and then stacks that data horizontally on the chart.
The result is a visual distribution made up of volume nodes. The longer the bar, the more actively that price level was traded. These high-volume zones often act as support or resistance, since they represent areas where buyers and sellers previously agreed on value.
But wait, there’s more.
The volume profile indicator isn’t a monolith; there are three main types of volume profile indicators:
- Fixed Range Volume Profile (FRVP)
- Anchored Volume Profile (AVP)
- Session Volume Profile (SVP)
Each of them has their use cases, but volume nodes are calculated in the same way.
The key difference is that the FRVP only measures a fixed range with a clear start and end, the AVP is continuous and measures the profile until the current price, and the SVP only measures the VP of a trading day.
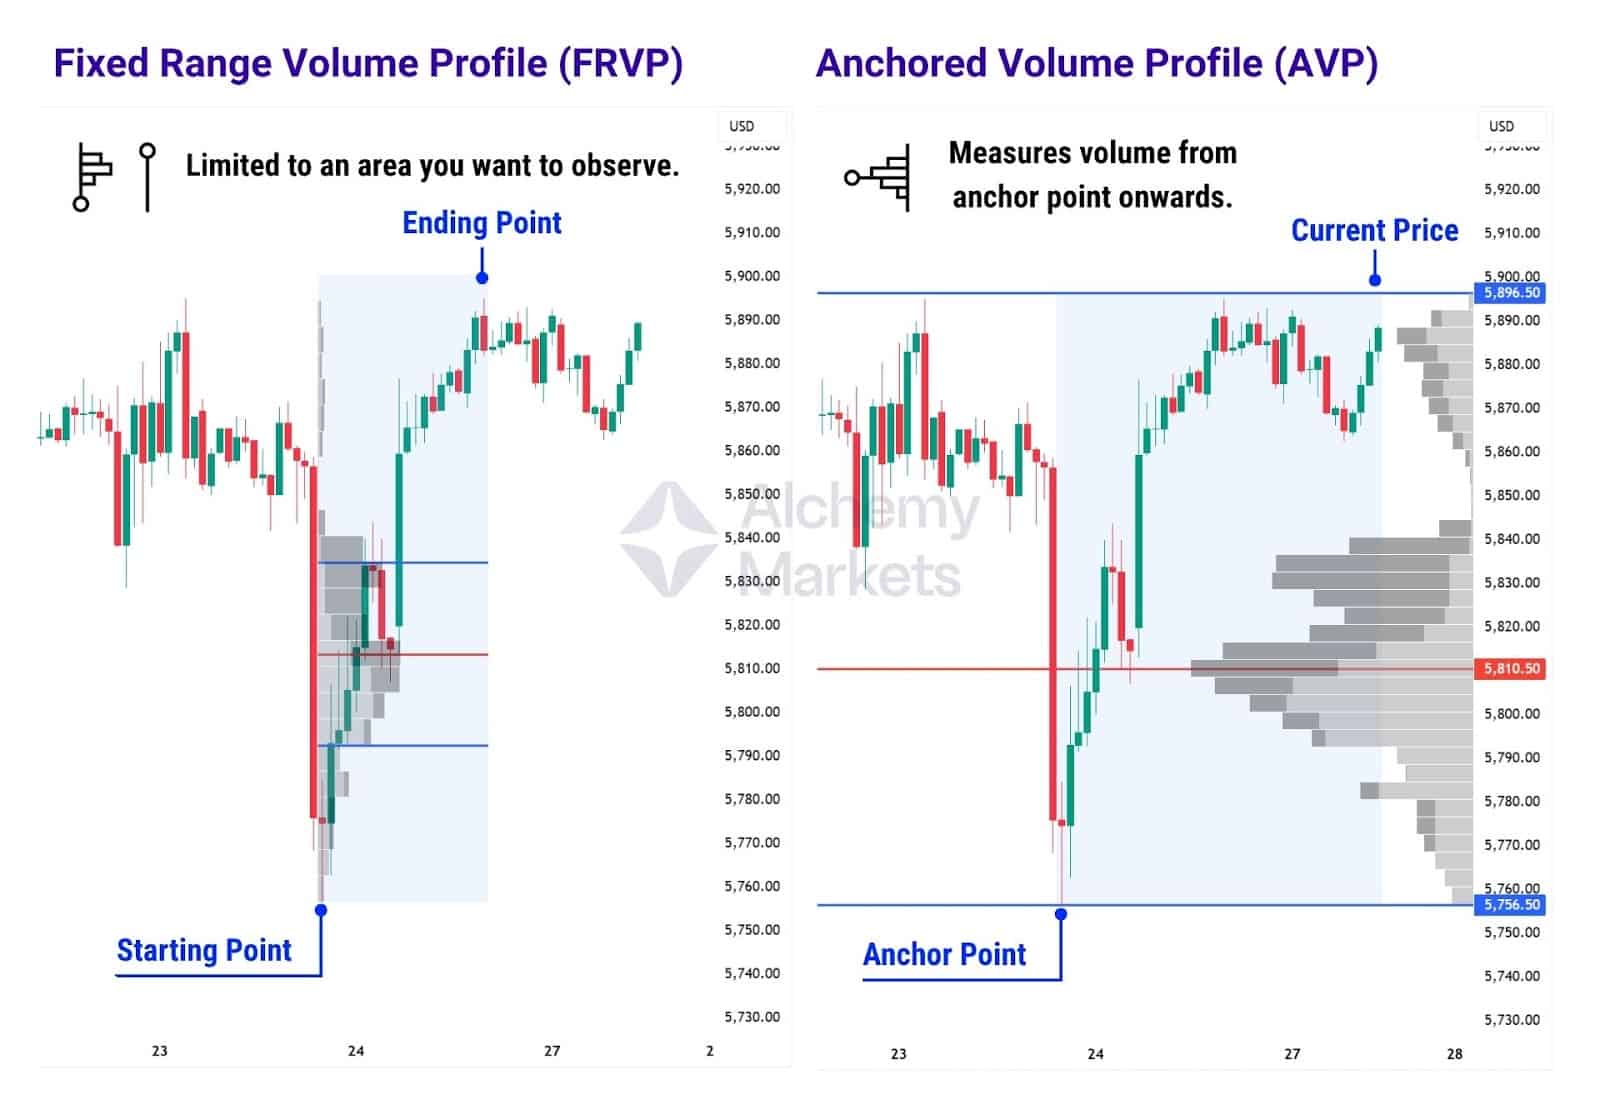
| Fixed Range Volume Profile (FRVP): Limited to a selected area for analysis. Traders often apply it to a specific price leg—either a move up or down—to see how volume was distributed during that phase. Also used within a consolidation zone to study volume behavior in a clearly ranging market. |
| Anchored Volume Profile (AVP): A dynamic volume profile that starts from a specific price point or event and updates in real time as new price data unfolds. Traders typically anchor it to the beginning of a trend, a major news release, or a breakout level to track how volume accumulates from that moment onward. |
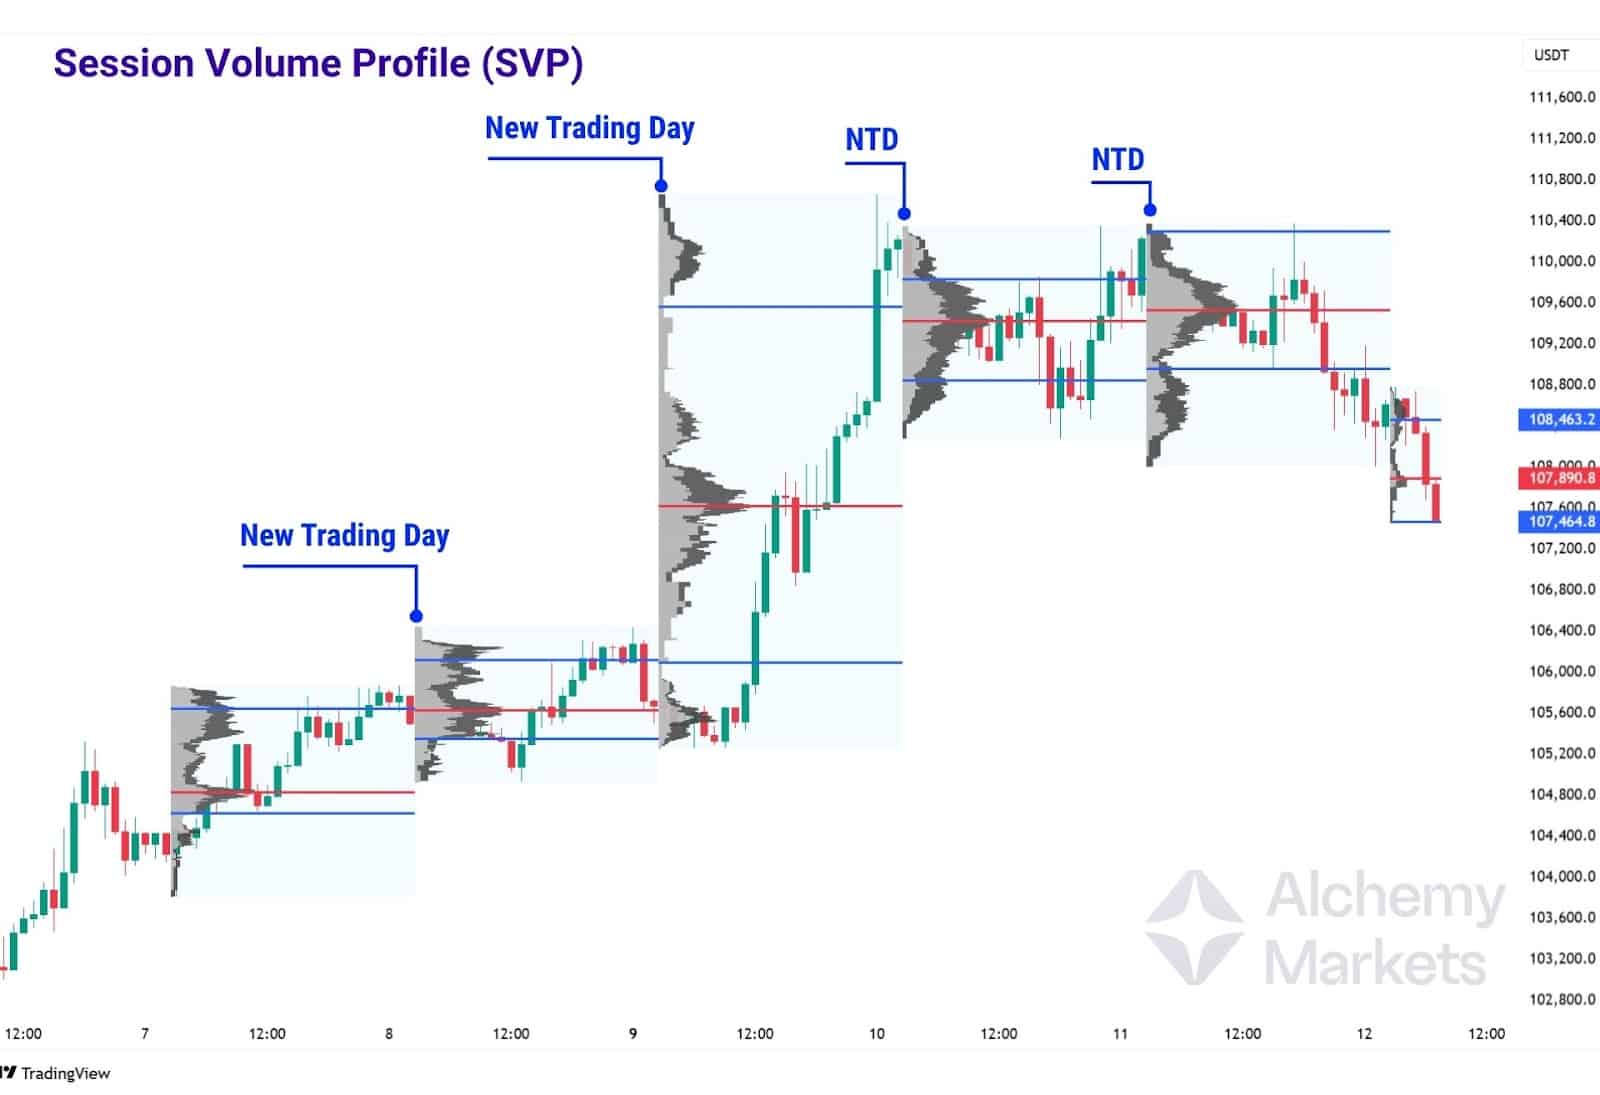
| Session Volume Profile (SVP): SVP measures volume within a single trading day. For most assets on TradingView, this runs from 00:00–23:59 UTC. But for CME futures, the trading day spans 18:00–17:00 CT.It’s perfect for spotting intraday volume shifts, POC changes, and reaction zones during major sessions. |
Components of the Volume Profile Indicator
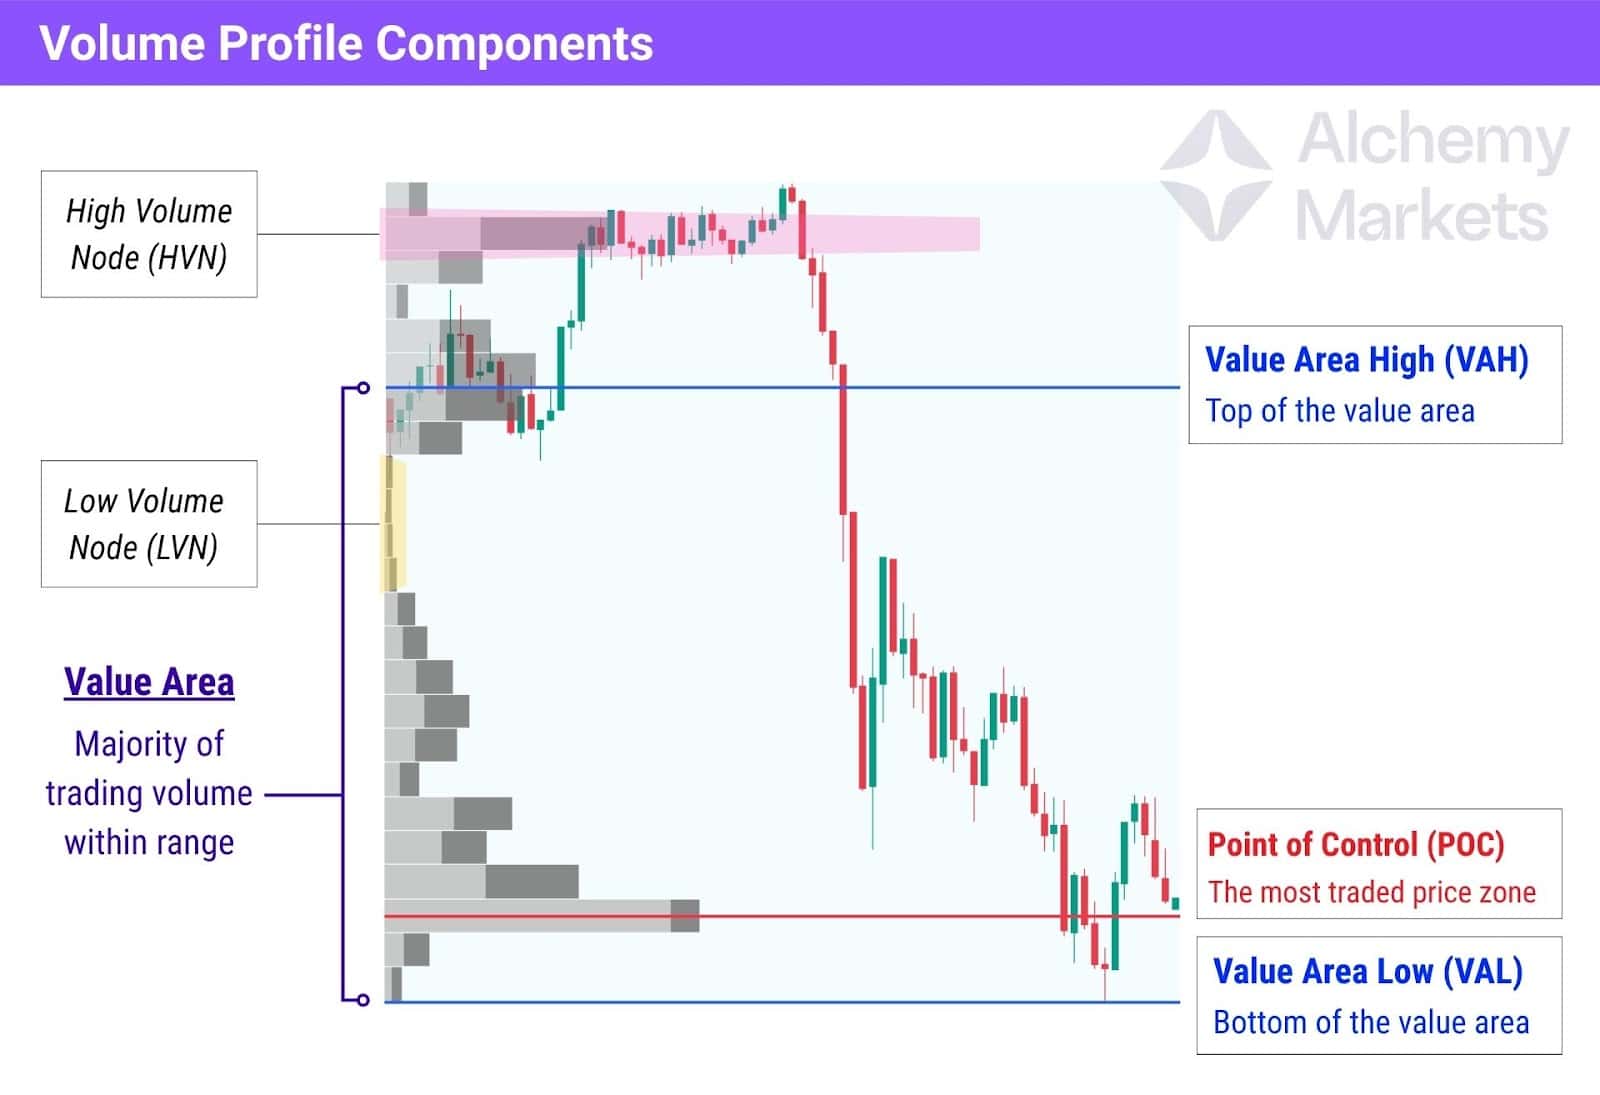
A volume profile has more than just its volume nodes. It marks out the value area, also referred to as the fair value zone or range, which represents the majority of trades within a range. Normally, this is set to encompass 70% of the trading volume within a profile, and signals where traders think the fair price is.
Here’s how the key components break down:
| 📈 Value Area High (VAH): The upper boundary of the value area. If price breaks above this and holds, it can indicate bullish strength — but it often acts as resistance if price rejects it. 📉 Value Area Low (VAL): The lower boundary of the value area. It can serve as support when price revisits it from above, or a signal of bearish intent if broken cleanly. 🎯 Point of Control (POC): The single price level where the highest volume was traded during the session. Price often gravitates towards this level, making it useful for identifying reversion zones or congestion areas. |
Depending on which VP tool you use, the price’s reaction to a prior VP’s value area can signal various things:
| ✅ Acceptance: If price stays within the previous session’s value area, it suggests the market agrees with that fair value — expect more range-bound or balanced trading. ❌ Rejection: If price quickly breaks out and stays outside the value area, it implies a shift in sentiment — either buyers or sellers are in control, and a new auction may be forming. ↩️ Failed Auction: If price breaks out of the value area but quickly returns, this implies a failed breakout attempt — which is a signal for a sharp reversal in the returning direction. |
Watching how price behaves around the VAH, VAL, and POC can give powerful clues about market intent, especially when paired with structure, momentum, or time-based sessions.
Additionally, not all volume nodes carry equal weight. They can be categorised into two groups:
| 🟥 High Volume Nodes (HVNs): Single, extreme peaks in the volume. These zones show institutional interest at a concentrated zone, and tend to act as support/resistance. 🟨 Low Volume Nodes (LVNs): Thin, compressed bars. These areas indicate rejection or lack of interest — price often slices through them quickly, making them ideal for breakout setups. |
Importance of Volume Profile Indicator
Volume Profile (VP) gives traders a more objective way to identify key price levels, instead of just eyeballing support and resistance or drawing trendlines with a subjective approach. By mapping where the most trading activity has taken place, it highlights zones that carry actual weight, making your marked levels data-driven, rather than purely relying on visual symmetry.
That said, there’s still a degree of subjectivity involved. The way you interpret and draw volume nodes — especially high vs low volume areas — can vary depending on your method, chart settings, or the VP’s settings. But that flexibility is part of its strength.
In short, traders can use VP to confirm support/resistance, and:
- Identify hidden levels others might miss.
- Spot gaps in volume (LVNs) where price may cut through quickly.
- Distinguish between noise and true structure.
Why should we care about volumes and what the big institutions are doing in the market?
When a trade is transacted, it’s recorded as volume. In that sense, volume is the foundation of all trading — a record of commitment.
By tracking where the most trading has occurred, we gain insight into market psychology: where traders found value, where positions were taken, and who likely has control (buyers or sellers).
This ties directly into institutional activity. It’s widely accepted that institutional traders make up the vast majority of market volume. According to the BIS Triennial FX Survey (2022), trading by financial institutions (banks, hedge funds, asset managers, etc.) accounts for over 93% of global FX turnover, while non-financial participants (including retail traders) account for just 6.6%.
So when we see high volume at a specific price, it often reflects institutional interest, and that makes those levels far more meaningful than a line drawn by eye. Volume Profile helps traders spot these critical zones.
Volume Profile Example
Now that we’ve covered the core components of the Volume Profile, let’s see how this tool applies in a real-world scenario.
There are several ways to use Volume Profile, depending on your goal.
In this example, we focus on the Fixed Range Volume Profile (FRVP) — a tool that allows traders to manually select a defined range (such as a price leg or structure) and generate a profile for that move. This is particularly effective for analysing impulsive trends or retracement legs, where volume distribution can hint at potential reversal or continuation zones.
By applying FRVPs to directional legs, traders gain insight into:
- Where value was established during a move
- Volume-based resistance or support levels
- How price interacts with prior value zones when revisited
Let’s walk through the example below to see how price behaviour aligns with FRVP levels.
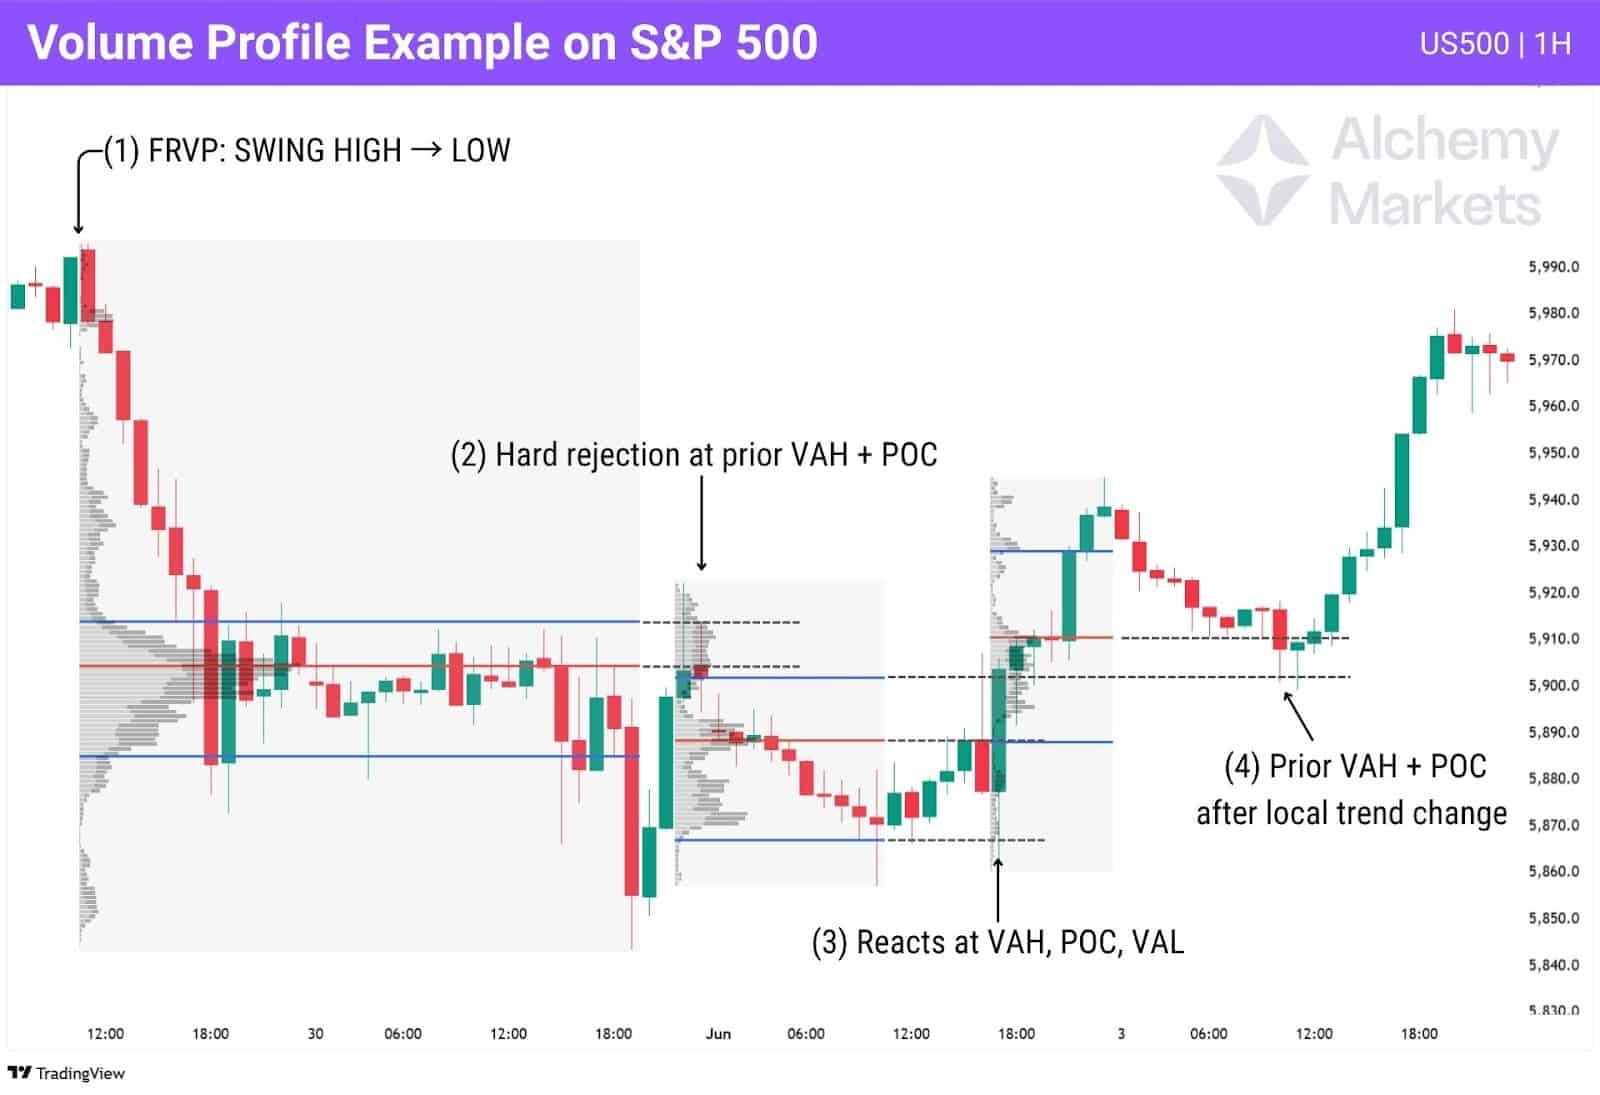
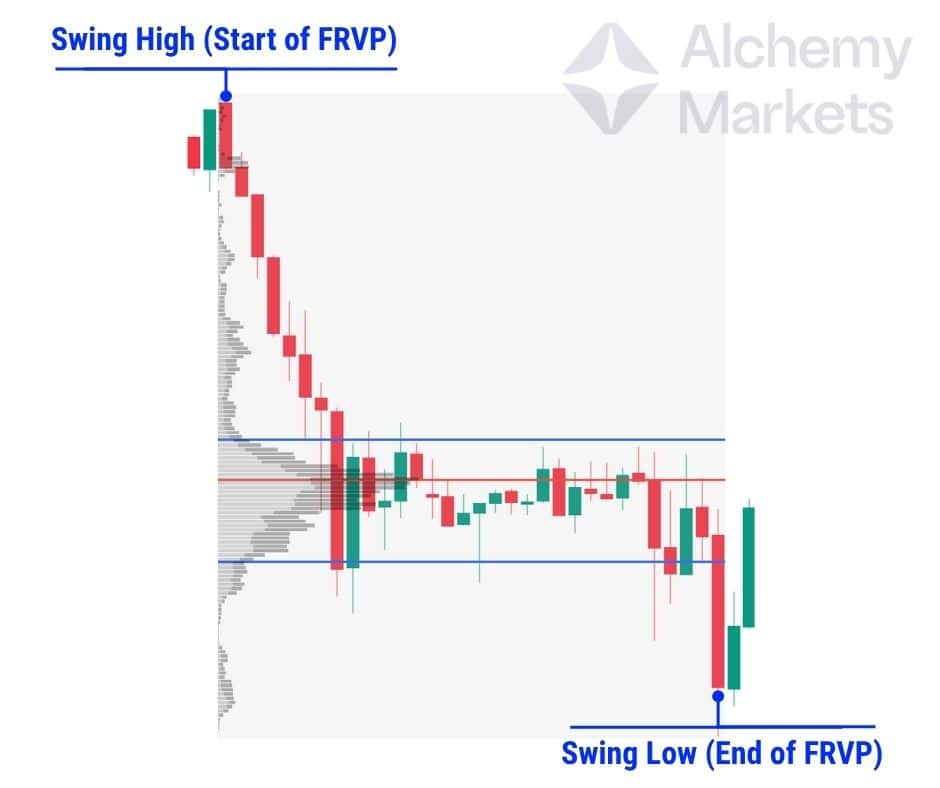
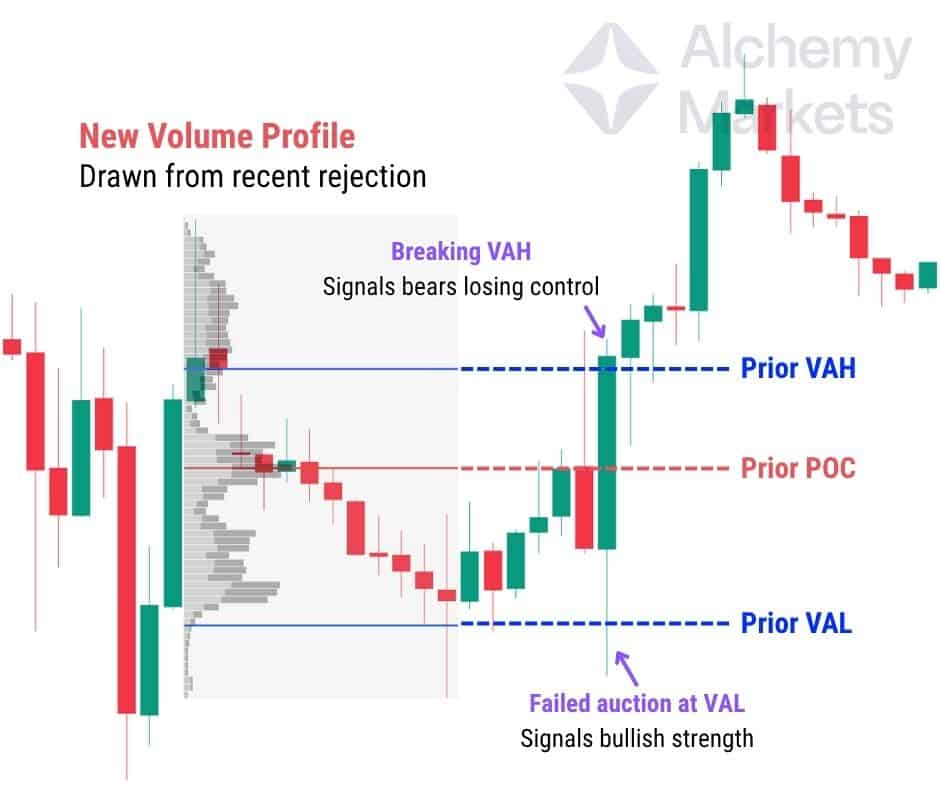
(1) FRVP: Swing High → Low
A volume profile is drawn across a clear bearish leg. This maps out the key value area — with the Value Area High (VAH), Point of Control (POC), and Value Area Low (VAL) forming clear zones of interest.
These markers serve as objective references for where the majority of market participants engaged with price during the selloff.
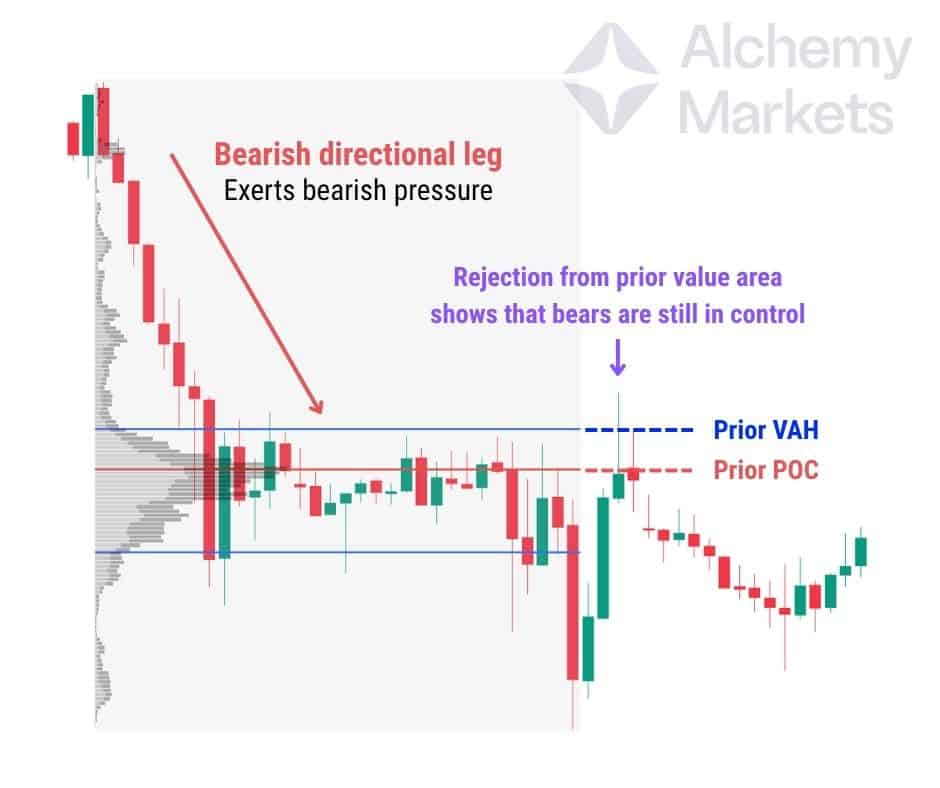
(2) Rejection at Prior VAH + POC
As price retraces upward, it enters the previously established value area. Notice how it stalls and rejects sharply at the VAH and POC — two of the most significant high-volume zones from the prior leg.
This rejection reinforces the idea that sellers remain active in that area and that it still holds relevance as a resistance zone.
(3) Reacts at VAH, POC, VAL
A second FRVP is applied to the next leg of price movement. As price begins to range and coil within this new leg, it reacts precisely to all three volume markers:
- Rejects the VAH on an attempted breakout
- Drops down to the VAL, where it finds support
- Recovers back toward the POC
These reactions illustrate how value zones act like magnets or barriers, guiding price behaviour even without visible trendlines or indicators.
(4) Prior VAH + POC Becomes Support
Following a local higher high — which breaks prior structure and hints at a shift in sentiment — price pulls back. This time, it revisits the prior VAH and POC, but instead of rejecting, price respects these levels as support.
This flip in behaviour confirms a bullish trend shift, as former resistance zones become the new base for buyers to step in.
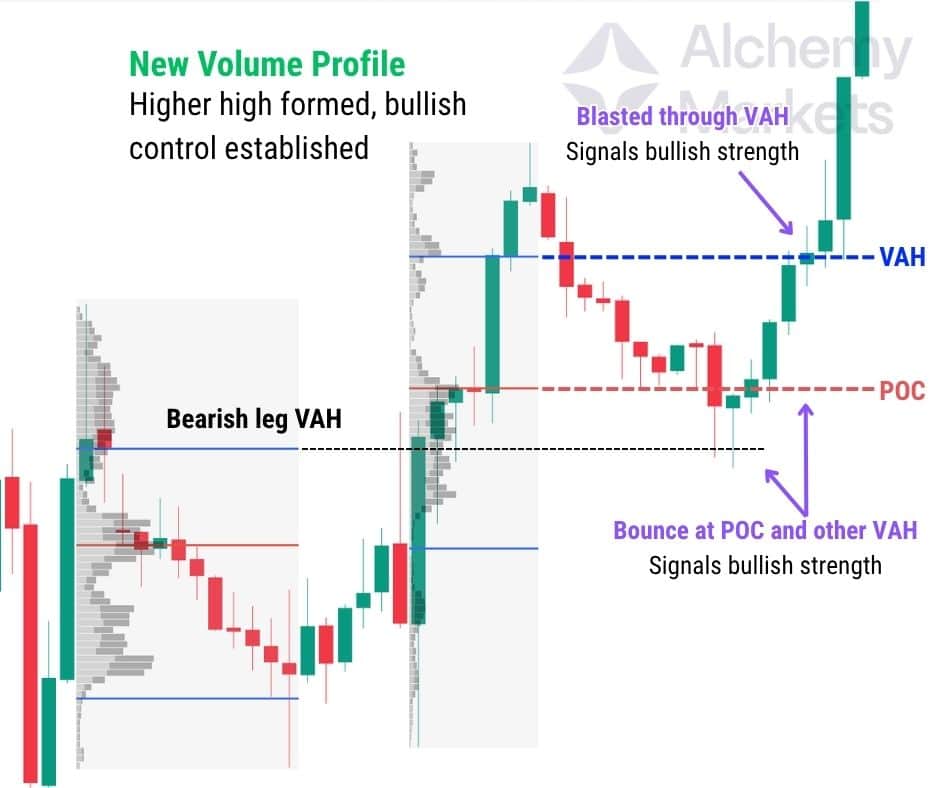
Using FRVPs on specific price legs allows traders to move beyond subjective levels and instead work with volume-confirmed zones of interest. In this example:
- Reactions at VAH, VAL, and POC validate how market memory persists
- Shifts in how price interacts with these zones often signal trend reversals
- FRVPs work best when paired with clear structure — such as a breakout, retest, or directional move
When used effectively, the FRVP becomes not just a measurement tool — but a context engine, helping you read the market’s story based on where commitment occurred.
Volume Profile Trading Strategies
Volume Profile (VP) works best on instruments that record actual volume, like futures contracts.
CFDs or spot forex pairs may not display VP correctly due to lack of exchange-level volume data. This means, even if you’re not trading futures, it’s worth using the futures chart of Stocks, Cryptos, or whatever asset you’re trading to apply volume profile analysis.
With that out of the way, let’s get into how traders use the VP to identify key levels for trading.
Identify Volume Shelves
Volume shelves are often mistaken for High Volume Nodes (HVNs), but there’s a key distinction. A volume shelf refers to a broad cluster of volume, which appears as a bell-shaped curve on the volume profile. It typically forms during periods of consolidation, when buyers and sellers reach temporary agreement within a price range.
In contrast, a High Volume Node (HVN) is a single price level within that shelf where the most volume was traded. Think of the HVN as the peak, and the volume shelf as the entire mountain.
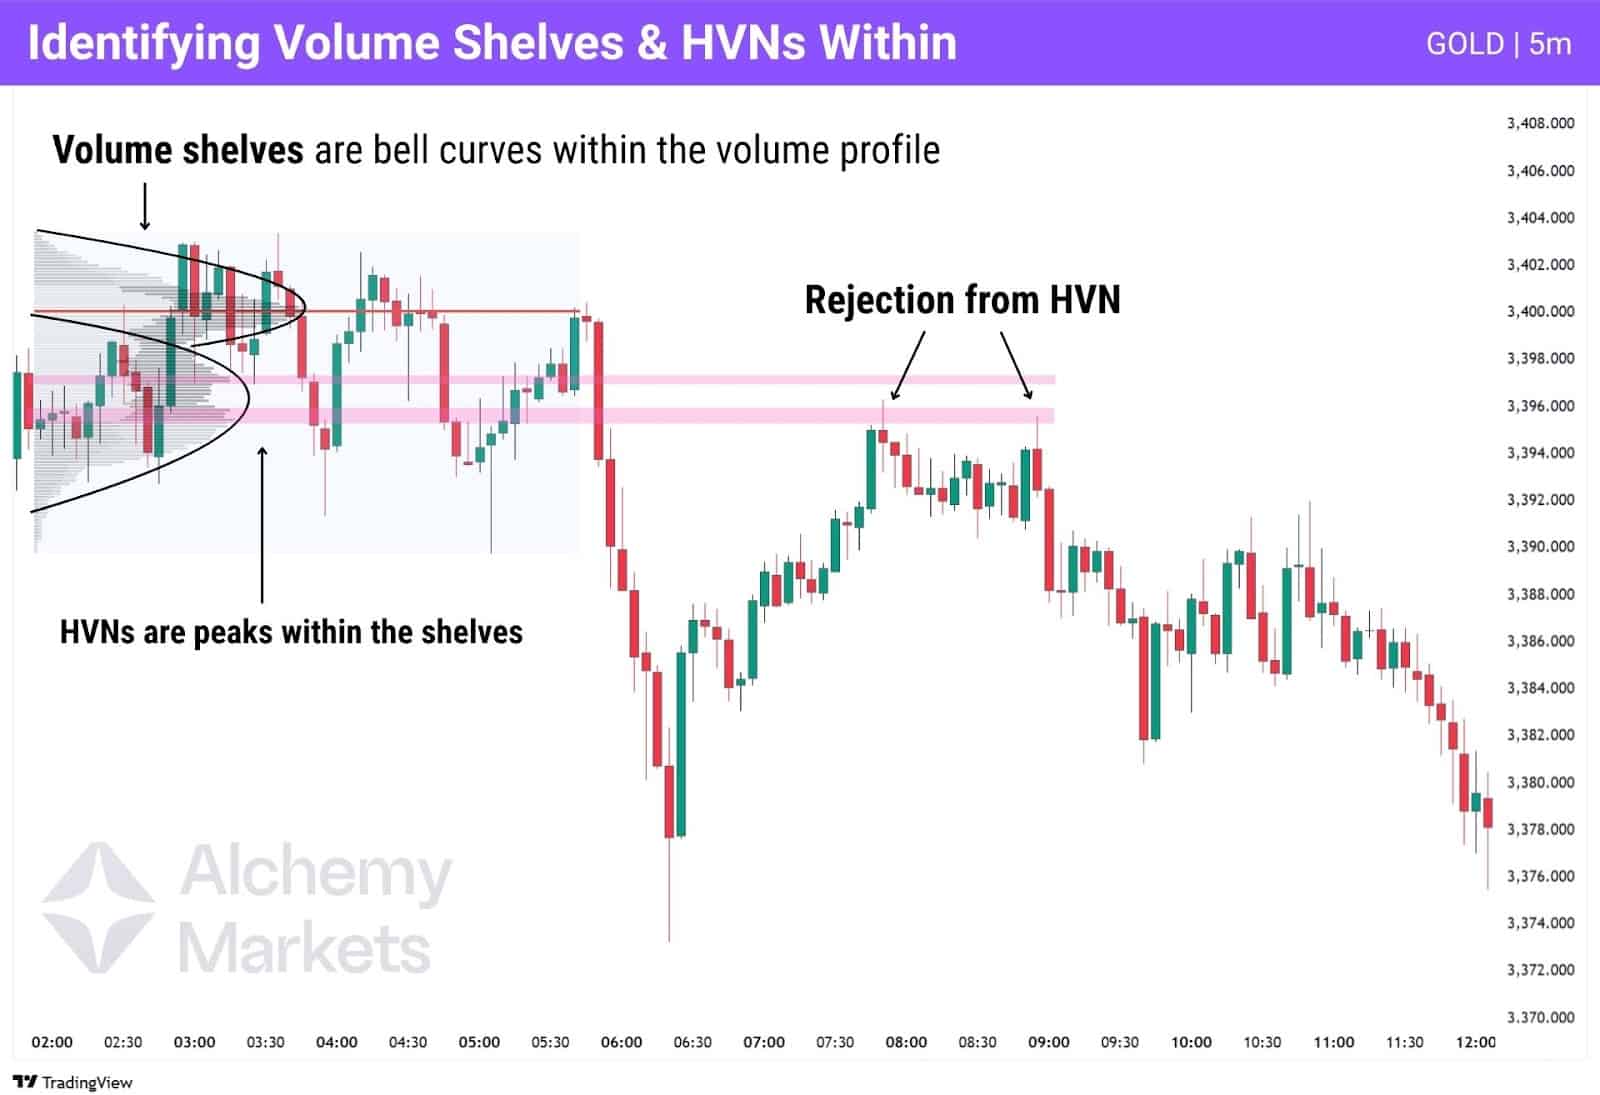
Both are useful:
- Volume shelves provide structure, with the upper and lower edges acting like support or resistance.
- HVNs can pinpoint areas within a shelf that calls for more attention, providing a key level for trades.
In the example above, the price later rejects from the HVN inside the volume shelf, a classic reaction you can use to scope entries or exits.
Support and Resistance Using the Value Area
The value area high (VAH), low (VAL), and point of control (POC) often act as key support or resistance levels. Depending on the market structure and the type of volume profile used, these zones can offer both trade entries and exits.
How you interpret them will vary based on the volume profile you’re applying:
Using Fixed Range VP
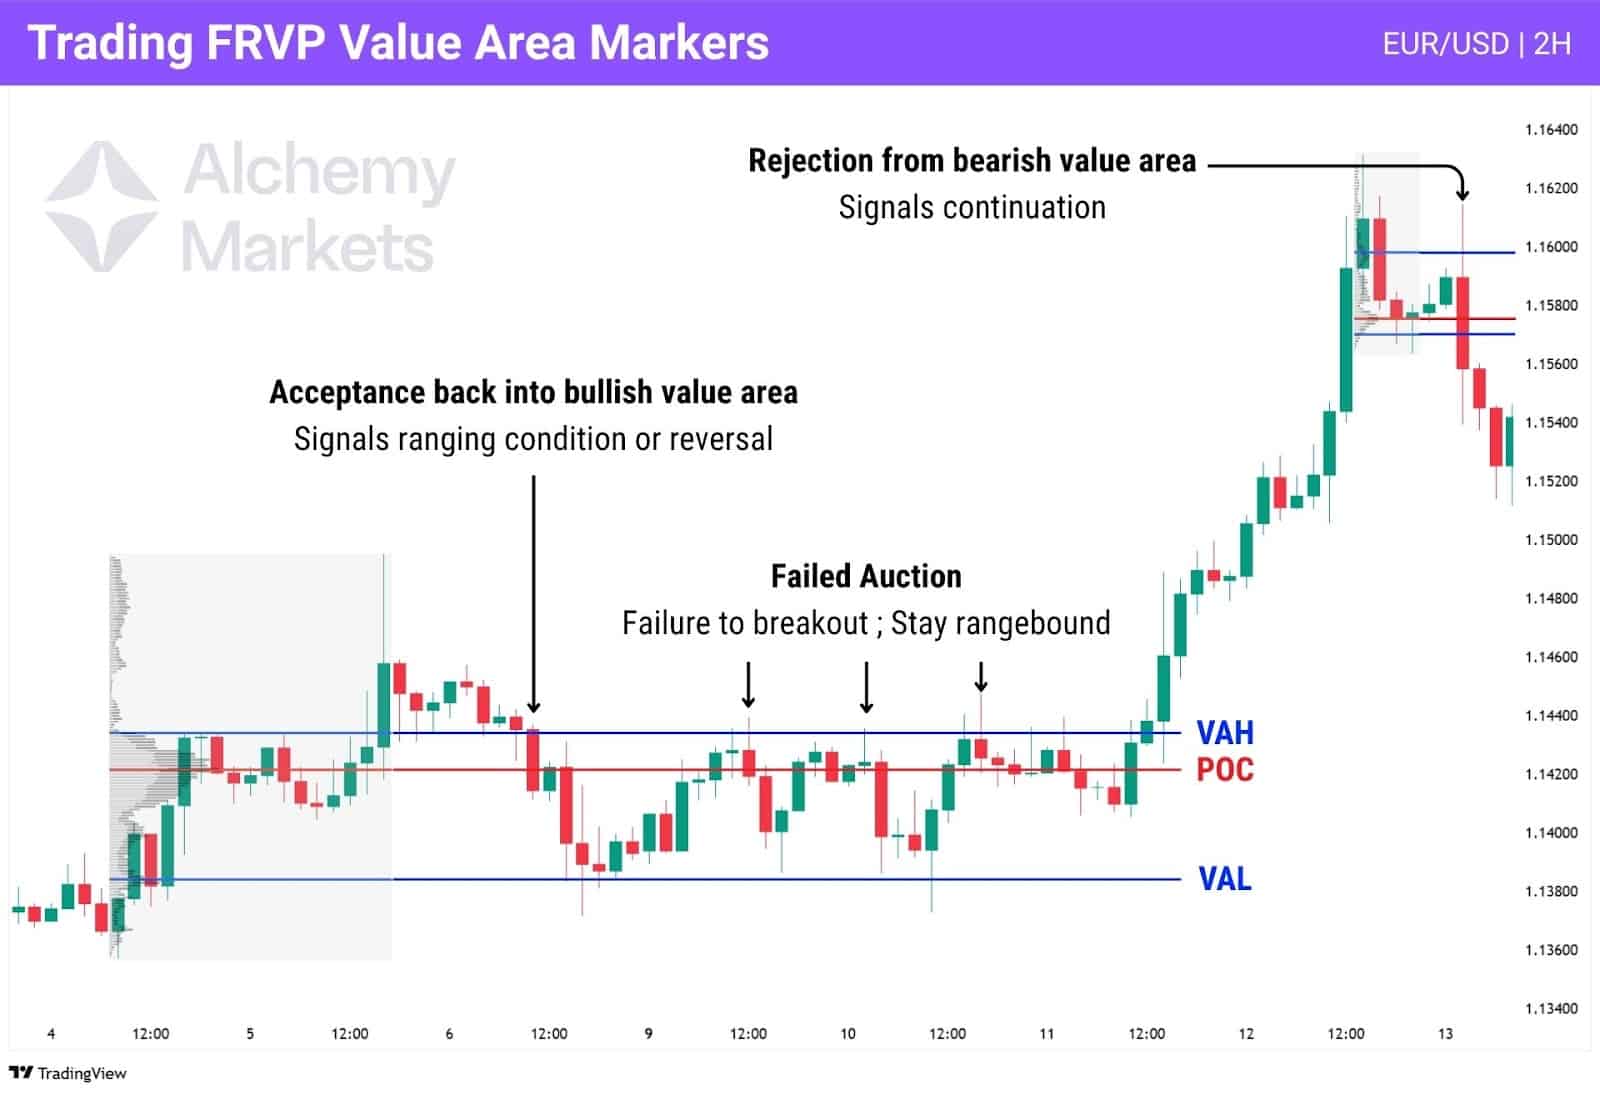
Fixed Range Volume Profile (FRVP) is best applied to completed price legs or ranges. Avoid using this kind of profile on a leg that is still developing, as the fair value range will continue shifting and offer unreliable reference points. Only once the move is complete, will the VAH, VAL, and POC be reliable points of interest.
If price returns to a previous value area and is accepted back inside, it suggests the market is reverting and may fully rotate through the range. But if price rejects the value area — either bouncing off the VAH/VAL or failing to hold inside — this often signals continuation in the original direction.
You can also trade a FRVP by noticing the high volume nodes, which are spikes/extreme peaks in the volume profile. This is a little discretionary, but combining your analysis with other tools such as Fibonacci retracement, or Moving Averages, can add a lot more confidence in the importance of a HVN.
Using Anchored VP
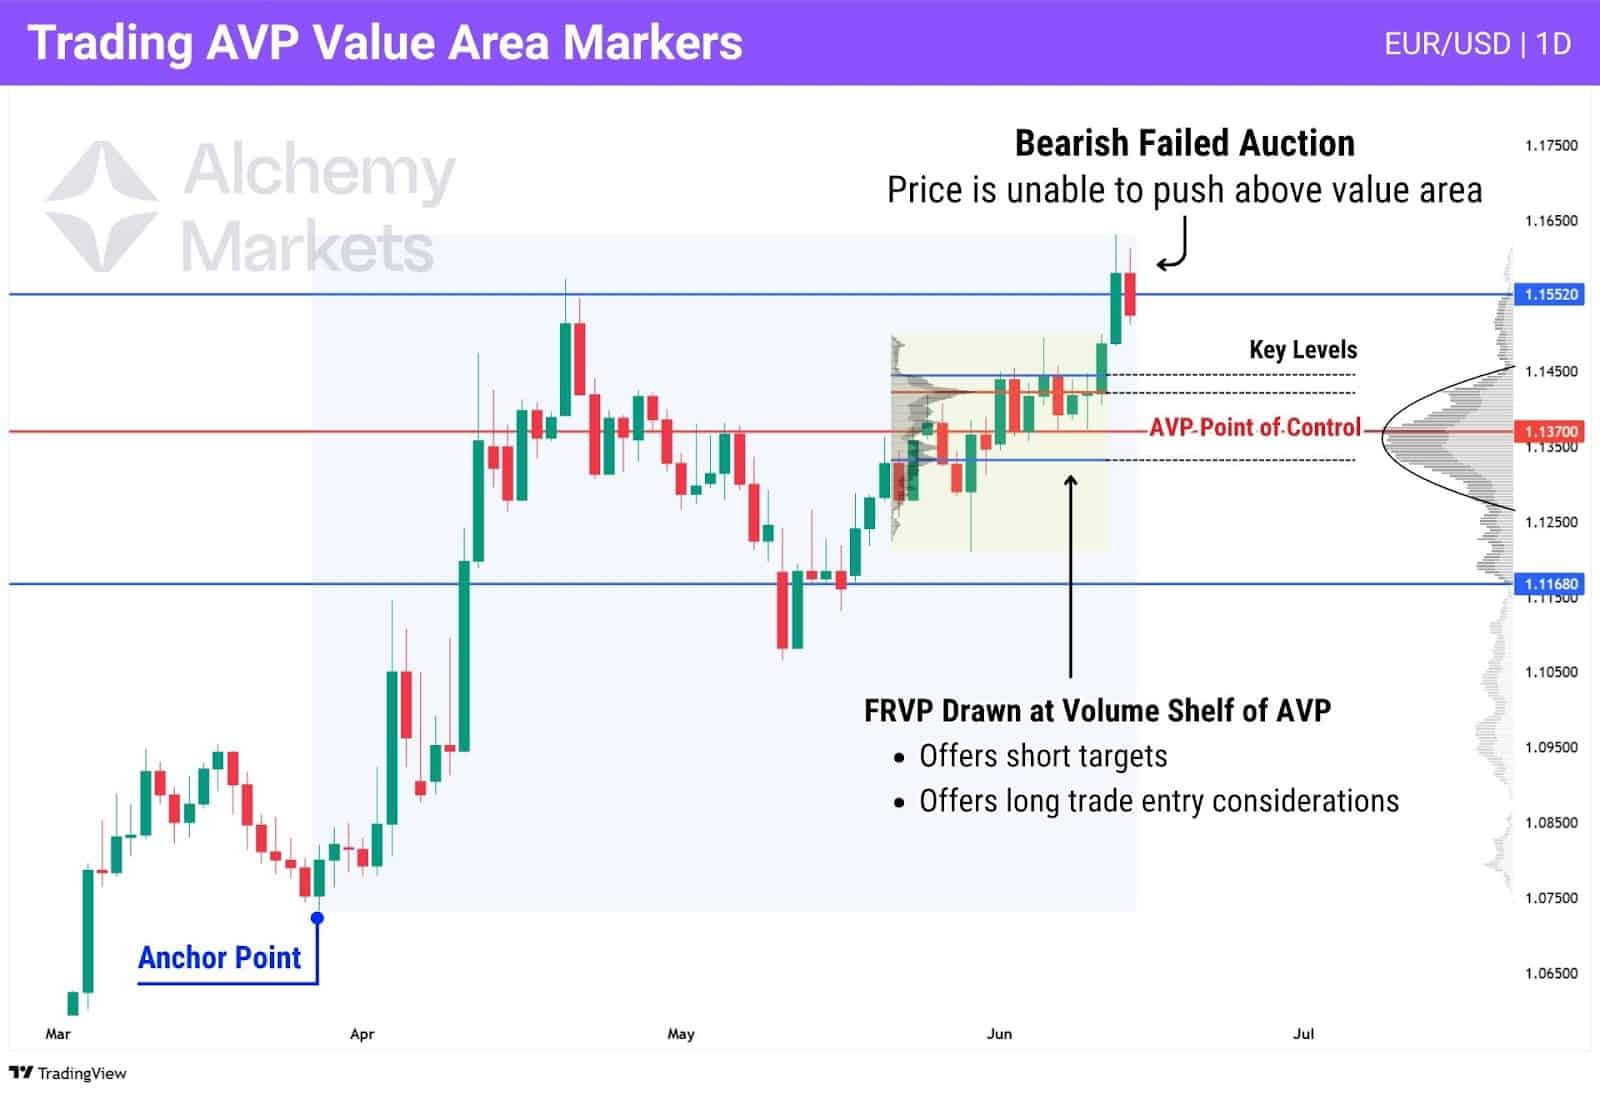
Anchored Volume Profile starts from a specific point of interest — like a swing low, a breakout candle, or a news-driven event. It updates dynamically as price evolves, giving you a real-time view of where the fair value range is forming during the move.
This makes it fundamentally different from a Fixed Range Volume Profile (FRVP). While FRVP is used to map out completed legs or consolidation zones, Anchored VP is best used to gauge a move’s conviction while it’s still unfolding.
Anchor the VP at the moment the move starts:
- For breakouts — anchor at the breakout candle
- For news moves — anchor at the candle that closes the reaction
- For trend reversals — anchor at the pivot low or high
Then observe how the price reacts to the AVP value area:
- ✅ If price and value rise together, it shows the move is backed by volume — a sign of real buyer interest.
- ⚠️ If price rises but the value area stays flat or lags behind, that’s a red flag — a sign the movement isn’t volume supported.
- 🔁 If price creates a failed auction at a VAH or VAL, that’s a sign of weakness — the price may retrace back to key levels.
Note this logic works in reverse too: if price drops and value shifts lower with it, the bearish move has strength. But if price drops while value remains flat, that’s a potential bullish divergence.
Using Session VP
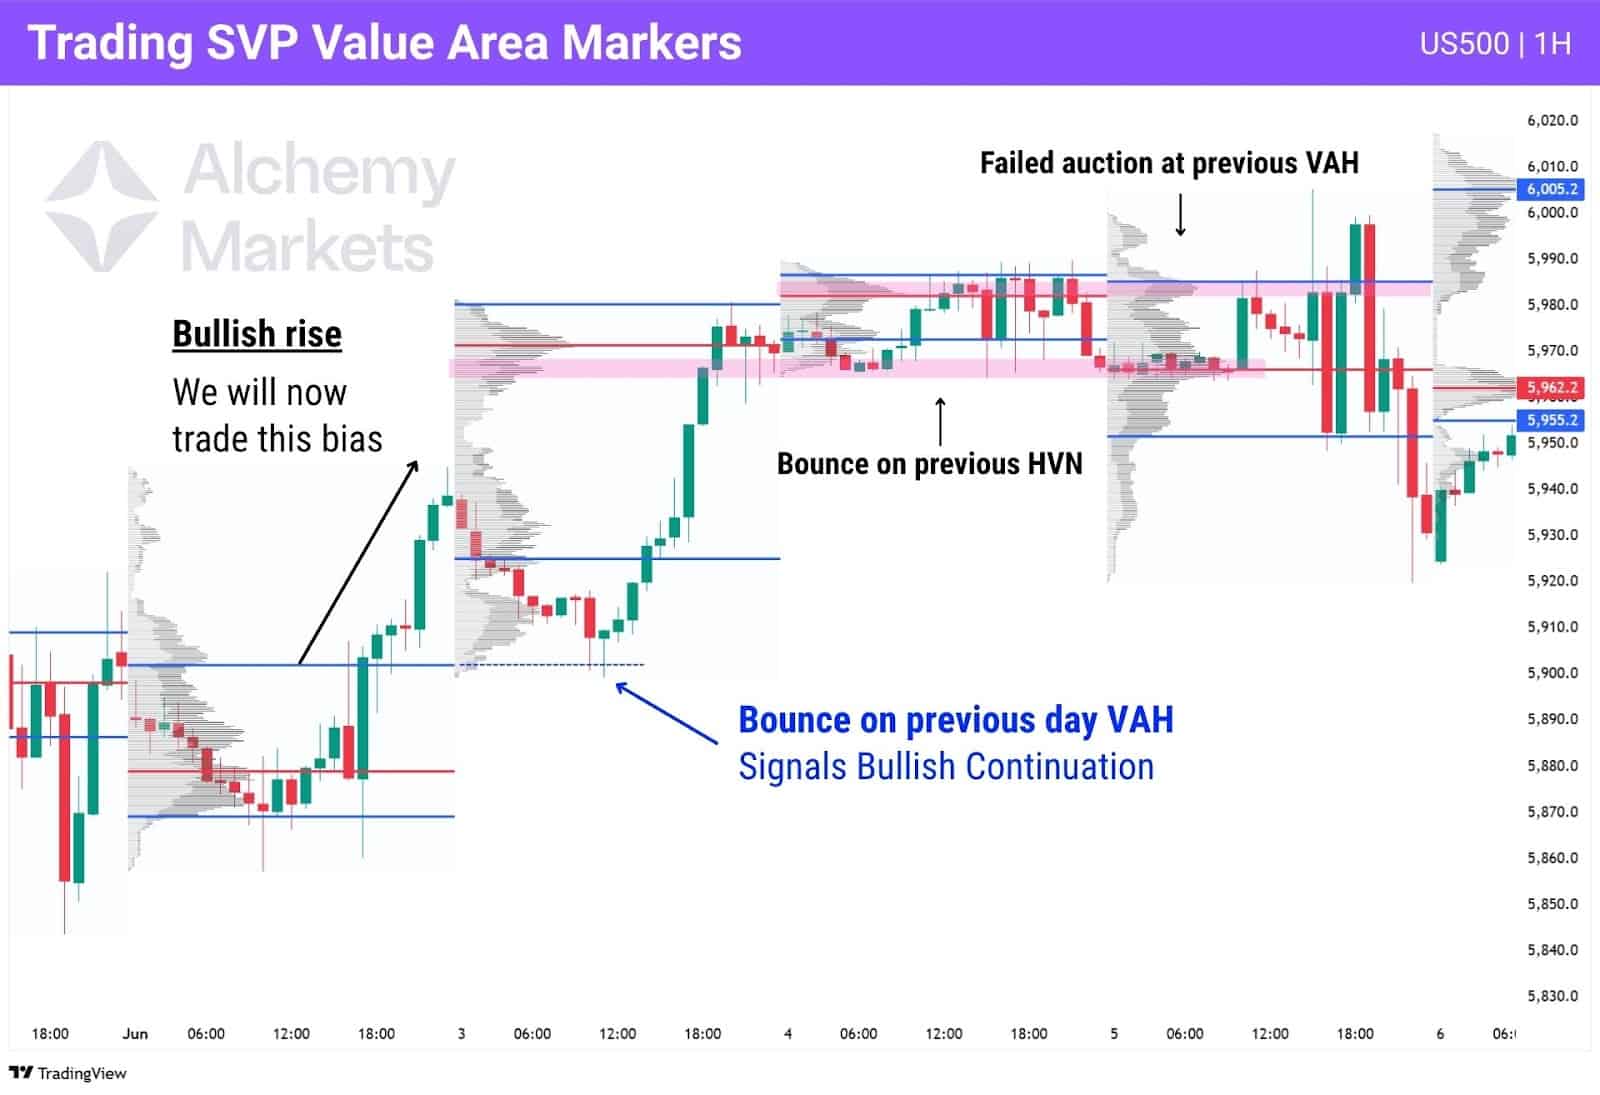
The session volume profile automatically marks out the volume profile of each trading day, or trading session such as Sydney, Tokyo, London, and New York. Just as you’d trade a FRVP, the SVP can be traded in the same ways — noticing acceptance, rejection, and failed auctions within the value area, or watching for a reaction at high volume nodes.
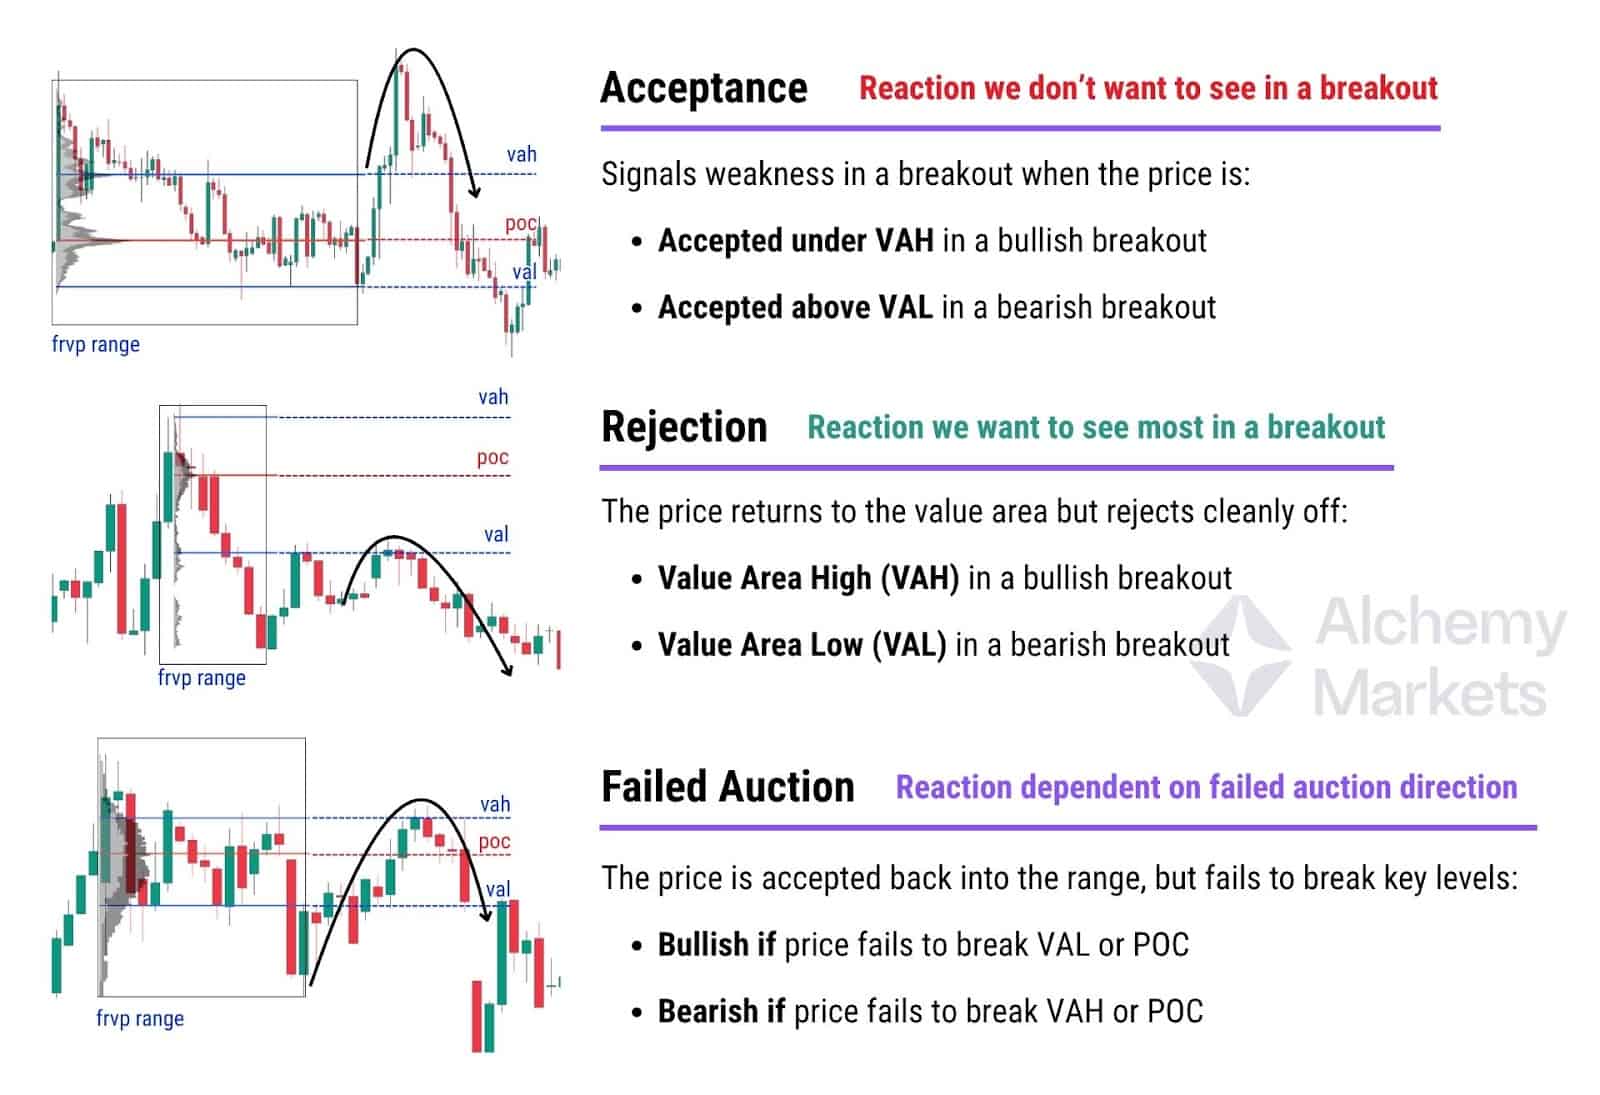
Breakouts from the Value Area
The Value Area shows where most trading activity took place, essentially where buyers and sellers previously agreed on a “fair price.” When price breaks out of this zone, it’s a signal that the market may be rethinking what that fair price should be. Therefore, if the price returns to the value area, how it reacts is highly important in signalling what the market wants to do next.
Here’s a quick refresher of each possible outcome — Acceptance, Rejection, and Failed Auction:
Now that you know what reactions to look for, let’s apply it to a real-world setup — combining market structure with volume profile.The goal is to identify whether a breakout is likely to hold, or fade.
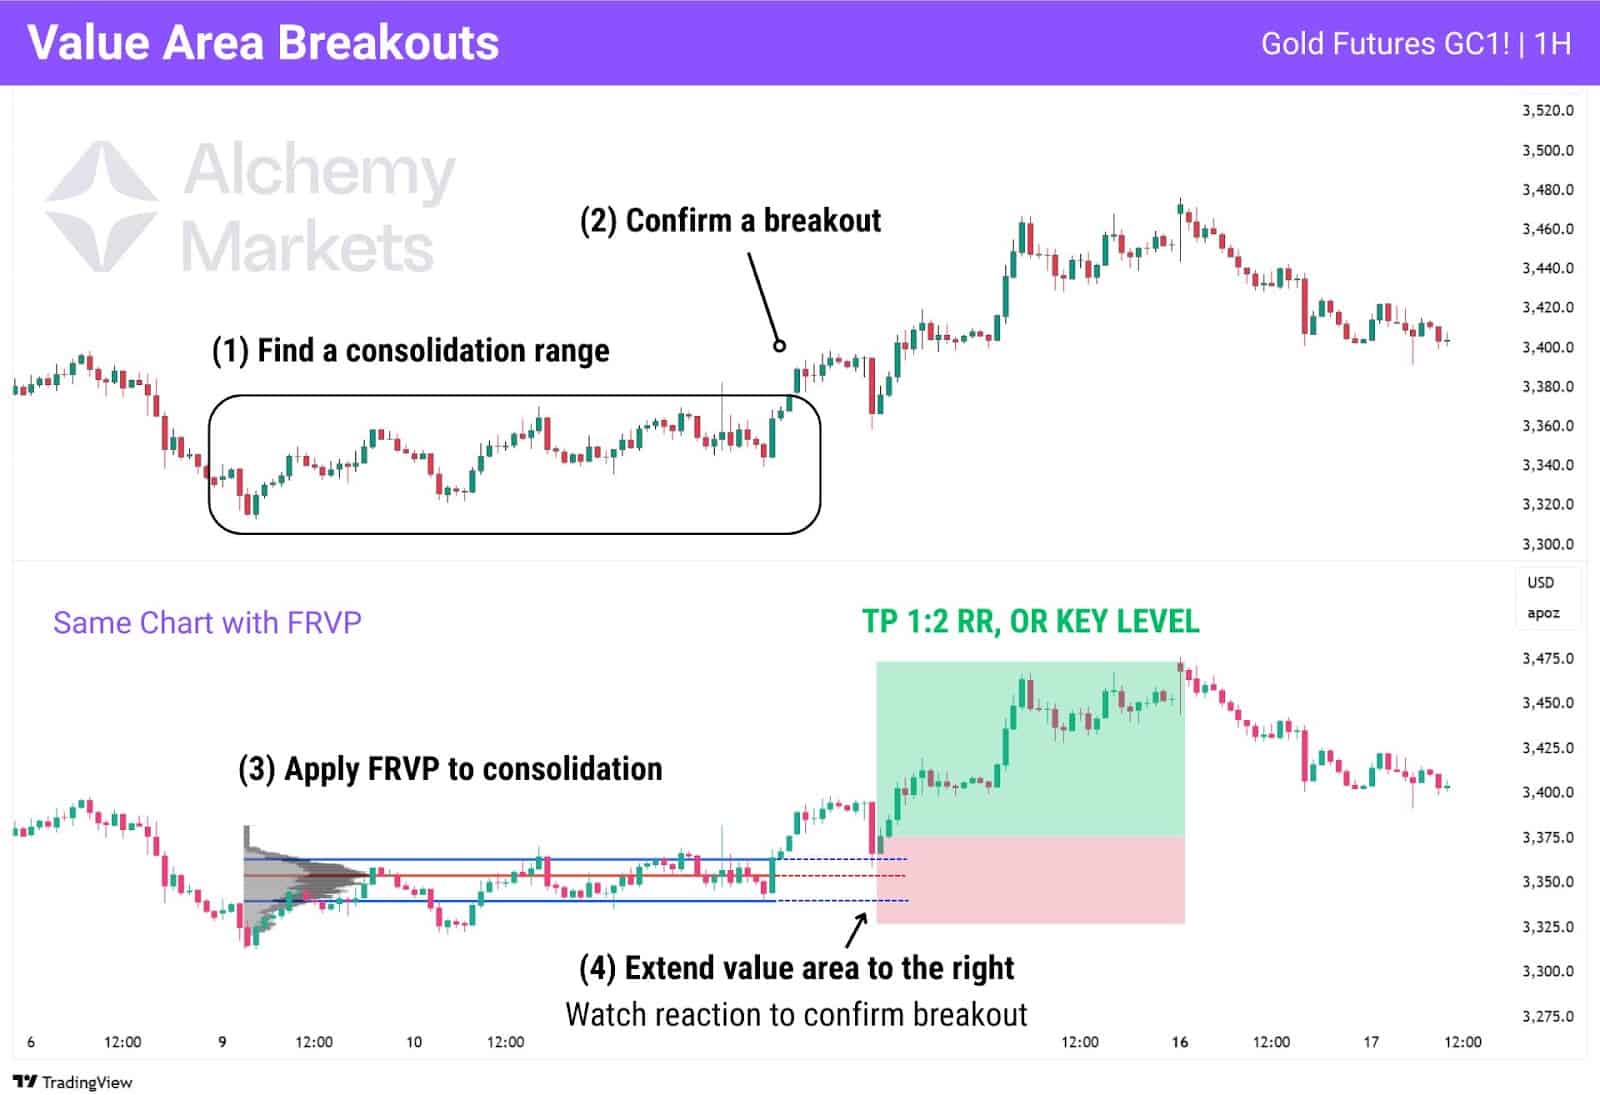
In this Gold Futures 1H chart, here’s how to apply volume profile step-by-step:
- Identify a consolidation range — find a tight area where price was moving sideways.
- Wait for a breakout — note the direction (bullish or bearish) and confirm it’s clean.
- Apply Fixed Range Volume Profile to the consolidation — exclude breakout candles so you’re measuring the true “value area” the market is escaping from.
- Extend the value area to the right — this gives you reference levels (VAH, VAL, and POC) to watch when price returns.
- If the breakout is bullish, watch for a rejection at the VAH or failed auction at the POC/VAL.
- If the breakout is bearish, watch for a rejection at the VAL or failed auction at the POC/VAH.
Effectively, you want to observe a rejection or aligning failed auction reaction to confirm the breakout. Once that’s done, you can feel free to enter a trade with your own stop loss (SL) and take profit (TP) rules. A simple approach is to place your SL below the recent low or the entire value area, and the take-profit at either at 1:2 risk-to-reward ratio, or at a significant key level.
High Volume Node Retracements
High volume nodes (HVNs) refer to the peaks in a volume profile, where trading volume was significantly higher. These areas can be traded as support or resistance, but their main strength lies in validating trading levels.
Take, for instance, this range on the AUD/USD. The price chopped around within a range, but it’s unclear where the exact support and resistance are if you just eyeball the level. By identifying HVNs, we can now clearly see which prices had more trading volume, and therefore more significance. This allows us to pinpoint stronger horizontal supports/resistances to trade from.
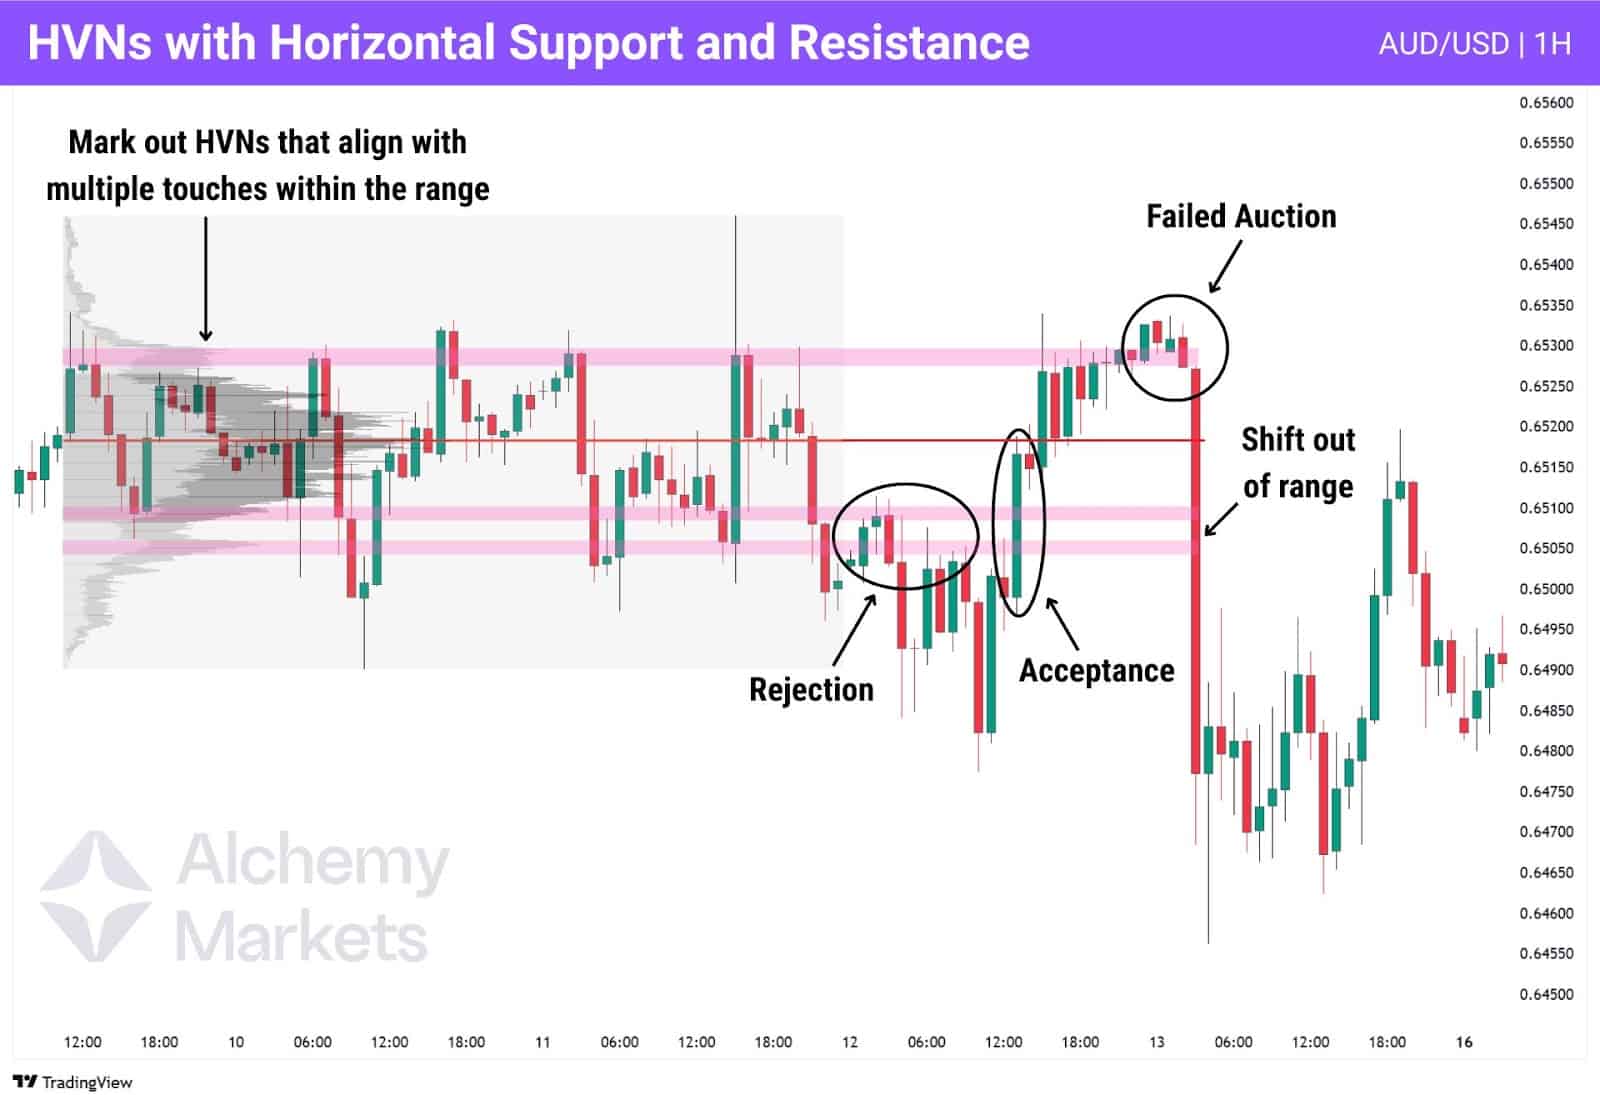
To trade them with precision, follow this sequence:
- Wait for a range breakout: Identify when price closes cleanly outside of the prior consolidation zone.
- Draw the FRVP over the full range preceding the breakout.
- Mark the HVNs that align with key touches within the range.
- Observe the reaction when price returns to those HVNs post-breakout.
The key principles to observe here are the same. Is it a rejection? Continuation signal. Is it acceptance? Mean reversion signal. Is it a failed auction? That’s a reversal signal.
HVNs can also be used to strengthen decision-making around Fibonacci retracement levels.
The Fibonacci retracement tool outlines common pullback zones — 38.2%, 50%, 61.8%, 78.6%, etc. — but with so many options, traders can find it difficult to pinpoint the best entry.
To simplify this, overlay Fibonacci retracements with HVNs to highlight the most meaningful levels.
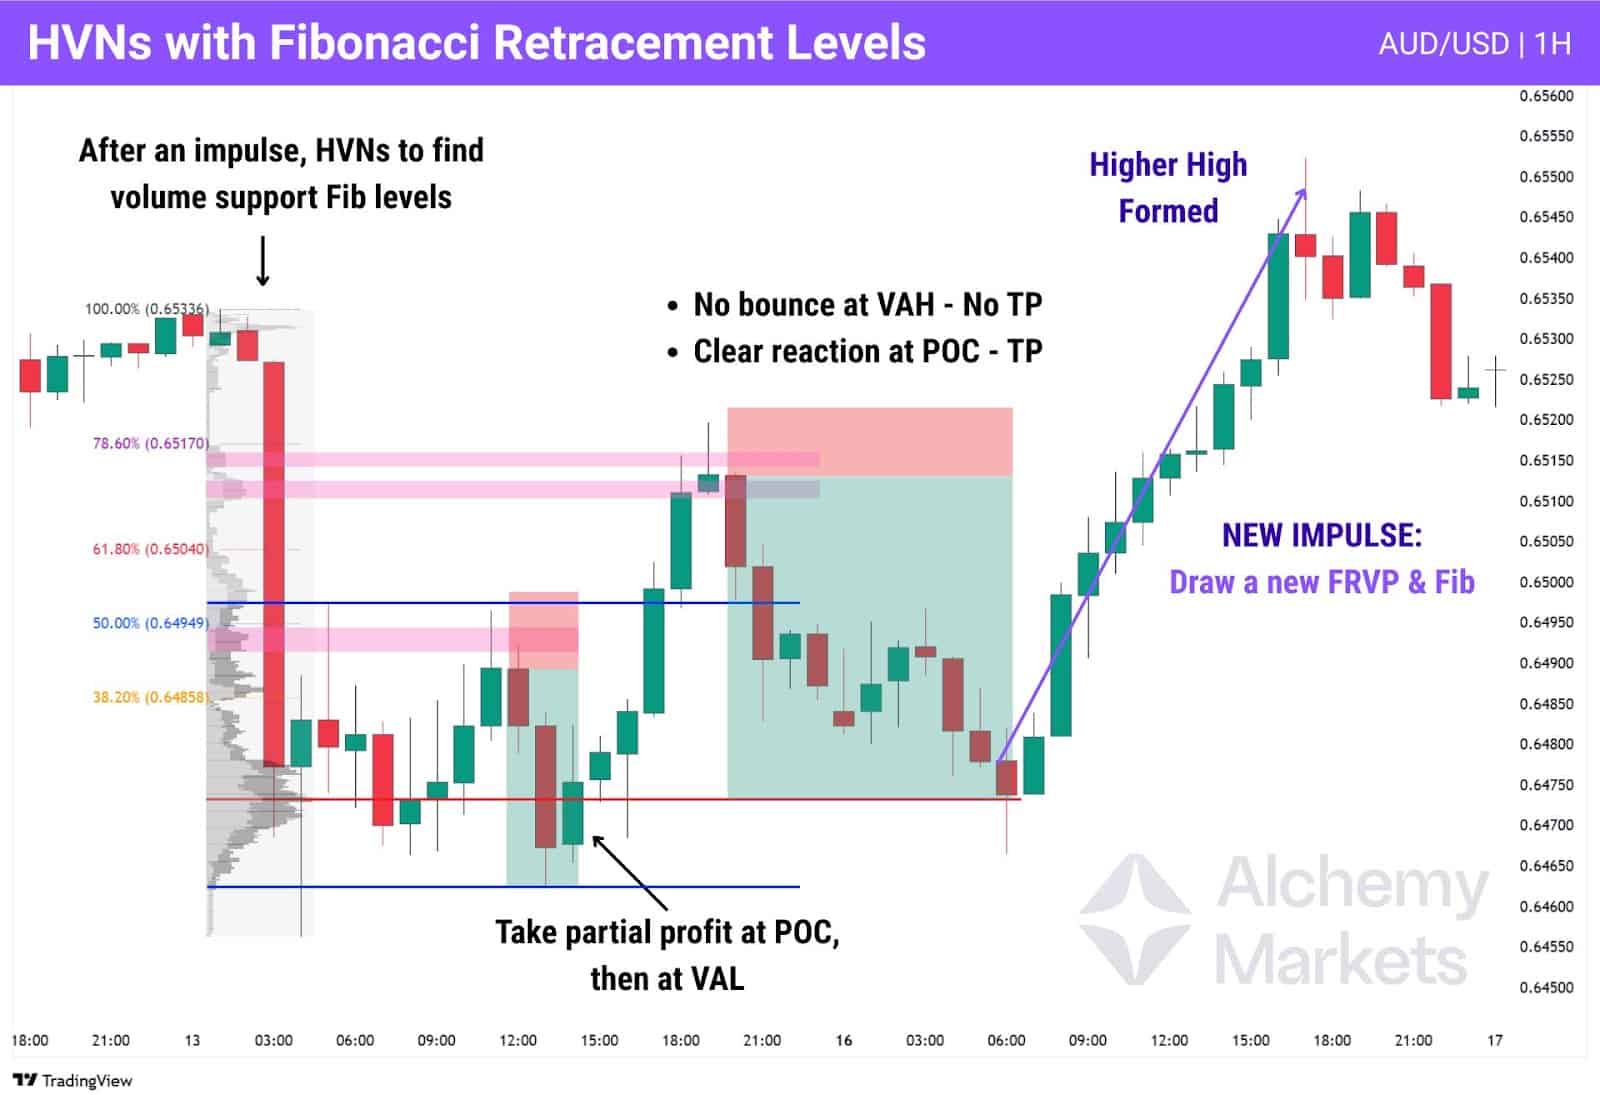
After a clear impulse move (up or down) that creates a new high or new low, you can use the Fib and FRVP to find key zones for trading:
- Draw a Fib retracement over the entire impulse leg. If it’s a leg up, draw from swing low to swing high. Leg down, vice versa.
- Overlay a FRVP on the same move.
- Focus only on Fib levels that align with HVNs — these are statistically stronger retracement zones.
- Take Profit at Value Area Markers — if a clear rejection occurs at the VAH, VAL or POC, consider taking partial profit.
In the chart above, AUD/USD formed a strong bearish impulse. The 50% retracement lined up with a high volume node, offering a natural short entry. Price pulled back into that zone and dropped toward the POC and VAL, where partial profits could be taken.
Then, at a second occasion, the price climbed higher again towards higher Fib levels. The 61.8% Fib was skipped due to thin volume, but the move extended to the 78.6% level, where two smaller HVNs provided a more reliable trade entry, which played out. Eventually, price collapsed through the VAH — a valid TP zone, but ignored here as no reaction occurred — before finding support at the POC.
| Key note: These sequences highlight how HVNs and value area markers (VAH, VAL, POC) can act as effective entry and exit zones — but only if confirmed by price behaviour. Acceptance, rejection, or failed auction at these levels is what gives them meaning. |
Low Volume Node Breakouts
Low Volume Nodes (LVNs) begin where High Volume Nodes (HVNs) end and represent price zones with minimal historical trading activity. These areas often reflect low market interest, making them zones to watch for fast moves or breakouts.
That being said, the edges of a LVN can be highly reactive, as it’s shared with a high volume node. Trading around LVNs means closely watching this edge — if price fails to hold there, it can swiftly move through the LVN due to the lack of trading intent within that zone. If it holds, a reversal is likely to occur (as it is also the edge of a high volume node).
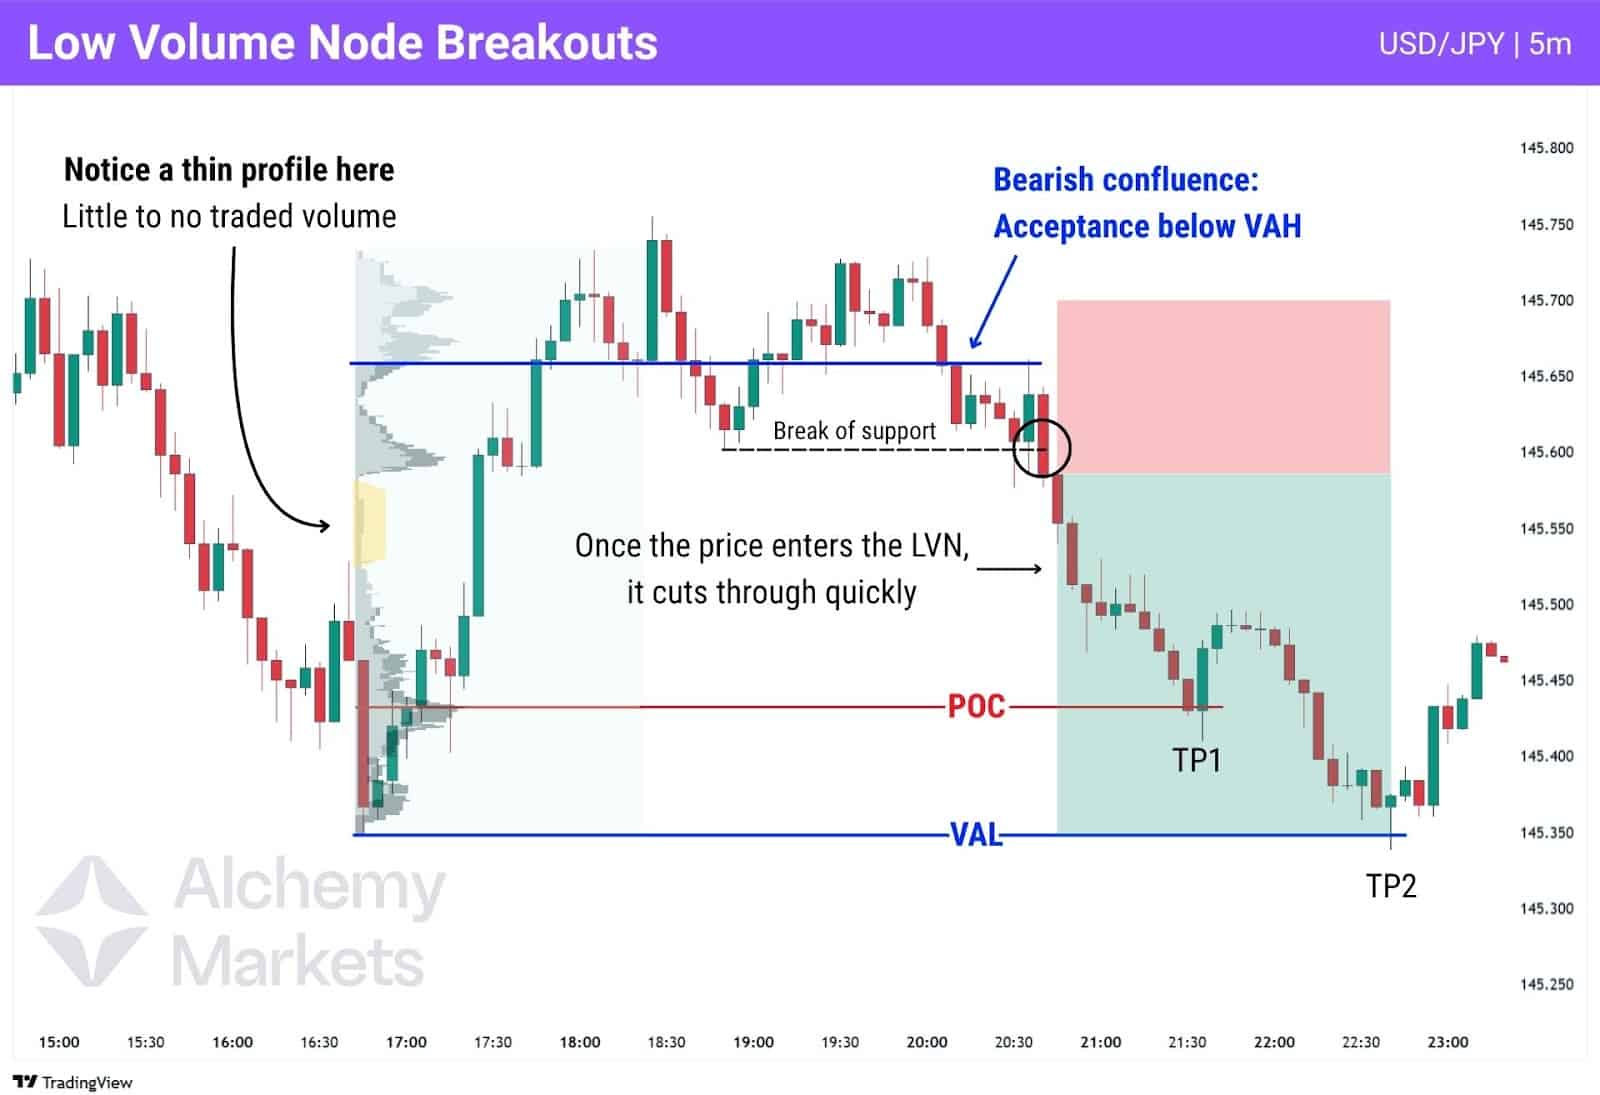
In this chart, we spot a thin volume profile forming just within the 145.000 level — a clear Low Volume Node (LVN). This zone signals an area of historically low interest, meaning if price breaks in, there’s little to hold it back.
After consolidating near resistance, price breaks below support and confirms acceptance beneath the Value Area High (VAH). That’s the first sign of weakness — and a potential invitation into the LVN below.
Once price enters the LVN, it behaves exactly as expected: it cuts through the zone quickly with barely any pause. The lack of historical volume means fewer orders to absorb, resulting in a swift drop toward the Point of Control (POC) and eventually the Value Area Low (VAL).
Take-Profit levels (TP1 and TP2) are placed logically at these volume landmarks, showing how traders can use volume profile not just for entries — but to structure exits based on where the market is likely to slow down or reverse.
Trading P and B-Shaped Volume Profiles
Over the years, traders have observed that volume profiles can make distinct shapes — not dissimilar to how chart patterns such as the Triangle, or a double top pattern — were discovered.
These volume profile shapes can look like a p-shape, b-shape, and d-shape, all of which signify market conditions and intent. Learning how to read these shapes can give traders a trading bias for the next trading day, if used correctly.
P-shaped and b-shaped profiles are best traded using the SVP (Session Volume Profile), where you’re gauging each trading day’s volume distribution. This allows traders to build expectations for how price action may develop the next day.
| Note: When using volume profile shapes to trade, context is king. You would still apply the same logic of acceptance, rejection, and failed auction, or other technical analysis tools to execute your trades. |
P-Shaped Volume Profile
A P-shaped profile forms when the majority of volume is concentrated in the upper half of the range, with a thin lower range. It typically appears after a short squeeze or aggressive buying, where sellers were in control earlier but buyers took over.
This profile indicates bullish momentum and suggests a higher likelihood of the next day being bullish, unless the shape fails (i.e. price closes below 50%). If price closes below the midpoint, it reflects a failed squeeze, and the next day may chop or reverse.
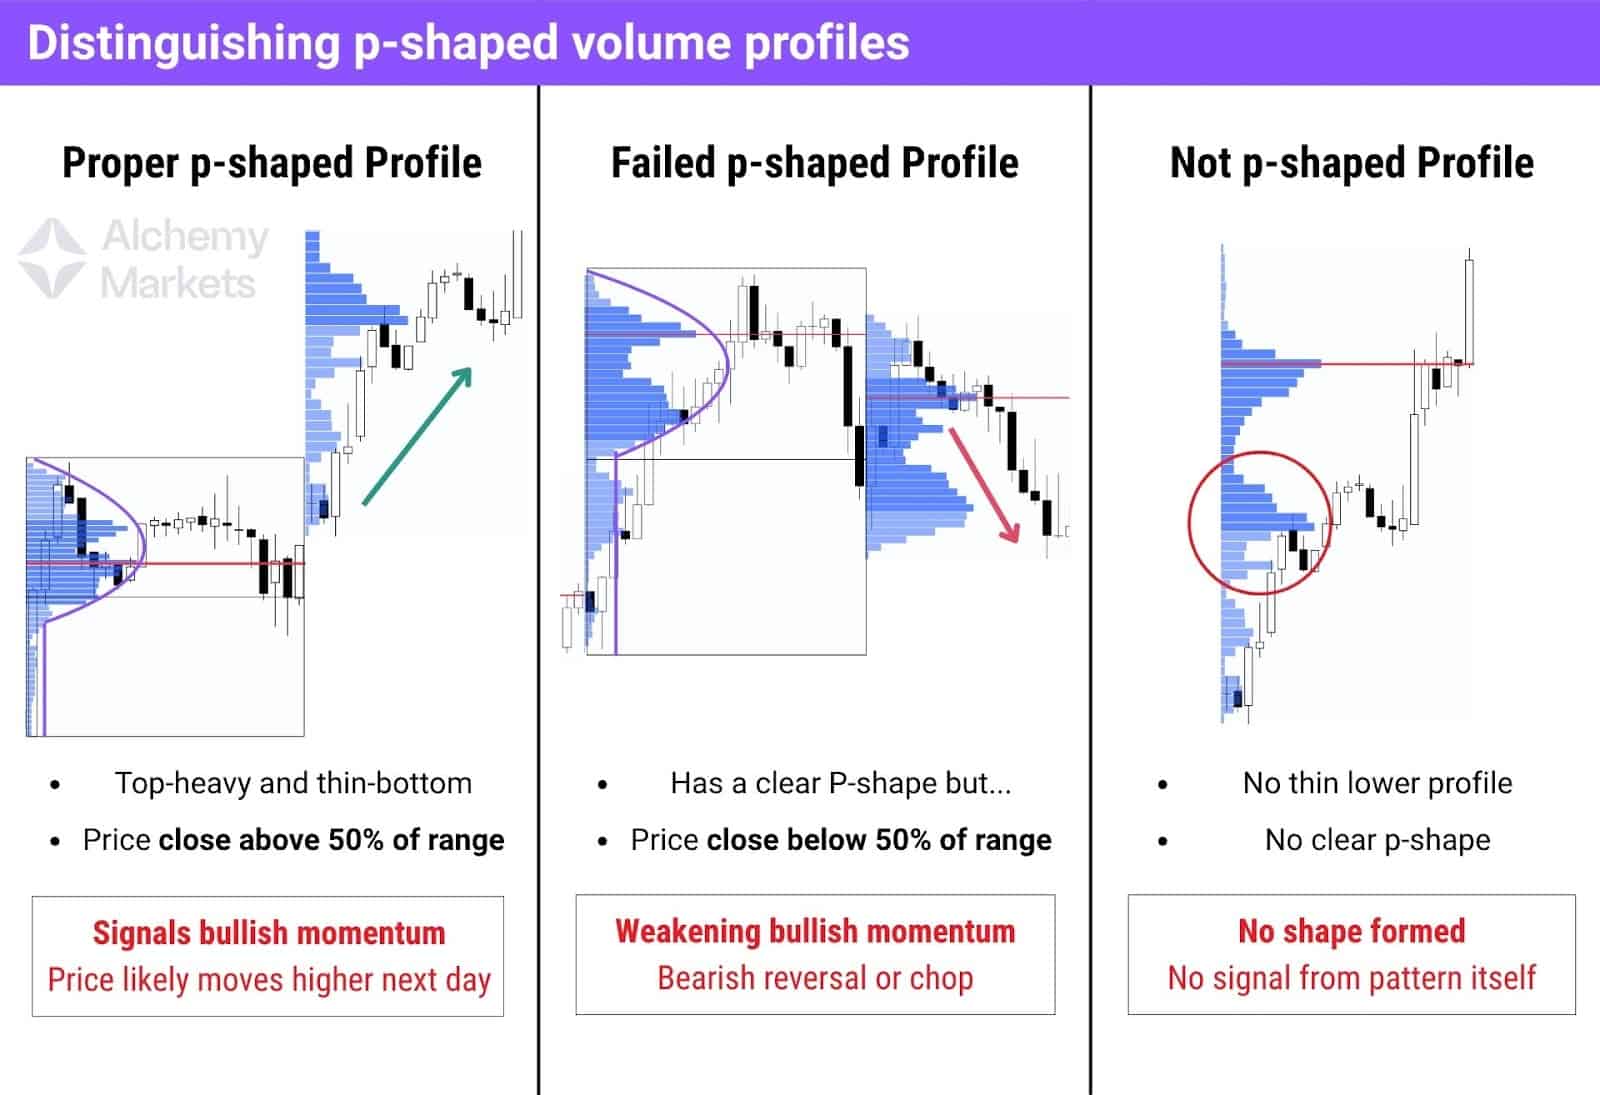
How to Read It:
- The top-heavy bulge shows where price was accepted after aggressive buying.
- The thin lower area suggests prior downward auction was rejected.
- If price closes in the upper half, momentum is still with the buyers, validating the p-shape profile.
These are most effective when spotted in a prolonged downtrend, as it is an indication of a short squeeze, often leading to bullish trend reversals.
B-Shaped Volume Profile
The classic b-shape appears when volume is concentrated in the lower half, forming after a long liquidation or impulsive sell-off. The profile looks like a lowercase “b”, which has a thick volume cluster at the bottom, and thin profile at the top. If price closes above the midpoint, it’s a failed b-shape, meaning sellers lost grip, a potential signal for a bullish reversal or sideways action.
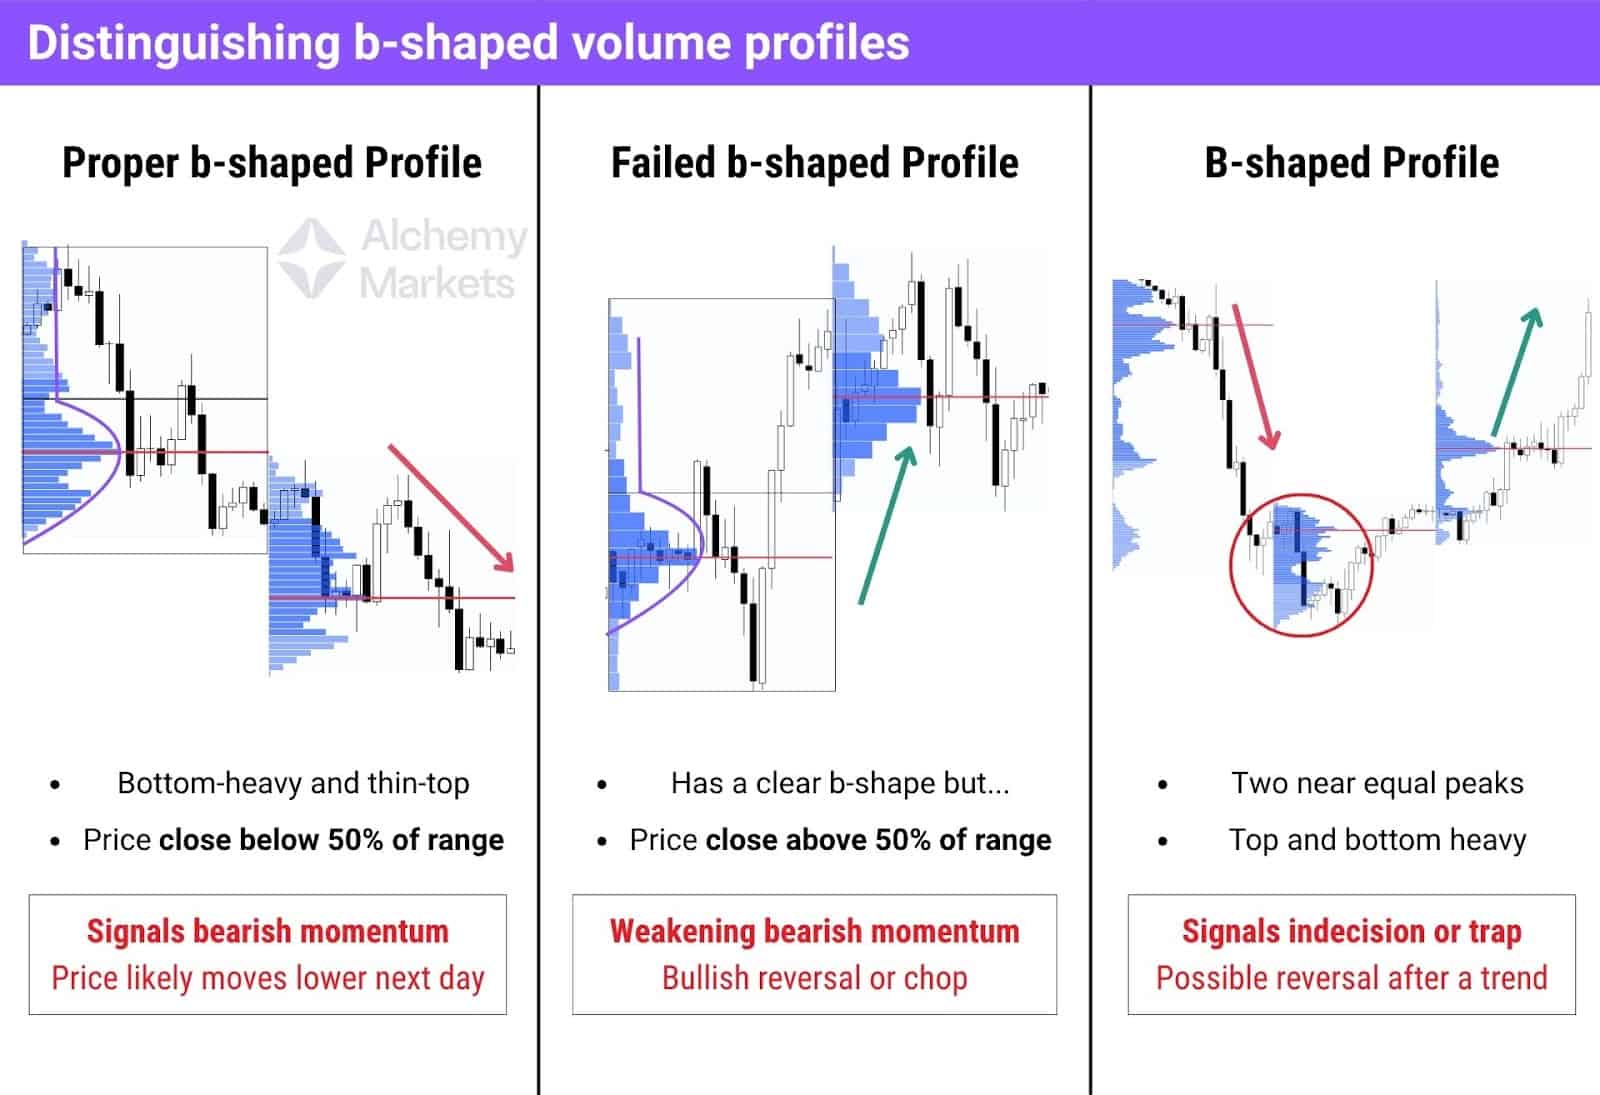
How to Read It (Lowercase b-shaped profile):
- The lower bulge shows where selling pressure was absorbed.
- The thin upper section suggests buyers were unable to push the price up.
- A close below the midpoint confirms bearish momentum likely to continue.
Additionally, there is a B-shaped profile, where the B is uppercase. These patterns form when volume is concentrated at both the top and bottom of the range, with a clear low-volume zone in the middle. This typically reflects a two-sided auction, meaning both buyers and sellers were active and aggressive at different points, but neither side was in control.
Uppercase B-shaped profiles can occur during uptrends or downtrends, and ultimately signals indecision. While it does not signal a clear direction, it provides a bias towards the 50% range the price closes at. Traders can think of B-shaped profiles like doji candles, where reversals commonly ensue after a brief consolidation.
Lowercase b-shaped profiles are most effective when spotted in a prolonged uptrend, as it is either an indication of a long squeeze, often leading to bearish trend reversals.
D-Shaped Volume Profile
The D-shape represents balance, where neither buyers nor sellers dominate. Volume is evenly distributed with a symmetrical “belly” in the middle of the range, often appearing after a trending day when the market takes a breather.
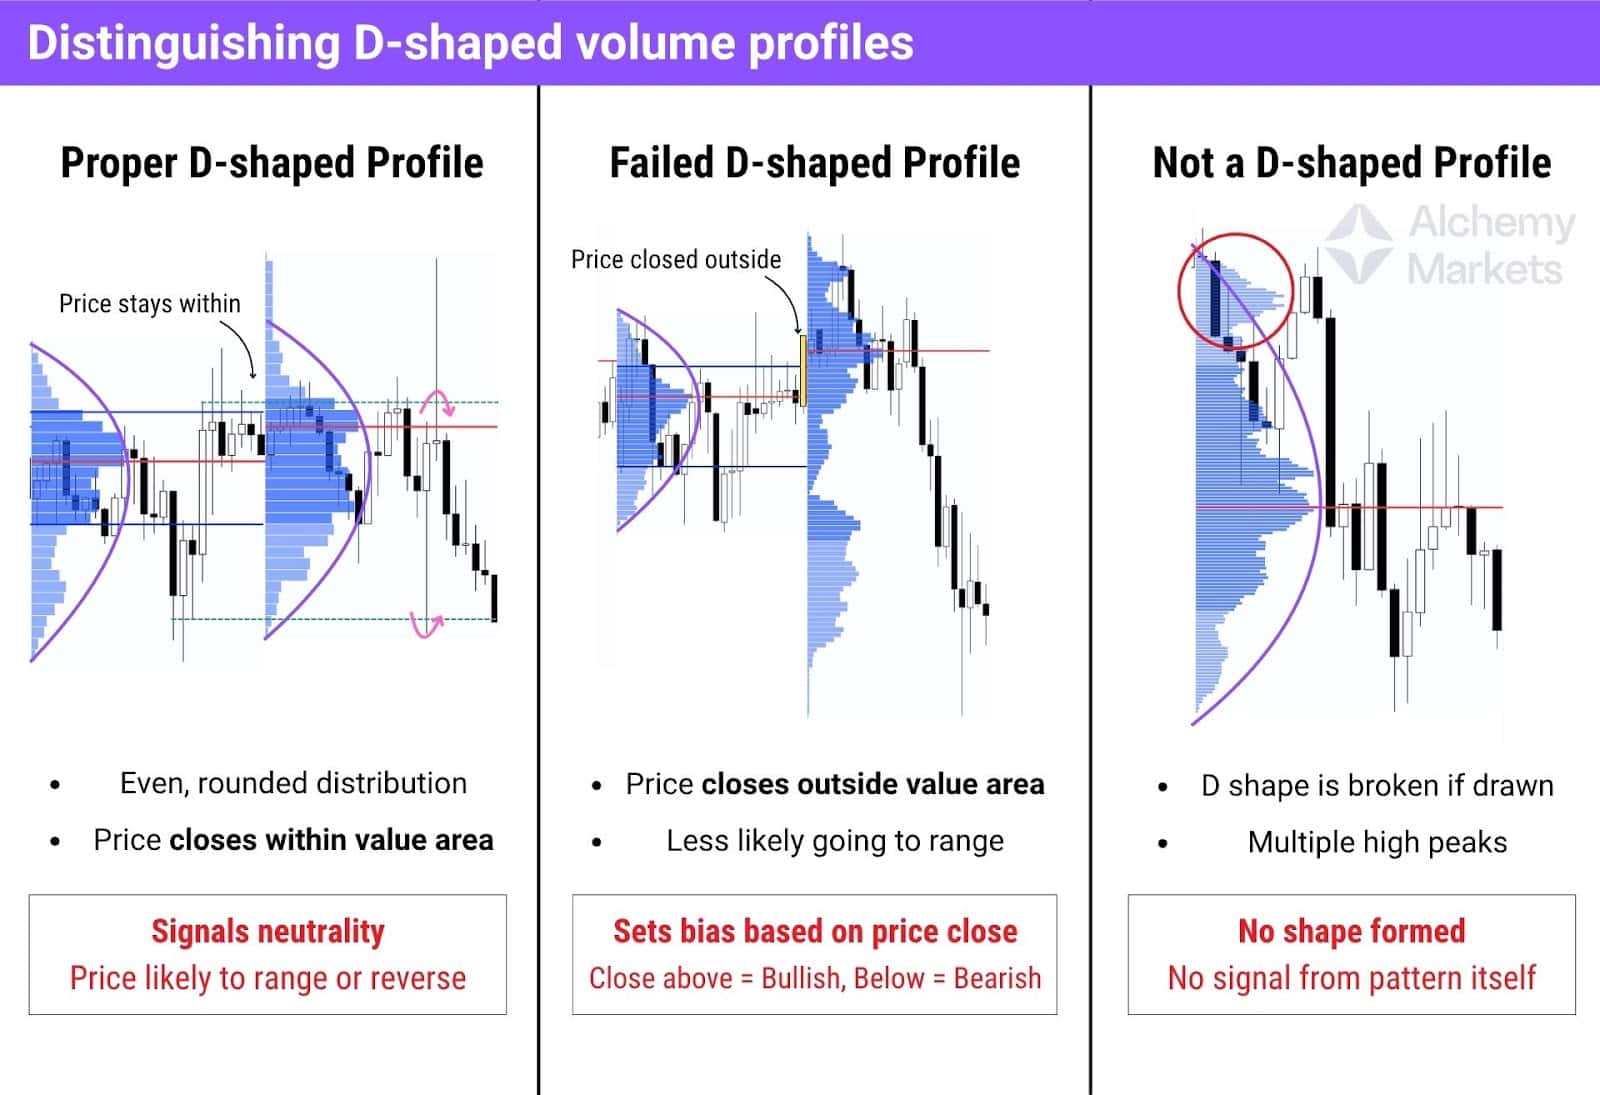
How to Read It:
- The round middle shows consensus — a “fair value” area.
- Price inside the value area suggests the market is still balanced.
- Expect range-bound trading with reactions at the edges.
If price breaks and closes outside the value area, that’s a failed D-shape, and bias shifts depending on direction. Closing above the value area is bullish; closing below is bearish.
Generally, d-shape volume profiles hint at range trading opportunities in the following day, which the top and bottoms of the previous day may be well-respected, until it is clearly broken in a direction.
Thin Volume Profile
Thin Volume Profiles are one of the most reliable setups for finding directional trades.
They form when price moves aggressively in one direction, leaving behind an extended area with low trading volume — a sign that many orders were missed. This creates imbalance, and markets tend to return to these areas later to “fill the gaps.”
Think of it like a waiter rushing through a busy restaurant… some tables will get missed. Eventually, they’ll return to serve those forgotten orders. That’s what tends to happen after a thin volume profile has formed.
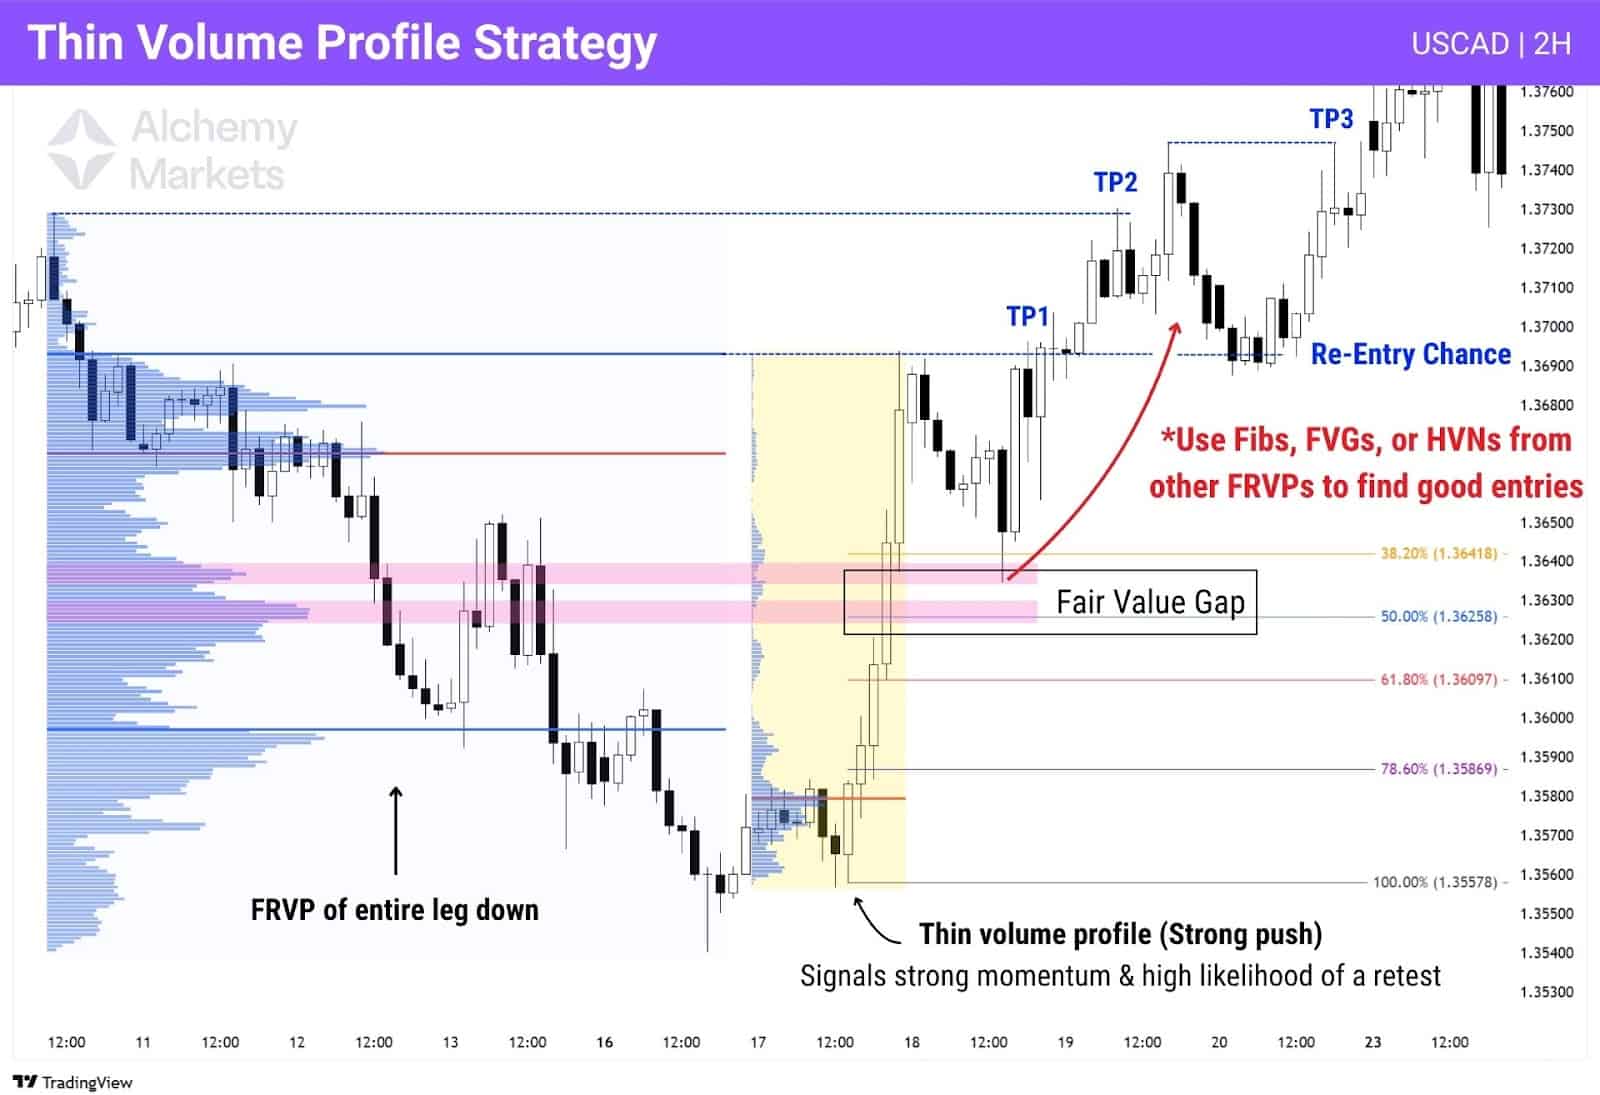
Here’s how to trade a thin VP:
- Start by identifying a strong push — a sequence of large candles trending in one direction with little pullback. This confirms momentum and sets your directional bias. If it pushes up, you lean long. If it pushes down, you lean short.
- Next, spot the thin volume zone using a Fixed Range Volume Profile (FRVP).
- Then, look for where the price might pivot from. Use confluence tools like a Fair Value Gap, Fibonacci retracement levels, or nearby high-volume nodes from prior moves. The more aligned they are, the stronger the zone.
- When price retraces into that area, you’ve got your setup. Take the trade in the direction of the original move.
- Target logical levels like recent highs or lows, depending on bias.
- Don’t panic about potential missed profits, you’ll get a chance to reenter a trade if key resistances are broken and retested.
Volume Accumulation Setup
This setup trades the reaction when price returns to a previous consolidation zone, formed after an impulsive move. Instead of drawing a volume profile over the move itself, we apply it to the tight range that follows—but only if the next leg continues in the same direction. This range often reflects where larger players positioned themselves, and therefore could provide reversals in the short term.
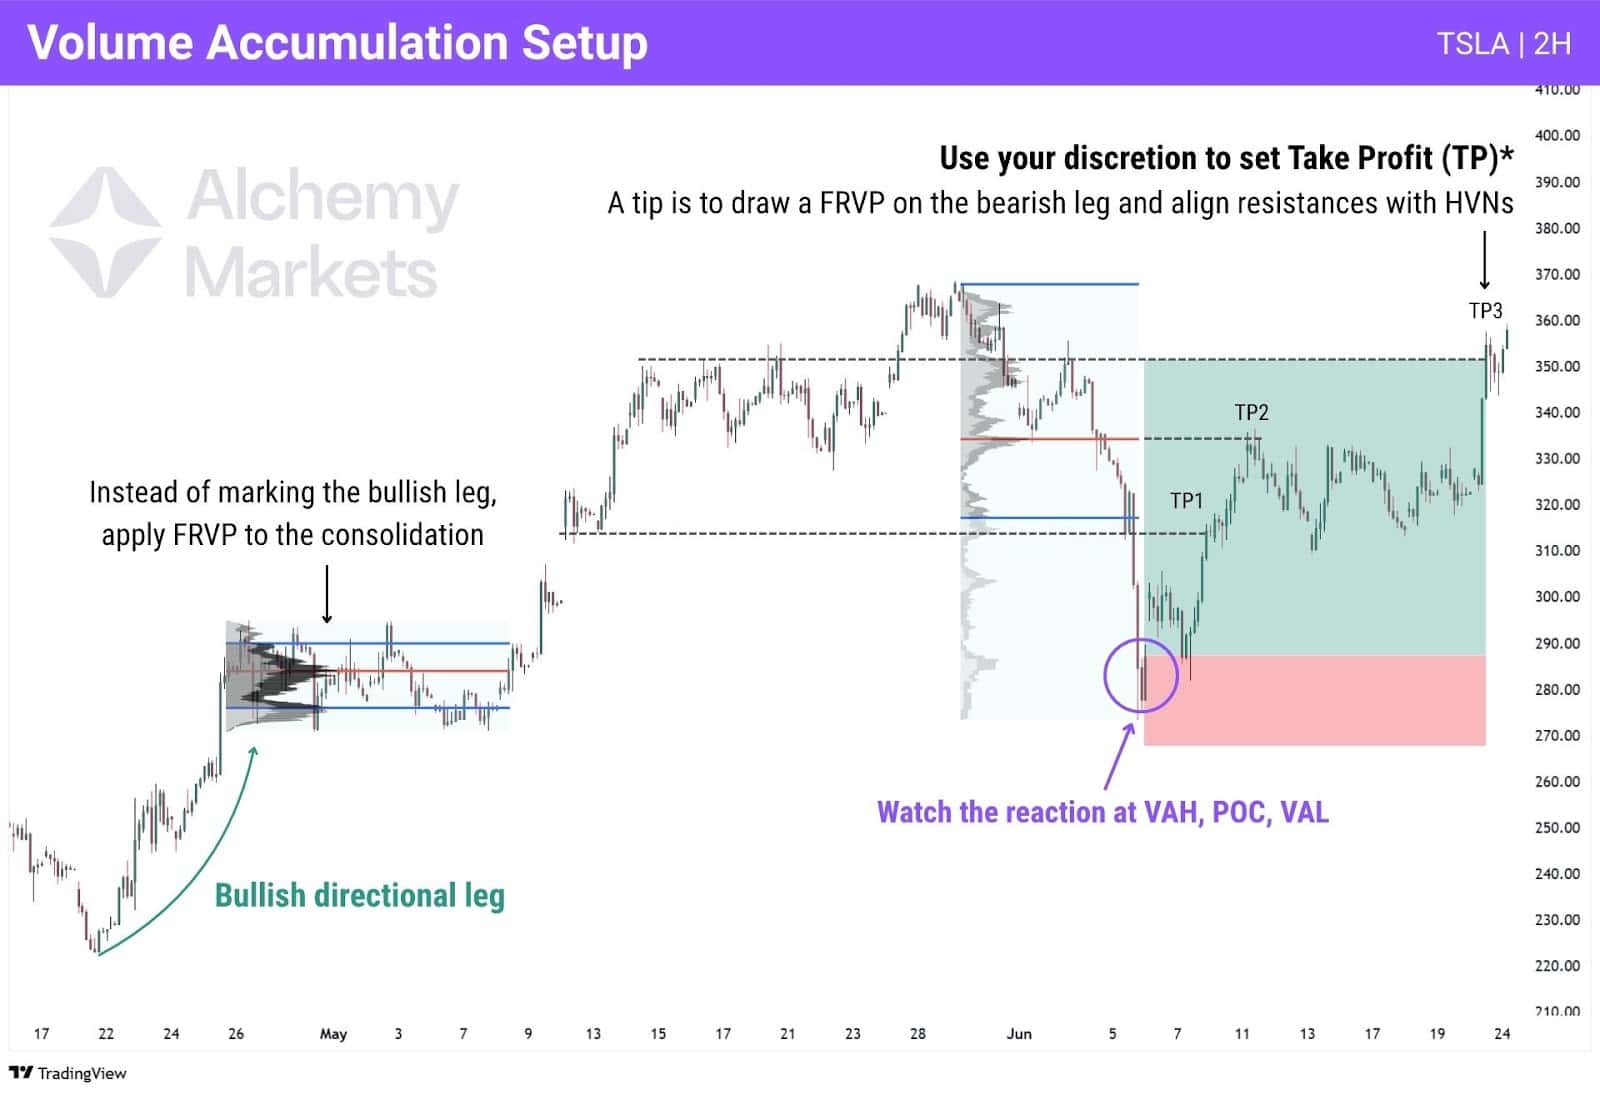
Notice how in this TSLA trade example, we marked the FRVP over a horizontal range, but only under these conditions:
- A consolidation has occurred after a clear impulsive, directional leg (Can be bullish or bearish)
- Another impulsive drive happens after the consolidation (Validating the range as part of a trending move)
At the retest, watch for acceptance, rejection, or failed auction reactions at value area markers (VAH, VAL, POC). Strong bullish or bearish candlesticks here — aligned with the prior trend — can provide a reasonable entry.
For take profit and stop loss, a simple way is to set your stop loss to below the consolidation range, and go with a 1:2 risk-to-reward take profit. However, this risks your run not meeting its take profit if it runs into a key resistance (or support if going short).
This is where using your discretion as a trader comes in. A trick you can do is to use volume profile to project TP targets:
- First, draw a FRVP over the directional leg that caused the price to retest your volume accumulation setup.
- Then, look for horizontal price levels that are near the new FRVP’s VAH, VAL, POC, or a high volume node (HVN).
This approach, while nuanced, ensures you are more likely to hit profit targets, as well as hold trades for a greater profit towards more powerful turning points in the chart.
| Key note: Works best on timeframes lower than the 4H, such as the 2H, 1H, 30m, 15m etc., where consolidations tend to be more visible. On higher timeframes, these smaller consolidations may only be reflected by two or three candles, making them hard to find. |
Determine Trend with Distributions
The way a volume profile is distributed can provide hints about the trend direction. These can manifest as p-shape, b-shape, d-shape, and thin volume profiles:
- P-shape volume profile: Signals bullish trend direction.
- b-shape volume profile: Signals bearish trend direction.
- B-shape volume profile: Signals indecision or neutral trend.
- D-shape volume profile: Signals indecision or neutral trend.
- Thin volume profile: Signals a strong trend in the direction of the breakout.
Key takeaway here is these volume profile shapes work best as reversal signals within a prolonged uptrend or downtrend — but at the end of the day, price action is king. It is best used when combined with support and resistances, and an understanding of how rejection candles may look like (Hammers, shooting stars, and engulfing candles).
Day Trading with Volume Profile Indicator
Any volume profile tool — whether it’s Fixed Range, Anchored, or Session-based — can be applied to day trading. However, if you’re looking for the one most tailored to intraday setups, it’s the Session Volume Profile (SVP).
This indicator, available by default on TradingView, automatically resets with each trading session. What you want to do is to observe the current day’s price action, in relation to the previous day’s SVP, to set a bias for the day:
- If the price is above the previous day’s SVP, set a long bias.
- If the price is below the previous day’s SVP, set a short bias.
Then, we want to observe how the price reacts to the certain key levels, such as the Value Area High (VAH), Value Area Low (VAL), and Point of Control (POC). Here’s an example of a daytrading using the SVP, and observing price actions at these areas:
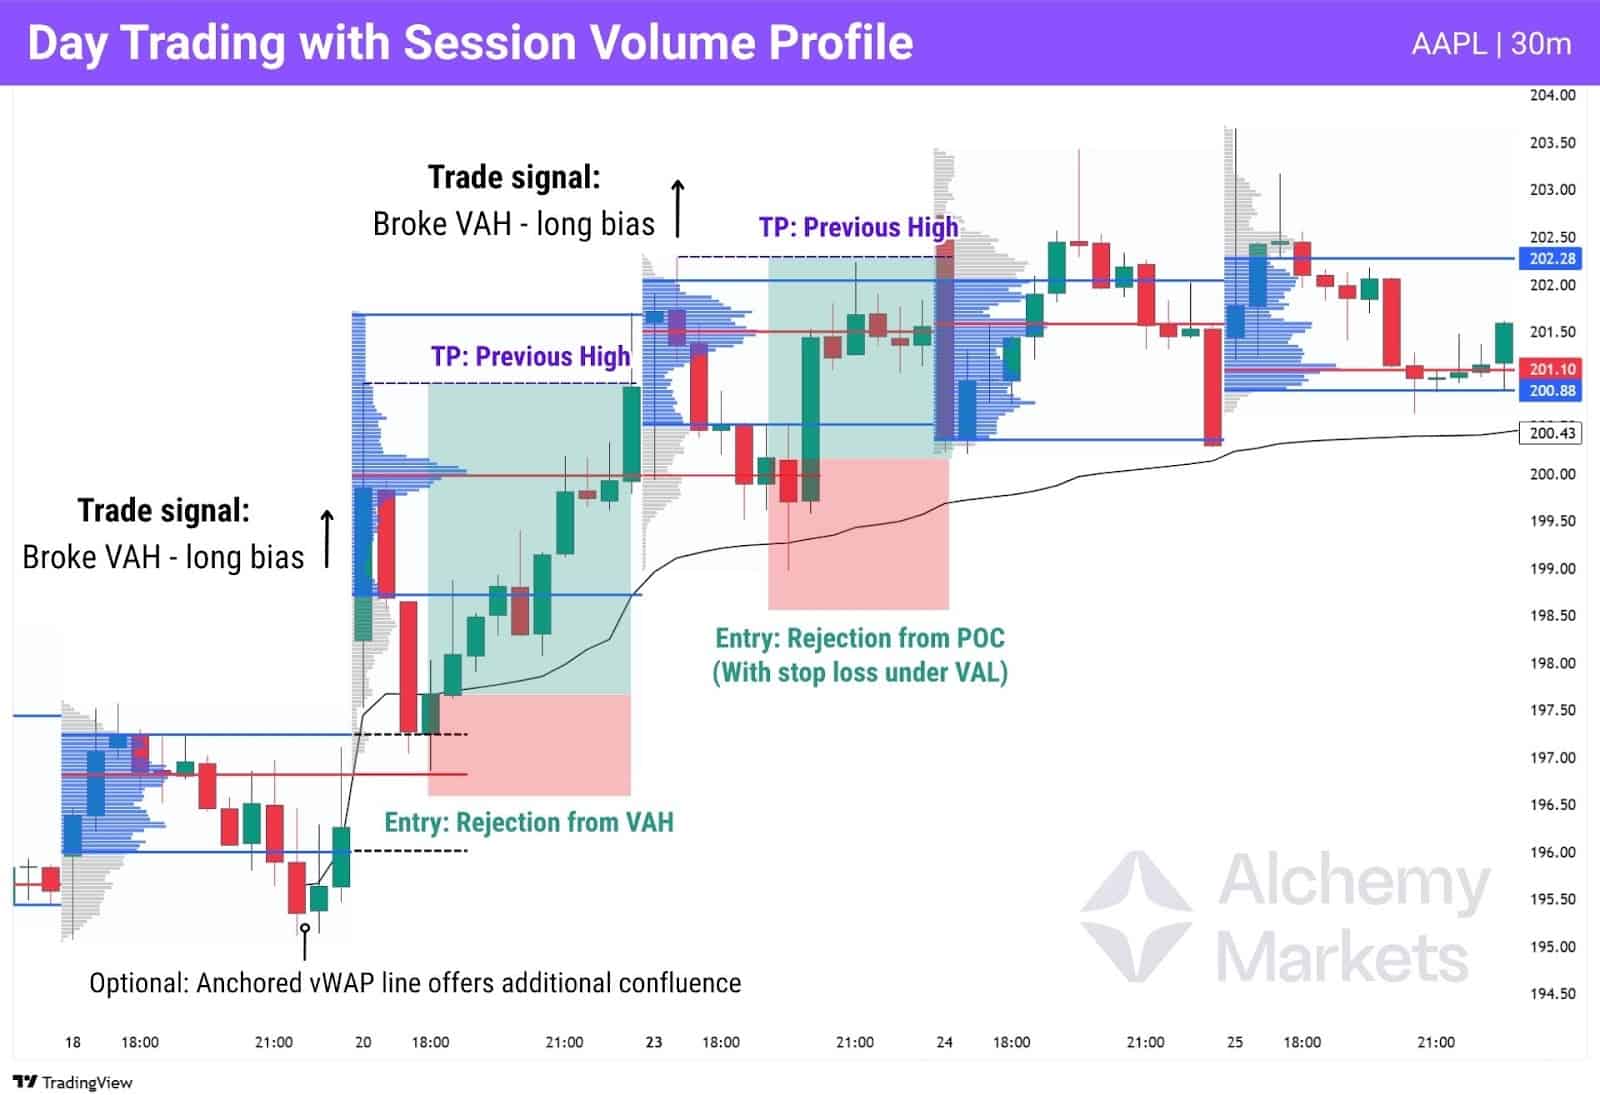
To set take-profit levels, you could either go with a simple 1:2 risk-to-reward, or take a more discretionary approach — targeting the previous highs (or lows in a short). Additionally, you could always use other indicators — Anchored vWAP is my personal favourite — to add confluence to your volume profile trade ideas.
Swing Trading with Volume Profile Indicator
Fixed Range Volume Profile (FRVP) and Anchored Volume Profile (AVP) are powerful tools for swing trading, especially on higher timeframes like the 4H or 8H. These indicators help reveal areas where market participants have committed the most volume, which often align with key reversal zones.
Personally, I prefer the FRVP as it isn’t dynamic and require constant monitoring, but effectively, the way you’d trade them is the same:
- Determine the dominant trend by noticing if a price swing has created a new low or new high.
- Use a Fibonacci retracement tool to mark out the most recent leg which aligns with the dominant trend.
- Apply an AVP or FRVP on the directional leg.
- Watch reactions at the High Volume Nodes which align with a Fib and value area marker.
This style of trading is highly discretionary, but with practice, can produce positive results. The goal here is to discern which high volume levels are worth trading by lining up confluences. Here’s how it looks like in action:
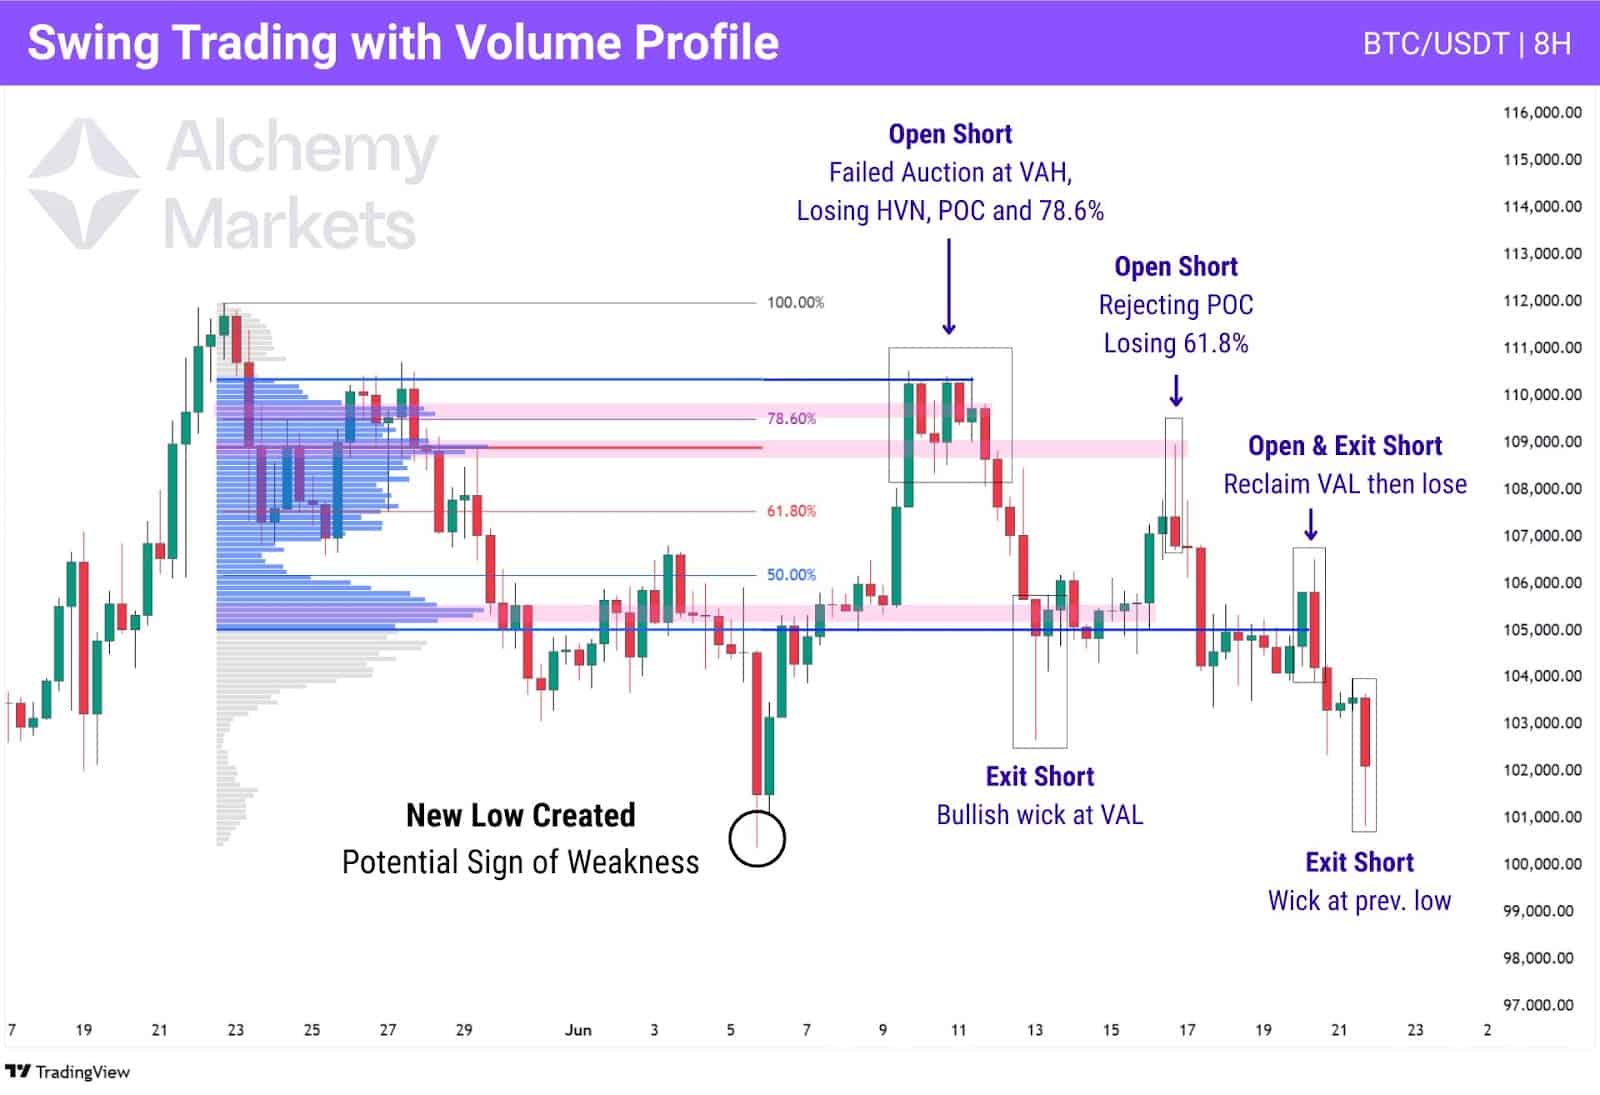
Notice that in this BTC/USDT 8H trade, price has created a new low — not by much, but it provides the context that a bearish trend shift could be happening. Then, apply a FRVP and Fibonacci retracement (only marking 50%, 61.8% and 78.6%) from the swing high to swing low to reveal key volume structures such as HVNs, VAH, VAL, and the POC.
The idea here is to trade high volume nodes near value area markers, and the marked Fibonacci levels if the price returns to test them. As long as the price is within the fair value zone of the directional leg, it’s essentially challenging the idea of a bearish continuation. By observing an aligning reaction at the value area, we can logically test the idea of a further continuation.
Here are the main reactions to look for:
- Rejections at HVN, POC, VAH, or VAL
- Failed auctions, which is price reclaiming, then losing key levels at HVN, POC, VAH, or VAL
- Candle closes with large wicks at volume structures
In the chart above, you’ll notice that we managed to secure 2-3 trades with just this core concept, but you could definitely also enhance your trade accuracy with a separate entry system (at these key levels).
Position Trading with Volume Profile Indicator
Position trading focuses on longer-term swings, where price can travel through large distances across a longer period of time — lasting months or even for a year.
In this style, Volume Profile can be used to identify key volume structures on the daily or weekly charts, where large players may have historically accumulated or distributed positions.
Effectively, you’d be trading volume profiles in the same manner as you do in swing trading, observing high volume nodes (HVNs) which align closely to the 50%, 61.8%, and 78.6% Fib after a significant uptrend has already occurred.
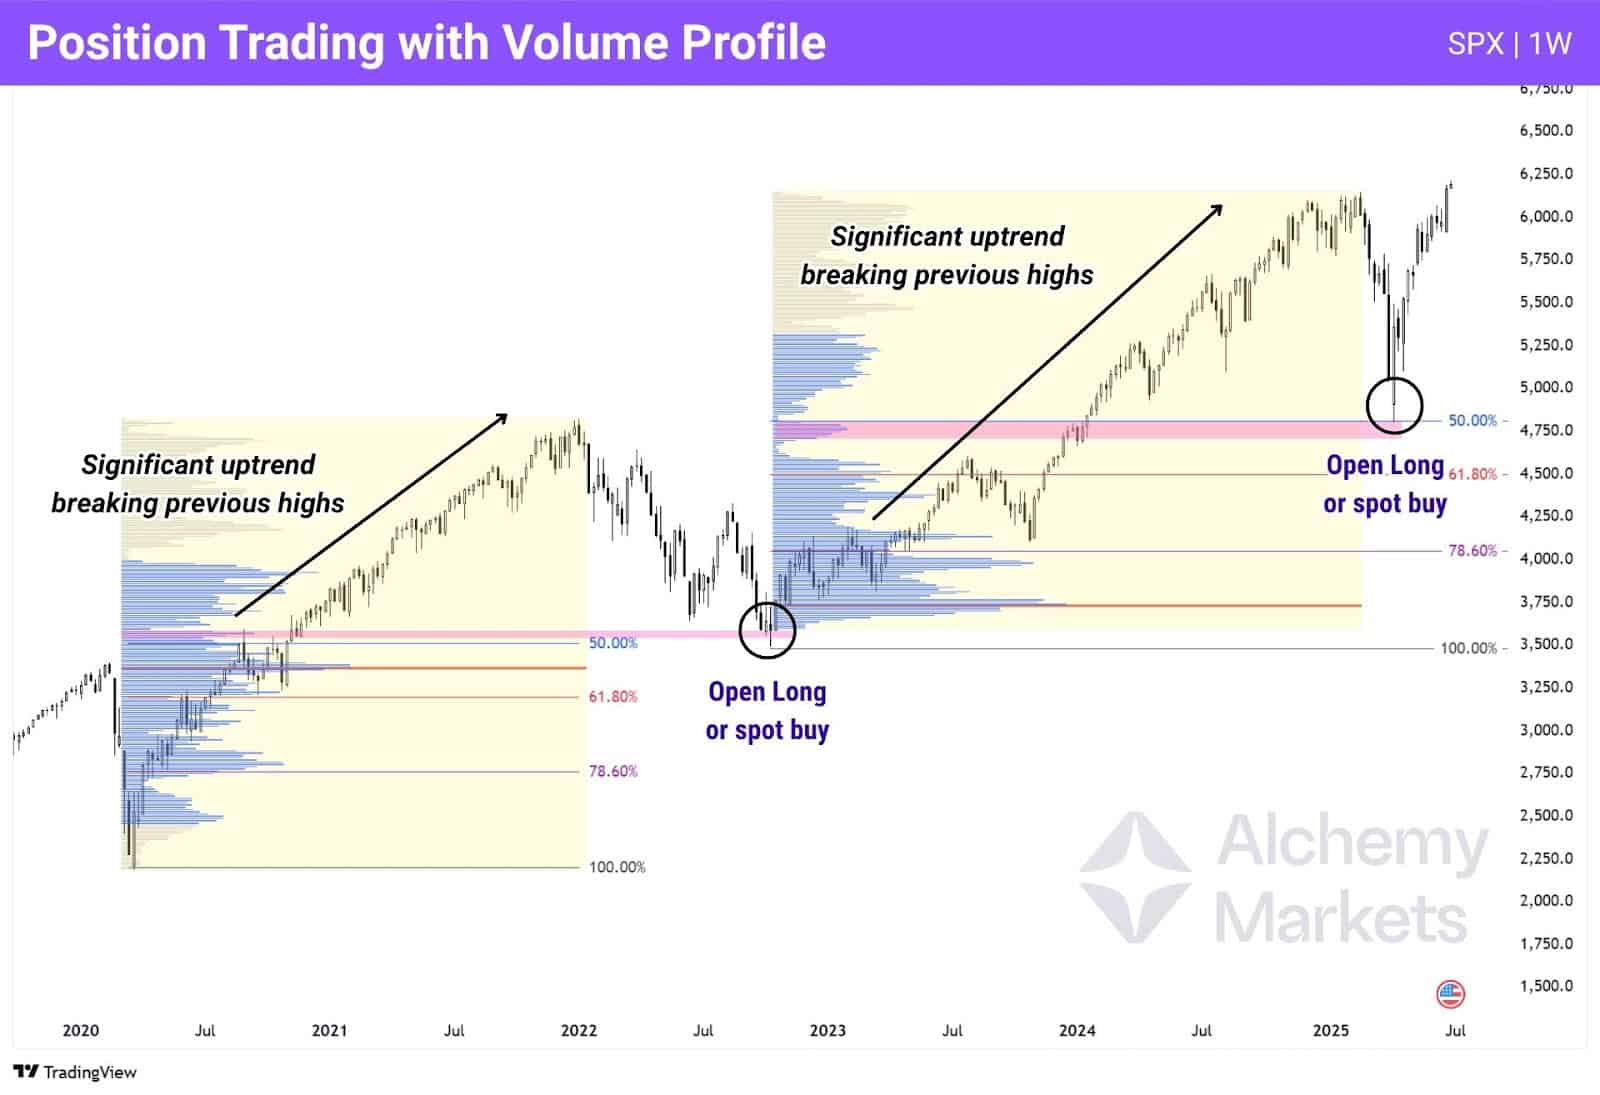
The idea here is to:
- Confirm an uptrend direction (position trading favours uptrends).
- Only trade continues after a significant retracement — 50% or over — has occurred. This lowers your drawdown risk.
- Target high volume nodes, rather than the Fibonacci levels directly. The Fib levels are an approximation; volume nodes, however, directly represent where traders’ interests are.
Multi-Time Frame Analysis
Multi-timeframe analysis allows traders to validate price reactions at key levels more precisely. It starts with observing a reaction on a higher timeframe — then drilling down to a 15m, 5m, or even 1m chart to examine how volume is building. This is important because even after a strong higher-timeframe rejection, price often chops or retests on the lower timeframes.
Zooming in helps you refine entries, control risk, and potentially capture higher reward trades.
In this setup, we combine a 4H Volume Profile for directional bias with a 5-minute Volume Profile to confirm the quality of a rejection — giving us a confident, low-risk entry point:
- Draw a FRVP over the rejection candle’s range on the smaller timeframe — gives a granular view of how volume’s concentrated.
- Add a Fibonacci retracement tool to help prioritise HVNs near the 50%, 61.8%, or 78.6% retracement zones.
- Watch for a clear reaction at the smaller timeframe’s HVN — Acceptance, Rejection or Failed Auction.
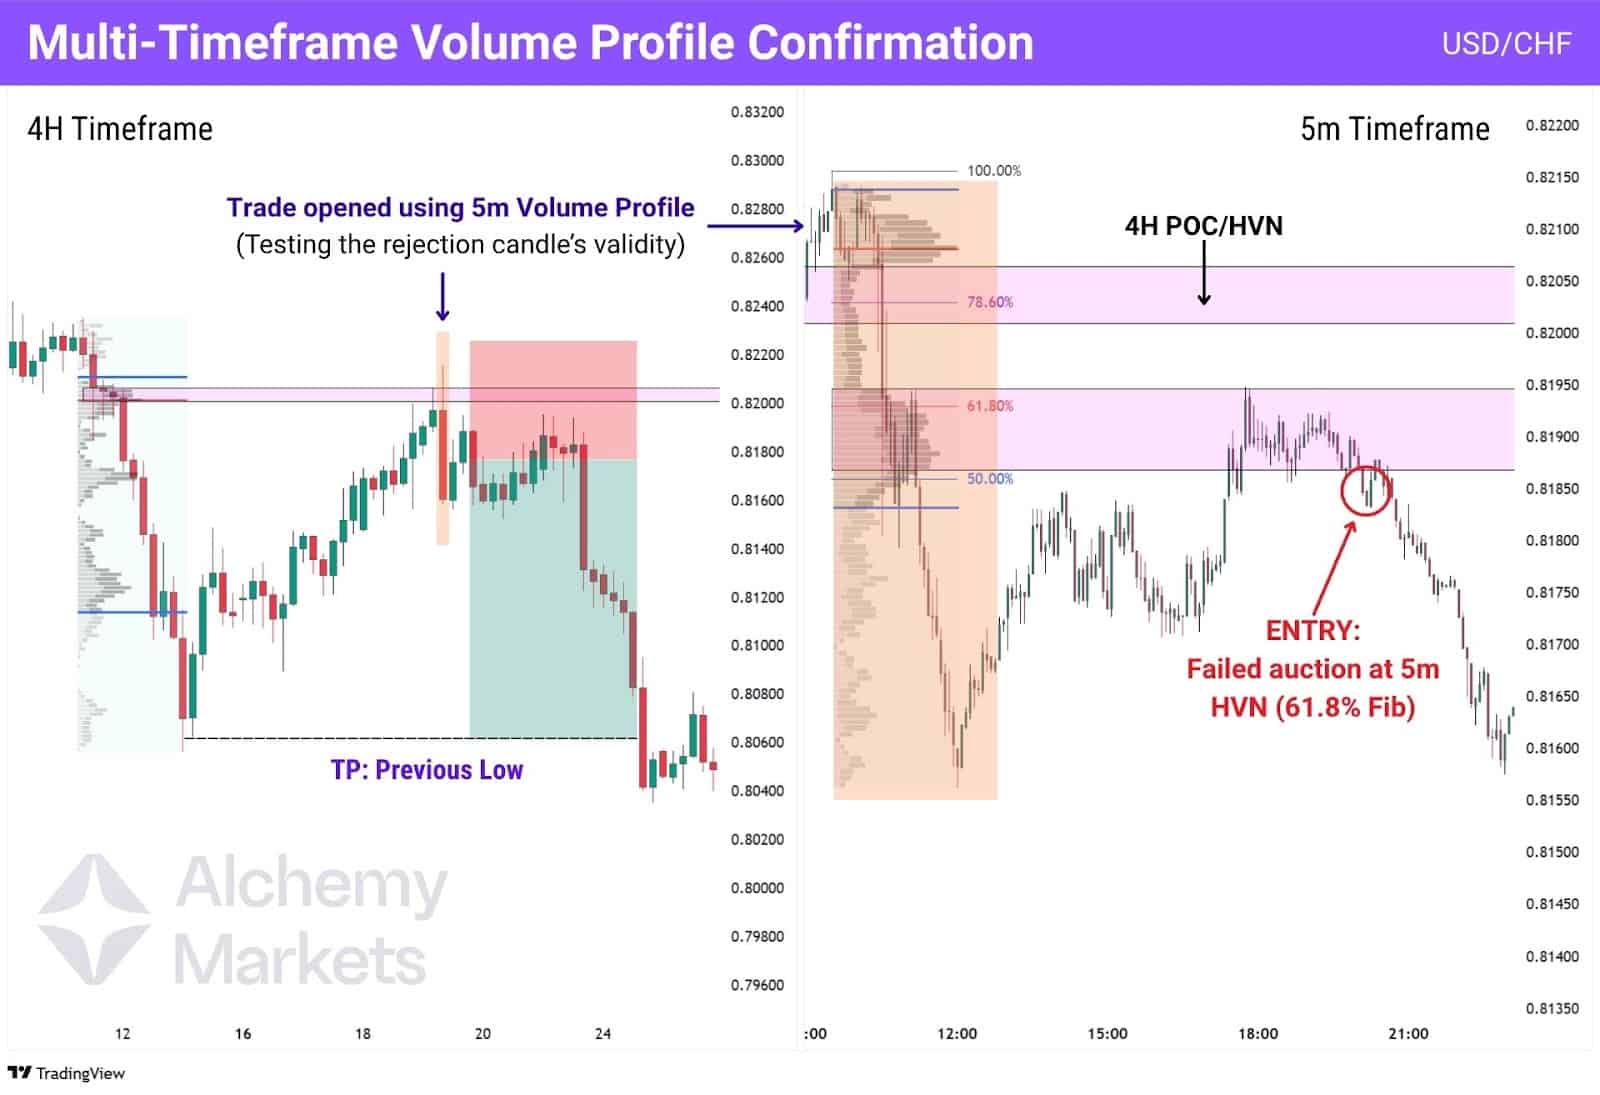
In this USD/CHF setup, we started with a strong rejection candle on the 4H timeframe. Price reacted at a major volume structure, but instead of entering immediately, we zoomed into the 5-minute chart to test its validity.
- Price initially bounced off the 4H VAL, only to be accepted back within the range.
- However, the real resistance came in at the 61.8% Fib retracement, which aligned with a 5m HVN.
- At this HVN, price failed to sustain its bounce — printing a failed auction before reversing sharply.
By using the 5m profile to confirm rejection, we were able to time a low-risk entry, while still trading the broader 4H bearish bias — ultimately targeting a much wider continuation move with a strong risk-to-reward profile.
Volume Profile with MACD
One of the trickiest parts of using Volume Profile is knowing when to enter. Key levels like the point of control (POC), value area highs and lows (VAH/VAL), and high-volume nodes are excellent zones for potential reactions — but price often chops around these areas before committing to a clear move. That indecision can lure impatient traders into premature entries.
This is where momentum tools like the MACD can help save traders the trouble of guessing when a clear move is about to happen. Rather than trying to anticipate a reaction, the MACD confirms when momentum has actually shifted:
- MACD Line (fast): the difference between two EMAs, typically 12 and 26 periods
- Signal Line (slow): a 9-period EMA of the MACD line
When the MACD line crosses above the signal line, it suggests bullish momentum. When it crosses below, it signals bearish pressure. For this strategy, we’ll focus solely on this crossover logic.
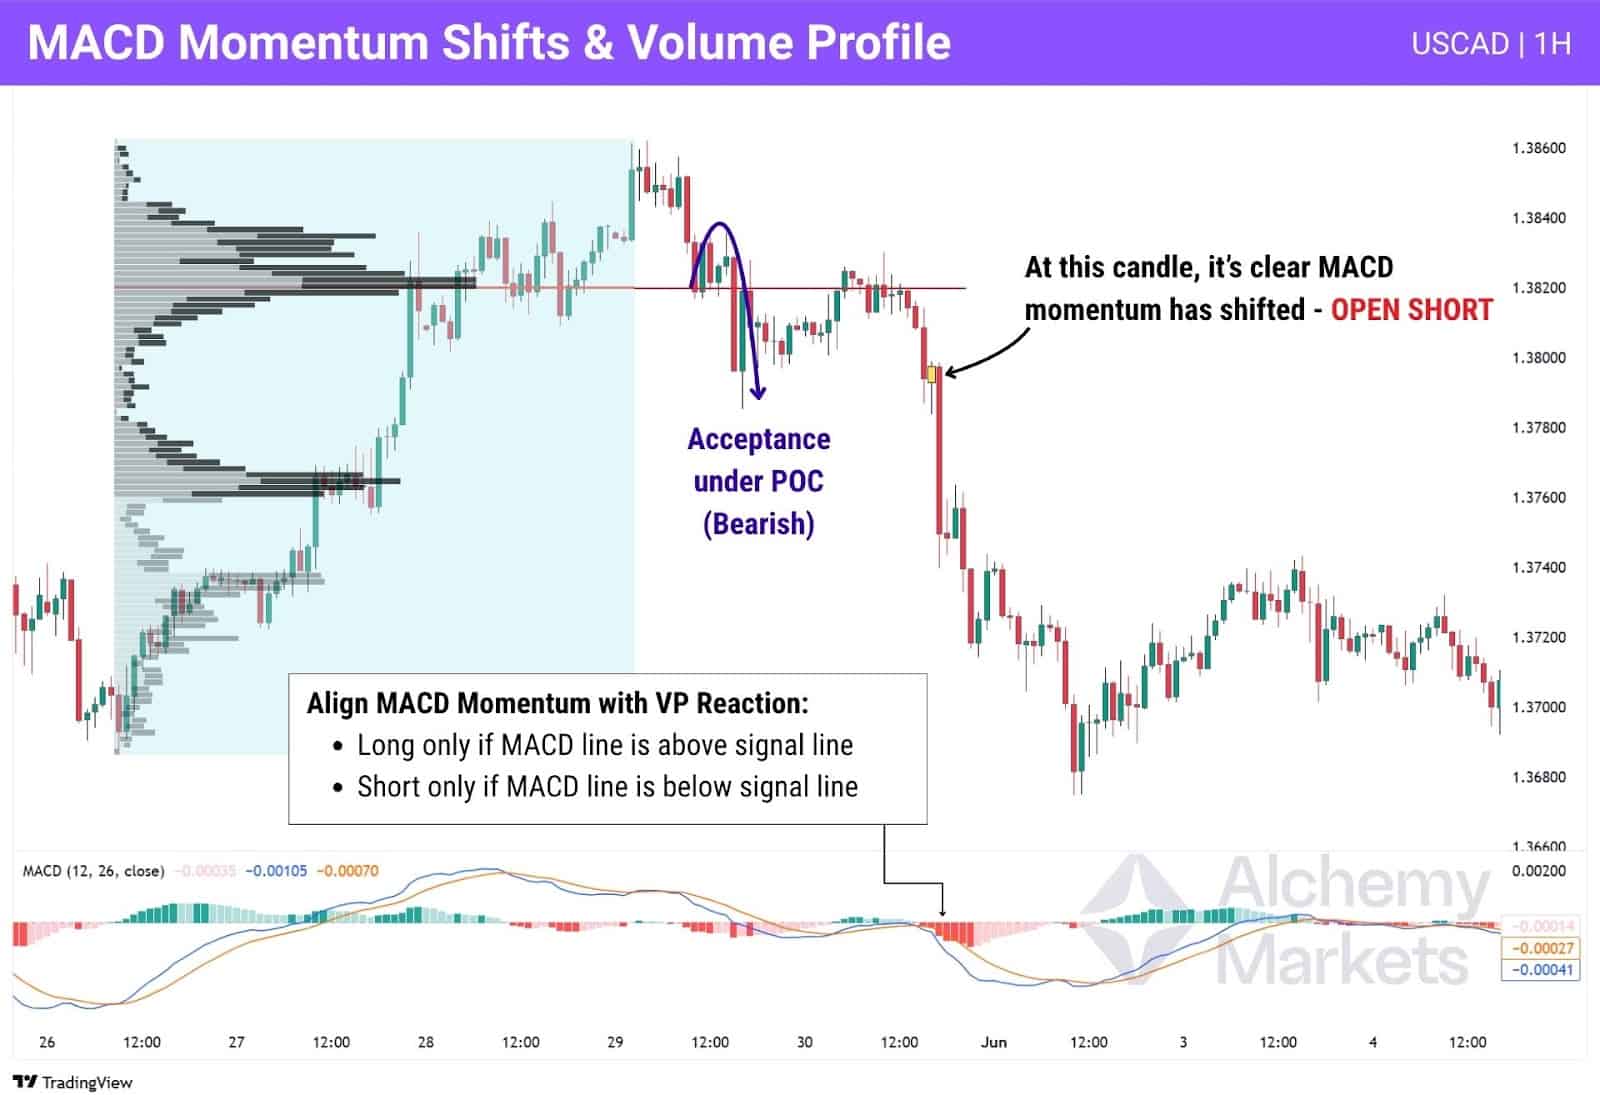
At a key Volume Profile level — such as a POC or HVN — the first step is to observe price behavior: is it being accepted, rejected, or failing to auction through? Once you have a clear directional bias, you enter only when the MACD confirms that momentum agrees.
- Go long if price is bouncing off support and the MACD line is above the signal line
- Go short if price is rejected from resistance and the MACD line drops below the signal line
In the example above (USDCAD 1H), price breaks under the POC and is accepted lower. On the retest, it chops — a trap for anyone trading too early. But the MACD keeps us safe from all this market noise. It’s only when the MACD line clearly moves below the signal line — confirming bearish momentum — do we enter short and catch the move lower toward previous lows.
Volume Profile with Bollinger Bands
Volume Profile shows us where price is likely to react based on historical volume, which can be confirmed with Bollinger Bands® to help us gauge momentum and exhaustion. By combining the two, we can time entries around volume-based levels with a confirmation of volatility fading, increasing the probability of a meaningful reversal or continuation.
This setup looks for price tapping into key volume zones — such as the High Volume Node (HVN), Value Area High (VAH), or Point of Control (POC) — while hugging the outer Bollinger Band. Once a candle closes fully inside the bands, that’s a signal that momentum is potentially waning at a key level, and a pivot may be underway.
Below is a short and long example on USD/JPY 1H timeframe. Notice how for both examples, the price retraces into a high volume node, or value area of the previous trending move. Both times, the price manages to reach the edge of the Bollinger Bands (BB) just as it taps into that key area, signifying a high potential for the price to pivot.
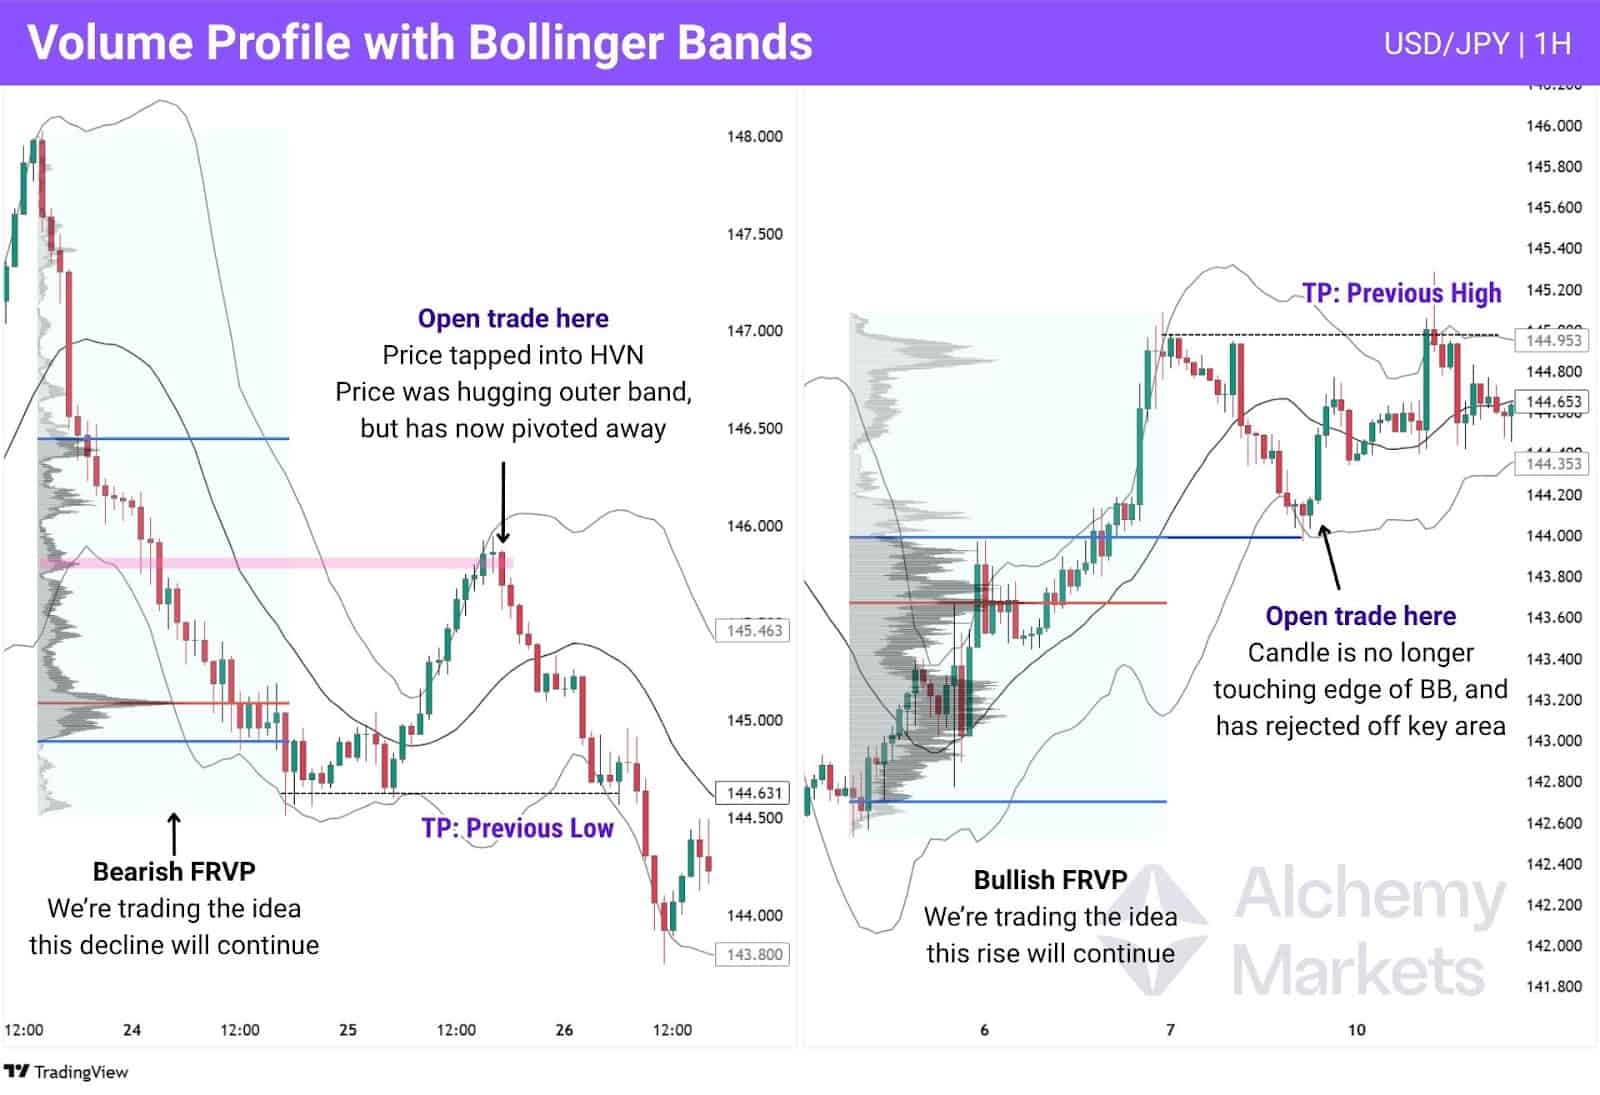
To confirm the trade, simply wait for a rejection at the key area, whether it’s a HVN or value area marker, and also wait for the price to print a candle that is no longer touching the outer band — this is a sign of an exhausted directional move, and gives us confidence that the price is beginning to turn.
For stop loss and take profits, consider placing them above/below the recent pivot highs or lows, depending on your trade direction. Alternatively, you could keep it simple and set the take profit to 2 times your stop loss distance.
Volume Profile with RSI
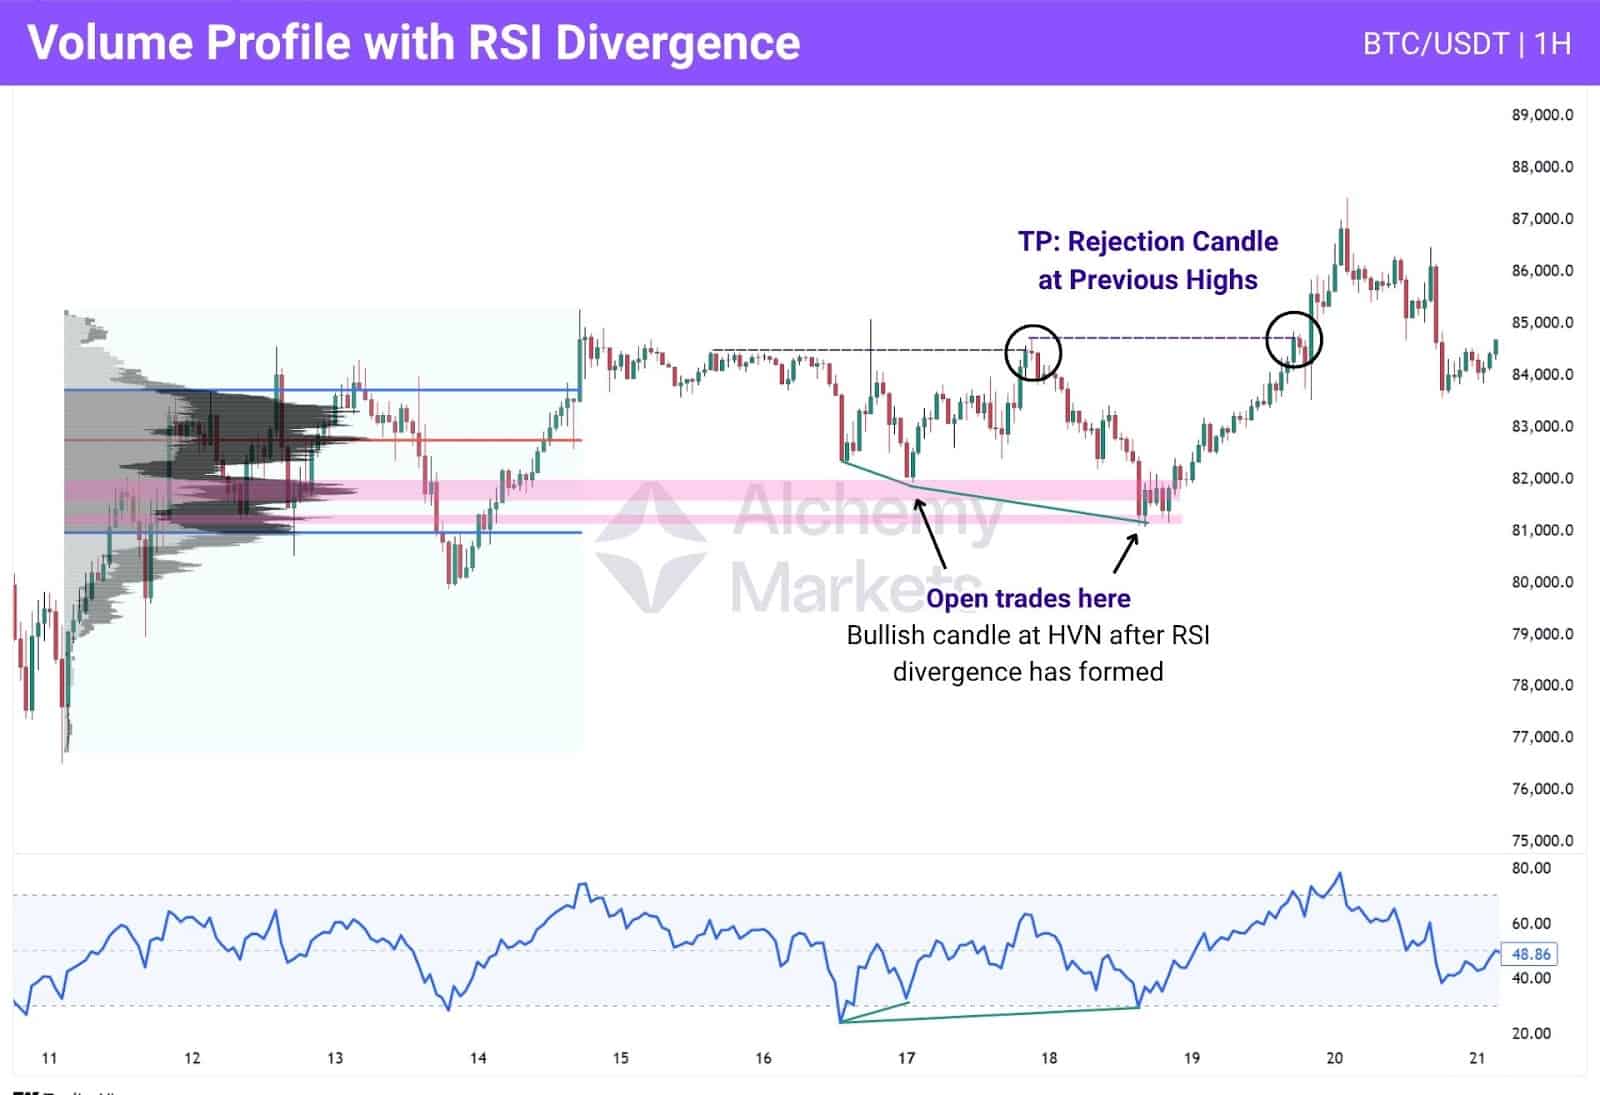
One of the most effective ways to use the RSI with the volume profile is to look for RSI divergences. If you’re hunting for a long position, look for bullish divergences at key volume levels. Vice versa, if hunting for shorts, look for bearish divergences.
As price taps into a volume area, watch for these visual cues:
- Bullish Divergence (For Long positions) — As price forms a lower low, RSI does not.
- Bearish Divergence (For Short positions) — As price forms a higher high, RSI does not.
An RSI divergence is essentially telling us that momentum is waning in the chart — whether that’s bullish momentum, or bearish. If the RSI is printing a divergence as we tap into a volume level, it signifies that conditions for a turning point (pivot) have improved. You then want to pair this with a bullish candle at volume support, or bearish candle at volume resistance to execute a trade position.
Advantages of The Volume Profile
Volume Profile offers traders a data-driven approach to analysing price levels, helping remove subjectivity from technical analysis. Its strength lies in revealing where market participants have truly committed — not just where price has moved.
- Objective Support/Resistance: Removes guesswork from drawing levels.
- Identifies True Market Intent: Highlights zones where volume — not just price — confirms value.
- Adaptable Across Styles: Useful for scalping, swing, or position trading.
- Pairs Well with Other Tools: Easily integrates with Fibonacci, RSI, Bollinger Bands, MACD, etc.
- Reveals Institutional Activity: HVNs often align with areas of smart money accumulation.
Disadvantages of The Volume Profile
Despite its strengths, Volume Profile has some limitations that traders should be aware of. These drawbacks don’t make the tool unusable — but they highlight when caution or additional confirmation is needed.
- Doesn’t Show Buyer vs Seller Intent: VP reflects volume, not direction — unlike Delta Volume or CVD.
- Requires Clean Structure: Works best in clear legs or consolidations — messy charts = misleading profiles.
- May Lag During Fast Moves: AVP may update too slowly in volatile breakouts.
- Spot Forex Inaccuracy: Volume Profile is less accurate on CFDs or FX pairs with tick volume only — best used on futures for true volume data.
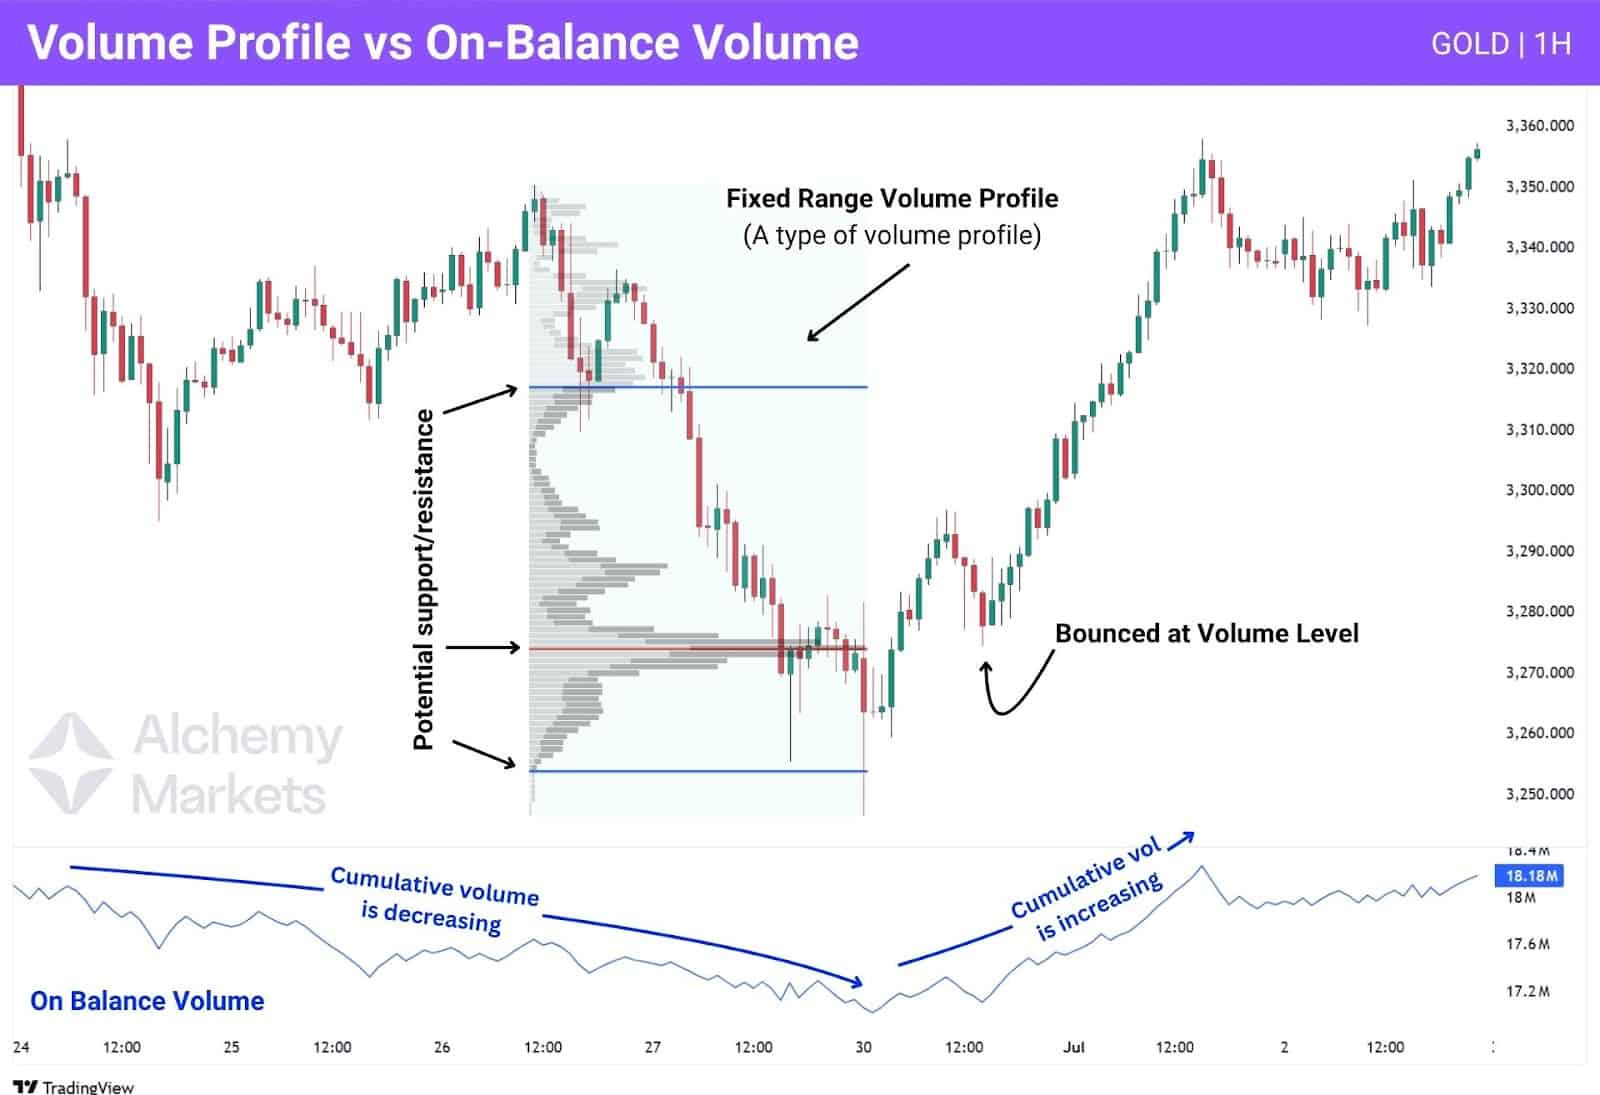
Volume Profile Indicator vs On Balance Volume Indicator
While both indicators provide insight into volume dynamics, they serve different purposes. OBV is better suited for momentum and divergence spotting, whereas Volume Profile focuses on precise trade location.
- OBV tracks cumulative volume tied to price direction — better for spotting divergence, but less granular.
- VP shows where volume is traded — better for entries/exits and structural zones.
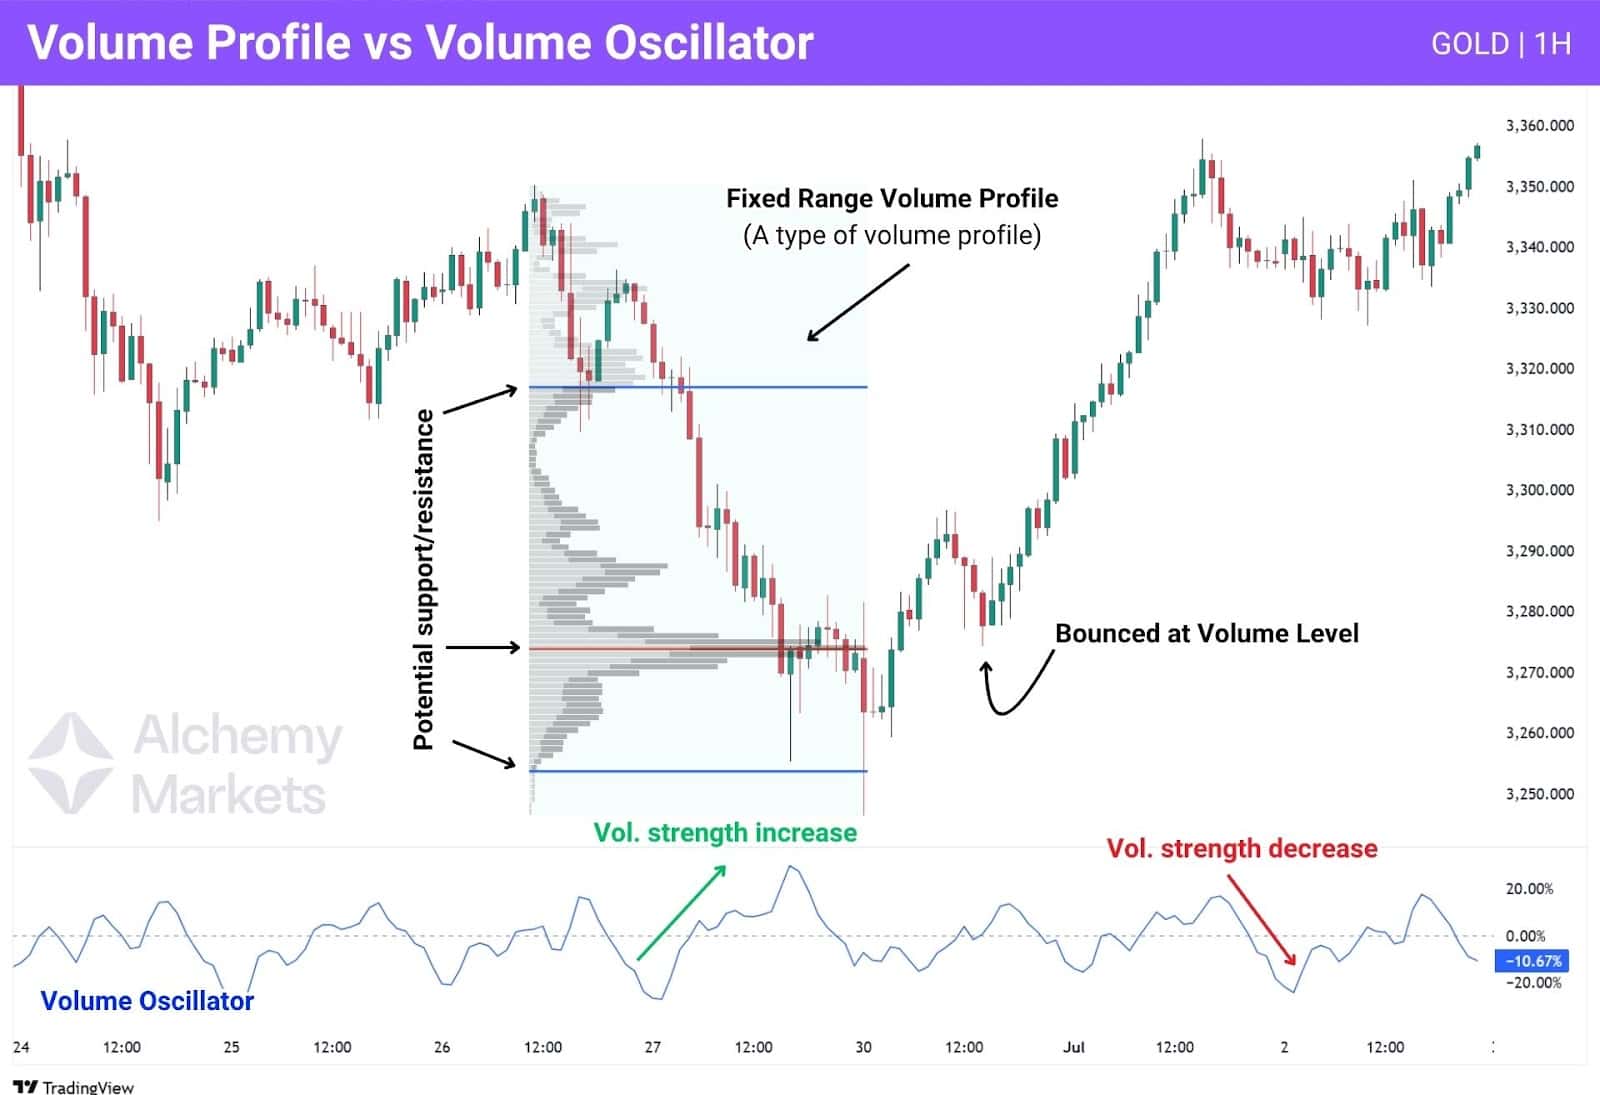
Volume Profile Indicator vs Volume Oscillator Indicator
These tools differ in how they visualise volume behaviour. The Volume Oscillator focuses on volume acceleration, while Volume Profile is anchored to price levels for location-based analysis.
- Volume Oscillator shows changes in volume strength — useful for timing.
- VP shows exact price levels of heavy volume — more spatially precise.
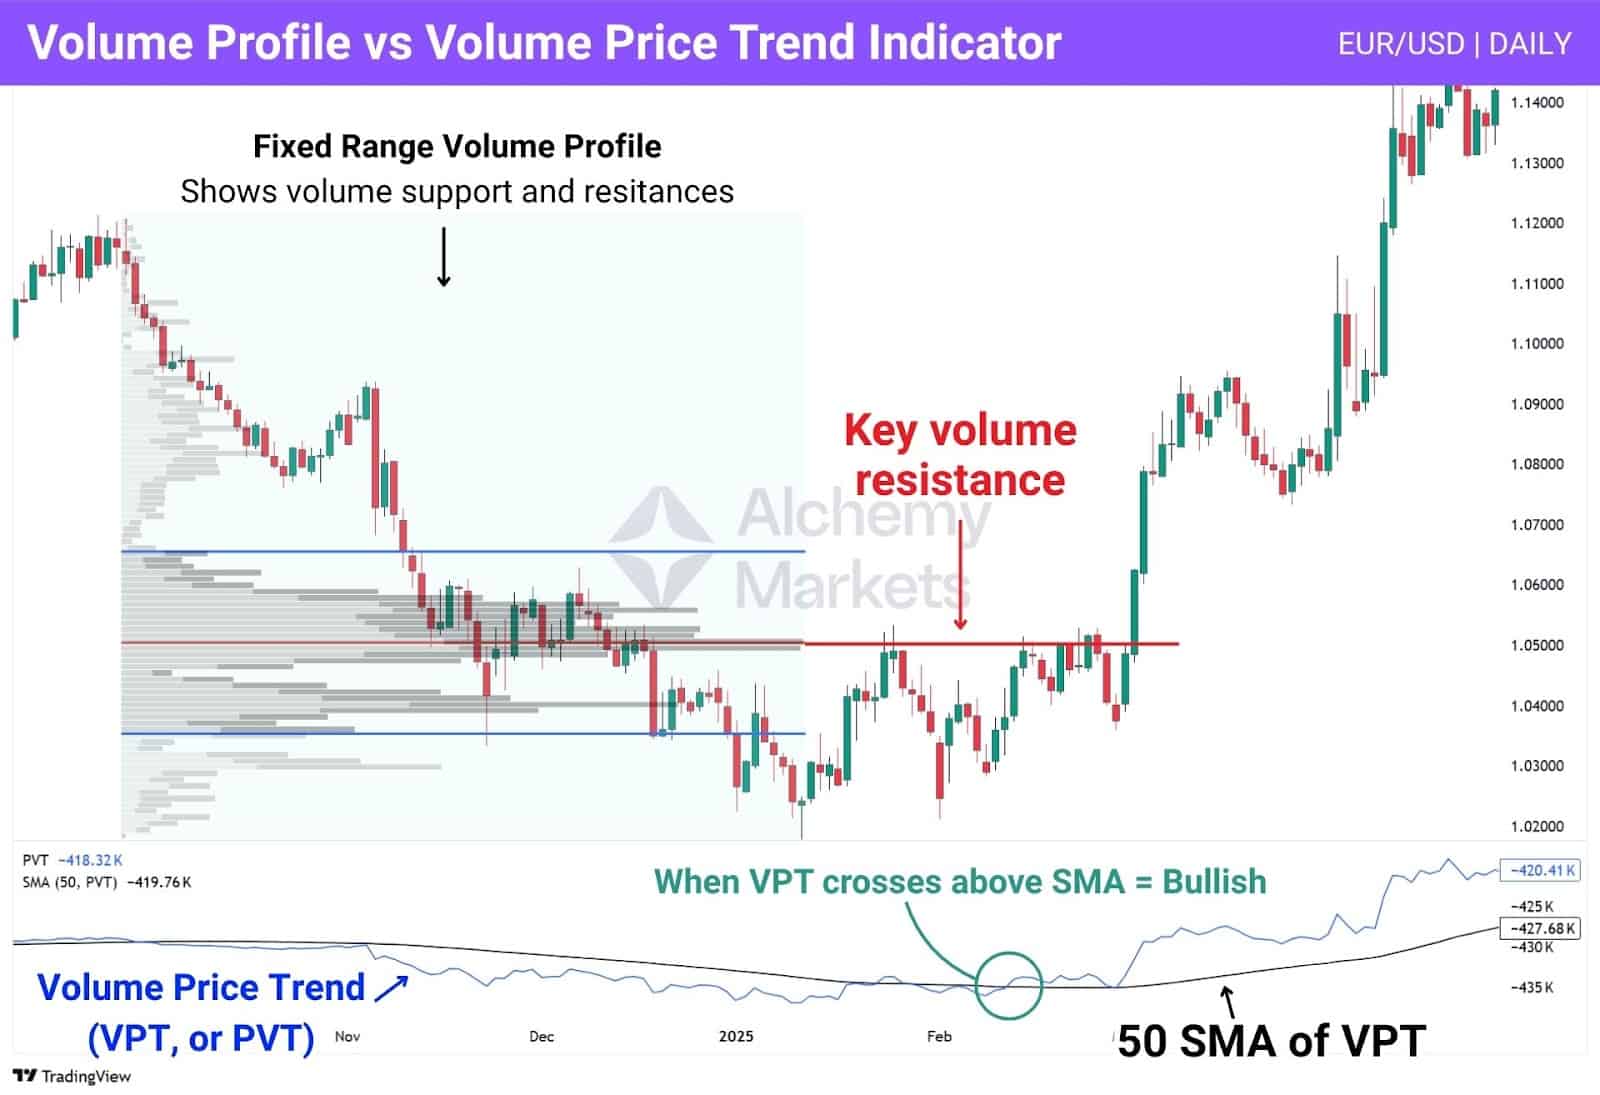
Volume Profile Indicator vs Volume Price Trend Indicator
Volume Profile (VP) and Volume Price Trend (VPT, or PVT) are totally different tools, but they can work great together.
- VPT blends volume with price, and its trending direction. The VPT rises or falls more dramatically with higher volume.
- VP maps out key price zones, making it ideal for finding support/resistance and trade levels.
Traders often add a Simple Moving Average (SMA) to the VPT to serve as a signal line:
- When VPT crosses above the SMA, it’s bullish.
- When it crosses below, that’s bearish.
In the chart, EUR/USD breaks above a major volume resistance (from the Volume Profile), and the VPT has just crossed above the 50 SMA. This combo signals strong bullish momentum and potential for a breakout play.
FAQ
What common mistakes should traders avoid when using the Volume Profile?
A common mistake is drawing volume profiles over incomplete legs — this gives misleading value areas. Also, traders often ignore price behaviour at VP levels. Volume zones are only significant if they align with acceptance, rejection, or failed auction reactions.
What is the best time frames to trade with Volume Profile indicator?
It depends on your strategy. Day traders often use 5m–30m with Session VP, swing traders prefer 1H–8H with FRVP or AVP, and position traders stick to Daily or Weekly charts. The key is matching the timeframe of the profile to your trade duration.
How reliable is Volume Profile?
It’s reliable when paired with clean structure and confirmation. On its own, it’s not predictive — but when combined with price action, it helps map out zones with higher probability reactions.
What is the 80% Rule in Volume Profile?
The 80% Rule states that if price enters the previous day’s value area and holds for at least two 30-minute candles, there’s an 80% chance it will rotate through the entire value area. This is especially useful for intraday traders.
Does the Volume Profile shows buys and sells?
No — it only shows total volume traded at each price level. It doesn’t distinguish between buying or selling volume. For that, you’d need Delta Volume or a CVD-style indicator.
Which Volume Indicator is best?
There’s no one-size-fits-all answer. Volume Profile is ideal for mapping key price levels. Delta Volume or Volume Oscillator is better for timing entries. Use what fits your strategy and trading style.
Is Volume Profile a leading or lagging indicator?
Volume Profile is technically a lagging indicator — it reflects where volume has occurred, not where it will occur. But when used on completed legs, it becomes a strong contextual tool for future reactions.
Is Volume Profile bullish or bearish?
It’s neither. Volume Profile is neutral — it reflects where value was found, not the direction. However, shape and behaviour at volume zones (like rejection or failed auctions) can suggest bullish or bearish sentiment.
What is the origins of Volume Profile?
Volume Profile emerged from the Market Profile methodology developed by J. Peter Steidlmayer in the 1980s. While Market Profile focused on time at price, Volume Profile improved upon it by using actual traded volume.


