Bearish
Bullish
- July 5, 2024
- 28 min read
Symmetrical Triangle Pattern: A Complete Guide For Traders
In this article, we’ll break down the main strategies traders use to trade Symmetrical Triangles in technical analysis.
Key Takeaways
- Symmetrical triangles indicate market consolidation and often lead to a breakout and range expansion.
- Symmetrical triangle patterns offer clear entry and exit points as a breakout trade.
- A symmetrical triangle pattern is a chart pattern with no directional bias.
What is the Symmetrical Triangle Pattern?

The symmetrical triangle pattern is a pattern used in technical analysis to predict price breakouts. Breakouts are moments where the price will move rapidly in one direction.
A symmetrical triangle pattern occurs when an asset makes equally wide movements up and down, eventually concentrating into a small area. When viewed on a technical price chart, smaller trends give shape to an isosceles triangle, or symmetrical triangle – hence the name of this pattern.
The symmetrical triangle pattern is more than just a geometric shape on a chart. It’s a powerful tool that traders use to forecast future movements of a trading asset. But how does it work? Let’s find out!
How Does a Symmetrical Triangle Pattern Work?

At its core, a symmetrical triangle pattern is a sign that buyers (Bulls) and sellers (Bears) are in an equally matched tug-of-war. This can be seen from the equal moves to the upside and downside, with both sides losing strength as the movements get smaller and smaller.
This price action leads to consecutive lower highs, and higher lows being drawn – creating the symmetrical triangle shape.
Almost as if coiling up like a spring, the pattern is “building up power” as it consolidates into the apex. It is just before the apex where an explosive final move will be made to the upside or downside – solidifying the direction of the trend.
How to Spot the Symmetrical Triangle Chart Pattern
To spot this pattern, you’ll want to look for two obvious slopes formed by the candlesticks. Then, draw a trend line covering the top of the slope, and a second trendline supporting the bottom of the slope. For this pattern to be considered a symmetrical triangle, both trend lines should be angled nearly the same with the centerline of price near the triangle’s apex.
A great tip when drawing the trend lines is to start from the wicks. You’d want to connect the first two wicks on the same side, then extend it right. This will help you find consistency in finding chart patterns (not only the symmetrical triangle), and filter out other possible patterns as well.
Another attribute is that the symmetrical triangle should have two bullish and two bearish reversal points at the trend lines, giving it at least four touchpoints.
Traders wait for the price to break above or below the pattern. When this occurs, this is considered a breakout. Traders will then take a trade in the direction of the breakout.
What Does a Symmetrical Triangle Breakout Signify?

A symmetrical triangle can break out to the upside or to the downside. An upside breakout would indicate that price is going to rally higher, this is called a bullish breakout. Conversely, a downside breakout indicates that price is going to fall, this is a bearish breakout (break down).
| Bullish Breakout: Price rallies higher out of the symmetrical triangle. |
| Bearish Breakout (Break Down): Price declines out of the symmetrical triangle. |

Aside from using the symmetrical triangle chart pattern to help traders enter a position, the triangle also has built in price targets. After you draw your trend lines, measure the distance at the opening of the triangle. Then, project that distance at the breakout point to establish a price target zone.
This distance at the opening mouth of the triangle is also called a measured move target where you measure the distance between the first high and first low of the pattern.
| Measured Move Target (Price Target): Distance from the pattern’s first high to first low. |
Importance of Symmetrical Triangle Pattern in Technical Analysis?
Chart patterns offer traders a distinct entry and exit point, making it easier to manage risk and make informed trading decisions.
The symmetrical triangle chart pattern is neutral that has no inherent directional bias and traders should remain unbiased in their predictions.
But when combined with the bigger picture, a symmetrical triangle can be perceived as a bull pennant or bear pennant. A pennant pattern is essentially a symmetrical triangle forming after a large, impulsive move. In this context, the symmetrical triangle is more likely to break out in the direction of the initial impulse (characterised by the flagpole).
Understanding the context in which the symmetrical triangle has formed can help traders better prepare their trade ideas.
Image taken from Bear Pennant Pattern Complete Trading Guide
| Bull Pennant: Symmetrical triangle patterns after a large move up. |
| Bear Pennant: Symmetrical triangle patterns after a large move down. |
Symmetrical Triangle Example

Let’s consider the bullish symmetrical triangle pattern on this Apple (APPL) stock chart above. Here, we see a consolidation taking place from Q1 – Q2 of 2021. The consecutive lower highs and higher lows form the symmetrical triangle pattern.
Next, we see a daily candle close above the symmetrical triangle on June 22nd, confirming a bullish breakout. The Apple stock then rallies across Q3 – Q4 to hit the measured move target at $160.74.
This example illustrates how the symmetrical triangle patterns can be used to forecast potential price movements. Now, let’s dive deeper into specific trading strategies with symmetrical triangle patterns.
Symmetrical Triangle Pattern Trading Strategies
There are various trading strategies utilising the symmetrical triangle pattern, each with its unique approach and considerations.
Bull Trend for Symmetrical Triangle
Although a symmetrical triangle pattern has no bias in its breakout direction, we can gain insights on its hidden bias by observing the overarching trend. By doing so, we filter out bad trades, and swing the probabilities in our favour.
In the case of trading a symmetrical triangle during a bull trend, we need to first identify a consistent uptrend with the chart showing higher highs, and higher lows. This shows that buyers are consistently buying the asset and supporting the price’s uptrend.
The next step is to wait for a breakout on the symmetrical triangle, and only trade if the price breaks to the upside. Then, by taking the measured move target from the first high to the first low, we set our take profit starting from the breakout point.
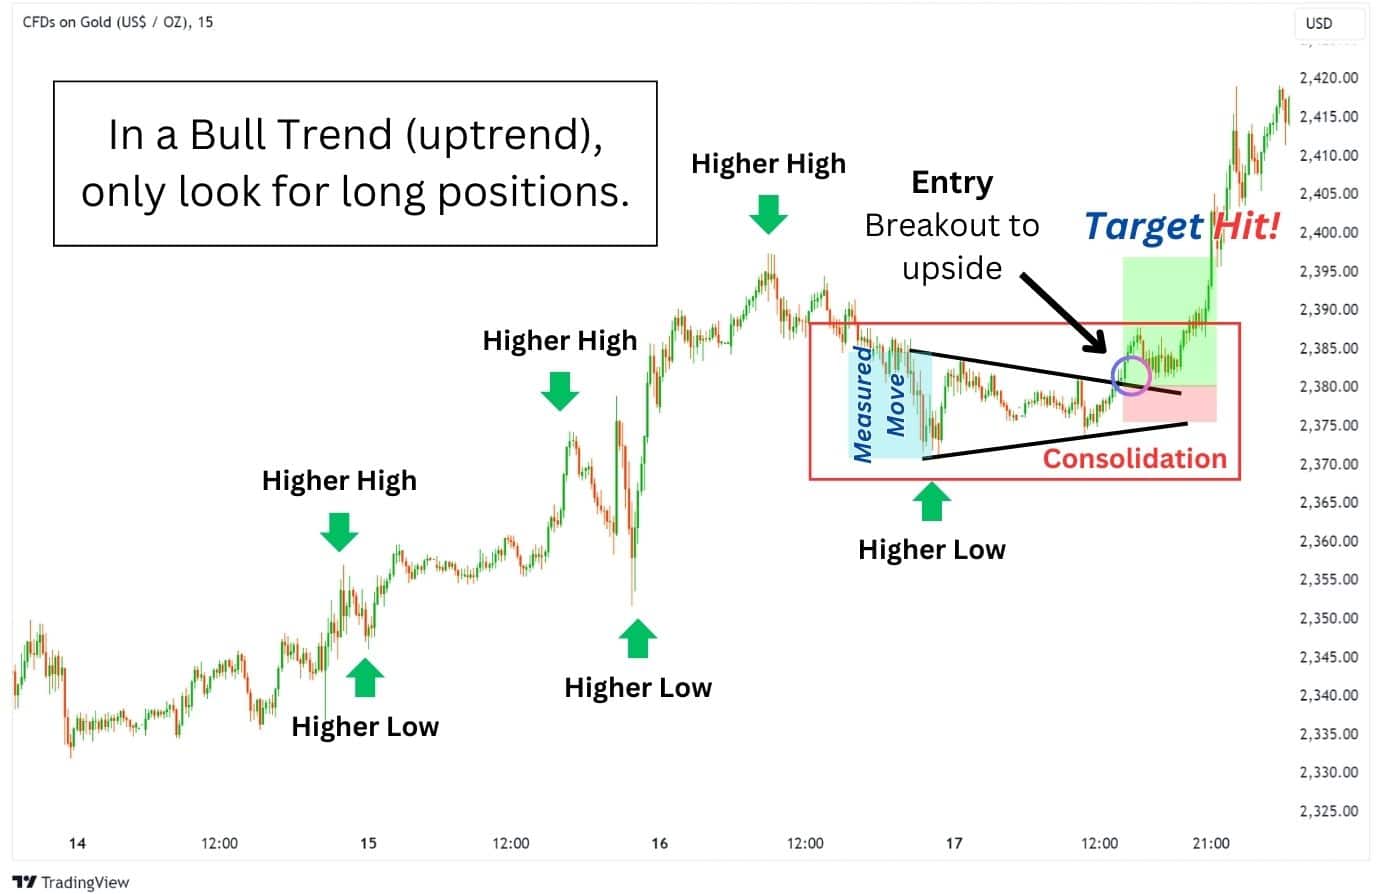
This is somewhat similar to trading the bullish pennant pattern, which would usually have a longer measured move target. However, it’s important to note that trading a pennant is different from trading a symmetrical triangle. We’ll get into this later in the article.
Bear Trend for Symmetrical Triangle
In a bearish environment, we want to only trade a bearish breakdown of the symmetrical triangle. To do this, we will apply the same approach to identifying a bull trend, but flip it around.
To identify a bear trend, we will seek a chart with consistent lower highs, and lower lows. This downtrend shows that sellers are consistently putting pressure on the price, and selling whenever the price attempts to rally higher.
Then, when there is a consolidation that resembles a symmetrical triangle, we will favour the bearish side and only trade if the price breaks to the downside. The measured move target is once again taken from the distance of the first high, to the first low of the pattern.

Volume Trading Strategy for Symmetrical Triangles
The basic strategy of trading a symmetrical triangle is to patiently wait for a breakout, then enter on the breakout or retest of the pattern. To enhance this strategy, we can wait for a bigger volume increase to confirm the breakout direction of the pattern.
By using volume to confirm the breakout, then you can feel more confidence that a trade may continue further.
Here’s how the strategy works:
- Find a symmetrical triangle pattern on the chart, with volume trailing lower and lower.
- Look for a breakout candle with increased volume.
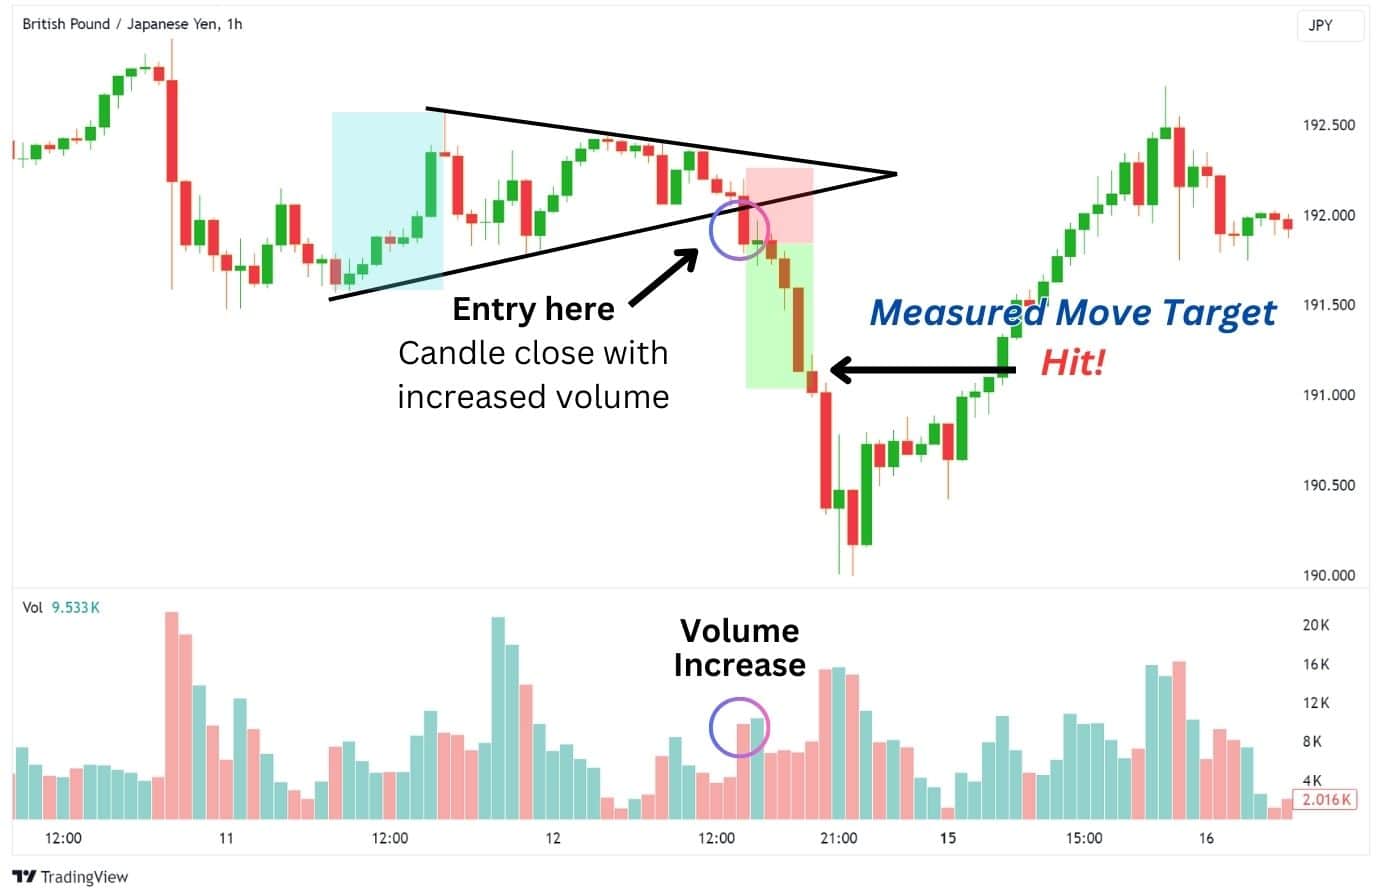
However, a weakness of the volume strategy is that large volume spikes can move the price significantly away from the pattern, lowering your risk-to-reward ratio. Ideally this should seek out trades with better than a 1:1 risk-to-reward ratio.
One solution to overcome a skewed risk-to-reward ratio is to head to a lower time frame and spot the volume breakout candle. So, if the triangle was on the 1H timeframe, you would be looking for the breakout candle on a 15 minute chart.
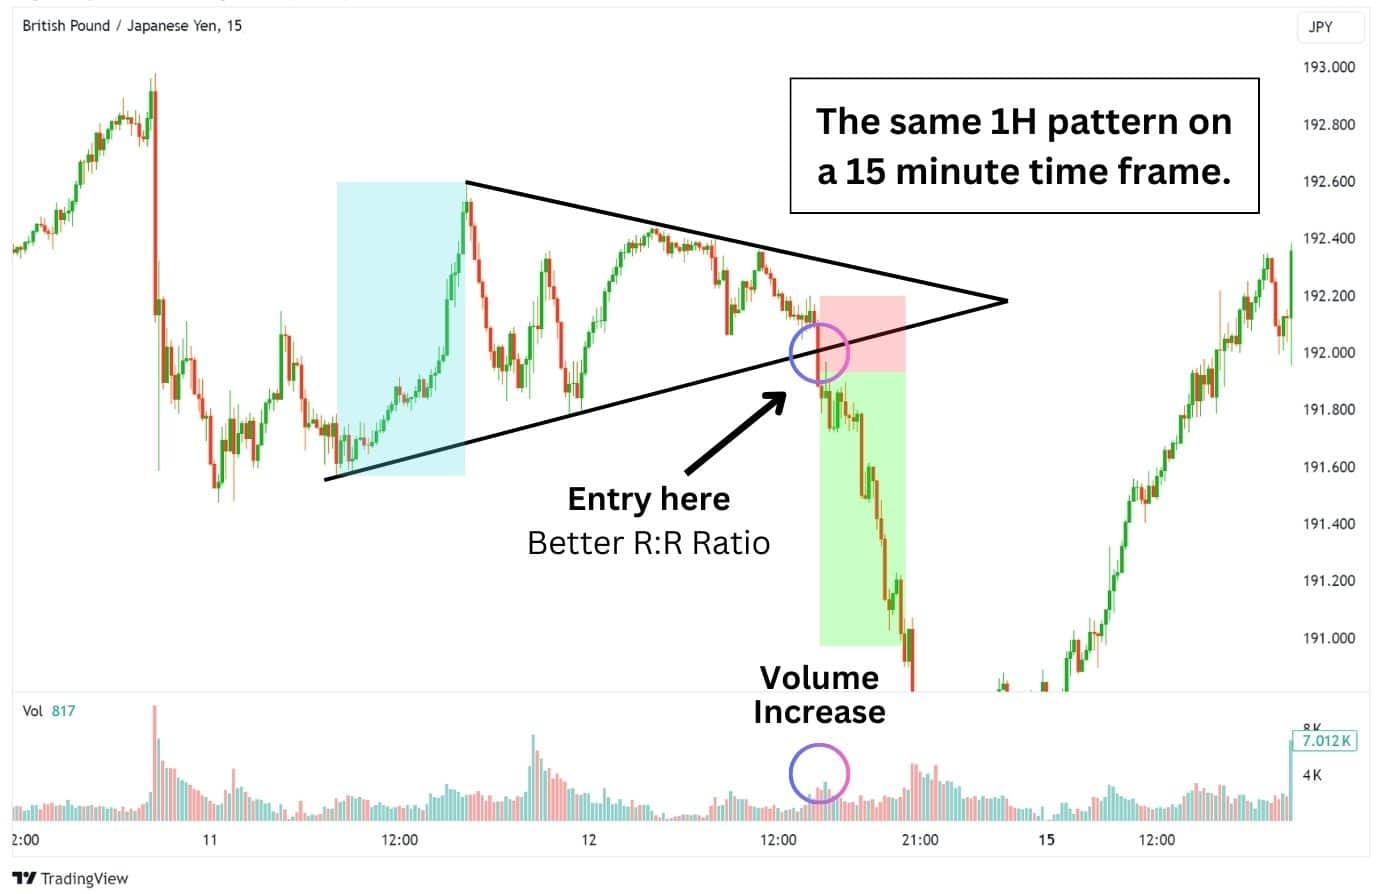
You can also enter a trade on a successful retest, when after a breakout, the price reverts back to the triangle’s trendline to retest that price level. After a retest, the price typically launches back into the direction of the initial breakout.
| Entry | When a candle closes outside of the pattern with increased volume. On successful retest of the breakout with a closed candle. |
| Stop Loss | Long SL: Below the upper trendline. Short SL: Above the lower trendline. |
| Take Profit | Measured Move Target |
Symmetrical Triangle with RSI
The RSI (Relative Strength Index) indicator is another way to confirm a breakout. Whenever the RSI is above 50, the trend is bullish. If the RSi value is below 50, then the trend is considered bearish.
When trading a long position, we would look for an upward breakout candle of the symmetrical triangle, with the RSI reading above 50. Vice versa, a short position would entail a breakdown of the symmetrical triangle with RSI below 50.

| Entry | Long: When a breakout candle closes above the pattern with RSI above 50. Short: When a breakout candle closes below the pattern with RSI below 50. |
| Stop Loss | Long SL: Below the upper trendline. Short SL: Above the lower trendline. |
| Take Profit | Measured Move Target |
Symmetrical Triangle with MACD
The Moving Average Convergence Divergence (MACD) indicator is another oscillator that can be used to confirm the validity of a breakout. By turning off the MACD line and signal line, we can get a MACD indicator with just the histogram.
The MACD Histogram appears as green (bullish) and red (bearish) bars. We use this to identify the momentum of price after the breakout.
When a breakout occurs, we’ll use the histogram as an additional signal to take the trade. So if the breakout occurs to the upside, we wait until there’s a green histogram bar before entering the trade, and vice versa.
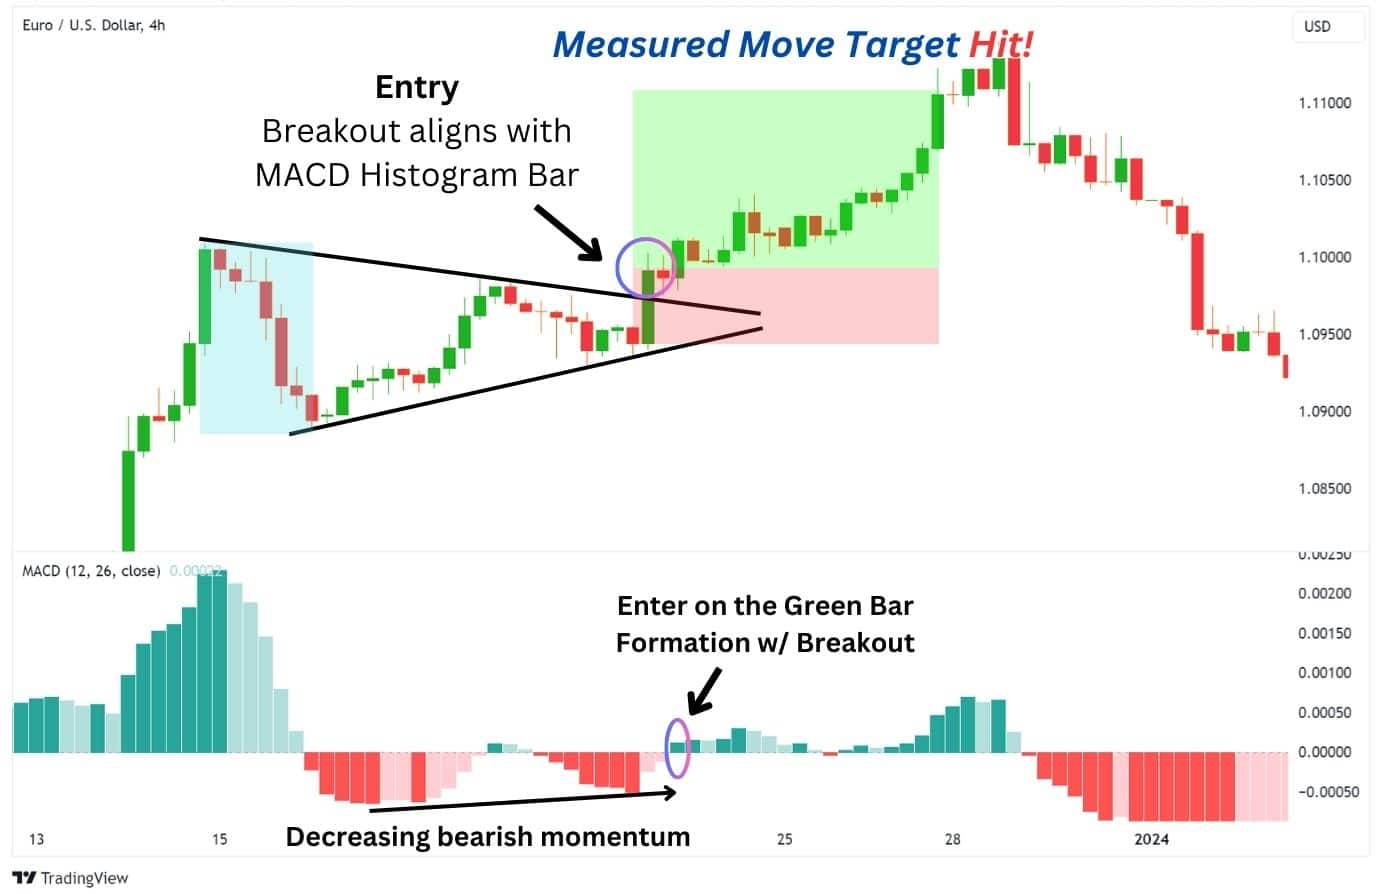
By using the MACD histogram to confirm the breakout’s validity, we can filter out potential fakeouts, and take higher winning percentage trades.
Additionally, we can use the MACD’s histogram to predict when and where a breakout will occur. Observing the chart above, we can see the MACD red bars gradually decreasing in size, indicating weakening bearish pressure. With this, we can expect a higher likelihood of a bullish breakout.
| Entry | When the breakout candle aligns with the MACD histogram’s bar.Green histogram bar is bullish. Red histogram bar is bearish. |
| Stop Loss | Long SL: Below the upper trendline. Short SL: Above the lower trendline. |
| Take Profit | Measured Move Target |
Symmetrical Triangle with Bollinger Bands
The Bollinger Bands® indicator highlights hidden support and resistance areas where the price is likely to react. This helps traders choose more precise entry points in a symmetrical triangle breakout.
- Avoid entering a long trade if the breakout candle is near the top band, as this can lead to fakeouts or deep retracements that might hit the stop loss.
- Conversely, a breakout candle formed after a bounce on the midline or lower band provides a stronger signal to enter a trade.
This method is illustrated in the example below. On the initial breakout on the USDCAD 3 Day Chart, we avoided a long trade since the price was sticking to the top band. The price then made a deep retracement to retest the lower band, giving us a bullish close that signalled a long entry.
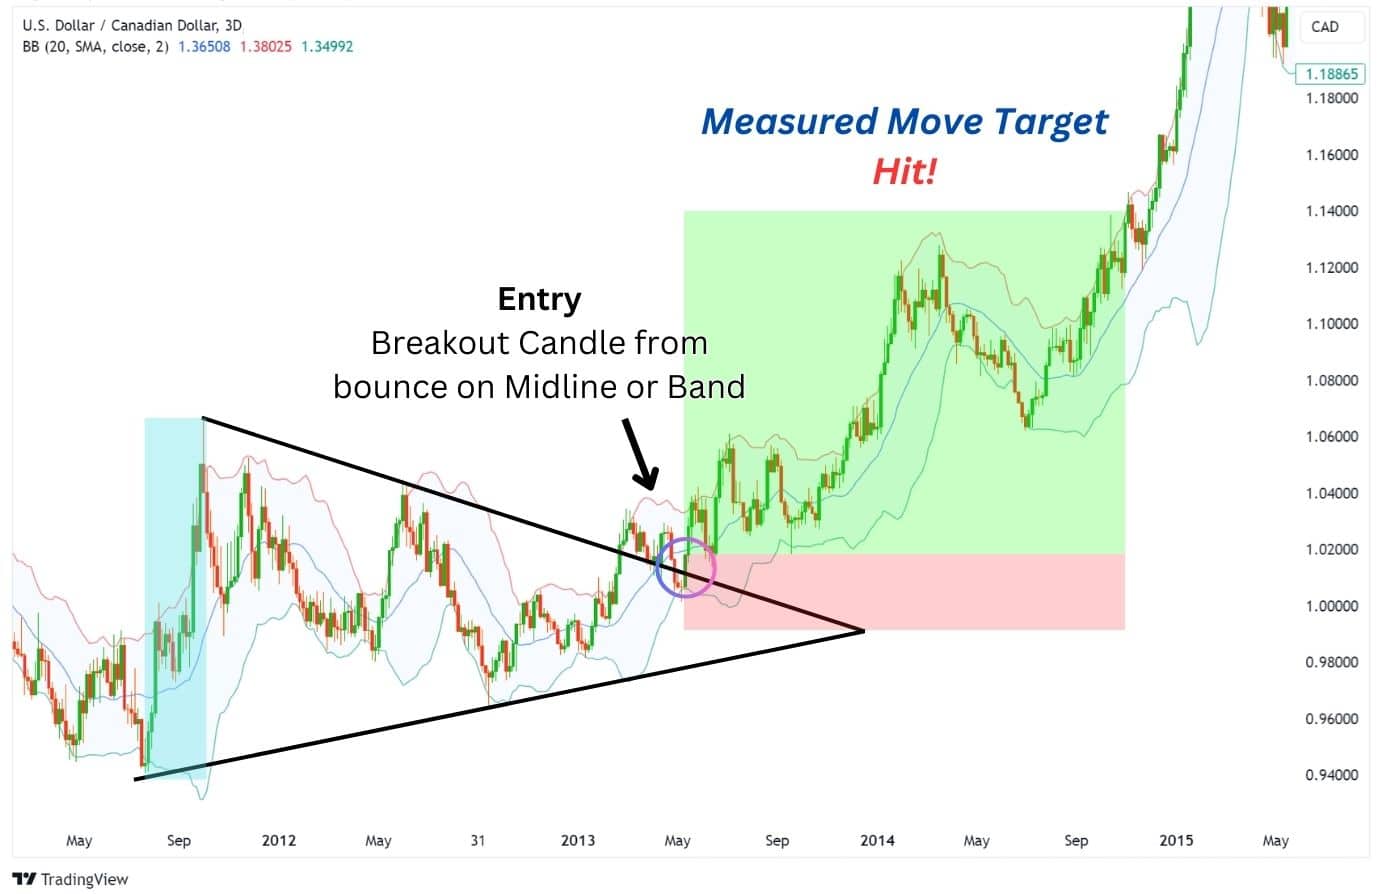
Results may vary based on your timeframe and Bollinger Band settings, as each asset behaves differently with these parameters. Therefore, it’s recommended to backtest this strategy and customise your band settings for each asset.
| Entry | When the breakout candle is formed at the midline or upper/lower band of the Bollinger Bands. Long Entry: At Bollinger Bands midline or lower band. Short Entry: At Bollinger Bands midline or upper band. |
| Stop Loss | Long SL: Below the Bollinger Bands.Short SL: Above the Bollinger Bands. |
| Take Profit | Measured Move Target |
Symmetrical Triangle with Moving Averages
Moving averages can act as hidden support and resistances, as well as trend indicators that help confirm the direction of the breakout. A key factor of success in using this strategy is selecting a moving average that has been shown to be previously respected by the asset.
Here’s how it works:
- Go long when the price breaks above the pattern, and is above the moving average.
- Go short when the price breaks below the pattern and is below the moving average.
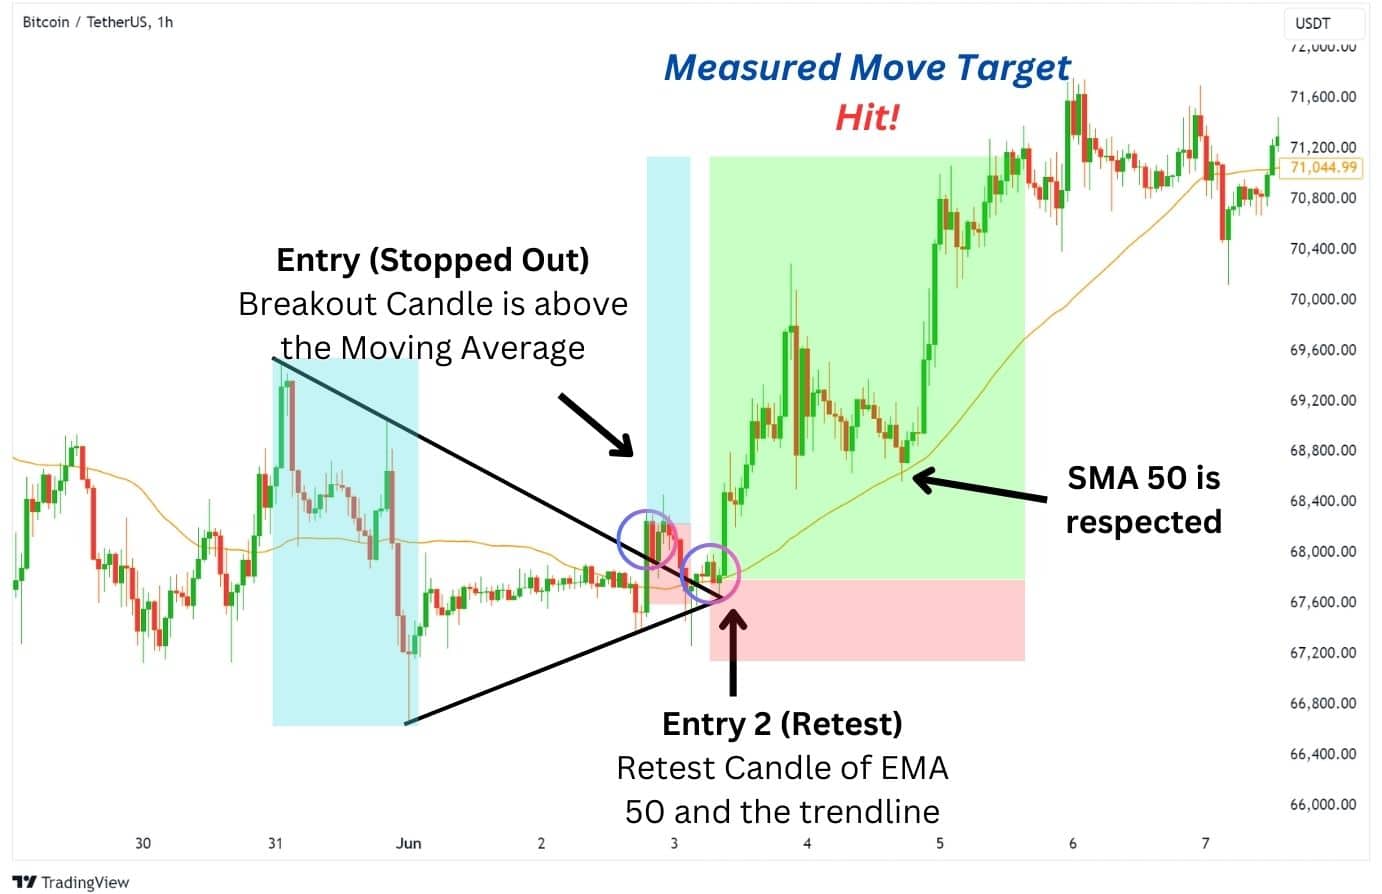
For patterns that consolidate sideways, such as the Symmetrical Triangle, it is actually better to use a simple moving average (SMA) that does not react quickly to recent price movements.
A fast-reacting moving average like the Exponential Moving Average will be smack in the middle of the price action, leading to confusing signals. It will chop around more compared to the SMA.
This strategy becomes even more effective when the SMA lines up with a trendline, allowing you to confidently trade the breakout, or the retest.
| Entry | Long Entry: At the breakout or retest candle, and above the moving average. Short Entry: At the breakout or retest candle, and below the moving average. |
| Stop Loss | Long SL: Below the upper trendline. Short SL: Above the lower trendline. |
| Take Profit | Measured Move Target |
Trade Trend Reversals with Symmetrical Triangle
Symmetrical Triangles are consolidations that can form at key levels such as support or resistance levels.
By marking out major support and resistances, as well as using Fibonacci retracements, we can identify where a consolidation may form.
In the context of a retracement, the symmetrical triangle pattern can alert us to a local trend reversal. On the breakout, this allows us to enter a trade in the direction of the overarching trend.
Symmetrical Triangle with Fibonacci Retracements
Fibonacci retracements are popular levels traders pay attention to for a possible reversal. By using this concept, we can mark out hidden support and resistances traders will look to for a price reaction.
Aligning with a more advanced concept: Elliott Wave Theory, symmetrical triangles tend to form at the 0.382 and 0.50 fibonacci retracement level.
The strategy involves anticipating a consolidation around the 0.382 and 0.50 Fibonacci levels. Afterwhich, you would either trade the breakout from these levels or enter a position from the trendline, aiming to follow the direction of the previous trend.
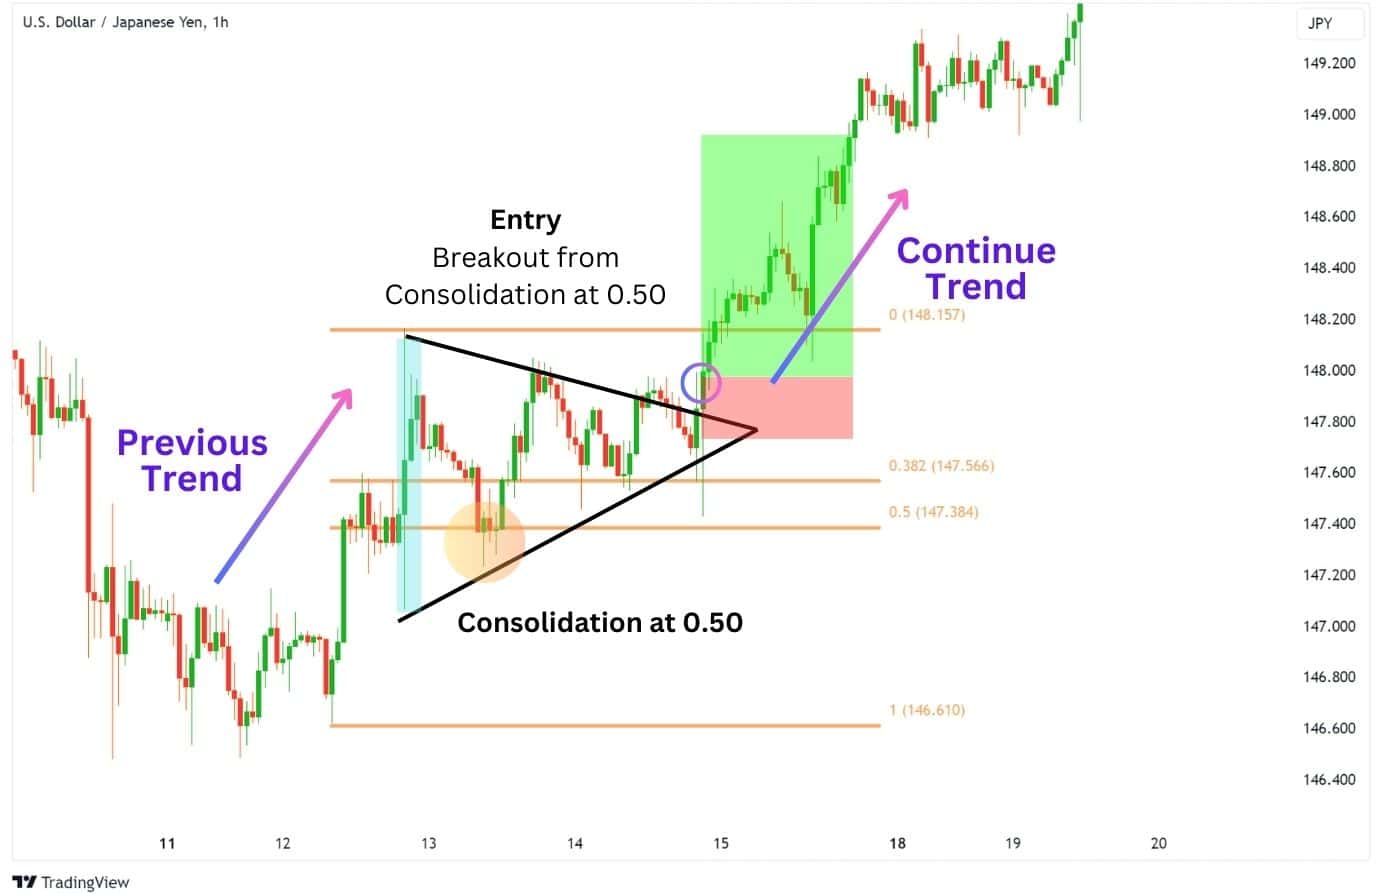
Other important fibonacci levels include 0.618 and 0.786, though these levels are less likely to be hit in the context of a symmetrical triangle formation.
| Entry | After a significant move up or down, and price manages to retest the 0.382 or 0.50 level. At the breakout candle of the pattern with additional confirmations |
| Stop Loss | Long SL: Below the upper trendline. Short SL: Above the lower trendline. |
| Take Profit | Measured Move Target |
Symmetrical Triangle Breakout Trading With Support and Resistance
The same strategy can be applied with traditional support and resistance levels. These are horizontal levels in the chart where the price has consolidated or pivoted away from previously.
Symmetrical triangle patterns can occur at major support or resistance levels, chopping up and down – seemingly disrespecting the price zone. However, this is not the case, the consolidation at these marked levels indicate that a large move is about to happen, and could either be a continuation or reversal.
Understanding this type of price action can give traders better insight into the markets, allowing them to plan ahead (to trade the breakout) when everyone else is confused. Let’s see this in a chart example:
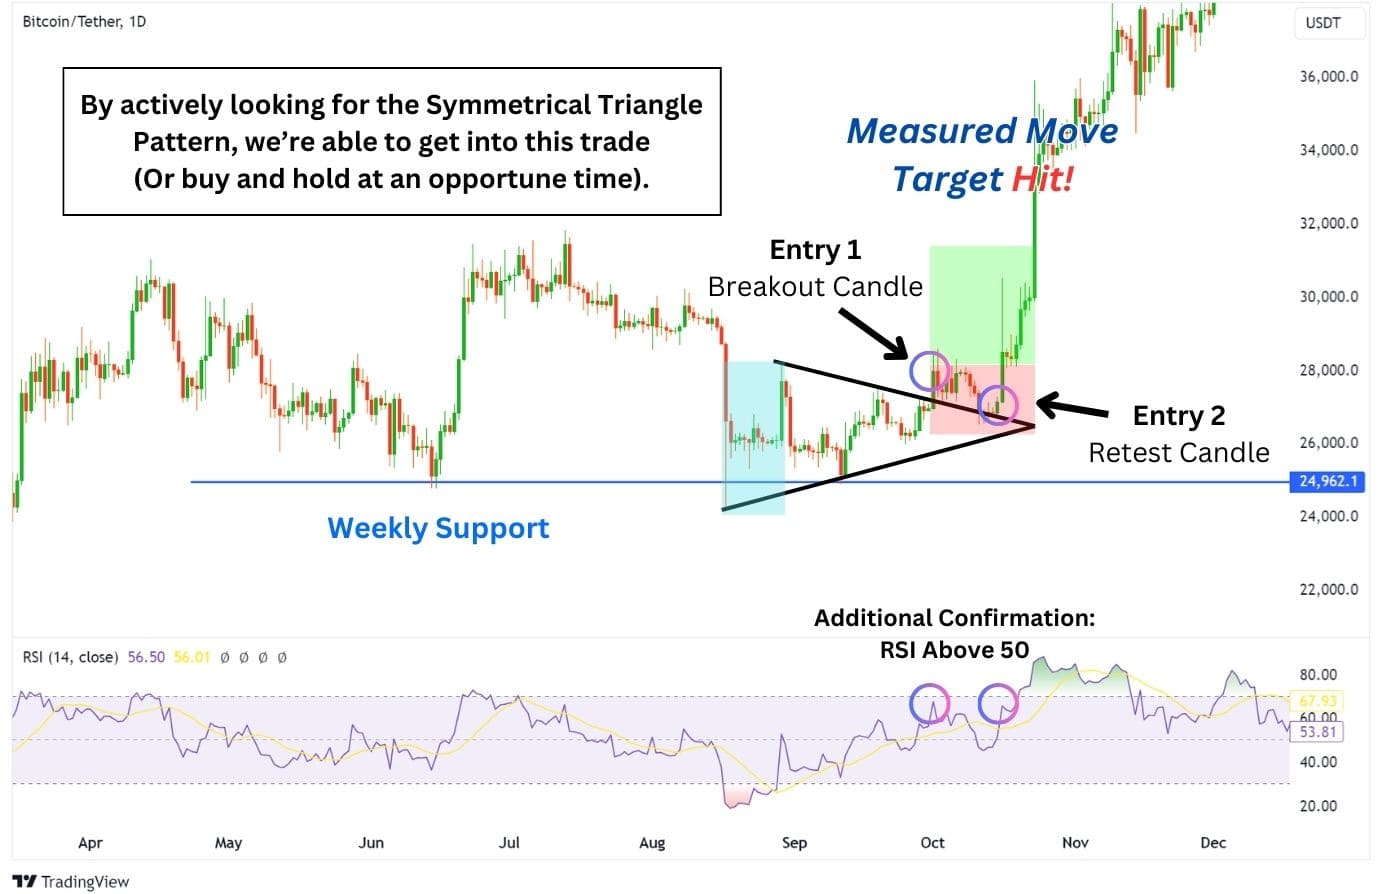
Here, we can see that the weekly support level was created in June 2023, when Bitcoin bounced off approximately $25,000. Then, as we’re coming back down to retest the weekly level, Bitcoin begins to form a Symmetrical Triangle Pattern, leading to a massive breakout and bullish continuation.
Identifying this pattern at key support levels can be a great way to implement a buy and hold strategy, adding an extra layer of confirmation into your buying decisions.
| Entry | After the price has tested a significant support or resistance level, forming a symmetrical triangle consolidation. At the breakout candle of the pattern with additional confirmations |
| Stop Loss | Long SL: Below the upper trendline. Short SL: Above the lower trendline. |
| Take Profit | Measured Move Target |
Advantages of Symmetrical Triangle Pattern
With its predictive capabilities and versatility, the symmetrical triangle pattern offers several advantages to traders. It can be used to:
- Establish long or short trade setups with clear entry and exit points.
- Available on all assets and time frames.
- Works as an additional way of getting into a trade if you’ve missed out on the initial entry.
But what about the downsides?
Disadvantages of Symmetrical Triangle Pattern
Despite all its advantages, the symmetrical triangle pattern also comes with a slew of disadvantages when traded rigidly.
- The measured move target can be a premature exit, leading to an nonoptimal take profit method (see many examples above).
- Can sometimes be difficult to spot, or confused with other patterns such as the Rising Wedge.
- Susceptible to fake outs or false breakouts, leading to a loss.
Can False Breakouts Occur in Symmetrical Triangle Patterns?
False breakouts are a reality in trading, and symmetrical triangle patterns are no exception. When a false breakout occurs, the price initially breaks out of the pattern but then reverses direction.
A false breakout in a symmetrical triangle pattern can also signify that what you’re observing is another pattern with a triangular structure, such as a Falling Wedge.
This can lead to misleading signals, potentially causing traders to enter trades based on false information. It’s therefore crucial to use the symmetrical triangle pattern in conjunction with other technical analysis tools to confirm breakout signals and manage risk effectively.
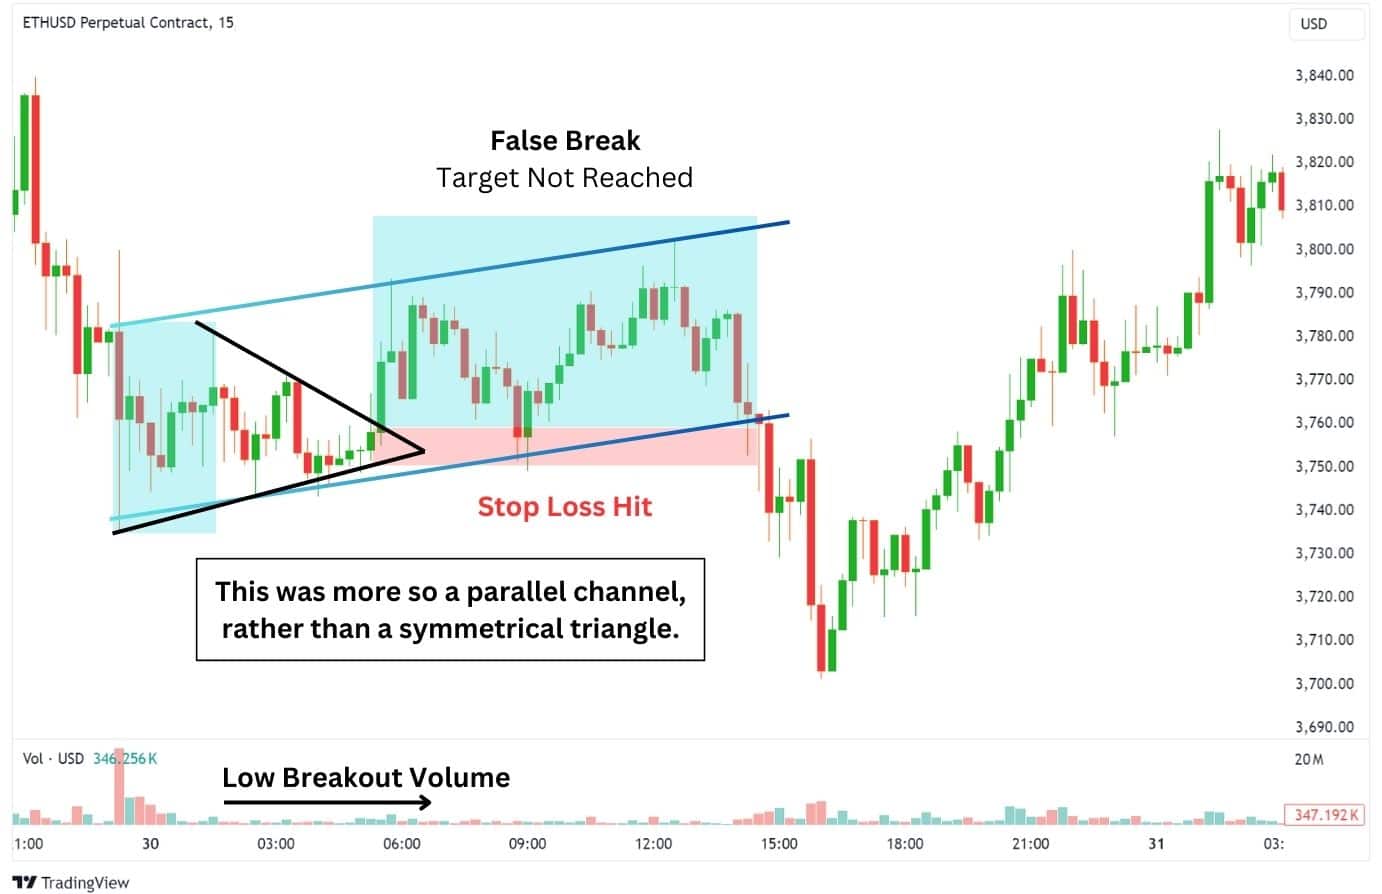
To avoid false signals, we can observe if the pattern has a volume spike on the breakout – if not, we could be in a greater consolidation, such as the parallel channel shown in this chart above.
But how does the symmetrical triangle pattern compare to other patterns?
Symmetrical Vs Expanding Triangles
Symmetrical triangles and expanding triangles (a.k.a. broadening triangle, megaphone formation, broadening formation) are similar but develop in the opposite direction.

While the symmetrical triangle pattern consolidates towards an apex creating a series of lower highs and higher lows, the expanding triangle behaves in the opposite pattern. The expanding triangle will see diverging trend lines as it creates a series of higher highs and lower lows.
Timing the end of an expanding triangle is difficult. Waiting for a breakout of the trendline is of no use in trading the expanding triangle pattern too. Expanding triangles are difficult patterns to spot and trade. Therefore, it’s best to move on to another market that has a cleaner pattern developing.
Symmetrical Triangle Vs Pennant
The key differences between a symmetrical triangle and pennant are their directional bias and measured move targets.

A symmetrical triangle has a neutral directional bias as it could break to the upside or downside. The measured move target is based on the distance between the first high and the first low of the triangle.
Meanwhile, a pennant does have a directional bias. The bull pennant has a bias towards bullish breakouts, while the bear pennant is more likely to break lower.
Pennants are a continuation pattern that consolidates in the shape of a symmetrical triangle, forming after a sharp trend. This sharp move forms the “flag pole”of the pennant pattern, which acts as the measured move target of a pennant breakout.
Symmetrical Triangles Vs Ascending Triangles
While both triangles sport two converging trend lines, an ascending triangle pattern has a flat top and a rising bottom, suggesting more aggressive buying pressure.
In contrast, a symmetrical triangle consists of two trend lines that converge at an equal angle, indicating a period of price consolidation with almost equal buying pressure and selling pressure.

A symmetrical triangle has no inherent breakout bias, making it a neutral bias. However, they tend to appear in trending environments, which make the pattern act like a continuation pattern.
The ascending triangle is different in that, no matter what kind of prevailing trend it occurs in, the ascending triangle has a bullish bias of breaking to the upside.
Symmetrical Triangles Vs Descending Triangles
A descending triangle has a flat bottom and a descending top, indicating increasing selling pressure. In contrast, symmetrical triangles have two trend lines that converge at an equal slope, suggesting a period of price consolidation, with almost equal selling pressure and buying pressure.
As stated, the symmetrical triangle has neutral bias, only picking a direction when the breakout occurs. However, these patterns do have a habit of favouring the overarching trend – meaning that if price is in a downtrend, it’s likely for the symmetrical triangle to continue breaking down lower.
Descending triangles, on the other hand, have a bearish breakout bias no matter what trend it occurs in. That means if a descending triangle appears in a prevailing uptrend, it is still biassed towards a bearish break in the price action.
Symmetrical Triangles Vs Wedges
Symmetrical triangles are as they sound, a triangle with symmetrical sides. In trading, this would look like the price is forming lower highs, and higher lows at the same time, converging into a tight range.
These triangles do not have a specific bias in direction and can break out either upwards or downwards.
In contrast, wedges are characterised by two converging trend lines that slant up or down, giving the patterns distinct bullish and bearish biases (based on the slanted direction):
- Falling Wedges: A falling wedge has a downward slope, with both trend lines slanting downwards. This pattern suggests a potential reversal, typically bullish, indicating that the selling pressure is diminishing.
- Rising Wedges: A rising wedge has an upward slope, with both trend lines slanting upwards. This pattern suggests a potential reversal, typically bearish, indicating that the buying pressure is weakening.
Wedges are reversal patterns that convey the end of a trend, or the beginning of a new one. In contrast, a symmetrical triangle is a continuation pattern that can fit into a bull or bear trend; holding a greater opportunity to break in the overall trend direction.

What is an Example of a Symmetrical Triangle Pattern in Trading?
A symmetrical triangle pattern is a form of consolidation, where the price basically starts to move sideways. During this consolidation, the price forms lower highs, and higher lows, which gives us two trend lines that converge together.
Here is an example of the symmetrical triangle pattern on a live chart: WTI (USOIL) 15 minute.
See how the price gradually begins to go sideways? It’s at this point we should be alerted to the idea of a symmetrical triangle forming.
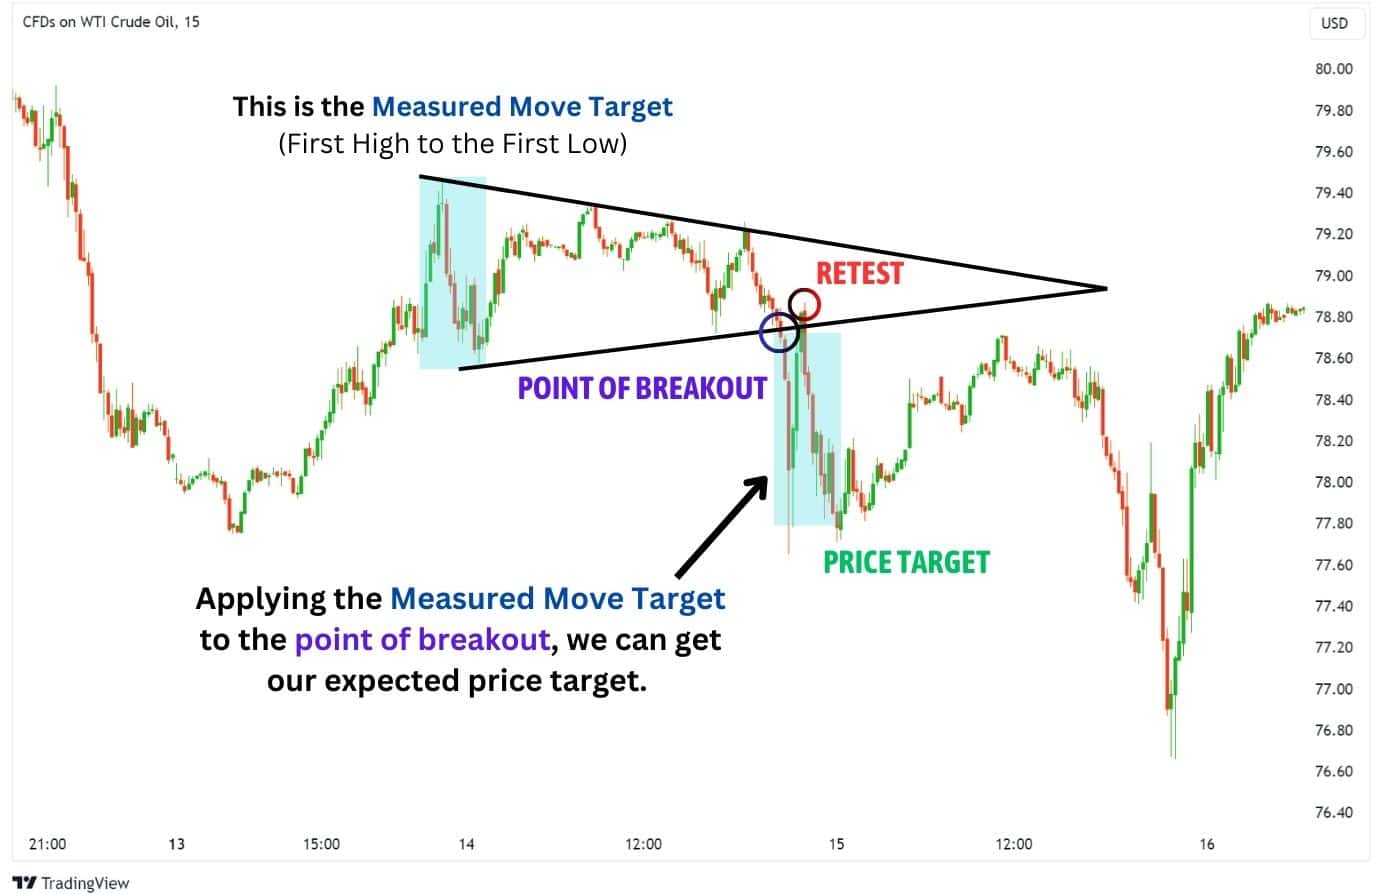
Then, the price breaks to the downside, giving us a clear short entry signal at the breakout point.
Eventually, the price hits our targets but comes back for a retest of the lower trend line, giving us another opportunity to enter a short trade.
How Does A Symmetrical Triangle Pattern Fit Within Elliott Wave Theory?
For those familiar with Elliott Wave Theory, you might be wondering how the symmetrical triangle pattern fits within this framework. In Elliott Wave Theory, a symmetrical triangle often emerges as a consolidation pattern composed of five waves labelled A-B-C-D-E. The symmetrical triangle chart pattern is just a portion of a larger wave pattern. Therefore, a symmetrical triangle appears only within certain places of the Elliott Wave sequence.
Here’s where you might find a symmetrical triangle in Elliott wave:
- Wave 4 of an impulse wave
- Wave b of a zigzag pattern
- Wave x of a double correction or double combination
- Wave y of a double combination
- The second wave x of a triple correction or triple combination

In the copper chart above, a bullish symmetrical triangle pattern appears in wave (4) of the impulse pattern. The triangle led to a bullish breakout above the upper line in wave (5).
Symmetrical triangles within the context of the Elliott wave are generally considered continuation patterns. As a result, symmetrical triangles can help you reverse engineer the Elliott wave count knowing where they tend to appear within the patterns.
This structure can provide additional insights into potential price movements, making the symmetrical triangles a valuable tool when used in conjunction with Elliott Wave Theory.
FAQ
Is a symmetrical triangle pattern bullish or bearish?
Symmetrical triangles are versatile, as they can indicate bullish or bearish trends based on the breakout direction. It shares similarities with the adaptability of a chameleon. A bullish breakout occurs when the price breaks above the upper trend line, indicating that the bulls are gaining control and that the price may continue to rise.
Conversely, a bearish breakout occurs when the price breaks below the lower trend line, suggesting that the bears have taken over and the price might continue to fall. But how reliable is this pattern?
How reliable is the symmetrical triangle pattern?
Symmetrical triangles are generally considered reliable and are typically seen as a continuation pattern within a trend. However, they can sometimes signal a trend reversal. The reliability of a symmetrical triangle can only be confirmed after a breakout has occurred, with breakouts needing to be validated by an increase in volume and price movement.
What is the difference between a bullish and bearish symmetrical triangle breakout?
A bullish and bearish symmetrical triangle breakout are like two sides of a coin. A bullish breakout occurs when the price breaks above the upper trend line, signalling that the bulls are gaining control and the price may continue to rise. On the other hand, a bearish breakout occurs when the price breaks below the lower trendline, indicating that the bears have taken over and the price might continue to fall.
And what about the price target for a symmetrical triangle breakout?
What is the price target for a symmetrical triangle breakout?
This price target is typically calculated by measuring the height of the triangle and projecting this distance from the breakout point.
What is symmetrical triangle’s bias?
When it comes to the symmetrical triangle bias, it’s important to remember that:
- This pattern typically represents a period of market indecision leading up to a breakout.
- Symmetrical Triangles do not inherently indicate a bullish or bearish bias. Rather, it relies on the market’s existing trend to have a bias.
- It represents a period where the market is in equilibrium and neither buyers or sellers have a clear advantage.
Is it possible for a symmetrical triangle to indicate a reversal in the trend?
Is symmetrical triangle a reversal pattern?
While symmetrical triangles can signal a trend reversal, they are typically seen as neutral patterns, with a slight bias towards the existing trend. This means that they often signal the continuation of the current trend after a period of consolidation.
However, if a symmetrical triangle pattern forms during an uptrend and is followed by a breakout to the downside, this could signal a trend reversal.
Is the symmetrical triangle pattern a continuation pattern?
Yes, symmetrical triangles can be considered a continuation pattern. It is formed during a trend and often results in the continuation of that trend after the breakout. However, it’s crucial to remember that while a symmetrical triangle is typically a continuation pattern, it can sometimes signal a trend reversal.
So, what happens when a symmetrical triangle pattern fails?
Is it possible for a symmetrical triangle pattern to fail?
Yes, a symmetrical triangle pattern can fail when the price breaks out of the pattern but then reverses direction, resulting in a false breakout.
Formation of the symmetrical triangle chart pattern?
The formation of a symmetrical triangle chart pattern is like watching a suspense movie. The plot (or in this case, the price) fluctuates within a narrow range, forming two converging trend lines that create a narrowing shape. This pattern signifies a period where buyers and sellers reach a state of equilibrium, leading to a pause in the prevailing price trend.
The climax of the movie (or the pattern) is the breakout, which occurs when the price moves beyond the converging trend lines, signalling the potential start of a new trend. The symmetrical triangle pattern in technical analysis offers several advantages. It can help in identifying potential price breakouts and trend reversals, providing traders with valuable insights for decision-making.
What are the advantages of symmetrical triangle pattern in technical analysis?
The symmetrical triangle pattern in technical analysis offers advantages such as identifying potential price breakouts, anticipating market trends, and providing clear entry and exit points for trades. Traders can use this pattern to make informed trading decisions.
How to trade with a symmetrical triangle pattern?
Trading with a symmetrical triangle pattern is like sailing with the wind. You need to know when to set sail (enter the trade) and when to dock at the harbour (exit the trade).
The first step is to identify the symmetrical triangle pattern on the chart. Then, wait for a breakout or breakdown to occur.
There are two main entry options: immediate market entry once a high time frame candle closes above or below the triangle, or waiting for a retest of the breakout point for a potentially better entry point.
What are the key factors to consider before trading a symmetrical triangle pattern?
Before trading a symmetrical triangle pattern, there are several key factors to consider:
- Assess the direction of the prior trend, as symmetrical triangles are predominantly viewed as continuation patterns, making breakouts that indicate the ongoing trend generally stronger signals.
- Wait for the breakout, which can occur in either direction, and then evaluate entry points in alignment with the direction of the breakout.
- Implement a stop-loss order just below the upper trend line for bullish breakouts, or above the lower trend line for bearish breakouts, as an important risk management step.
What does a symmetrical triangle breakout signify?
The direction of a breakout, either above the upper trend line or below the lower trend line, tells you which side between bulls and bears has gained the upper hand. A significant increase in volume is expected during a breakout to confirm the pattern.
And what is the price target for a symmetrical triangle breakout?
Does the symmetrical triangle pattern have a bullish bias?
The symmetrical triangle pattern may indicate a bullish or bearish market direction, which depends on the breakout’s direction. This pattern is often used by traders to anticipate potential price movements. If the price breaks above the upper trend line, it indicates that the bulls are gaining control and that the price may continue to rise, which is a bullish signal. Conversely, if the price breaks below the lower trendline, it indicates that the bears have taken over and the price might continue to fall, which is a bearish signal.
What is the best way to trade symmetrical triangle pattern?
The best way to trade with a symmetrical triangle pattern involves a combination of patience and vigilance. First, identify the symmetrical triangle pattern on your chart. Then, patiently wait for a breakout or breakdown to occur.
As for entry options, you can either enter the market immediately once a high timeframe candle closes above or below the triangle, or you could wait for a retest of the broken trend line for a potentially better entry point. Remember to set a stop-loss order within the body of the triangle to minimise potential losses.
Are symmetrical triangles always reliable for trading signals?
While symmetrical triangles are generally considered reliable and are typically seen as continuation patterns within a trend, they can sometimes signal a trend reversal. The reliability of a symmetrical triangle can only be confirmed after a breakout has occurred, with breakouts needing to be validated by an increase in volume and price movement.
However, all chart patterns, including symmetrical triangles, can produce false signals or be invalidated due to market volatility, which necessitates setting appropriate stop losses for risk management.
Can RSI be used to trade together with the symmetrical triangle pattern?
Yes, RSI or the Relative Strength Index can be used in conjunction with the symmetrical triangle pattern to enhance trade accuracy. The RSI is a momentum oscillator that measures the speed and change of price movements, providing traders with a measure of the strength and velocity of a market trend.
When this technical indicator is used in conjunction with the symmetrical triangle pattern, it can provide valuable insights into potential breakouts and reversals, helping traders make more informed decisions.


