


Written by:

Reviewed by:


- March 24, 2025
- 25 min read
Oil CFDs Guide – Buy, Sell and Trade
Oil CFDs let traders speculate and trade WTI and Brent Crude Oil prices without directly owning any oil physically. Learn how you as a trader can take advantage of this, and trade oil with minimal capital.
What are Oil CFDs?
Oil CFDs (Contracts for Difference) are derivative contracts that allow traders to exchange the difference in the value of crude oil prices between the opening and closing of the contract. Instead of owning the physical commodity, oil CFDs enable traders to speculate on the direction of oil prices, potentially profiting from the price difference.
With the global oil market valued at approximately $2.1 trillion (as of 2022), oil CFDs are a popular product for retail traders who want to take advantage of opportunities in both rising and falling markets. This means you can go long (buy) if you think the price will rise, or go short (sell) if you think the price will fall. This article provides a comprehensive guide to understanding oil CFDs, including their mechanics, benefits, risks, and strategies for trading.
How Do Oil CFDs Work?
Oil CFDs mirror the spot prices of oil, allowing traders to speculate from price movements without physically owning any oil. When you execute a trade, you agree to exchange the difference in oil prices from when you open the trade to when you close it.
Entering a CFD trade means you’re buying or selling barrels of oil with each CFD typically representing 1 barrel (159 litres, 35 imperial gallons, or 42 US gallons).
Here’s a more comprehensive breakdown:
Execution: When you open a long/buy position on an Oil CFD, you’re speculating that the price will increase. If you open a short/sell position, you’re betting for the price to fall.
Earnings or Losses: In long positions, you profit if the price rises and incur losses if it falls. In short positions, you profit if the price falls and incur losses if it rises.
Leverage: Oil CFDs typically offer leverage, allowing you to control a larger position with a smaller initial investment. However, this amplifies both potential gains and losses.
Costs: Trading involves spreads (the difference between buy and sell prices) and may include overnight financing charges if you hold positions beyond the trading day’s close.
Depending on your position (buy/sell), the difference between the closing price and opening price will either result in a profit or loss.
What Affects the Price of Oil?
Oil prices are driven by various global factors because of the vital role energy plays in the economy and daily life of every country. When trading oil, it’s crucial to stay updated on global news and keep an eye on factors that can affect supply and demand.
Controlling the Global Oil Supply
The balance between how much oil is produced and consumed is a key factor in determining oil prices. Major producers like the U.S., Russia, and OPEC+ adjust their output based on market conditions.
OPEC+ plays a significant role by cutting or increasing production to influence supply, with cuts usually pushing prices higher and increased output leading to lower prices. For example, on April 2nd, 2023, OPEC+ introduced a surprise cut of 1.16 million barrels in oil production. This caused the price of WTI (USOIL) to shoot up by approximately 580 pips on the subsequent Monday.
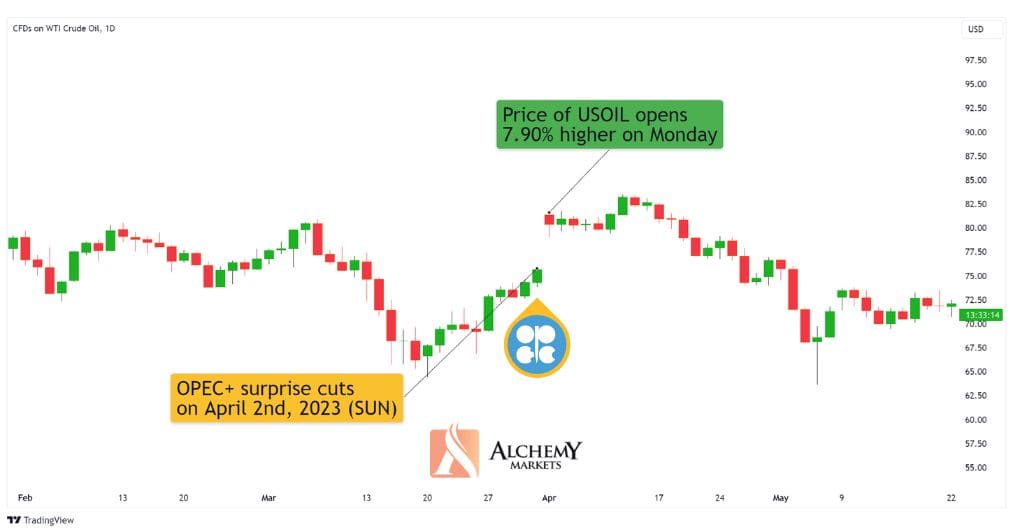
Given that OPEC+’s meetings are scheduled in advance, oil traders are always looking forward to these meetings to anticipate the price action.
Driving Global Oil Demand Through Growing Economies
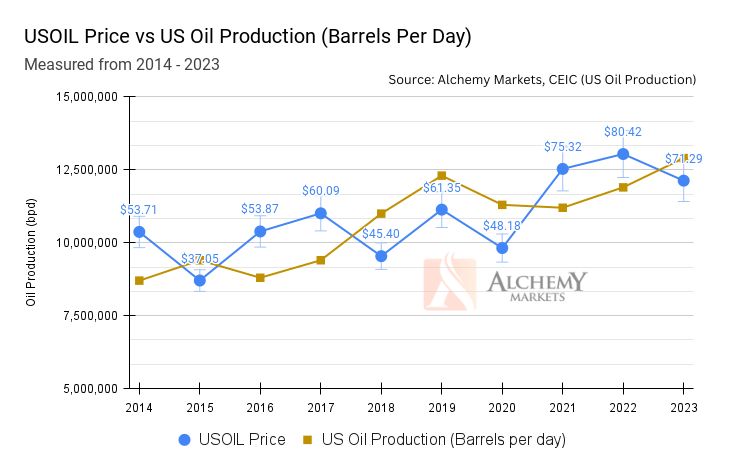
Economic growth, particularly in large economies like the U.S., China, and India, drives oil demand. China’s rapid industrialisation, urbanisation, and energy needs make it a significant player in global oil demand.
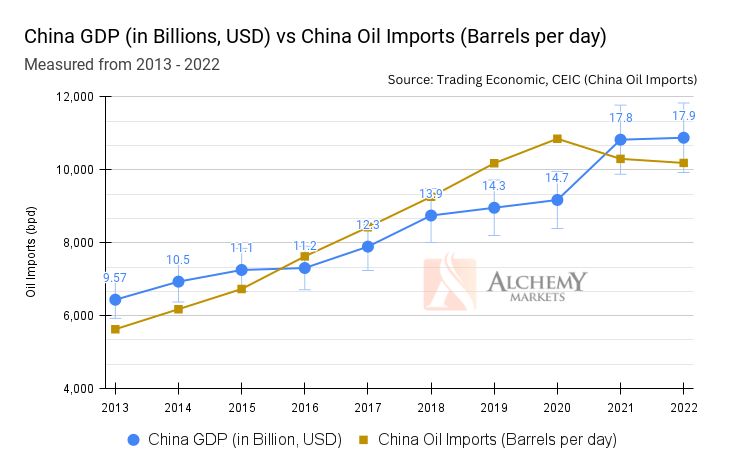
As the world’s largest oil importer, China’s economic activity can create strong upward pressure on oil prices when its economy grows. Seasonal factors like winter heating demand and summer travel also affect consumption.
Geopolitics at Play
Political instability, conflicts, or sanctions in key oil-producing regions can disrupt supply, often causing prices to rise.
Conversely, stable geopolitical conditions help maintain or lower prices by ensuring consistent supply. Sanctions on oil-exporting nations may restrict supply and lead to price increases.
Macroeconomic Factors
During Q1 and Q2 2020, WTI (USOIL) prices fell by 99.99%, which was caused by a COVID-19 triggered recession. Due to global fears of the pandemic, and also mandatory lockdowns, people stayed at home and didn’t drive, and businesses slowed down on their operations, causing the demand for oil to plummet harshly.
This highlights that global recessions, economic booms, and unexpected events, such as the COVID-19 pandemic, can significantly influence oil demand and prices.
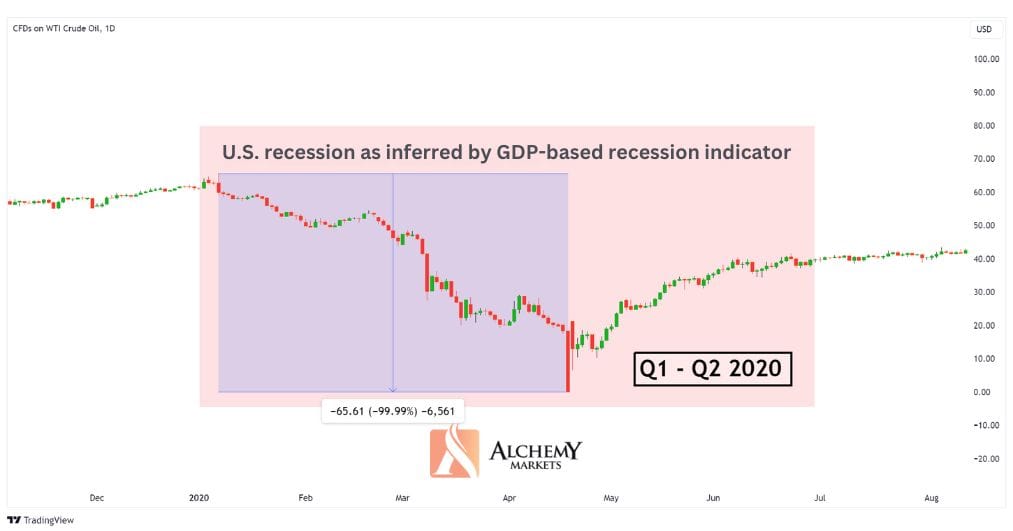
Blue shaded area US recession by FRED St. Louis
Eventually, WTI rallied back to pre-recession levels as the recovery began. Economic downturns generally reduce demand, pushing prices lower, while recovery phases increase consumption, leading to price increases.
Relations Between Major Players in Oil Markets
Cooperation between key producers like Russia and Saudi Arabia in managing oil production levels can significantly impact global oil prices. Agreements between these major players often influence supply, either stabilising or disrupting global markets.
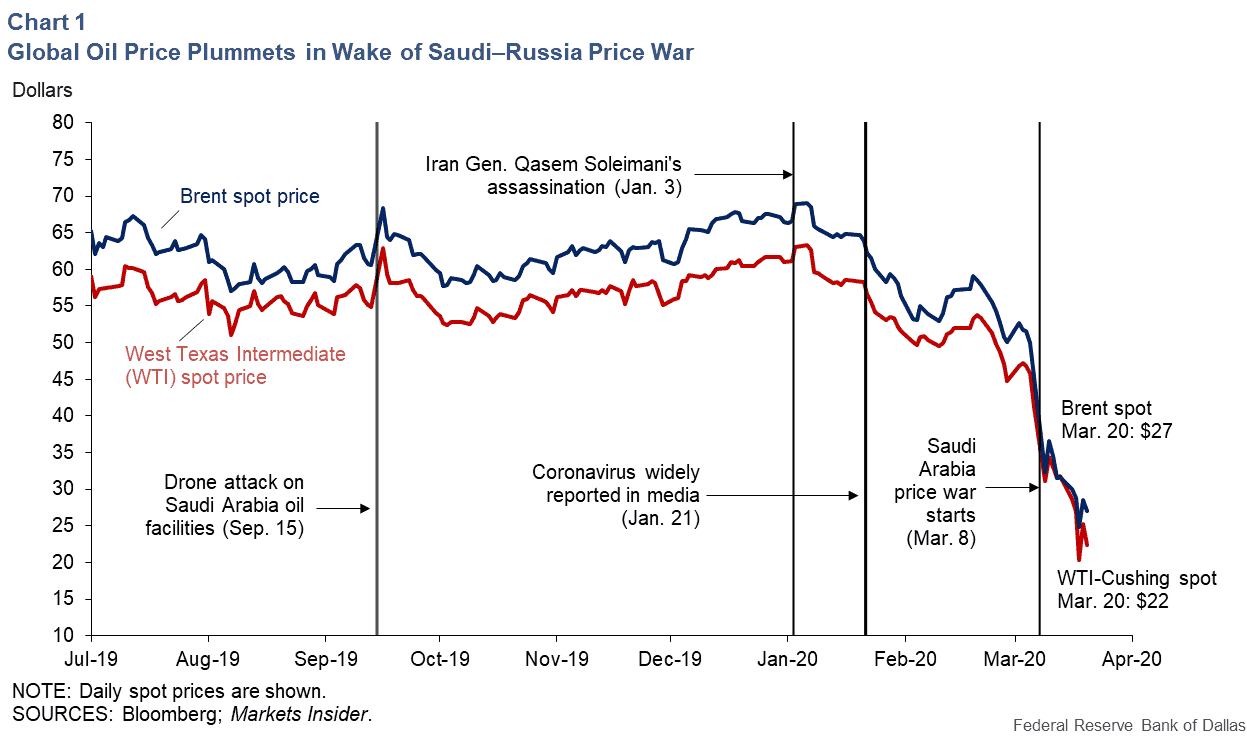
Conversely, conflicts between key players can lead to volatile price movements—such as the 2020 Russia-Saudi Oil Price War, which resulted in excess oil supply flooding the market, driving USOIL (WTI) and UKOIL (Brent) prices to multi-decade lows.
Speculations and Trading Sentiment
Traders pay attention to market sentiment, geopolitical events, and economic trends, which can lead to speculation and price volatility. Sudden shifts in demand or supply, driven by events or trader expectations, often result in rapid changes in oil prices.
Political Factors
Government policies, regulations, wars, and sanctions, such as those imposed on major oil producers, can significantly affect oil supply and prices.
For example, the Russian invasion of Ukraine in February 2022 drove the price of WTI significantly higher:
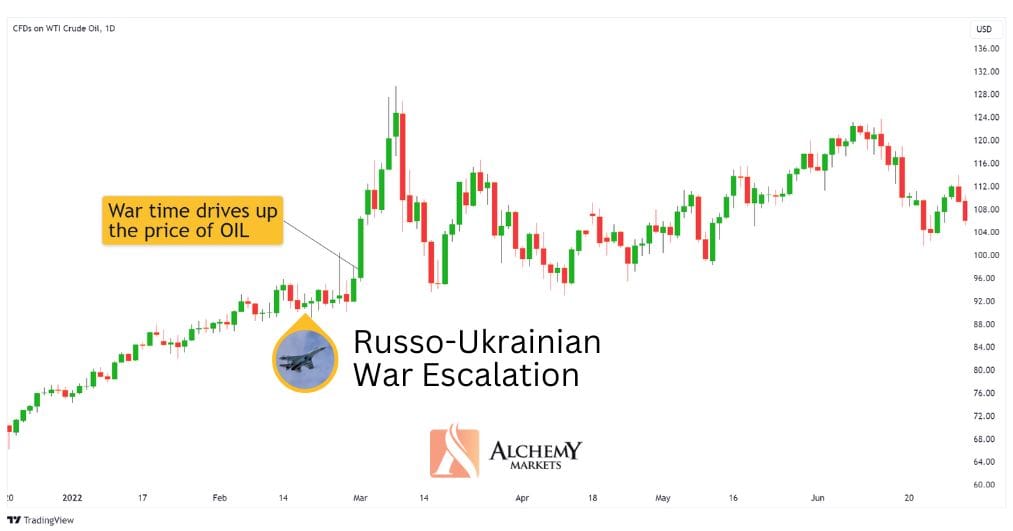
As crude oil is a key commodity for vehicles, including jet planes, tanks, and other forms of transportation, war can significantly increase the demand for oiI, leading to a rise in WTI (USOIL) and Brent Crude Oil (UKOIL) prices.
Natural Disasters
Natural disasters, like hurricanes, earthquakes, and floods, can disrupt oil production and supply chains. These events often cause price spikes due to delayed shipments or damaged infrastructure, creating opportunities for speculative trades based on expected supply disruptions.
A notable example of a natural disaster affecting oil prices is Hurricane Harvey on August 28th of 2017. The storm flooded Houston for several days, initially causing local oil demand to drop as residents sheltered. However, the flooding led to the shutdown of key oil refineries, which led to a supply shock, disrupting the markets.
This supply shock caused a rally in the price of oil, as illustrated below:
Alternative Energy
The global shift towards renewable energy is gradually reducing reliance on fossil fuels, including oil. While the transition is slow, innovations in renewable energy and policies aimed at reducing carbon emissions are expected to reduce long-term oil demand.
CFDs in the Oil and Gas industry
Oil and gas CFDs let traders speculate on price movements without owning the physical assets. The key benchmarks are WTI, Brent Crude, and Natural Gas (NGAS).
WTI (West Texas Intermediate) – Ticker: USOIL
WTI is the U.S. benchmark, known for being light and sweet, making it easy to refine. Its price is influenced by U.S. production, storage, and demand. WTI CFDs are popular for traders focusing on the U.S. market.
Brent Crude – Ticker: UKOIL
Brent is the global benchmark, used to price two-thirds of the world’s oil. It’s heavier than WTI but still light and sweet. Brent CFDs are used to trade based on global factors like OPEC decisions or geopolitical events.
Natural Gas – Ticker: NGAS
Natural gas is critical for heating and electricity, with demand spiking in colder months. NGAS CFDs are ideal for traders seeking more stability or diversification within the energy sector.
Why Trade Oil CFDs?
CFDs let traders speculate on the price of UKOIL and USOIL without physical ownership. This makes it accessible for anyone to trade oil prices without worrying about storage, shipment, and arranging trades with interested parties – everything is just a click away.
As a result, oil CFDs are a highly popular market traded across the globe, granting the market a large liquidity pool and ensuring that your trades get filled quickly. Though it’s difficult to pinpoint the exact volume traded per day, the Oil Futures market provides a proxy for overall trading activity – which equates to over 1.5 million WTI and Brent Crude Oil Contracts traded per day.
Additionally, this is a classic market with a long history. With this history comes a wealth of trading resources available for oil CFD specific strategies, as well as dedicated sites such as Mining.com which will offer critical news, data insights that could affect the future price of oils and metals.
Trading Oil CFDs also provides benefits which are not possible with traditional trading:
- Leverage: The ability to borrow funds from the broker to make a larger trade size.
- Short-Selling: The ability to bet on the price decline of crude oil, without needing to own the underlying asset and sell it.
- Ease of Diversification: Since you don’t need to hold any crude oil physically, diversifying your trades with Oil CFDs is extremely accessible with a broker.
- Flexibility: Starting on Sunday and closing on Friday, the oil CFD market is open for approximately 23 hours, 6 days a week. This makes trading crude oil CFDs more flexible than the global stock market, which is only open for 24 hours, 5 days a week.
- No Expiration Date: In addition to offering flexible trading hours, oil CFDs do not have an expiration date, unlike futures contracts or options. This allows traders to hold positions for as long as they choose, provided they maintain the required margin.
- Competitive Spreads: Oil CFDs tend to have low spreads. On Alchemy Markets, spreads on USOIL (WTI) averages around 0.3 pips, while UKOIL (Brent) averages 0.2 pips, equating to ~$0.0021 in every time when you open/close a trade.
With CFDs, everyday traders can participate in trading oil easily. It’s a product that appeals to every kind of trader due to its simplicity, and flexibility.
Leverage in Oil CFD Trading
Leverage is a key feature of CFD trading, typically expressed as X:1, where X represents the multiplier applied to your buying power. For instance, at Alchemy Markets, you can control a $5,000 position with just a $50 margin, thanks to our generous 100:1 leverage on oil CFDs for global clients (European clients have different leverage amounts). This leverage amplifies both profits and losses by the same factor. For example, with 100:1 leverage, a $1 profit becomes $100 – but likewise, a $1 loss becomes $100.
Leverage is designed to help traders diversify their margin across multiple assets without needing to deposit large sums into their brokerage account. Let’s say you deposited $1,000 dollars, instead of using it all just to trade USOIL, you can use just $10 to control the same position size, and still have $990 dollars to trade other assets with.
However, the increased risk from leverage means that proper risk management is crucial when trading CFDs, and make sure your trades don’t fall below their maintenance margin. This is why using risk management tools like stop-loss orders is vital to avoid reaching this point.
What is Maintenance Margin in Leverage Trading?
The maintenance margin is the small percentage of your trade’s value that you need to have in your account to keep the trade open. You can calculate it by dividing the leverage ratio by 100.
For example, with 100:1 leverage, you divide 100 by 100, which gives you a maintenance margin of 1%. So, if your trade is worth $10,000, your required maintenance margin would be $100.
| Leverage | Maintenance Margin |
| 2:1 | 50% of trade size |
| 10:1 | 10% of trade size |
| 20:1 | 5% of trade size |
| 50:1 | 2% of trade size |
| 100:1 | 1% of trade size |
| 500:1 | 0.2% of trade size |
While in a trade, if your account balance gets too low and your equity starts approaching the maintenance margin, you might receive a margin call. This is a prompt from the broker asking you to either add more funds or close some of your positions to keep your trades active and avoid liquidation, which could result in losing a significant portion of your account.
Example of Oil CFD Trading
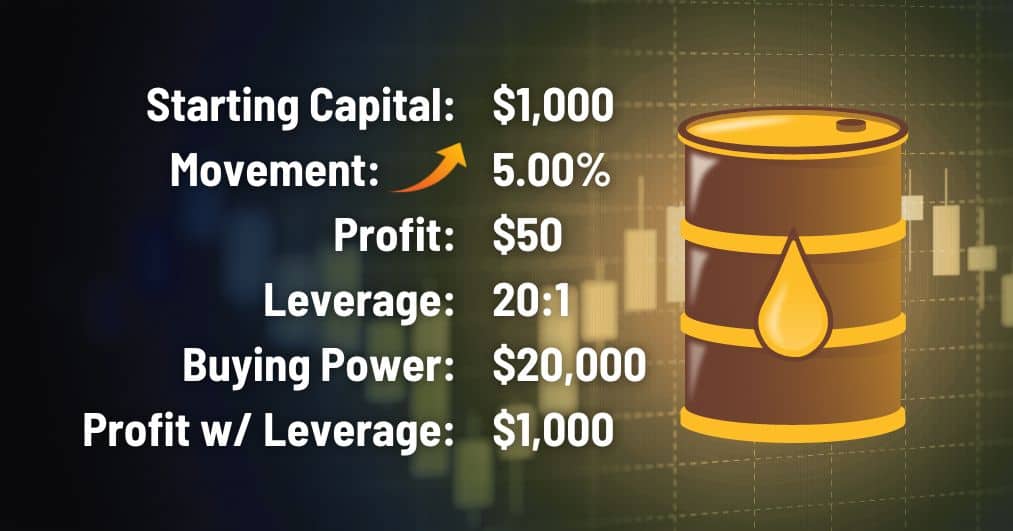
Let’s say you’re trading oil with a long position, and the price moves up by 5% from your entry.
Your initial margin, or starting capital of the trade is $1,000. Without leverage, the profit of this trade would be $50, five percent of $1,000 (your initial margin).
With 20:1 leverage, your buying power becomes $20,000.
Now, instead of earning $50, your profit would translate to 5% of $20,000 (your position size), which equates to a profit of $1,000.
This ability to increase your buying power is a double edged sword, as the losses incurred would also be magnified if the price goes against your trade’s direction.
Advantages of CFD Oil Trading
CFD Oil Trading offers unparalleled flexibility compared to physical oil trading, oil futures and options trading, and is accessible to anyone.
- No Physical Ownership: Traders can speculate on oil prices without dealing with the logistics of storing or shipping physical oil, making it accessible and hassle-free.
- Leverage: The ability to control larger positions with a smaller initial investment by borrowing funds from the broker, amplifying potential profits.
- Short-Selling: CFD trading allows you to profit from both rising and falling oil prices by betting on price declines, without needing to own the underlying asset.
- Liquidity and Quick Trade Execution: Oil CFDs are highly popular, providing a large liquidity pool that ensures trades are filled quickly.
Disadvantages of CFD Oil Trading
While CFD Oil Trading comes with a suite of benefits, this unique asset class also offers a set of risks traders must be aware of.
- Leverage Risk: While leverage can amplify profits, it also magnifies losses, potentially leading to large losses from your account.
- Finance Costs: Holding positions overnight incurs charges known as “Swap Fees”, which are essentially finance charges you pay to brokers for keeping your trades open. However, these fees are very minimal.
- Volatility: Oil prices can be highly volatile, influenced by factors like geopolitical events, which may increase trading risks.
- Spread Costs: The difference between the buy and sell price (spread) can impact profitability, especially for short-term traders.
CFD Oil Trading Strategies
Traders can tackle the crude oil CFDs market in a variety of ways; from scalping, to day trading, and even swing trading. Here are how these approaches differ:
- Scalping: Traders who prefer scalping will enter trades on the 1 minute to 5 minutes time frame, with the aim to enter multiple trades per day. Typically, scalpers will trade smaller moves in the market, but rely on the CFDs’ leverage feature to magnify those small wins.
- Daytrading: Day traders will prefer entering and exiting a trade on the same day, typically on the 15 minute to 1 hour timeframes. Note that with the hourly timeframe, some trades may become swing trades as profit targets tend to be further away.
- Swing Trading: Swing traders will hold trades across days or even weeks, preferring higher time frames starting from 1-hour to above.
For Scalping: 20 and 50 EMA with ATR 5-Minute Strategy
Scalping typically results in smaller trade results but the goal is to obtain a greater frequency of trades throughout the day. As a result, inexpensive trade costs, like zero commissions from Alchemy Markets, make scalping a more viable strategy with our brokerage compared to others.
This strategy utilises two Exponential Moving Averages (EMAs) and the Average True Range (ATR) indicator to take advantage of smaller trending moves on the 5-minute timeframe. On average, each trade should take less than an hour to reach its target.
Here’s an example of this strategy in action:
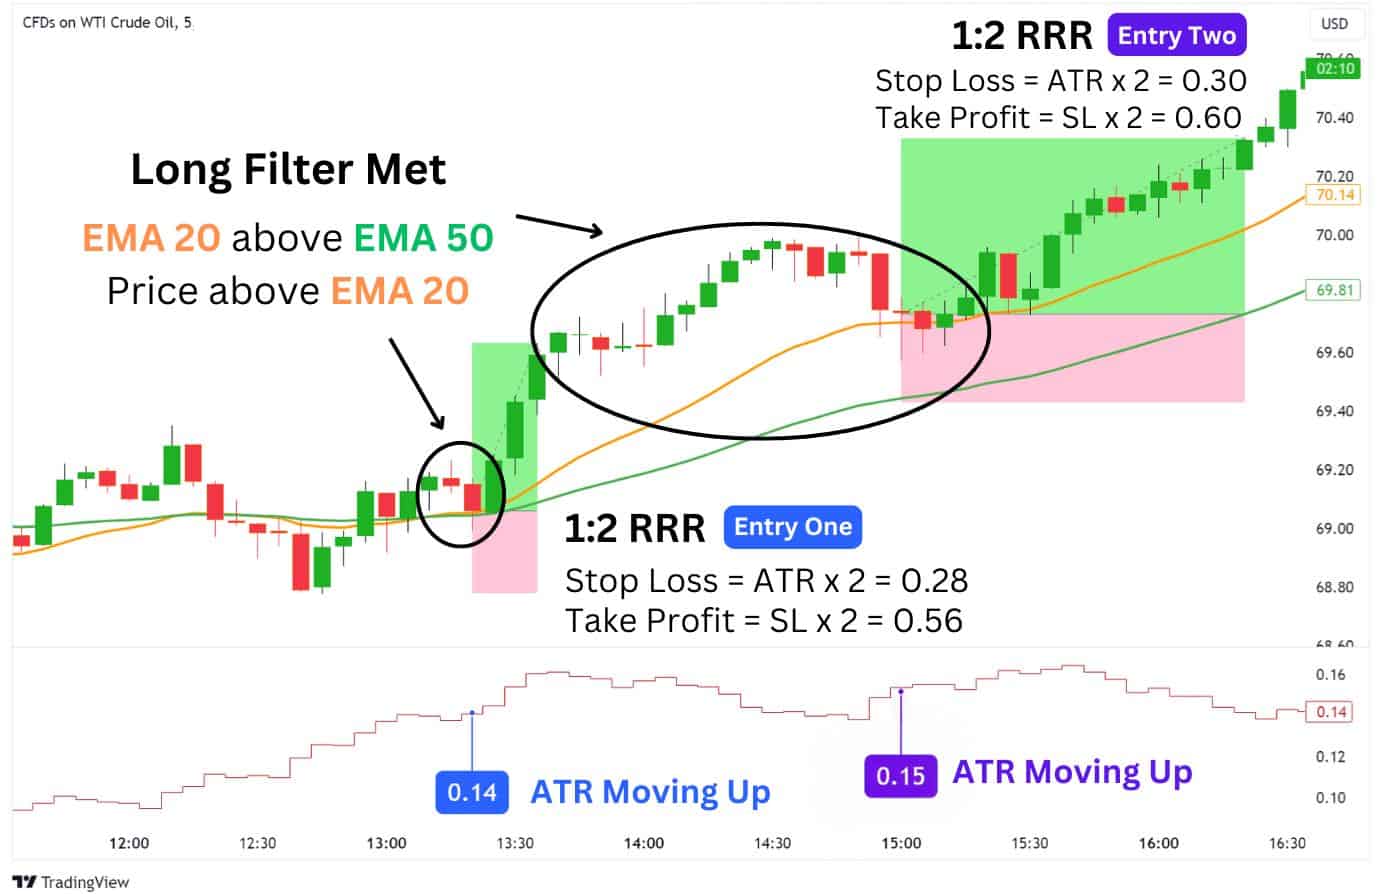
The simple gist of this strategy boils down to four key considerations:
- LONG FILTER: Price is above the EMA 20, and EMA 20 is above EMA 50, signals an uptrend.
- SHORT FILTER: Price is below the EMA 20, and EMA 20 is below EMA 50, signals a downtrend.
- ATR MOVING HIGHER: The ATR should be moving higher, which signals growing momentum.
- RETEST OF EMA 20: Enter a trade when the price touches and bounces off the EMA 20.
We will look to essentially trade the EMA 20 as a dynamic support or resistance, as long as the long filter or short filter conditions are met. The candle body should not overlap with the EMA 20 to be valid entry.
The ATR should also be moving up, to help us confirm the strength of the trend. Additionally, we will be using the ATR to set a realistic stop loss and take profit area to improve this strategy’s consistency.
| How it works: 1. Look for a long filter or short filter condition to be met. 2. Watch for a retest of the EMA 20, where price rejects and closes above or below the EMA. 3. The ATR value should be higher than its previous value, or in an uptrend. 4. Enter a trade with 1:2 risk-to-reward, with stop loss equal to the ATR value times two. For better trade confirmations, consider looking for the doji, hammer, or engulfing candlestick patterns at the retest of the EMA 20. |
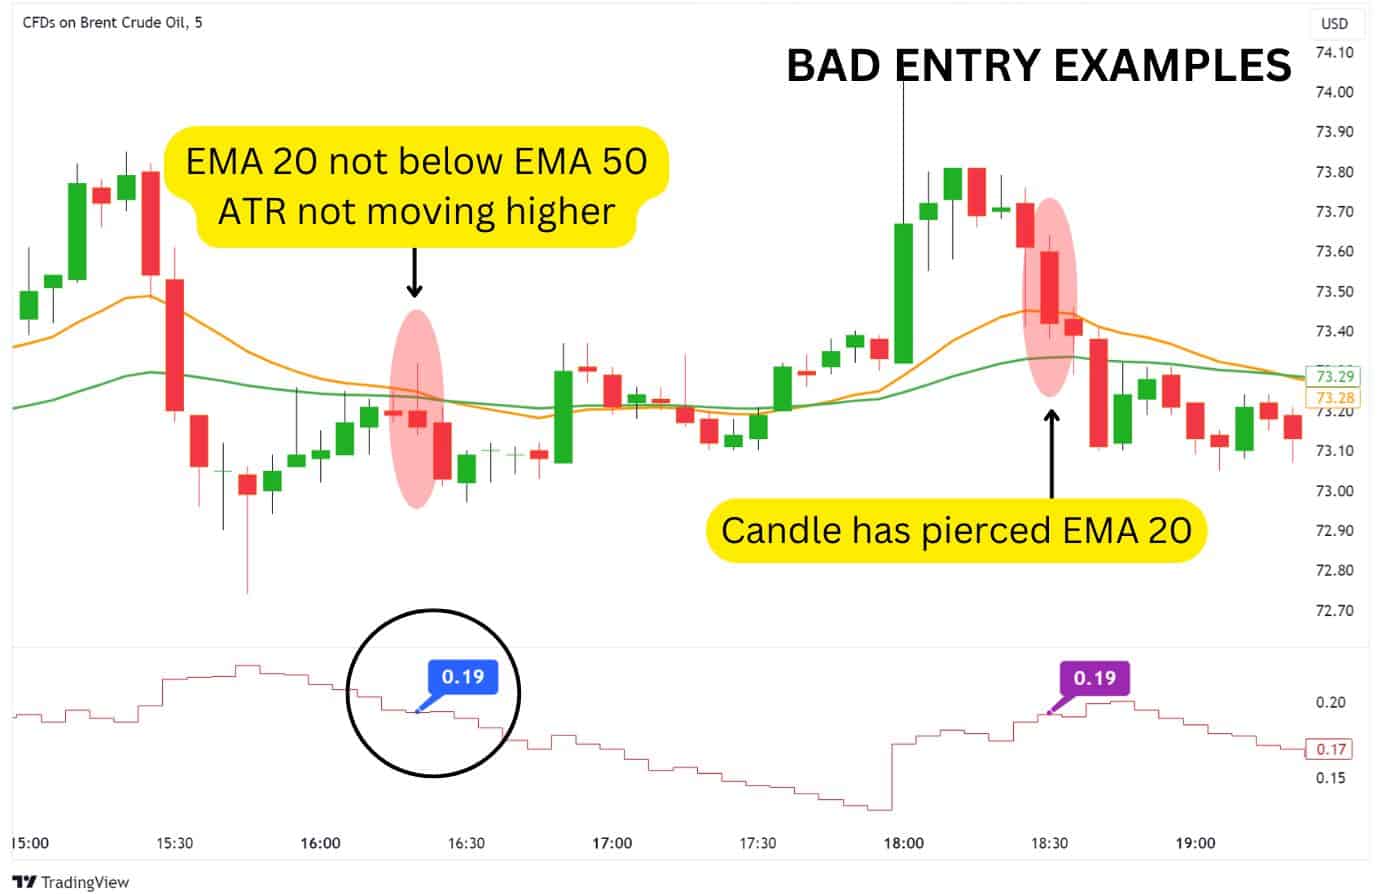
Avoid making these mistakes when trading this strategy:
- Not confirming the filter condition
- Not confirming the ATR’s direction (should be moving higher)
- Not confirming a candle close above or below the EMA 20
While scalping is not for everyone, as it may require hawk-like vigilance over the charts to find entries at times. Here are some peak hours to consider scalp-trading UKOIL and USOIL:
- New York Session (8:00 AM – 2:30 PM ET): This is when the US markets are open, and oil prices are most active. The Energy Information Administration (EIA) releases crude oil inventories on Wednesdays during this session, often causing price movements.
- London Session (3:00 AM – 11:00 AM ET): The UK market is open during this time, and volatility tends to increase, especially when it overlaps with the New York session (8:00 AM – 11:00 AM ET). This is a good time for trading UKOIL, as UK economic data and events can impact prices.
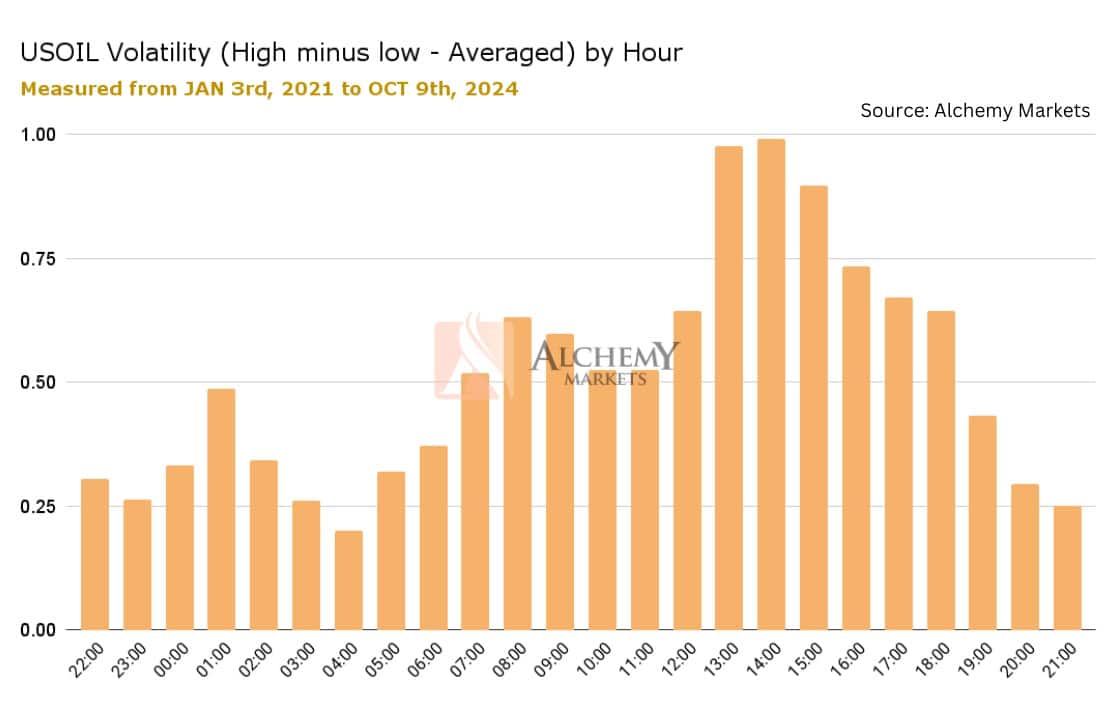
Crude Oil’s Intraday Volatility Depends on Time of Day
Crude oil markets are open 23 hours, 6 days a week, which means traders can pick and choose the best or most convenient time to trade USOIL (WTI) and UKOIL (Brent) prices. However, there are also typical optimal timings to intraday trade Crude Oil.
Looking at past data from Alchemy Markets’ USOIL price feed – from January 3rd, 2021 to October 9th, 2024 – we can clearly see that 12PM to 4PM, UTC/GMT time, are peak hours to trade oil CFDs.
- New York Peak Hours (GMT-4 or -5): 8AM – 12PM, or 9AM to 1PM
- London Peak Hours (GMT or GMT+1): 12PM to 4PM, or 1PM to 5PM
- Hong Kong Peak Hours (GMT+8): 8PM to 12AM
Taking it one step further, we’ve also identified the average typical volatility you can expect on each available trading day for USOIL (which extends to Brent Crude Oil / UKOIL).
What we found was that Mondays are less optimal for intraday trading, with all the other days being somewhat close in their average volatility.
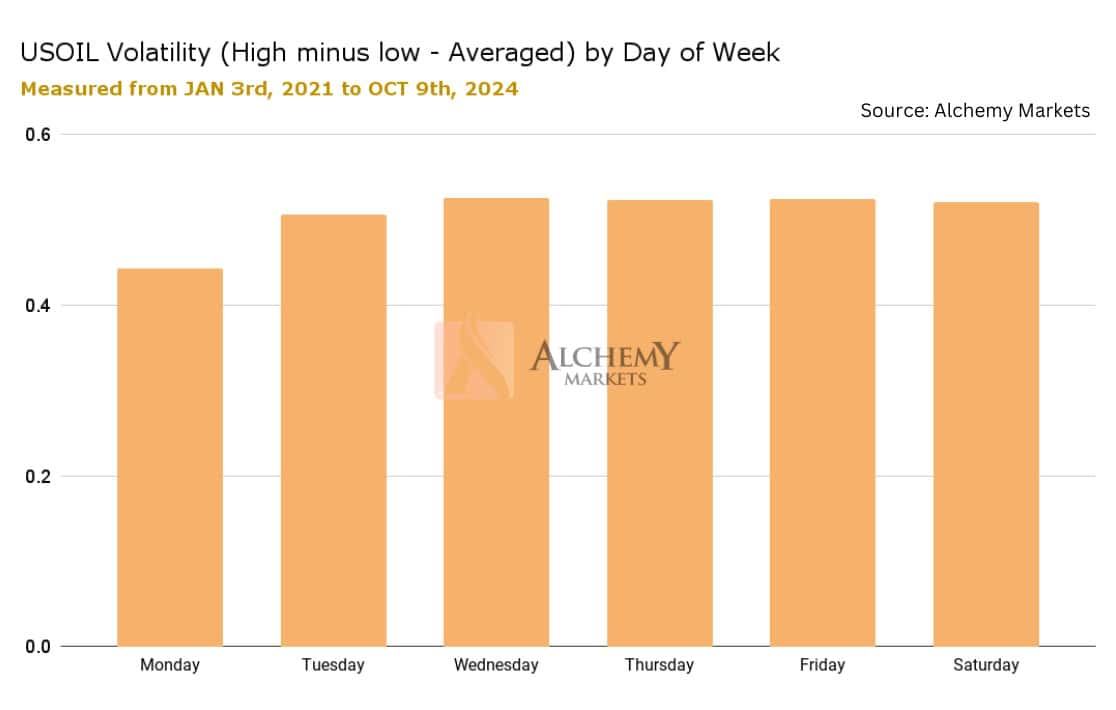
For traders, this means that Oil CFDs can be a fantastic asset to trade on Saturdays, a day which typically isn’t traded because the Stock Exchange and Forex markets are closed.
For Day Trading and Swing Trading: Triple EMA with ATR 1-Hour Strategy
For traders who find scalp trading too demanding, day trading or swing trading may be better alternatives. These approaches generate fewer trade signals but require less constant monitoring, and generally have larger swings per trade.
This strategy is similar to our scalping approach but adds a 10 EMA into the equation. This will serve as an additional trend filter, and also act as our key dynamic support or resistance to watch for an entry.
Here’s an example of this strategy in action:
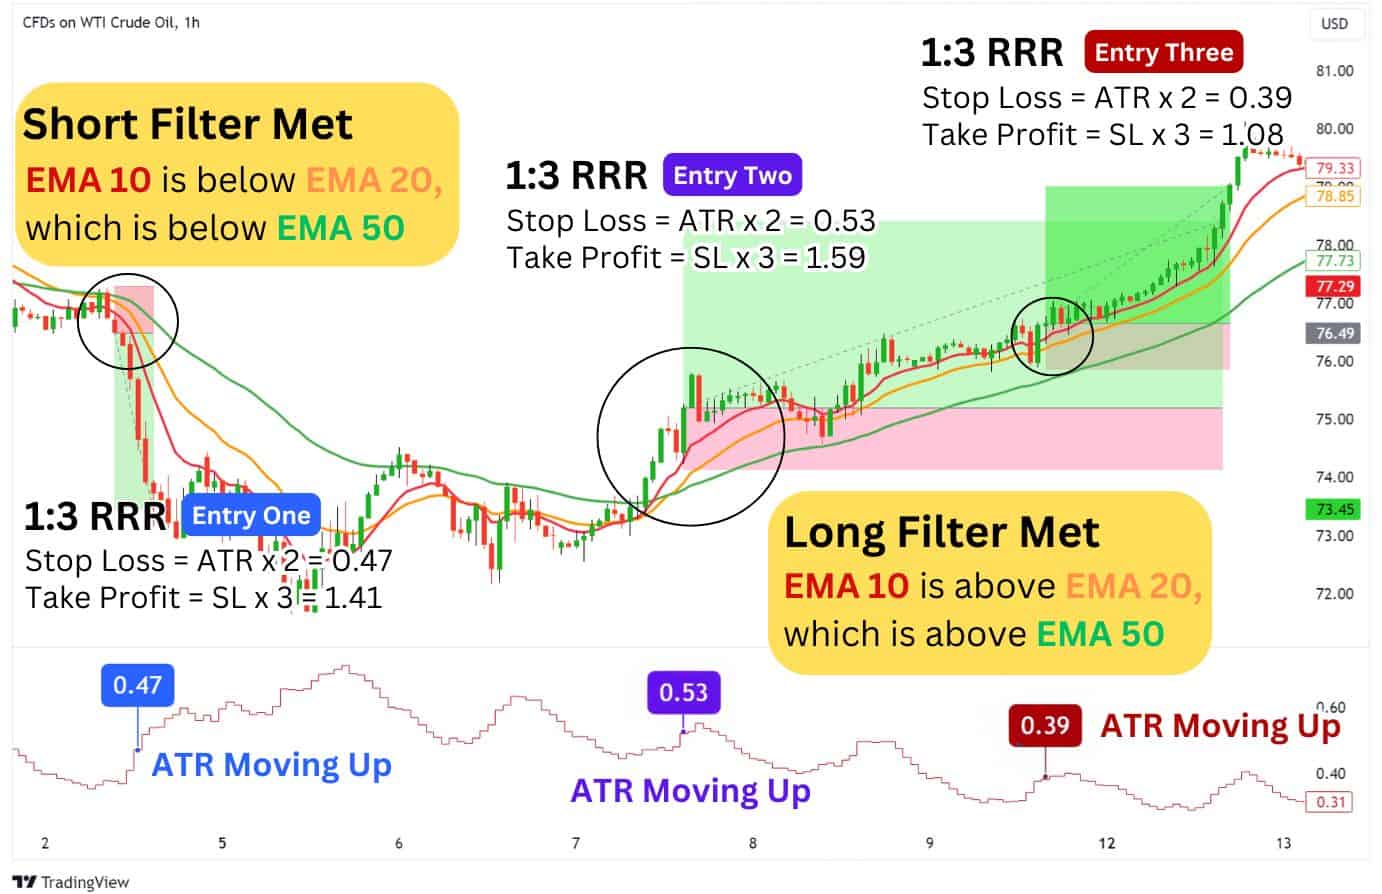
The gist of this strategy boils down to four key considerations:
- LONG FILTER: Price is above EMA 10. EMA 10 is above EMA 20, and EMA 20 is above EMA 50.
- SHORT FILTER: Price is below EMA 10. EMA 10 is below EMA 20, and EMA 20 is below EMA 50.
- ATR MOVING HIGHER: The ATR should be moving higher, which signals growing momentum.
- RETEST OF EMA 10: Enter a trade when the price touches and bounces off the EMA 10.
Similar to the scalping strategy, we will be looking to trade a powerful trending move. The difference here is that we will be using the EMA 10 as our basis for taking a long or short position, once a rejection from this EMA occurs with a filter condition met.
The ATR should be moving higher, which can be better observed if you change your ATR settings to a step line view. Next, we will be using a 1:3 risk-to-reward ratio (instead of the scalping strategy’s 1:2 RRR) as theoretically, trending moves on higher time frames will result in larger swings.
| How it works: 1. Look for a long filter or short filter condition to be met. 2. Watch for a retest of the EMA 20, where price rejects and closes above or below the EMA. 3. The ATR value should be higher than its previous value, or in an uptrend. 4. Enter a trade with 1:3 risk-to-reward, with stop loss equal to the ATR value times two. For better trade confirmations, consider looking for the doji, hammer, or engulfing candlestick patterns at the retest of the EMA 20. |
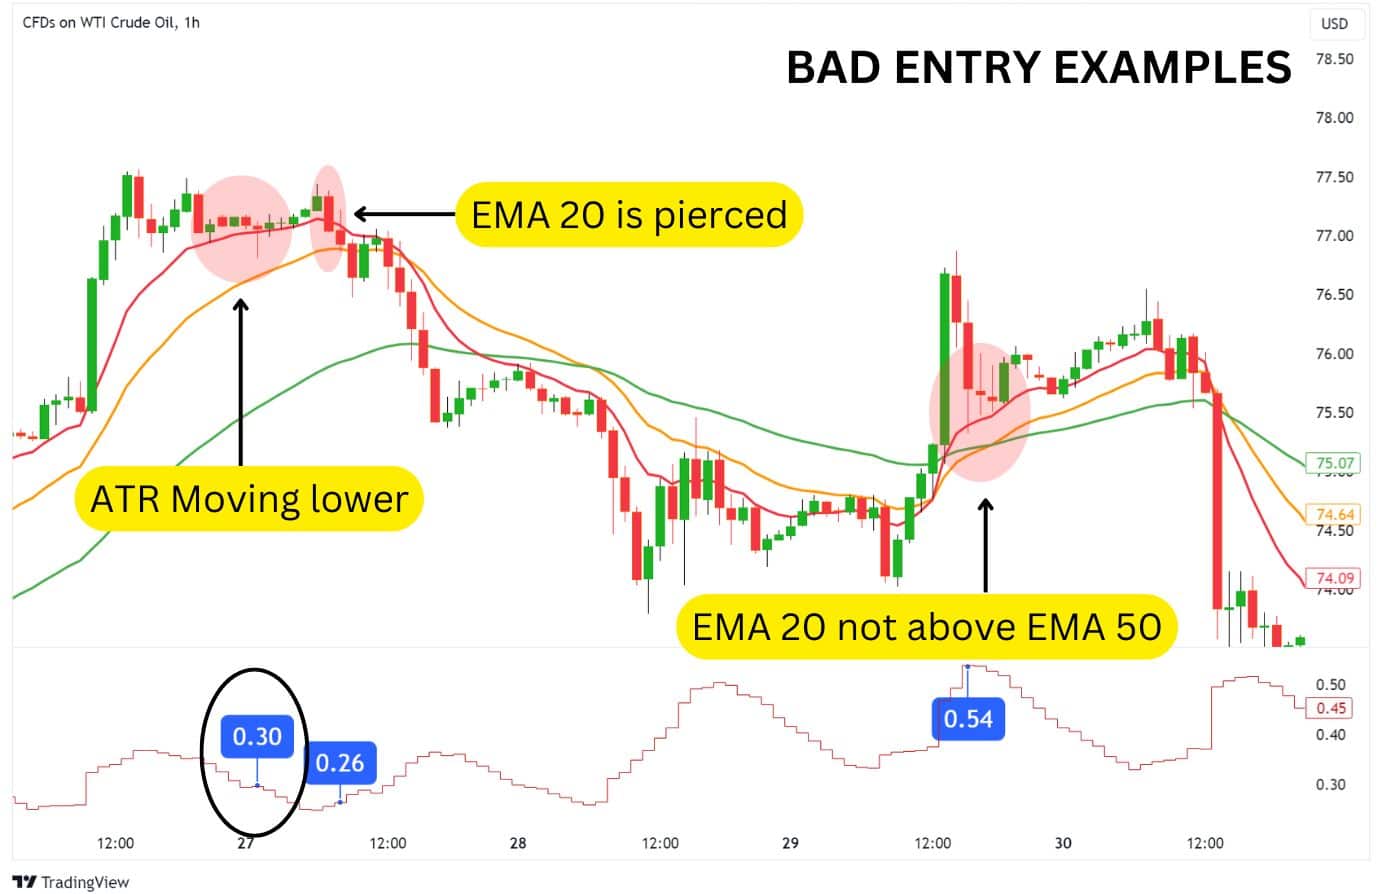
Avoid making these mistakes when trading this strategy:
- Not confirming the filter condition
- Not confirming the ATR’s direction (should be moving higher)
- Not confirming a candle close above or below the EMA 10
Truth be told, there are many ways to trade oil products. These are just two strategies for trading oil CFDs to help you get started.
It’s recommended to test them through paper trading first to ensure they suit your trading style, schedule, and preferred timeframes.
Types of Crude Oil
There are two main types of crude oil used as global benchmarks for pricing: WTI (West Texas Intermediate) and Brent Crude. These two differ based on their geographic source, quality, and trading markets.
Brent Crude
Brent Crude, often referred to as UKOIL, refers to oil coming from the North sea. This benchmark oil is extracted from the North Sea and primarily refined in Northwest Europe. It is crucial in setting prices for imported crude oil in regions like Europe and North Africa.
West Texas Intermediate (WTI)
West Texas Intermediate (WTI), also known as USOIL, refers to oil produced in the United States, namely off the gulf of Mexico. WTI is known for its high quality, characterised by its lightness and sweetness (low density and sulphur content). It has historically been a bit cheaper than Brent due to transportation logistics.
WTI vs Brent Oil Prices
Both types of crude oil serve as vital benchmarks due to their ability to provide market stability, price transparency, and a basis for global oil trading.
| Feature | WTI (West Texas Intermediate) | Brent Crude |
| Geographic Origin | United States – Mainly off the Gulf of Mexico | North Sea |
| Quality | Light and sweet | Light and slightly heavier than WTI |
| Primary Markets | US and global | Europe, Africa, and global |
| Refinement Location | Primarily in the United States | Northwest Europe |
| Traditional Price Premium | Generally priced lower than Brent | $1 to $2 higher than WTI |
| Significance | Major US benchmark and global reference | Major European benchmark and global reference |
| Usage | Mainly used for petroleum | Mainly used for diesel |
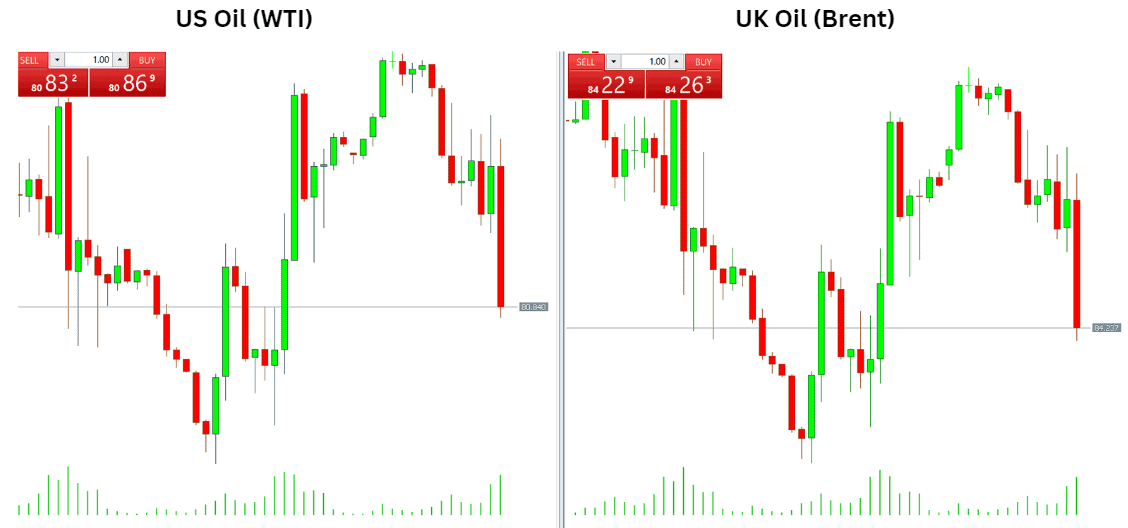
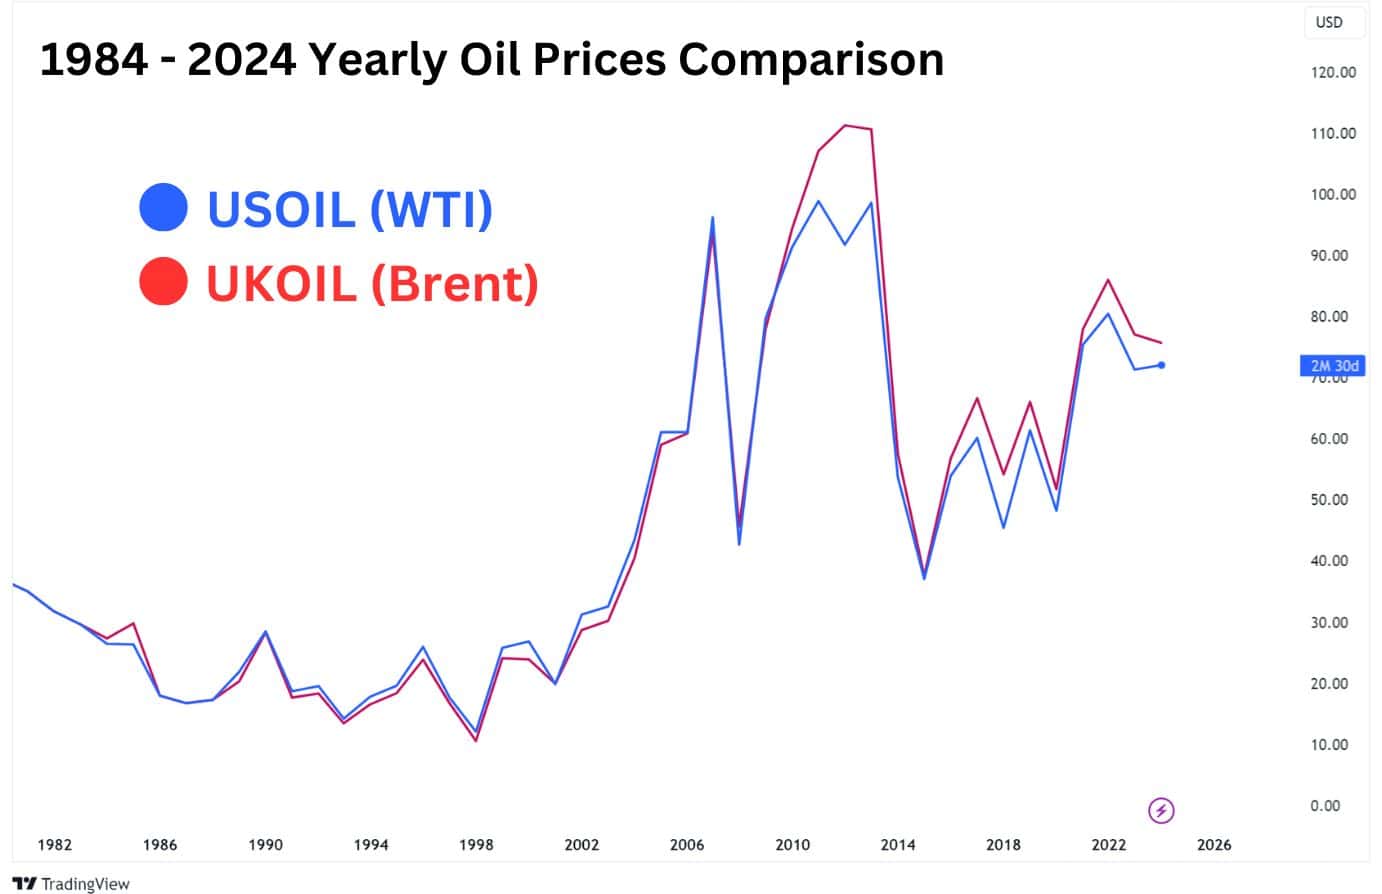
Although Brent Crude and WTI are slightly different in pricing, they generally tend to move in tandem with one another. This means that when either Brent or WTI rises or falls, the other oil product’s price also follows – they are practically moving in the same direction most of the time.
For example, here is a comparison of WTI (USOIL) vs Brent Crude (UKOIL) over the course of 40 years.
Trading the WTI Crude vs Brent Crude Spread
In this context, the WTI Crude vs Brent Spread refers to the price difference between USOIL and UKOIL. Usually, the Brent Crude Oil (UKOIL) price would lead USOIL by a few dollars. However, when this spread difference is drastically widened or narrowed, a price reversal is expected on either UKOIL or USOIL.
This opens up the possibility to open a spread trade, where traders would simultaneously:
- Long USOIL and short UKOIL when spreads are significantly wide, or
- Long UKOIL and short USOIL when spreads are significantly narrow.
For this strategy to work, traders can set up the UKOIL-USOIL chart on TradingView, which allows us to plot significant spread levels on a chart.
When the spread differences reach significant extremes, our spread trade can be activated. Here’s how it would look like in practice:
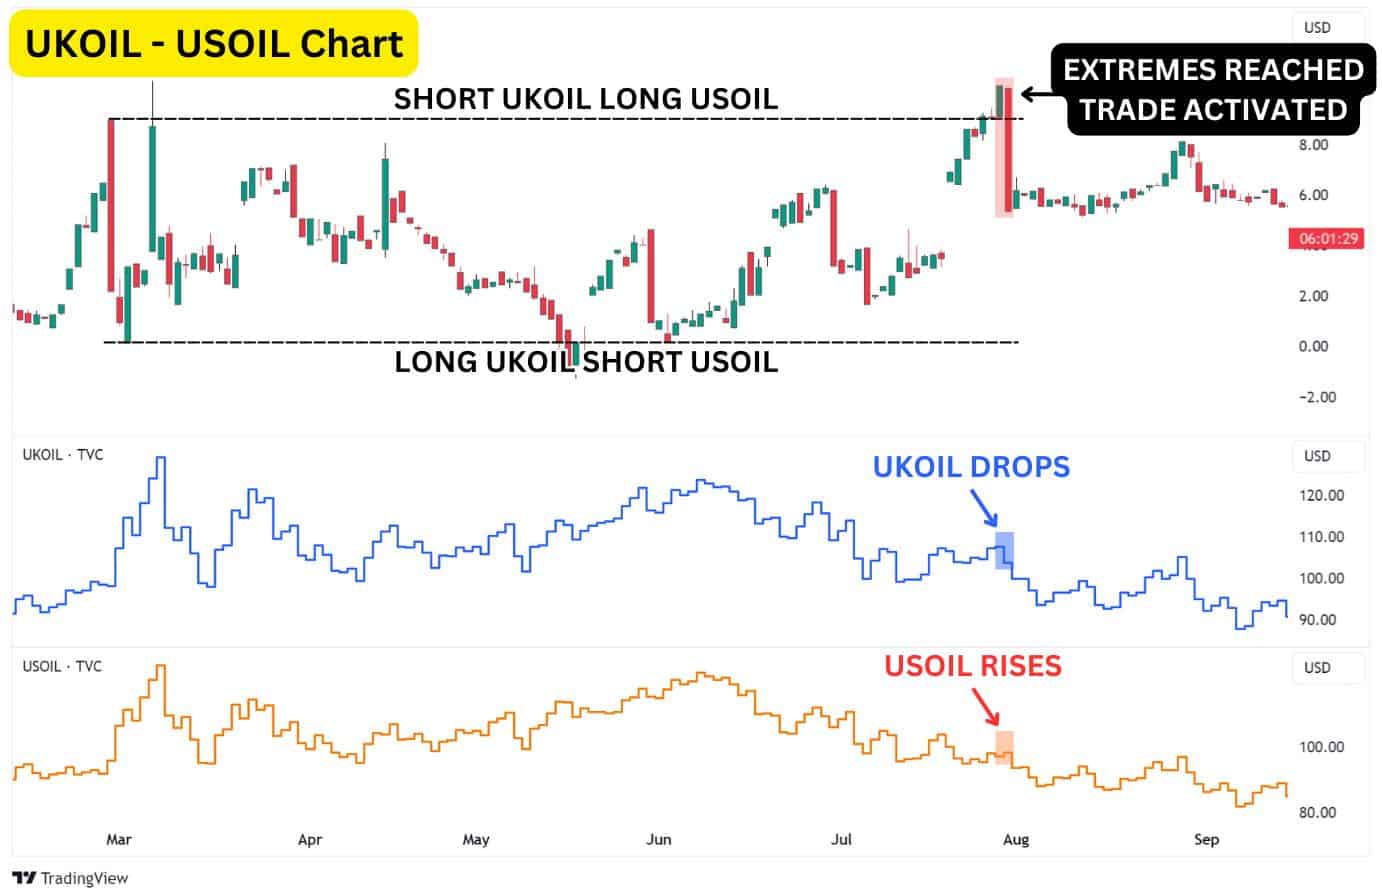
Notice how on the UKOIL-USOIL Daily Chart, the price reaches extreme highs near August of 2022, indicated by the red box. This triggers the “SHORT UKOIL, LONG USOIL” spread trade. Then, in just one day, UKOIL drops while USOIL prices rise. This gives us a win on both trades.
However, the true beauty of the Oil Spread trade lies in its hedging potential, where one trade is likely to outperform the other. This allows us to secure a winning position even if one side of the trade is a loss. It is important to view the hedge as a collection of two trades making one trade rather then viewing them as two separate independent trades.
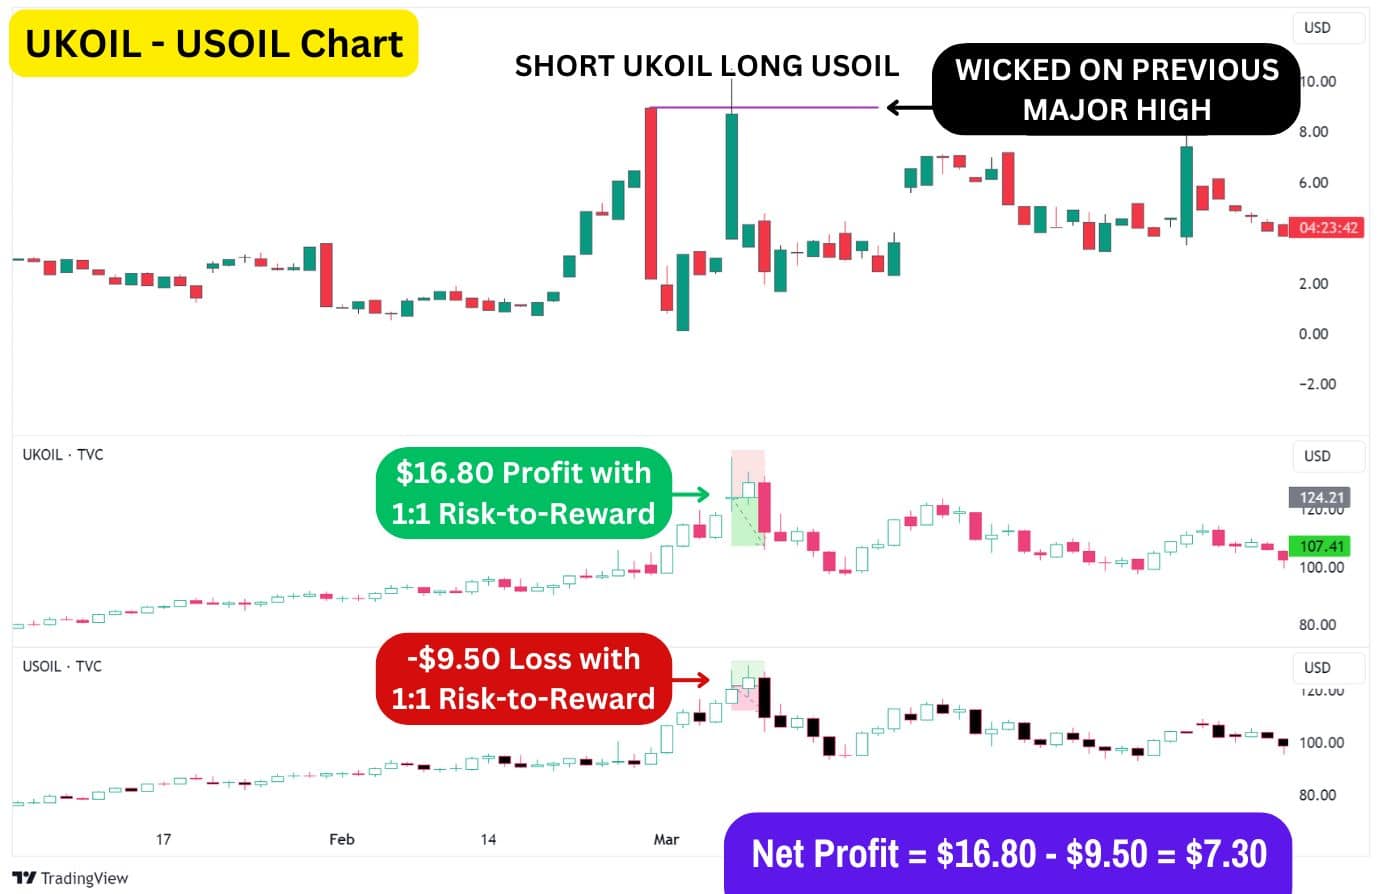
For instance, in February to March 2022, when Russia attacked Ukraine, UKOIL reacted more swiftly to European geopolitical events. The sudden rise in demand for oil products in Europe (due to war) caused UKOIL prices to increase far more sharply than USOIL. This created a significant spread between the two.
In March, we can observe the oil spreads price revisit its February 2022 highs but faces rejection, forming a daily candlestick that closes lower.
Had the trader initiated a spread trade at this point with just one contract each of UKOIL and USOIL, they would have made a profit of $7.30, despite taking a loss on USOIL.
This highlights how you are trading the trend direction of the spread and not necessarily the asset.
Oil CFD vs Oil Futures
Crude oil CFDs are flexible instruments that allow traders to speculate on oil price movements without worrying about expiration dates. You can hold positions indefinitely and choose smaller, customizable contract sizes. CFDs typically offer higher leverage, meaning you can control larger positions with a smaller initial investment. Additionally, all transactions are cash-settled, so there’s no obligation to take physical delivery of oil. CFDs are also available for trading 24/5, making them more accessible for short-term traders.
On the other hand, crude oil futures come with expiration dates, requiring traders to either settle the contract or roll it over before the expiry. Futures contracts are standardised, usually representing 1,000 barrels per contract, making them larger and less flexible compared to CFDs. Futures are commonly used for hedging, as they provide businesses with a tool to protect against oil price fluctuations. While physical delivery is possible if the contract isn’t closed before expiration, futures offer lower leverage and are traded only during specific exchange hours.
Which to Choose?
CFDs are ideal for traders looking for flexibility, higher leverage, and no physical delivery concerns. Futures, however, are better suited for long-term traders or businesses needing standardised contracts and hedging options, with the possibility of physical settlement.
FAQ
Can I trade oil CFDs on MetaTrader 4 and MetaTrader 5?
Yes, crude oil CFDs can be traded on popular platforms like MetaTrader 4 and MetaTrader 5, which offer various tools and features for efficient trading.
What are the fees for trading oil CFDs?
Fees typically include spreads, overnight financing charges, and potential commission fees, depending on the broker and platform used.
When is the best time to trade oil CFDs?
The best time to trade crude oil CFDs is during high-volatility periods, typically overlapping with the opening hours of major oil markets, such as New York and London.
How much capital do I need to trade oil CFDs?
The required capital depends on the broker’s margin requirements and the size of the positions you intend to open. With Alchemy Markets, you can get started for as little as $50.
What is a crude oil lot size?
In CFD trading, the standard lot size for crude oil can vary depending on the broker. Typically, a standard lot represents 1,000 barrels of crude oil, but many brokers also offer mini-lots (100 barrels) and micro-lots (10 barrels) to provide flexibility for smaller positions.
What is the best time-frame combination for trading oil CFDs?
Long-term traders may use daily and weekly charts, while short-term traders might prefer 15-minute and 60-minute charts to make trading decisions.
What Happens to Oil CFD if crude oil goes up?
CFDs are designed to mirror the price of their underlying assets 1:1, therefore if oil prices rise, then the USOIL and UKOIL CFD prices will follow suit. Conversely, if oil prices fall due to a lack of demand or supply increase, then oil CFD prices will fall as well.


