


Written by:

Reviewed by:


Bearish
Bullish
- March 16, 2026
- 29 min read
Turtle Trading Complete Guide
In 1983, legendary commodity traders Richard Dennis and William Eckhardt set out to answer a simple question: “Are great traders born, or can they be trained?”
To find out, they recruited complete beginners and taught them a basic Donchian breakout strategy. Critics expected the experiment to fail. Instead, the group, later known as the Turtles, went on to generate over $150 million in profits within four years.¹
The Turtles weren’t the most accurate traders and they didn’t chase maximum gains. Their edge was discipline: non-emotional execution and strict risk rules that kept them in the market longer than most.
With the right rules, mindset, and risk control, trading success can be taught.
In this guide, we’ll dive deep into how effective the turtle trading system is in today’s environment, examine its documented variations, and break down its concepts so you can adapt their principles in your trades.
What is The Turtle Trading Strategy?
Turtle Trading is a mechanical trend-following method created by Richard Dennis and William Eckhardt during their experiment in the 1980s. It gave complete beginners a simple breakout rulebook and tested whether discipline could outperform talent.
At its core, the strategy focuses on buying strength, selling weakness, and staying aligned with major market trends. Entries, exits, and position sizes all follow fixed rules, so emotion never drives decisions.
This approach accepts many small losses, while the winning trades are significantly larger. Over time, the few big wins more than cover the losses, which is how the turtles stayed consistently profitable for years.
These broad principles form the starting point of the full Turtle Trading system, which later expands into detailed rules using Donchian Channels, ATR-based sizing, and strict risk controls.
The Turtle Trading Experiment
The Turtle Trading Experiment was a real-world experiment conducted in the 1980’s, to find out if anyone could become a successful trader by following a strict, rule-based system.
The outcome was a resounding yes — and the most important keys to success were risk management, and mechanical discipline.
But how did it first come about? What spurred this experiment?
Finding the Turtles
The story dates back to 1983, when two legendary commodity traders: Richard Dennis, and William Eckhardt, strongly disagreed on an idea — that great traders were born, not made.

William Eckhardt (left) strongly believed that successful traders just simply had the talent and instinct to pick out the best trades, and exit at the right turn. Richard Dennis (middle), on the other hand, believed that anyone could be trained to become great.
To settle the argument, they launched a real experiment.
Quietly, a small ad appeared on the Chicago newspaper:
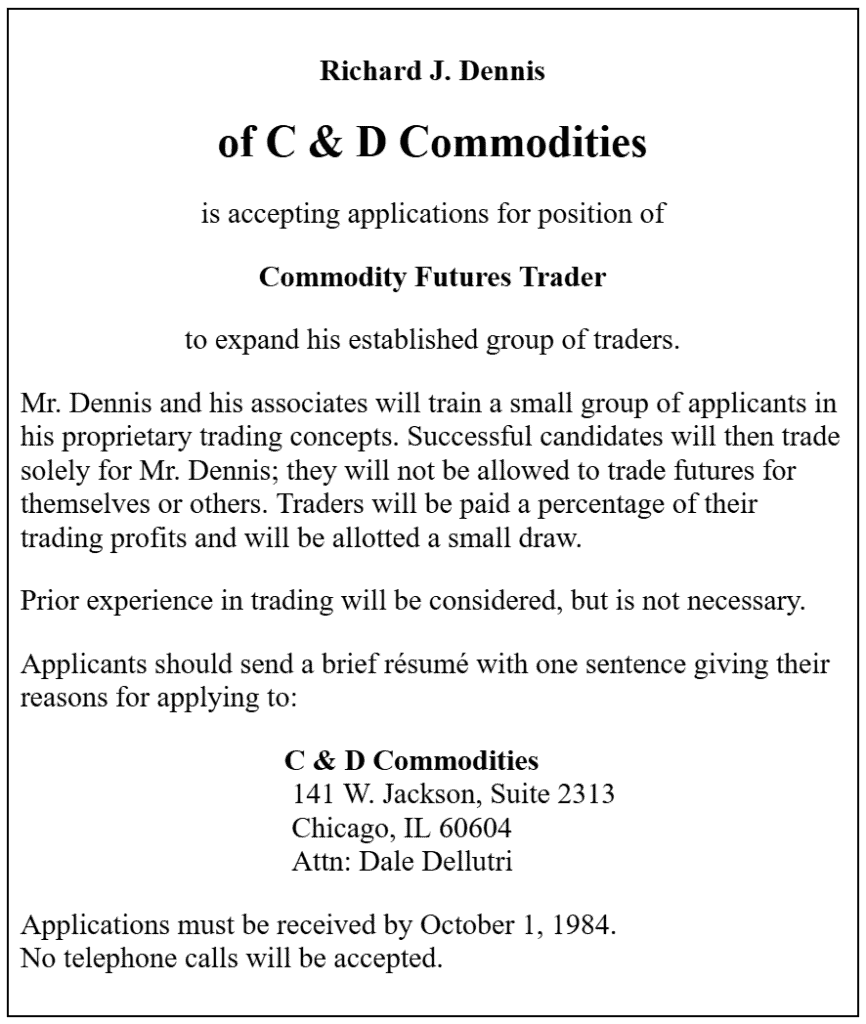
The ad stated that selected applicants would be trained in Dennis’s proprietary concepts and would trade exclusively for him, with no prior experience required.
According to Michael Covel’s documentation in The Complete TurtleTrader, Dennis and Eckhardt trained two batches, and the final group consisted of 23 recruits from a wide range of backgrounds.
Applicants included programmers, gamblers, teachers, students, and people who stumbled onto the ad out of curiosity. After interviews and psychological screening, a small group was chosen and trained for roughly two weeks, before receiving 500,000 and 1 million US dollars of Dennis’s capital to trade with.
Their expectations were straightforward: follow the rules, take every signal, respect the risk limits, and execute without emotion.
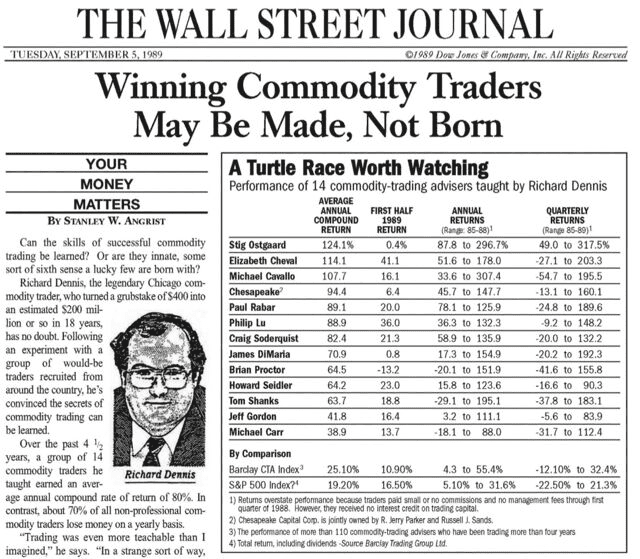
Did It Work?
Yes. The Turtles proved Dennis right by generating more than 150 million dollars in four years.
Critics expected the group to fail, but their mechanical discipline allowed them to stay consistent, accept small losses without hesitation, and hold winning trades through large trends.
The biggest lesson wasn’t the strategy itself, but rather that emotional control and discipline are the real edges in trading.
Turtle Trading Rules
The Turtle Trading Rules formed a complete trading framework. Everything was defined: what to trade, when to enter, when to exit and how much to trade. Most retail traders never build a system this complete, which is why the turtles’ rules are studied even today.
Rule #1: Liquid Markets
The Turtles focused only on highly liquid futures markets with tight spreads and deep order books. Liquidity ensured smoother execution, reduced slippage, and kept price movements clean and reliable.
This focus helped the system avoid unnecessary noise and kept the turtles trading major markets where strong, sustained trends were most likely to form.
Rule #2: Position-Sizing Program
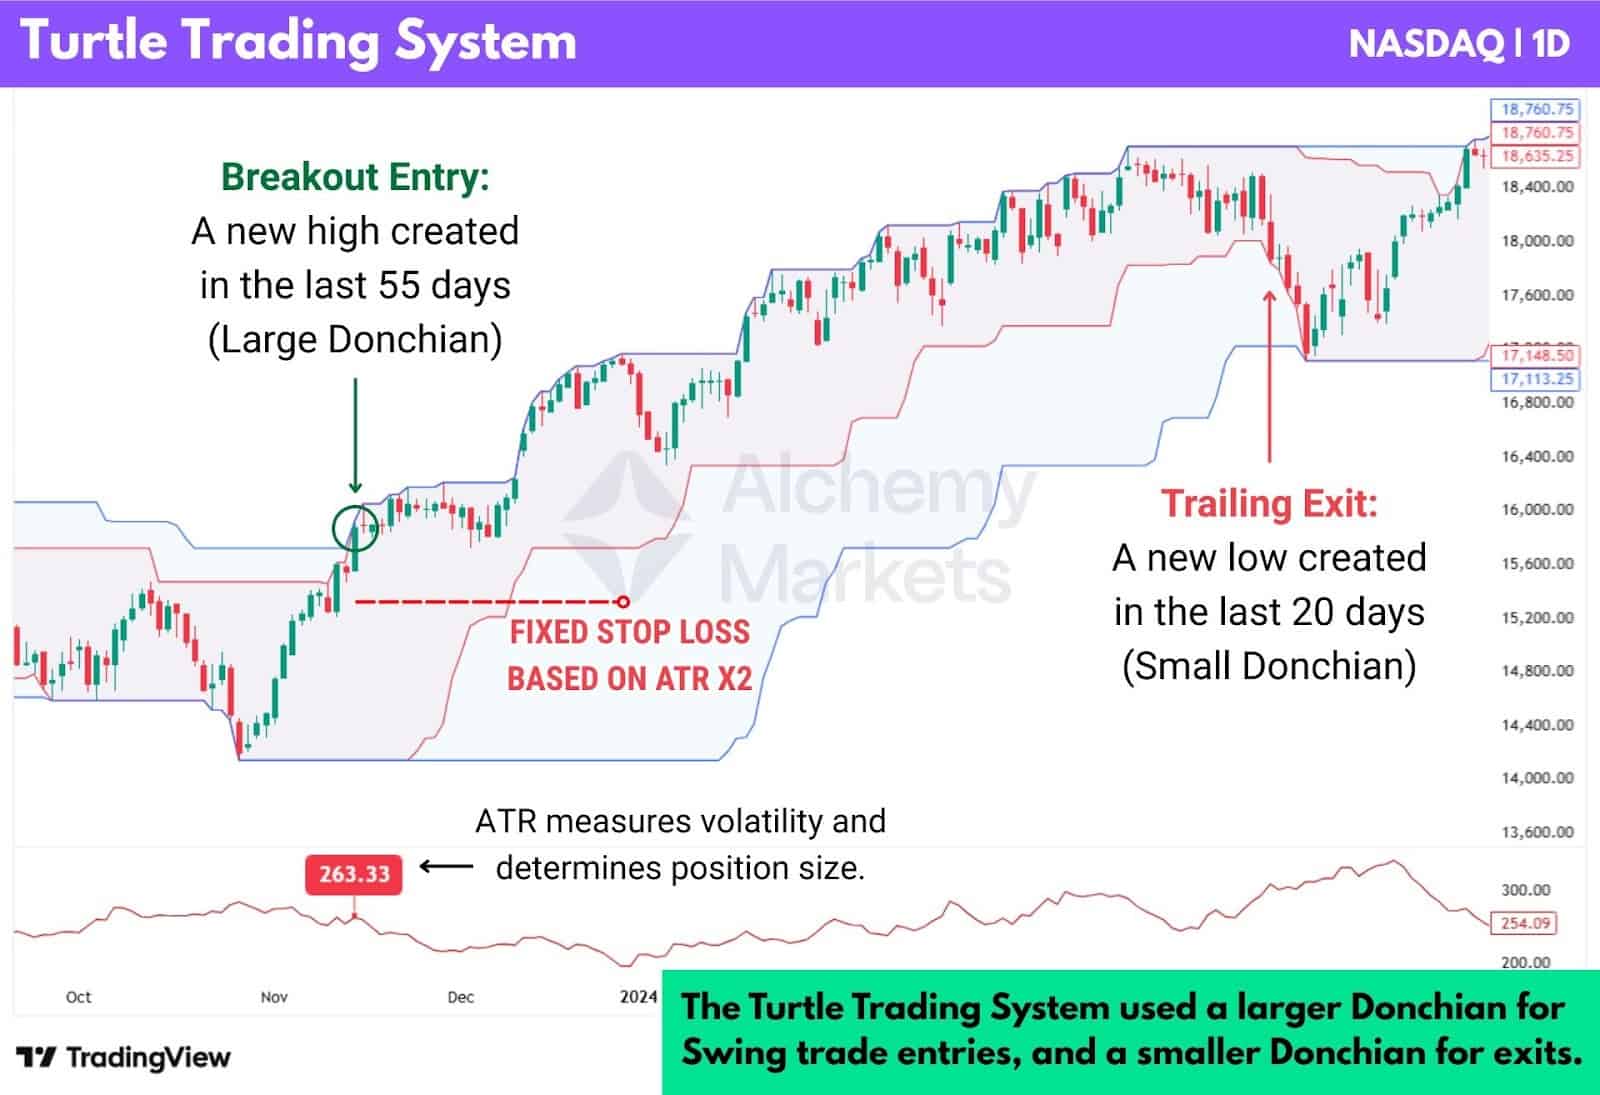
Position sizing was arguably the most important part of the Turtle system. Every trade risks a fixed 1% of capital, which keeps their exposure steady no matter how convincing a setup looks.
They used the Average True Range (ATR) to measure volatility and get a sense of how far price typically moves. This volatility reading, which the turtles called N, determined both stop distances and how large each position should be.
Their position sizing formula was simple:
| Position size = (1% of capital) ÷ (2 × ATR) |
This made their sizing fully adaptive and ensured every trade only risked 1% even in highly volatile market conditions.
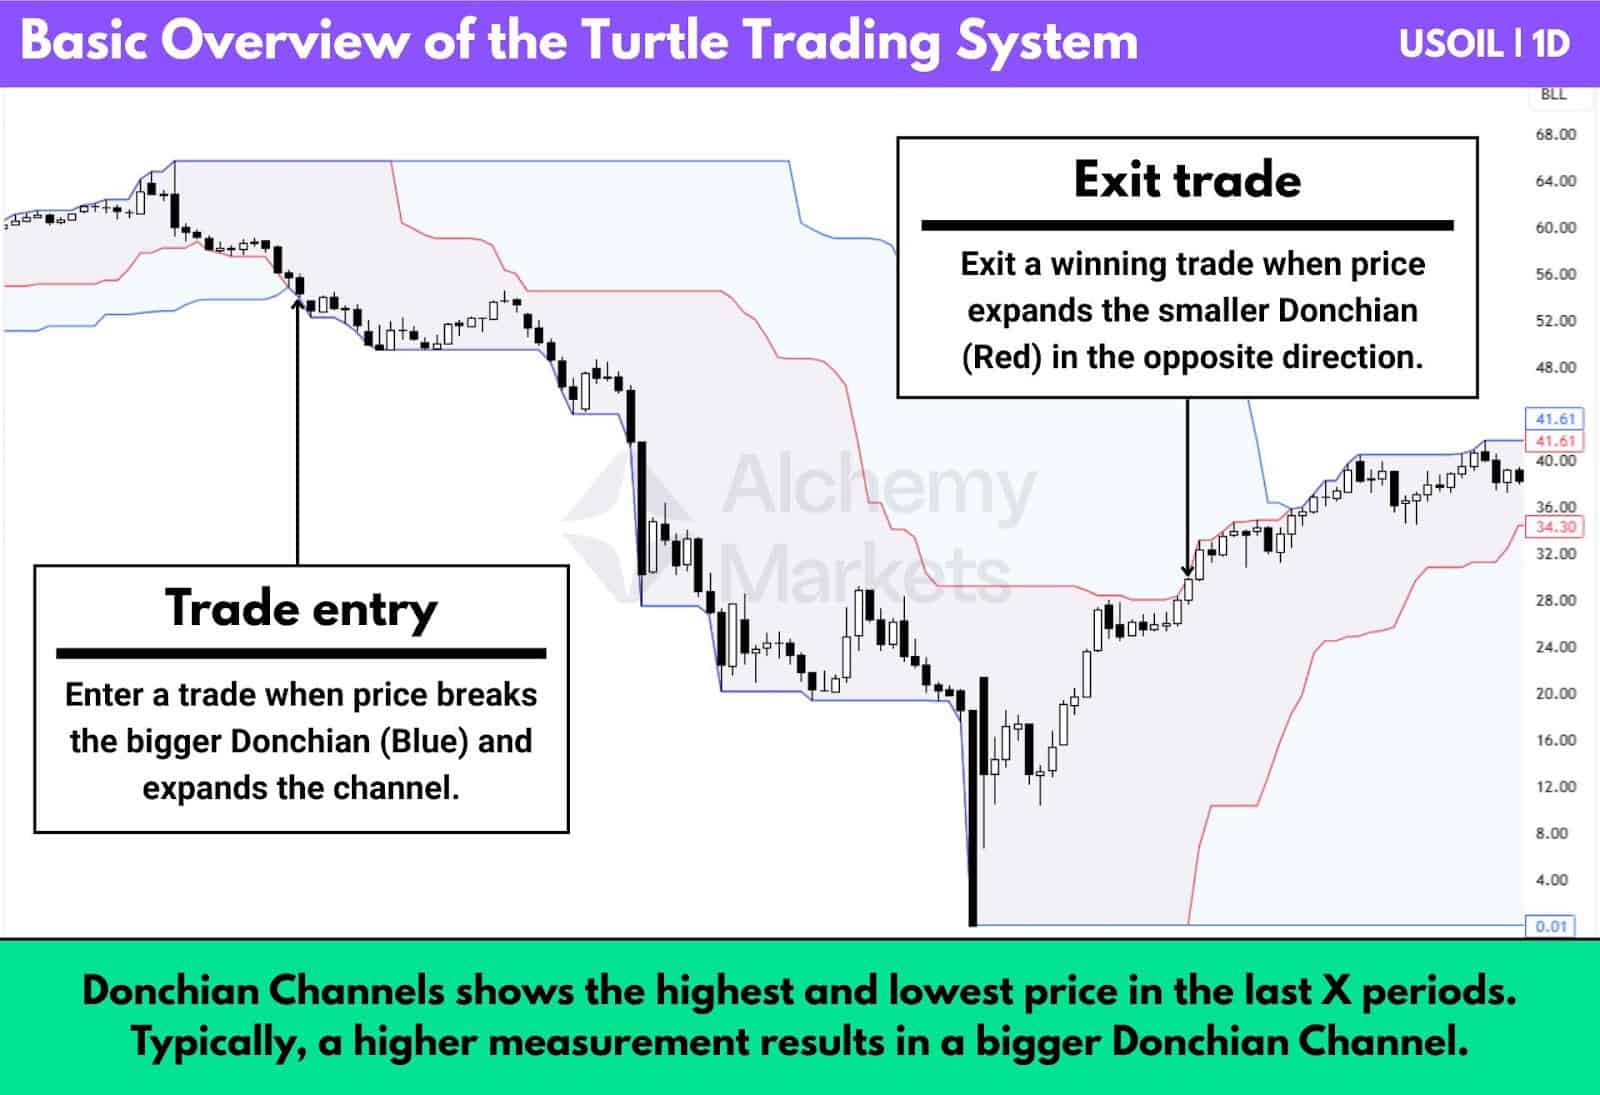
Rule #3: Distinct Entries
The turtles used a breakout entry trigger, where if the larger Donchian Channels expanded in either direction, a trade would be taken.
So if the larger Donchian, usually 55-period or 20-period, ticked higher, turtles would buy (long position). Vice versa, if it ticked lower, turtles would sell (short position).
Winning trades would be held until exit conditions were triggered, and losing trades would be quickly forfeited via a fixed stop loss based on the ATR.
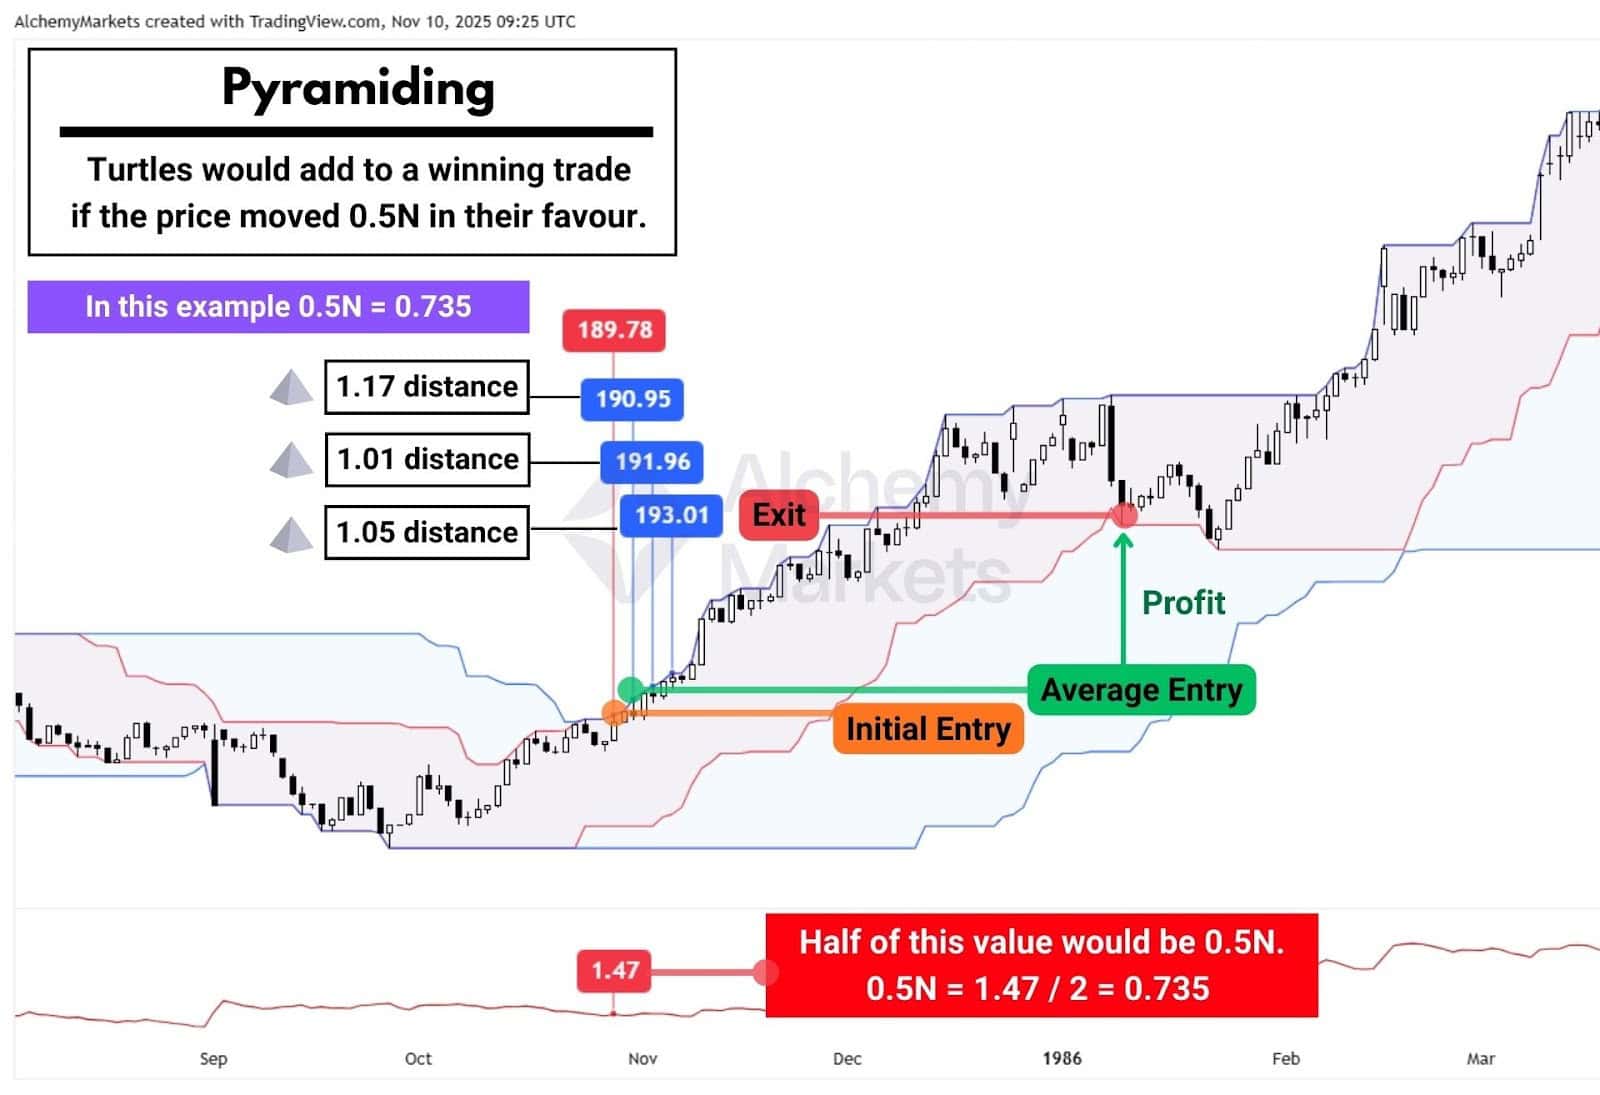
Additionally, the turtles practised pyramiding, which was the act of adding size to already winning trades.
Main rules for pyramiding are as follows:
- Turtles pyramided when: the price moved half an ATR (0.5N) — based on the value at time of the initial entry — in favour of the trade direction.
- Each pyramid trade was executed with 1 unit position size.
- Each market could only hold up to 4 to 5 units max in a market.
- Each trade has a fixed ATR-based stop loss.
This allowed traders to capitalise bigger on winning trades, while keeping the risks low.
Rule #4: Prevent Losses
The turtles kept losing trades small. Every position had a fixed stop placed at 2N (2x ATR) from the entry price. This made it impossible for any single loss to exceed the 1 percent risk limit defined in Rule 2.
To see how this worked, here’s a simple historical example:
- Market: S&P 500 futures
- Value per point: $500
- ATR (N): 3 points
- Stop distance: 2N = 6 points
- Loss per contract at stop: 6 × $500 = $3,000
This dollar loss per contract stayed the same because the stop always came from volatility. However, the number of contracts traded could change.
Nominal Account Size Adjustments
Officially, the turtles risked 1 percent of their equity. In practice, Richard Dennis adjusted a trader’s nominal account value whenever they were in a drawdown. This acted as a risk brake: when performance dropped, the account size used for calculations was reduced, and position sizes shrank automatically.
There was no fixed formula for this reduction. Dennis simply lowered the nominal value when needed, just like a modern fund manager reducing a trader’s risk budget. The stop stayed anchored at 2N, but the risk per trade became smaller because the allowed contract count decreased.
How it looked in practice
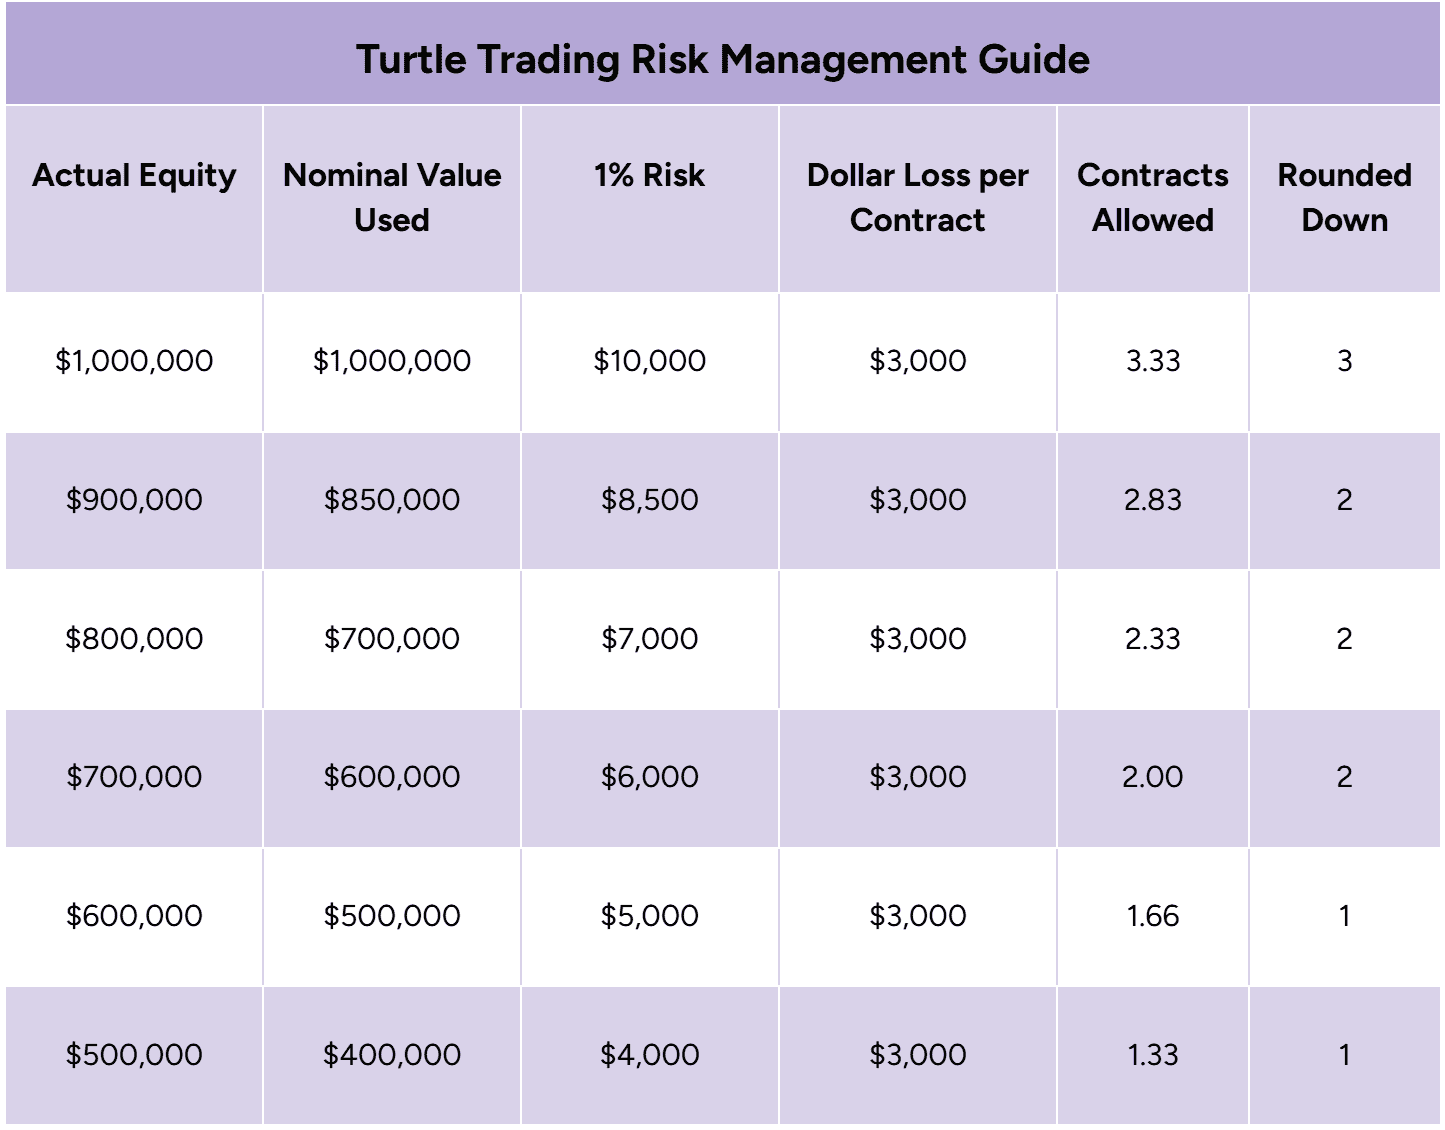
Notice how the loss per contract never moves because the stop stays anchored at 2N. What shifts is simply how many contracts the turtles are allowed to hold.
As Dennis reduced the nominal account value during drawdowns, the system automatically scaled the position down, and rounding ensured the turtles never exceeded the 1 percent risk ceiling.
Rule #5: Well-Timed Exits
Exits were conditional, and based on either the ATR or shorter Donchian Channel.
In a winning trade, turtles would use the shorter Donchian Channel (20 or 10 period) to detect an early sign of a trend shift, exiting their trades swiftly:
- Long trades ended when price crossed below the lower band.
- Short trades ended when price crossed above the upper band.
In a losing trade, turtles had a fixed ATR-based stop loss, set to 2x the ATR recorded at the time of their entry. So if ATR was $1, the turtles would exit a position if it had moved $2 dollars against their trade (equal to 2 times the ATR).
This rule kept the turtles inside winning trades until momentum clearly reversed. It prevented early profit-taking and ensured consistency in how every trade was closed.
Rule #6: Market Strategies
The turtles traded a diversified basket of 20 to 24 liquid futures markets. Their largest exposures were typically in currencies, US Treasury bonds, metals, and major commodities like crude oil and grains.
Diversification helped smooth performance across different cycles. No single market dominated their risk, and the rules applied equally regardless of asset type.
This consistency amplified the system’s edge over time.
How Do Turtle Trading Strategies Work?
Turtle Trading works by using a simple breakout-trade system with a trailing stop loss. The system waits for price to prove a trend is underway, then rides that trend until the market clearly shows it is ending.
At its core, the method does three things:
- Identify a new trend using the longer Donchian Channel (55 or 20 periods).
- Stay in the trend until momentum shifts on the shorter Donchian Channel (20 or 10).
- Manage risk mechanically with volatility-based stops and position units.
The logic is straightforward. You enter only when price breaks beyond its established range, and you exit only when the opposite side of the shorter channel is hit. The system accepts many small losses along the way but captures a meaningful portion of big trends when they occur.
Which Markets did Richard Dennis Turtles trade?
Dennis and Eckhardt trained the Turtles to trade only highly liquid markets. This rule ensured their orders could be executed smoothly, with minimal slippage, even at size. In liquid environments, volatility readings are also more stable, allowing accurate position sizing and better consistency across trades.
During the 1980s experiment, the Turtles were assigned a specific basket of futures contracts across currencies, interest rates, commodities, and indices.
The selection was designed to ensure diversification while focusing only on markets with strong trending behavior and deep order books. Below is the complete list of the markets traded:
| Currencies Swiss Franc German Deutschmark British Pound French Franc Japanese Yen Canadian Dollar Eurodollar | Metals Gold Silver Copper |
| Soft Commodities Coffee Cocoa Sugar Cotton | Interest Rates 90-day U.S. Treasury Bill 10-Year U.S. Treasury Note 30-Year U.S. Treasury Bond |
| Agriculture Corn Wheat Soybeans Live Cattle Lean Hogs | Energy Crude Oil Heating Oil Unleaded Gasoline |
| Stock Index S&P 500 Futures |
This mix gave the Turtles broad market exposure and ensured their trend-following system could operate effectively across different asset classes. Each market was chosen for its liquidity, trend potential, and ability to support large position sizes without distortion.
Turtle Trading Strategies Example
Let’s examine how the turtle trading strategy worked, and there’s no better place to begin than with the original turtles themselves.
The chart below shows how the turtles would have traded the S&P 500 in late 1984, when the second batch of turtles began trading.
As a reminder, their approach was: breakout entries using Donchian Channels, risk defined by ATR, and exits taken when price crossed the opposite band. This allowed them to hold onto trending positions, while cutting losing trades quickly using a 2× ATR stop.
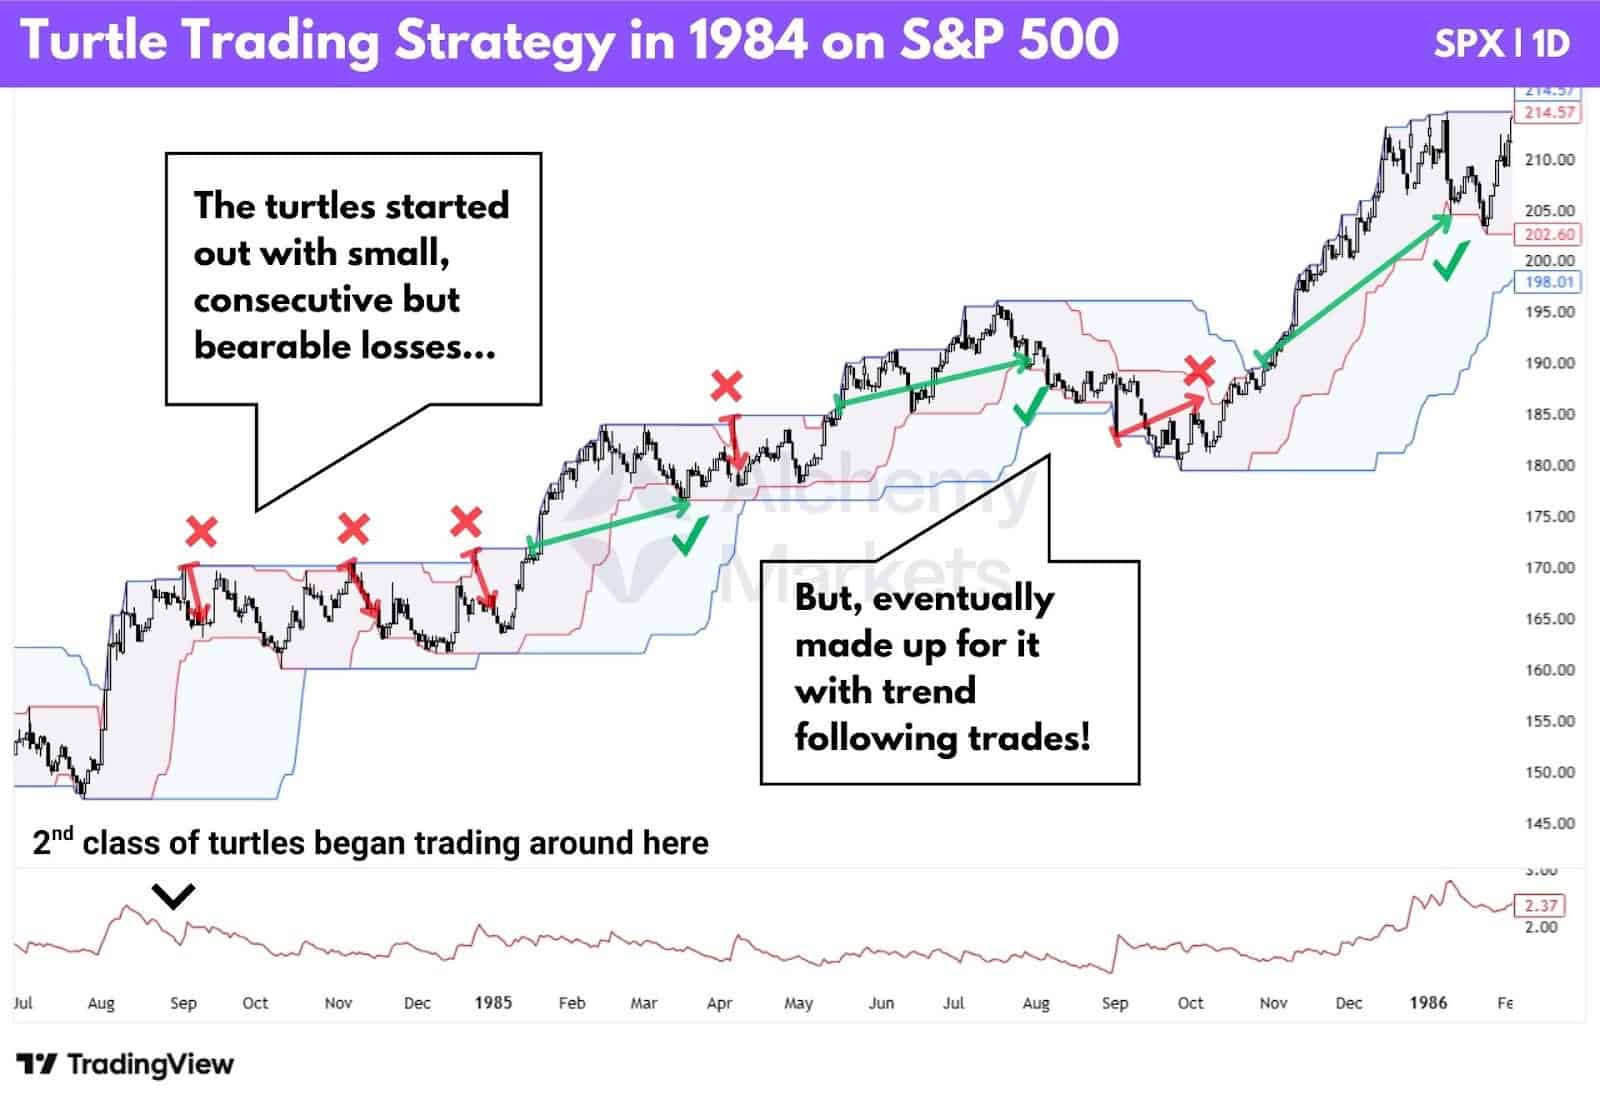
Notice how in the beginning, our beloved turtles endured a string of small losses as the market chopped sideways. It wasn’t until in 1985, the system began to help them capture major trending moves, making up for the earlier losses and then some.
But now you may be asking yourself: “What if this strategy was only practical in the 80’s? How does it fare in the modern trading environment?”
That’s a fair question. And it is true that the 1980’s experienced a huge bull run, allowing the strategy to flourish.
So let’s look at an example in 2025:
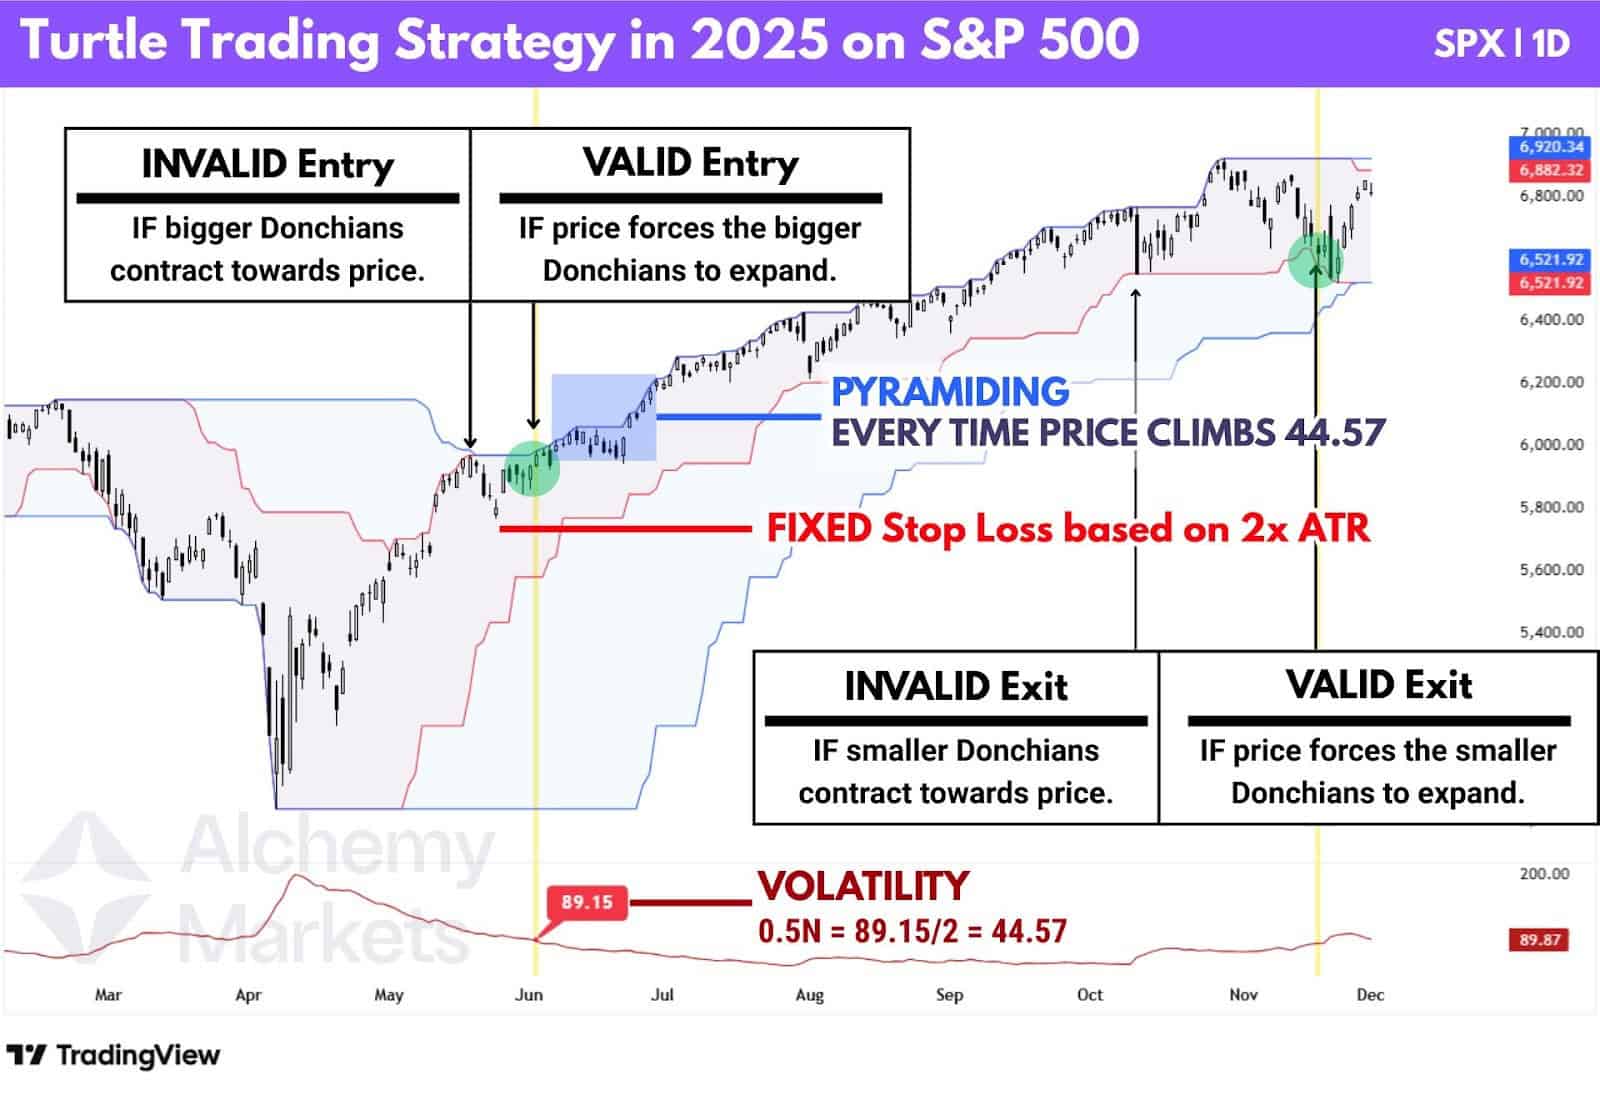
In 2025, the turtles would have secured a clean win again on the S&P 500. But to understand how a turtle would approach this chart, we need to look closely at what counts as a valid or invalid signal.
Invalid entries and exits:
These occur when price touches the Donchian bands because the bands contracted into price, not because price broke out. In other words, the band moved into the candle, not the candle breaking beyond the band. These signals should be ignored.
Valid entries and exits:
A valid signal happens only when price pushes beyond the existing band, creating a genuine new high or low that causes the band to expand. These are the moves that confirm a real breakout.
Pyramiding:
With an ATR of $89.15, pyramiding would happen every $44.57 (half of ATR), adding one unit at each step until reaching 4 or 5 units in total.
The Need to Adapt Turtle Strategy in Today’s Markets
The Turtle Trading system performed exceptionally well during the strong, sustained trends of the 1980s. Since then, markets have changed, with price action becoming noisier and trends often shorter, which has reduced the effectiveness of pure breakout execution.
Key challenges that emerged include:
- More frequent false breakouts, leading to whipsaws and premature exits
- Deeper and longer drawdowns, which are difficult for most traders to sit through
- Reduced follow-through after breakouts, especially in sideways or choppy conditions
These limitations were later highlighted by Curtis Faith, one of the original Turtle traders, who studied the system’s performance across multiple decades in Way of the Turtle (2007). His research showed that while the Turtle principles remained sound, trade management, exit logic, and trend alignment mattered more than the breakout trigger itself.*²
Note: Curtis Faith was regarded as a controversial figure when Way of the Turtle was first published. Several original Turtles publicly disagreed with his interpretations and conclusions*³, particularly around performance attribution and system evolution.
His work is often treated as one perspective rather than a definitive account.
Turtle Trading Strategies Trading Strategies
The spirit of Turtle Trading lies in its disciplined structure: follow the trend, control the risk, and size positions according to volatility. Here, we examine how to preserve that spirit while expanding on the execution with different indicators suited for today’s markets.
Donchian Channels Turtle Trading
First off, let’s recap how the turtle trading strategy works. They used a simple breakout strategy, with risk management rules in place to ensure a steady equity curve, and relatively low drawdown.
Let’s review:
| Rule | Purpose |
| Donchian Channels x2 | A larger channel was used for breakout entries, while a smaller channel signalled exits. System 1 used 55/20 periods, and System 2 used 20/10 periods. |
| ATR Indicator | ATR measured volatility and was used to size trades and place stops, keeping risk consistent across markets. |
| Volatility-Based Position Sizing | More volatile markets used smaller position sizes, while calmer markets allowed larger ones. |
| Fixed ATR Stop Loss (2× ATR) | Stops were set two ATRs from entry to cap losses early. |
| Pyramiding into Winners | Additional units were added as trades moved in profit, maximising gains in strong trends. |
ATR with Moving Average Strategy
One of the biggest flaws in the original Turtle rules is the Stop-and-Reverse (SAR) mechanic. Ironically, it can force traders into counter-trend positions while using a trend-following system.
The problem isn’t really the SAR per se; it’s the fact not all reversals are aligned with the broader trend, so we end up taking unnecessary trades and losses.
So how do we fix this?
A simple, modern fix is to apply a moving average trend filter to the Donchian breakout rules. This keeps trades aligned with the broader market direction and avoids unnecessary whipsaws.
We recommend pairing the 200-period Simple Moving Average with faster 20-day and 10-day Donchian Channels. This anchors trades to a long-term mean while allowing quicker exits, better suited to today’s choppier, post-1990s market conditions.
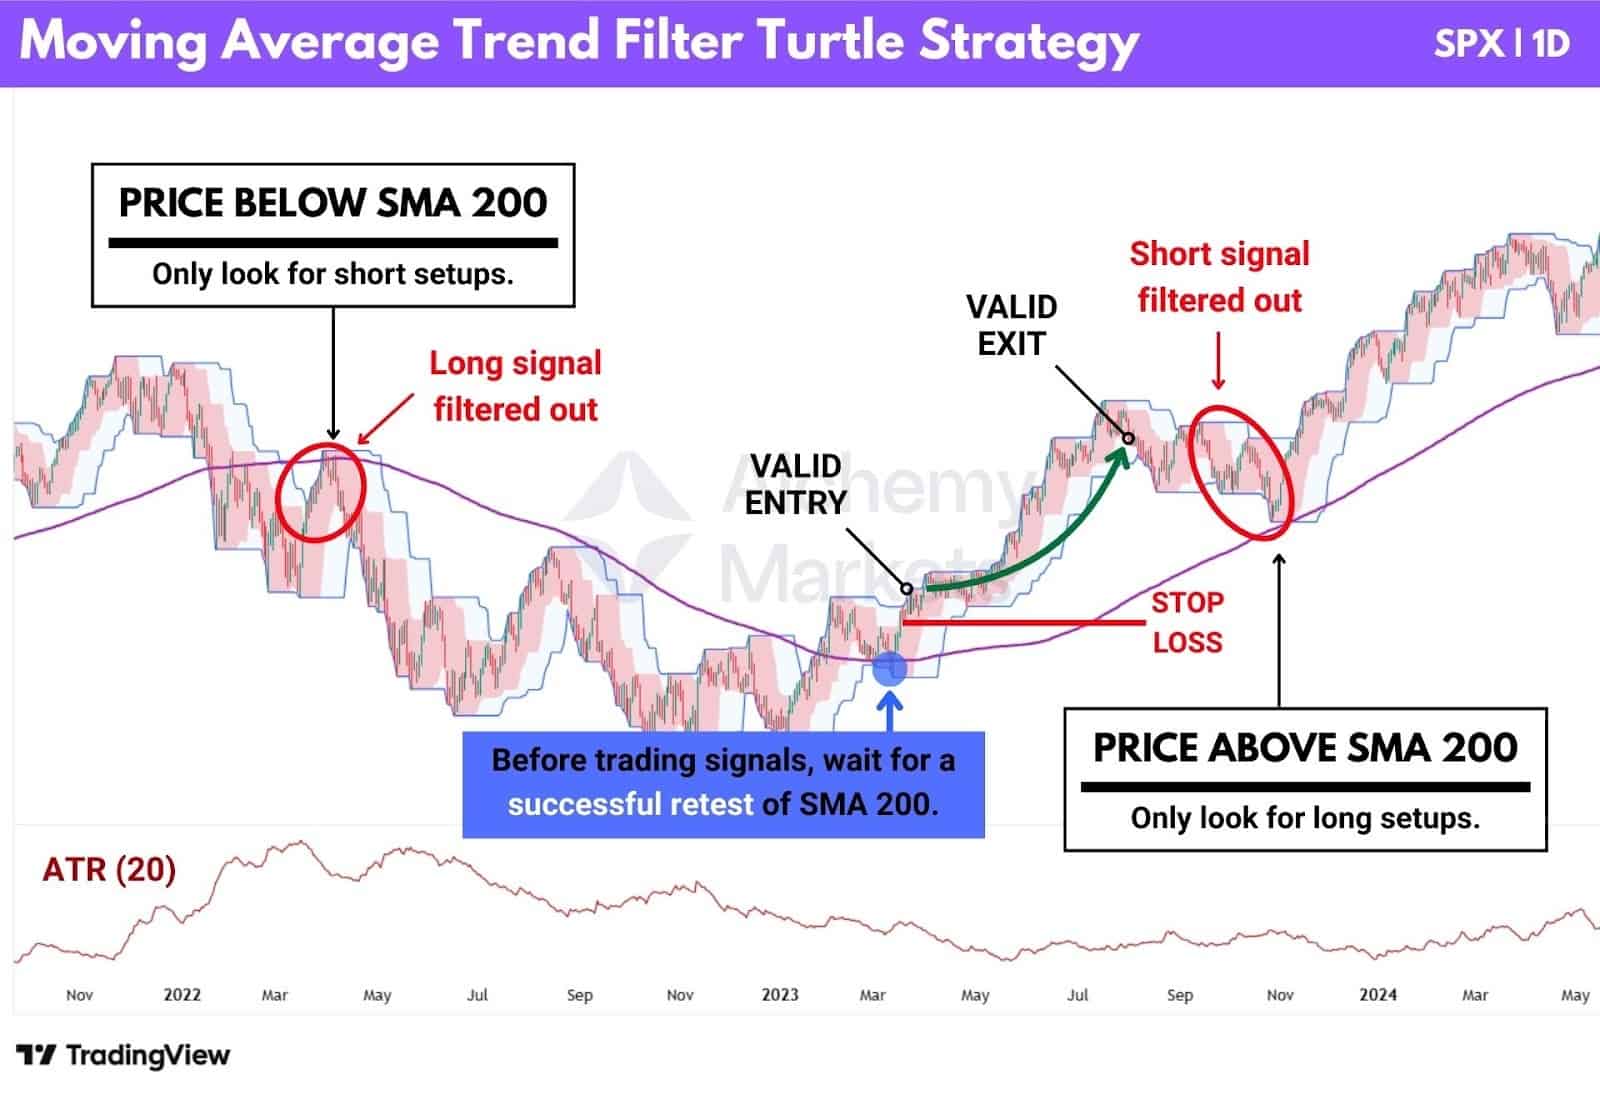
| Key rules of the strategy |
| Use faster Turtle presets: 20-period entry Donchian and 10-period exit Donchian, better suited to post-1990s market conditions. |
| Longs only when price is above the SMA 200. |
| Shorts only when price is below the SMA 200. |
| Before acting on a signal, wait for a successful retest of the SMA 200 to confirm trend strength and avoid trading into a pullback. |
This trend filter integrates cleanly with the original Turtle approach. Donchian Channels still handle trade entries and exits, while the 200-period SMA defines the broader market bias.
Waiting for a retest of the SMA 200 is optional, but recommended, especially on the daily timeframe. The SMA 200 often acts as a widely watched mean level, where pullbacks can stop and reverse, beginning the next impulse move.
The result is a modernised Turtle framework that stays true to the original philosophy, but reacts far better to today’s faster, more whipsaw-prone markets.
Donchian Channels Trend Trading Strategy
Donchian Channels are most commonly associated with breakout trading, made especially famous by the classic Turtle system. But breakouts aren’t the only way to use them. The basis line can also be used to capture retracement-continuation setups.
The idea is simple: instead of chasing new highs or lows, we wait for price to retrace back toward the basis line of the Donchian Channel. This line represents the raw average price over the last X candles and helps estimate where price may stabilise before continuing the trend.
In today’s choppier market conditions, this approach may be more well adapted. By patiently waiting for pullbacks, entries are more forgiving, which can help reduce drawdowns and improve win consistency.
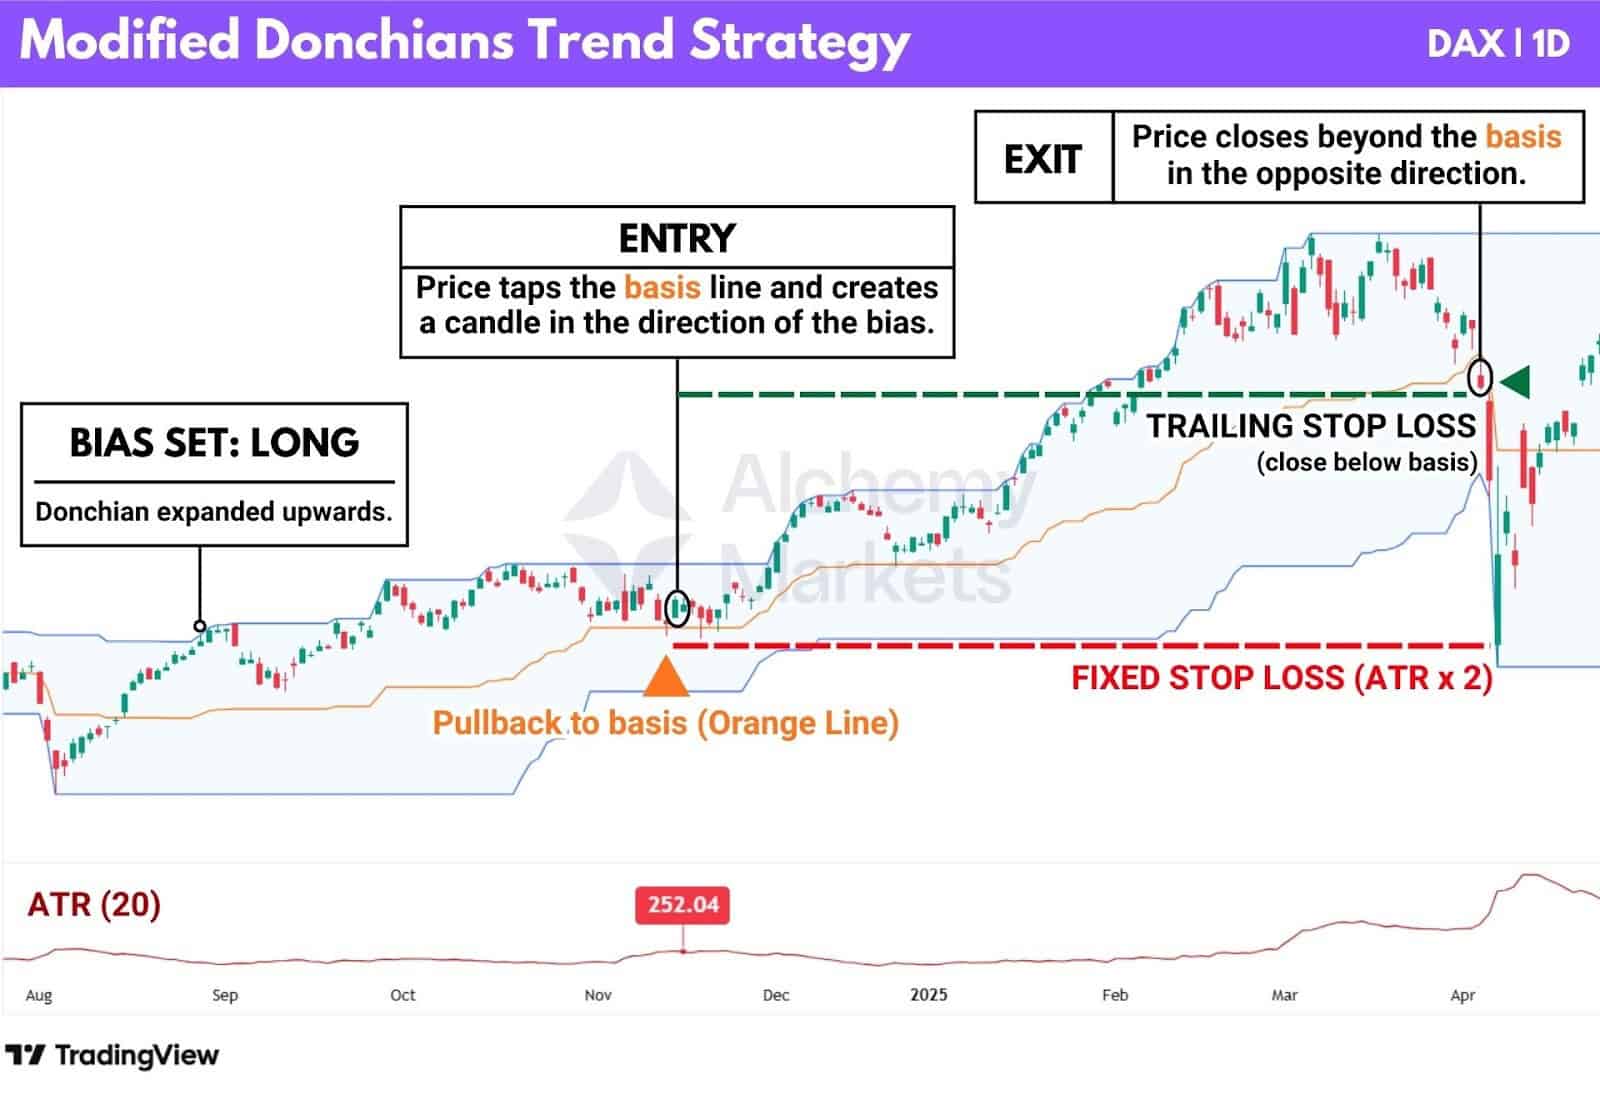
| Key rules of the strategy |
| On the Donchian Channel – A new high establishes a long bias, a new low establishes a short bias. |
| Watch for reactions from pullbacks to the basis line, in the direction of the established bias. |
| If price breaks the basis against the bias but then reclaims it, the move can be treated as a valid continuation entry. |
| Stop looking for continuations and trade pullbacks in the new direction if the bias direction flips. |
| Use a fixed stop loss based on ATR x 2 to manage risk. |
We recommend starting with the original Turtle setting of 55 periods, then experimenting with lower values to find what best suits the asset and timeframe you’re trading.
As a rough guide:
- Shorter periods (10–15) are more responsive and suit faster, short-term trading
- Medium periods (20–55) work well for swing trading
- Longer periods (55+) are better suited to position or spot trading
By using Donchian expansion to define direction and the basis line as an anchor, this strategy focuses on alignment rather than speed. The goal isn’t to be first into a move, but to enter at lower-risk levels where the trend is more likely to revisit.
Donchian Trend with Time Exit strategy
One of the original Turtle traders, Curtis Faith, tested a variation of the Turtle system in his book Way of the Turtle (2007). His research covered futures market data from the 1970s through the early 2000s, allowing him to compare how the rules performed across different market conditions.
Instead of exiting trades using price-based stops, Faith tested a fixed time exit. Trades were simply held for 80 trading days, regardless of profit or drawdown. The goal was to see whether a simpler exit could outperform more reactive stop-loss rules.
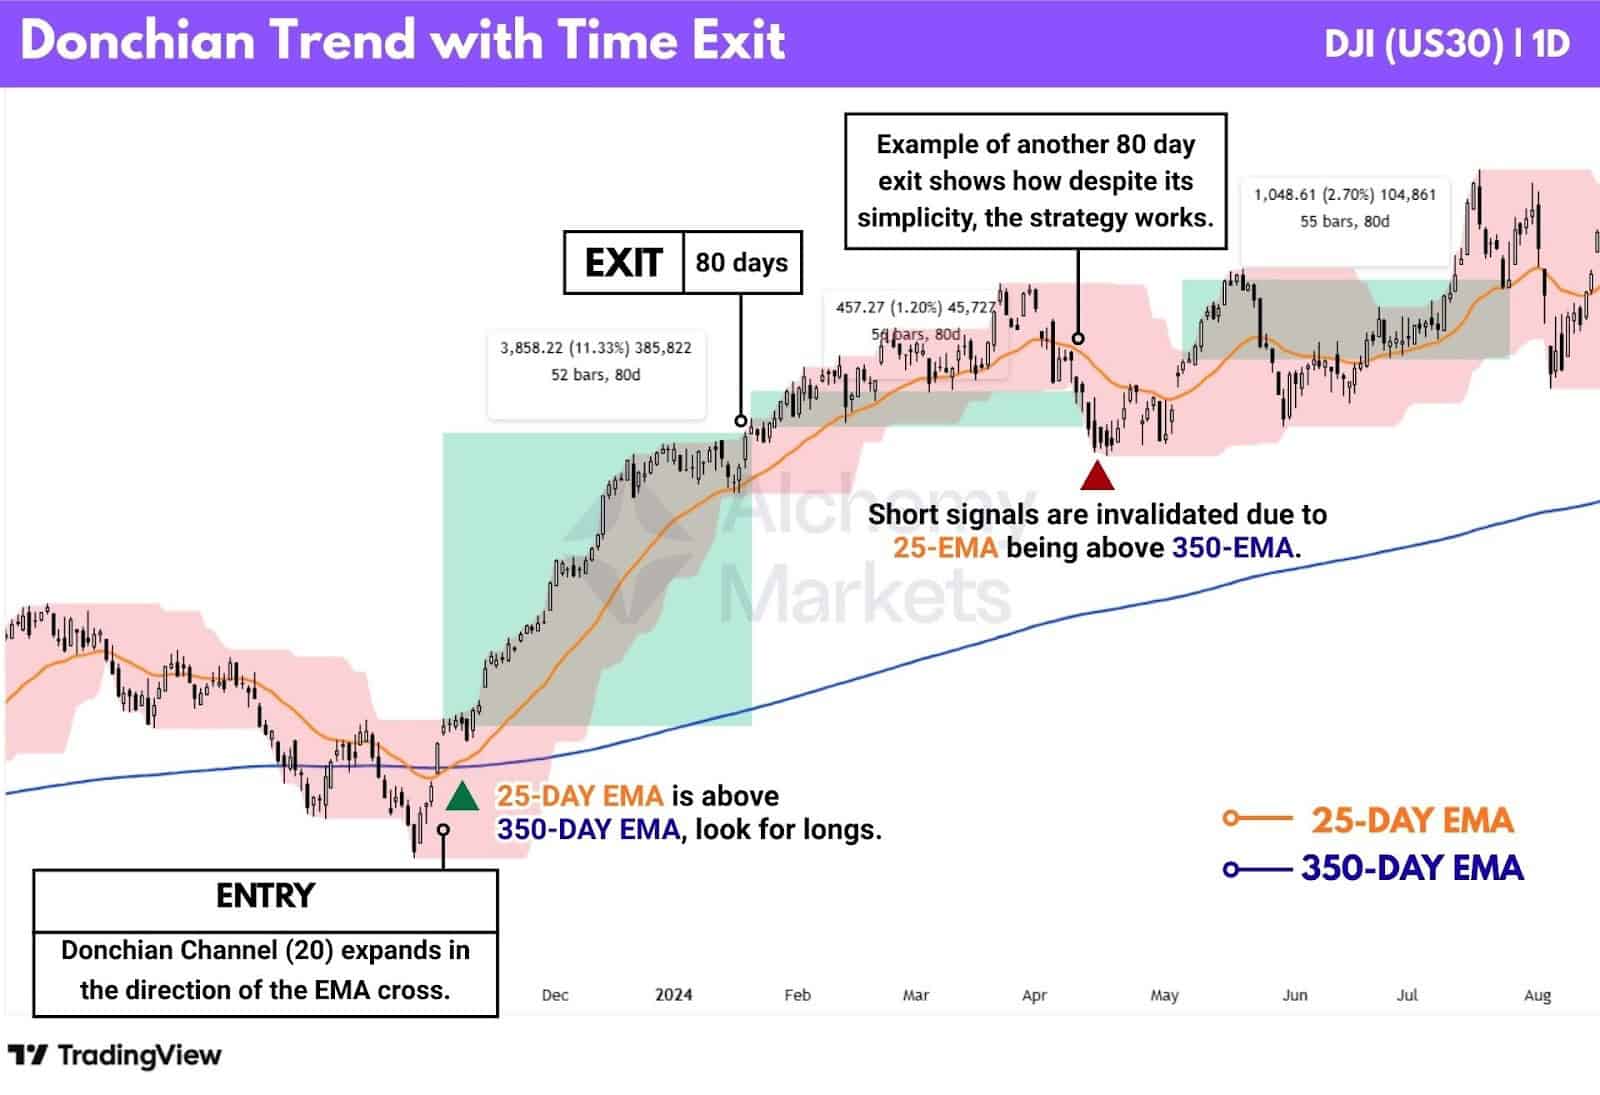
The results were clear. The standard Donchian trend strategy delivered a 29.4% compound annual growth rate (CAGR). The time-exit version nearly doubled that, producing a 57.2% CAGR. It also achieved a higher win rate and better risk-adjusted performance, while drawdowns tended to resolve faster..
To reduce poor-quality trades, Faith added a long-term trend filter using a 25-day and 350-day EMA crossover. Long trades were only taken when the fast EMA was above the slow EMA, and shorts only when it was below.
The strategy was tested across liquid US futures markets, closely matching the original Turtle trading universe, including currencies, commodities, and Treasury bonds.
| Key rules of the strategy |
| Use a 20-period Donchian Channel to detect breakouts. |
| If 25-EMA is above 350-EMA, look for longs. If 25-EMA is below 350-EMA, look for shorts. |
| Exit the position after 80 days. |
From this experiment, Curtis Faith concluded that breakout exits were no longer the primary source of edge, as time-based exits often performed better by avoiding short-term noise and false reversals. This suggested that markets had become choppier since the original Turtle program, reducing the effectiveness of reactive breakout exits.
Despite the simple approach, Curtis’s research showed that managing trades and staying aligned with the trend mattered more than perfect entries or exits.
Bollinger Channel Breakout Strategy
Curtis Faith also explored Bollinger Bands® as an alternative to the Donchians Channel, while using the same trade execution logic. He waited for the price to break out of a Bollinger Bands, trade in that direction, and then exited trades when the price broke in the reverse direction.
This approach garnered a stronger win rate of 54.6% compared to the turtle strategy’s 39.7%, while simultaneously achieving a lower drawdown, and maximum drawdown days.
Faith used a 350-Day SMA as the basis for the Bollinger Bands and a 2.5 standard deviation. Trades were opened when a close exceeded the bands (Long closes above, short closes below). Exit when the price closes through the basis line, which is the 350-Day SMA.
However, upon testing this strategy, we found that signals barely existed, or were too slow. Therefore, we suggest modifying the standard deviation to 1, in order to capture breakouts and exits more frequently.
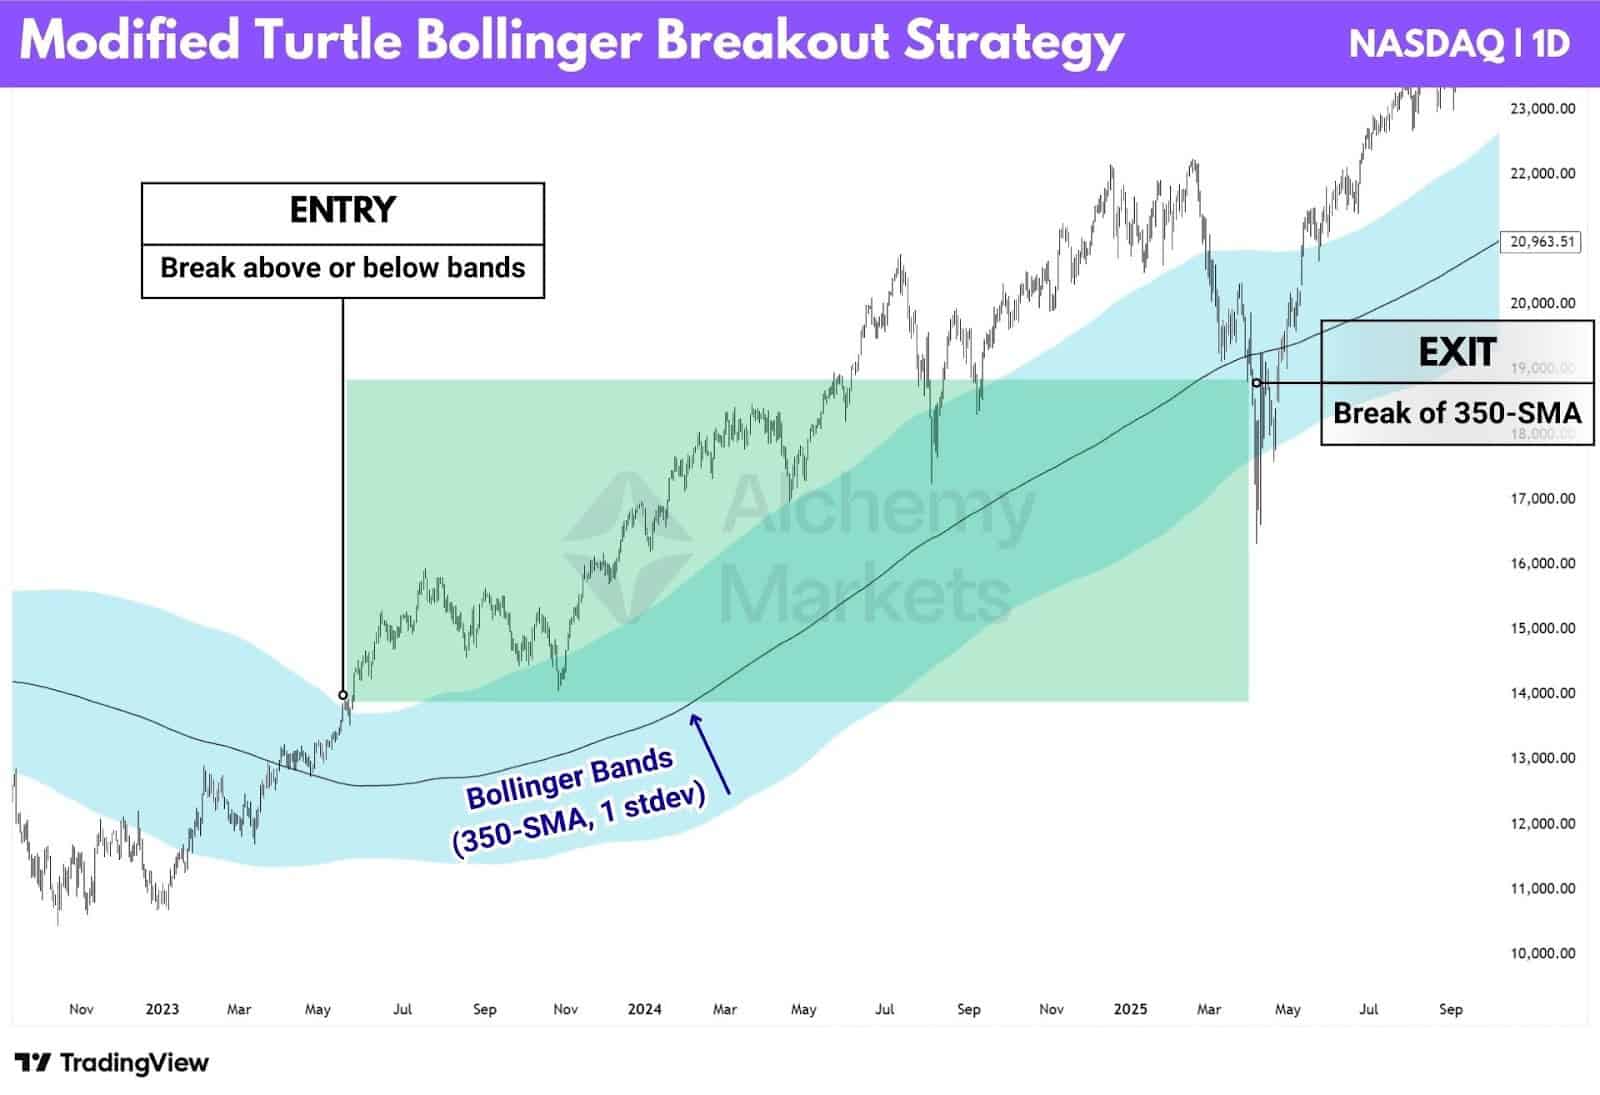
| Key rules of the strategy |
| Use a 350-period Bollinger Band to detect breakouts. |
| Entry is based on a close above the band (Long), or a close below the band (Short). |
| Exit the position if the price crosses the 350-SMA (Basis/Middle Line) of the band. |
ATR Channel Breakout Strategy
The ATR Channel Breakout is a modification of the Bollinger Breakout that Curtis tested directly in Way of the Turtle. Instead of using a 2.5 standard deviation band, the channel is built using realised volatility via ATR. The upper band is set at the 350-day SMA plus 7 ATR, while the lower band is the 350-day SMA minus 3 ATR. Entry and exit rules are otherwise identical to the Bollinger Breakout.
Interestingly, in Curtis’s testing, the ATR Channel Breakout produced lower returns than the Bollinger Breakout, with a 42.2% win rate and 39.9% maximum drawdown.
Trades are entered only after a confirmed close beyond the channel and are held until price closes back through the 350-day SMA. No stops or targets are used. The entire edge comes from volatility filtering, position sizing, and the ability to stay in extended trends when they occur.
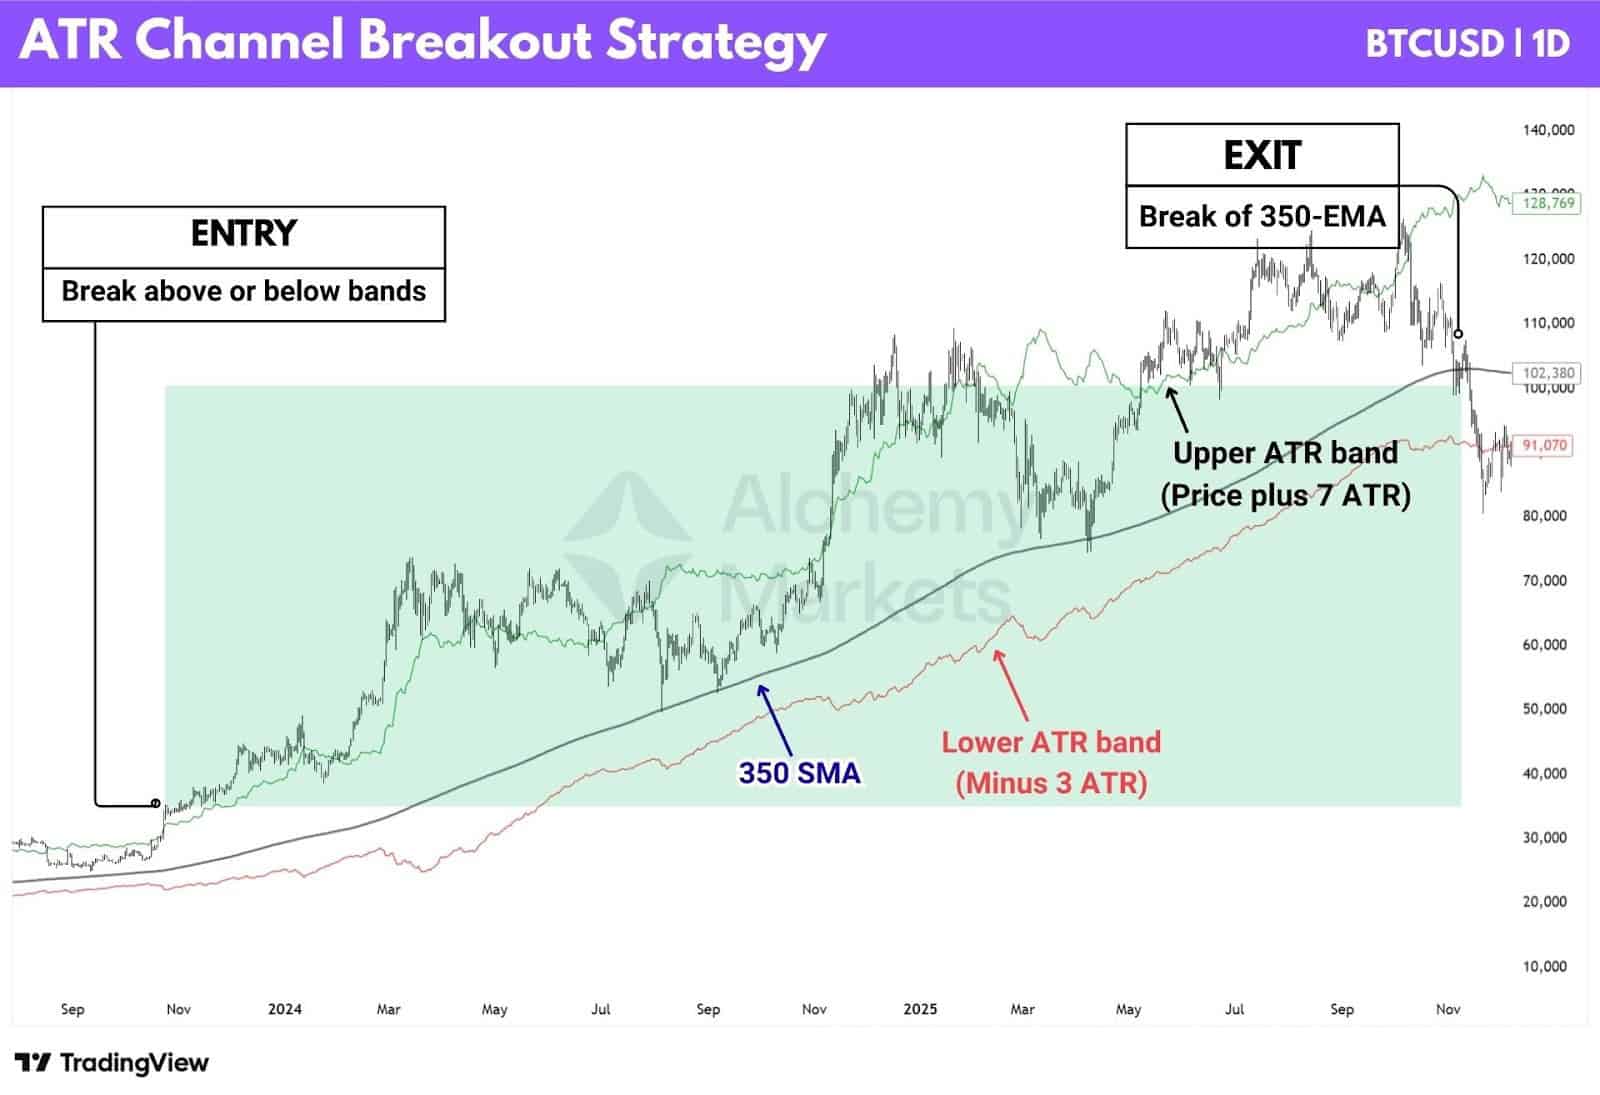
| Key rules of the strategy |
| Use a 350-period SMA plus or minus 7 ATR, or 3 ATR to detect breakout entries. |
| Use a 350-period SMA to detect exits. |
| Entry is based on a close above the band (Long), or a close below the band (Short). |
| Exit the position if the price crosses the 350-SMA (Basis/Middle Line) of the band. |
A key note is that this strategy was tested using a custom Pine Script strategy on TradingView. The ATR channel cannot be constructed accurately with native indicators, as it requires asymmetric ATR offsets around a moving average. As a result, a custom Pine Script implementation is one of the only ways to recreate and test this strategy correctly.
Dual Moving Average Strategy
This is a simple trend-following system built around a dual SMA crossover. In Curtis Faith’s testing, it delivered the strongest long-term performance, returning 57.8% CAGR, making it the best-performing strategy in the study.
The rules are straightforward. A 100-day SMA is used as the fast average and a 350-day SMA as the slow trend filter. Here’s how it works:
- When the 100 SMA crosses above the 350 SMA, enter a long trade.
- When it crosses below, enter a short trade.
- Positions are exited and reversed only when an opposite crossover occurs.
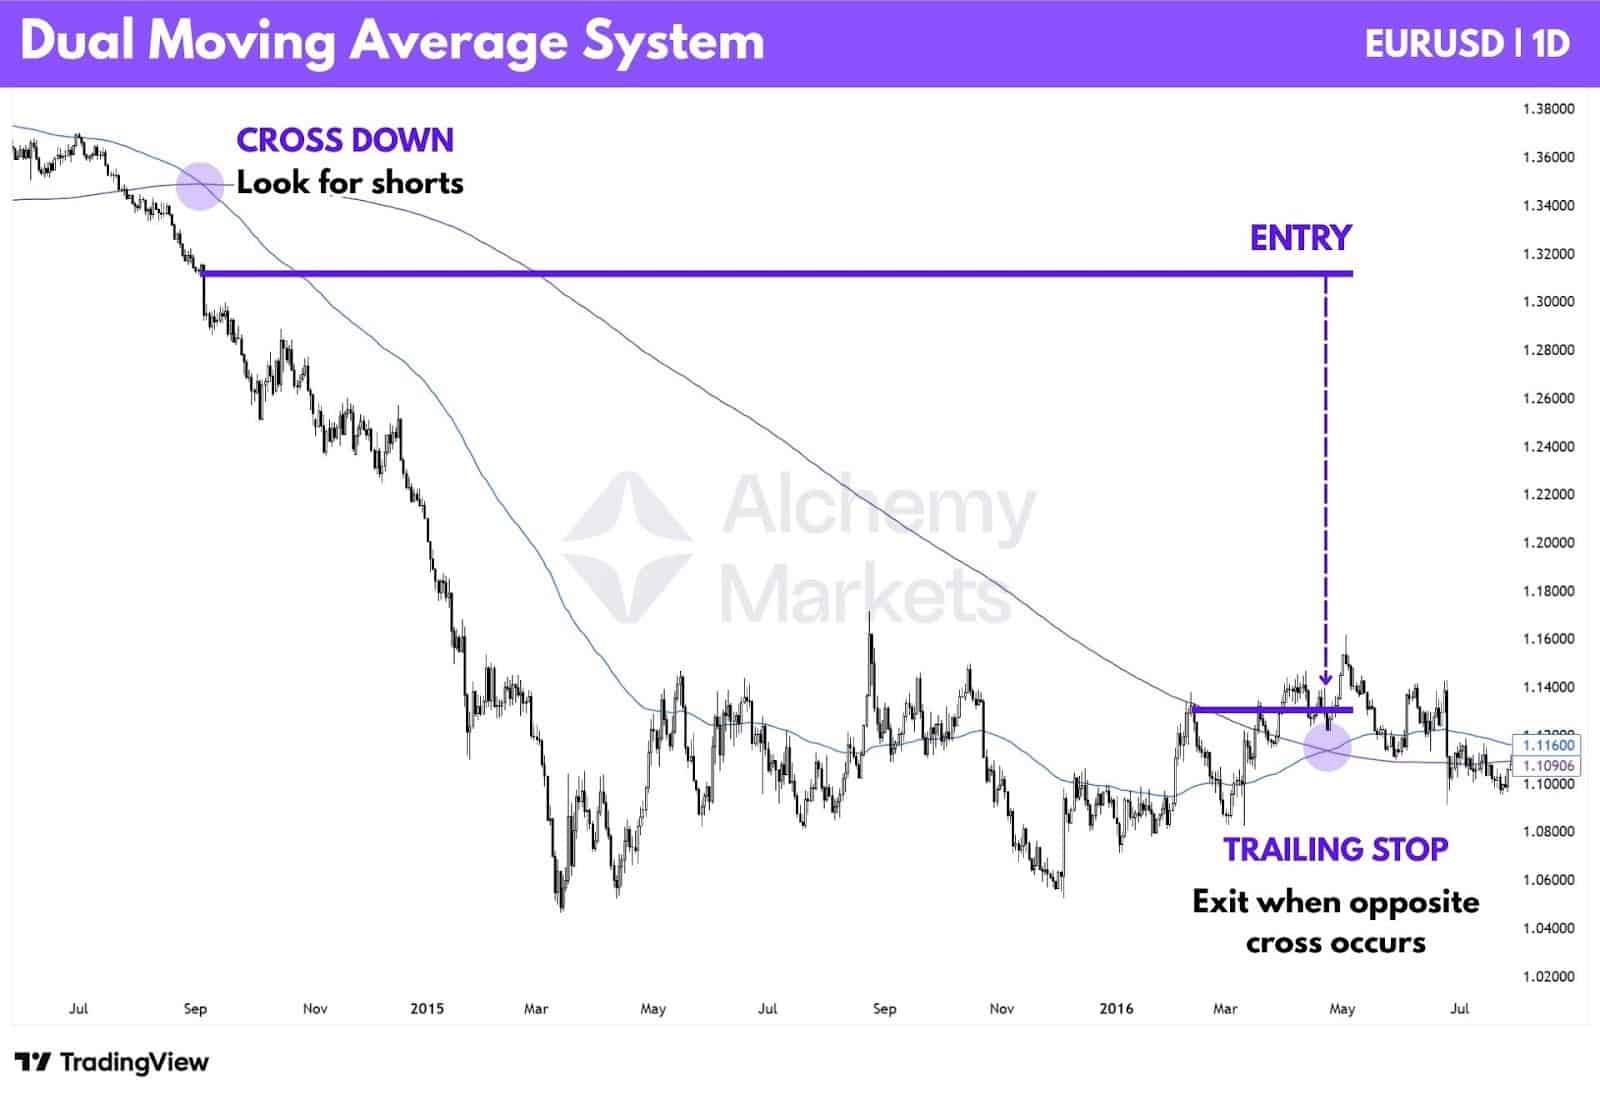
Again, this is a simple strategy to apply, but by design it only performs well in strong trending environments where price travels far. However, the main weakness of the pure crossover system is capital protection, something that runs counter to the original Turtle philosophy.
A more practical variation is to treat the crossover as directional bias, not a direct entry.
After the cross, you wait for price to retrace toward the 100 SMA, show rejection, and only then enter in the direction of the trend. This approach avoids many of the large drawdowns seen in choppy conditions, at the cost of giving up some upside when trends extend cleanly.
Below is an example of how this modified approach behaves in a more choppy market:
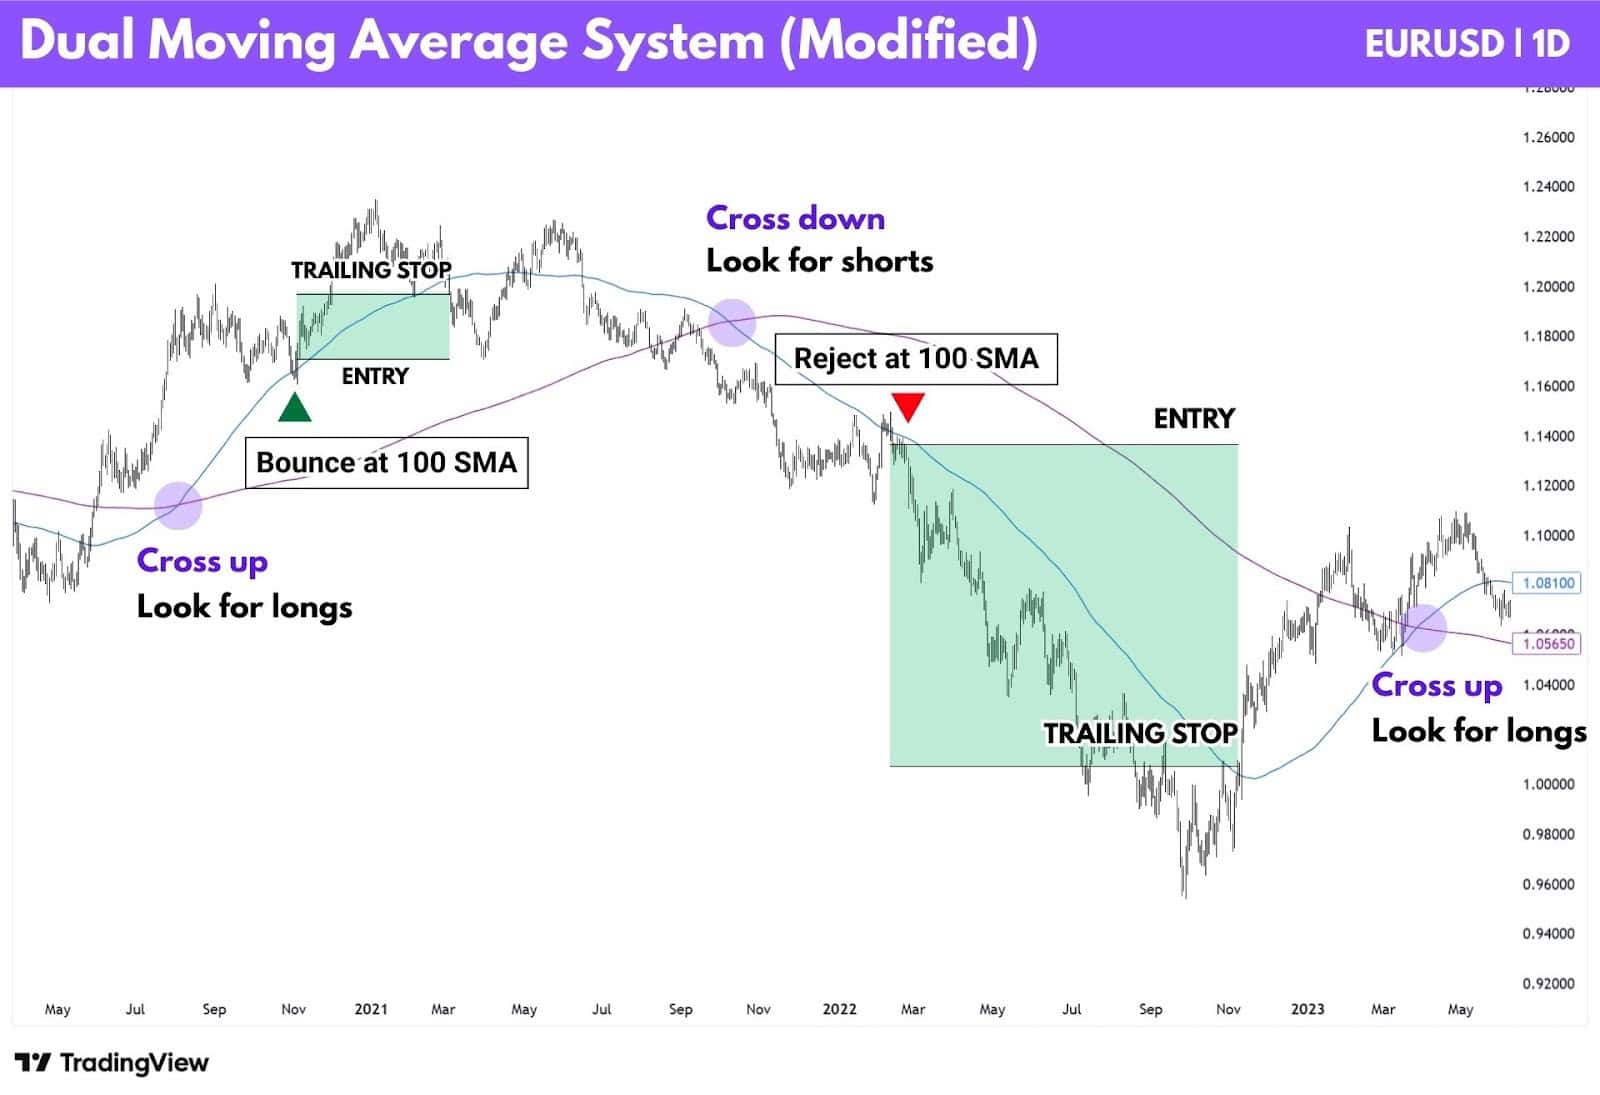
| Key rules of the strategy |
| Use the crossover to set your bias. A cross down is bearish, a cross up is bullish. |
| Entry signal: Wait for price to retrace and pivot at the 100 SMA. |
| Exit signal: Wait for price to cross the 100 SMA, and close beyond it. |
Notice how this approach keeps our trades open just long enough for it to benefit from trend continuation. Yet at the same time, it helps us exit positions earlier, without waiting for an opposite cross which would have turned a winning trade into a losing one.
Ultimately, it is up to your risk appetite which strategy you’d like to employ.
Triple Moving Average Strategy
The Triple Moving Average Strategy expands on simple trend-following by adding an extra layer of confirmation. Rather than relying on a single crossover, it uses three moving averages to define trend direction, confirm momentum, and time participation more selectively.
A typical setup uses:
- A slow moving average to define the dominant market trend
- A medium moving average to confirm trend strength
- A fast moving average to signal entries, when it crosses through the medium-term average
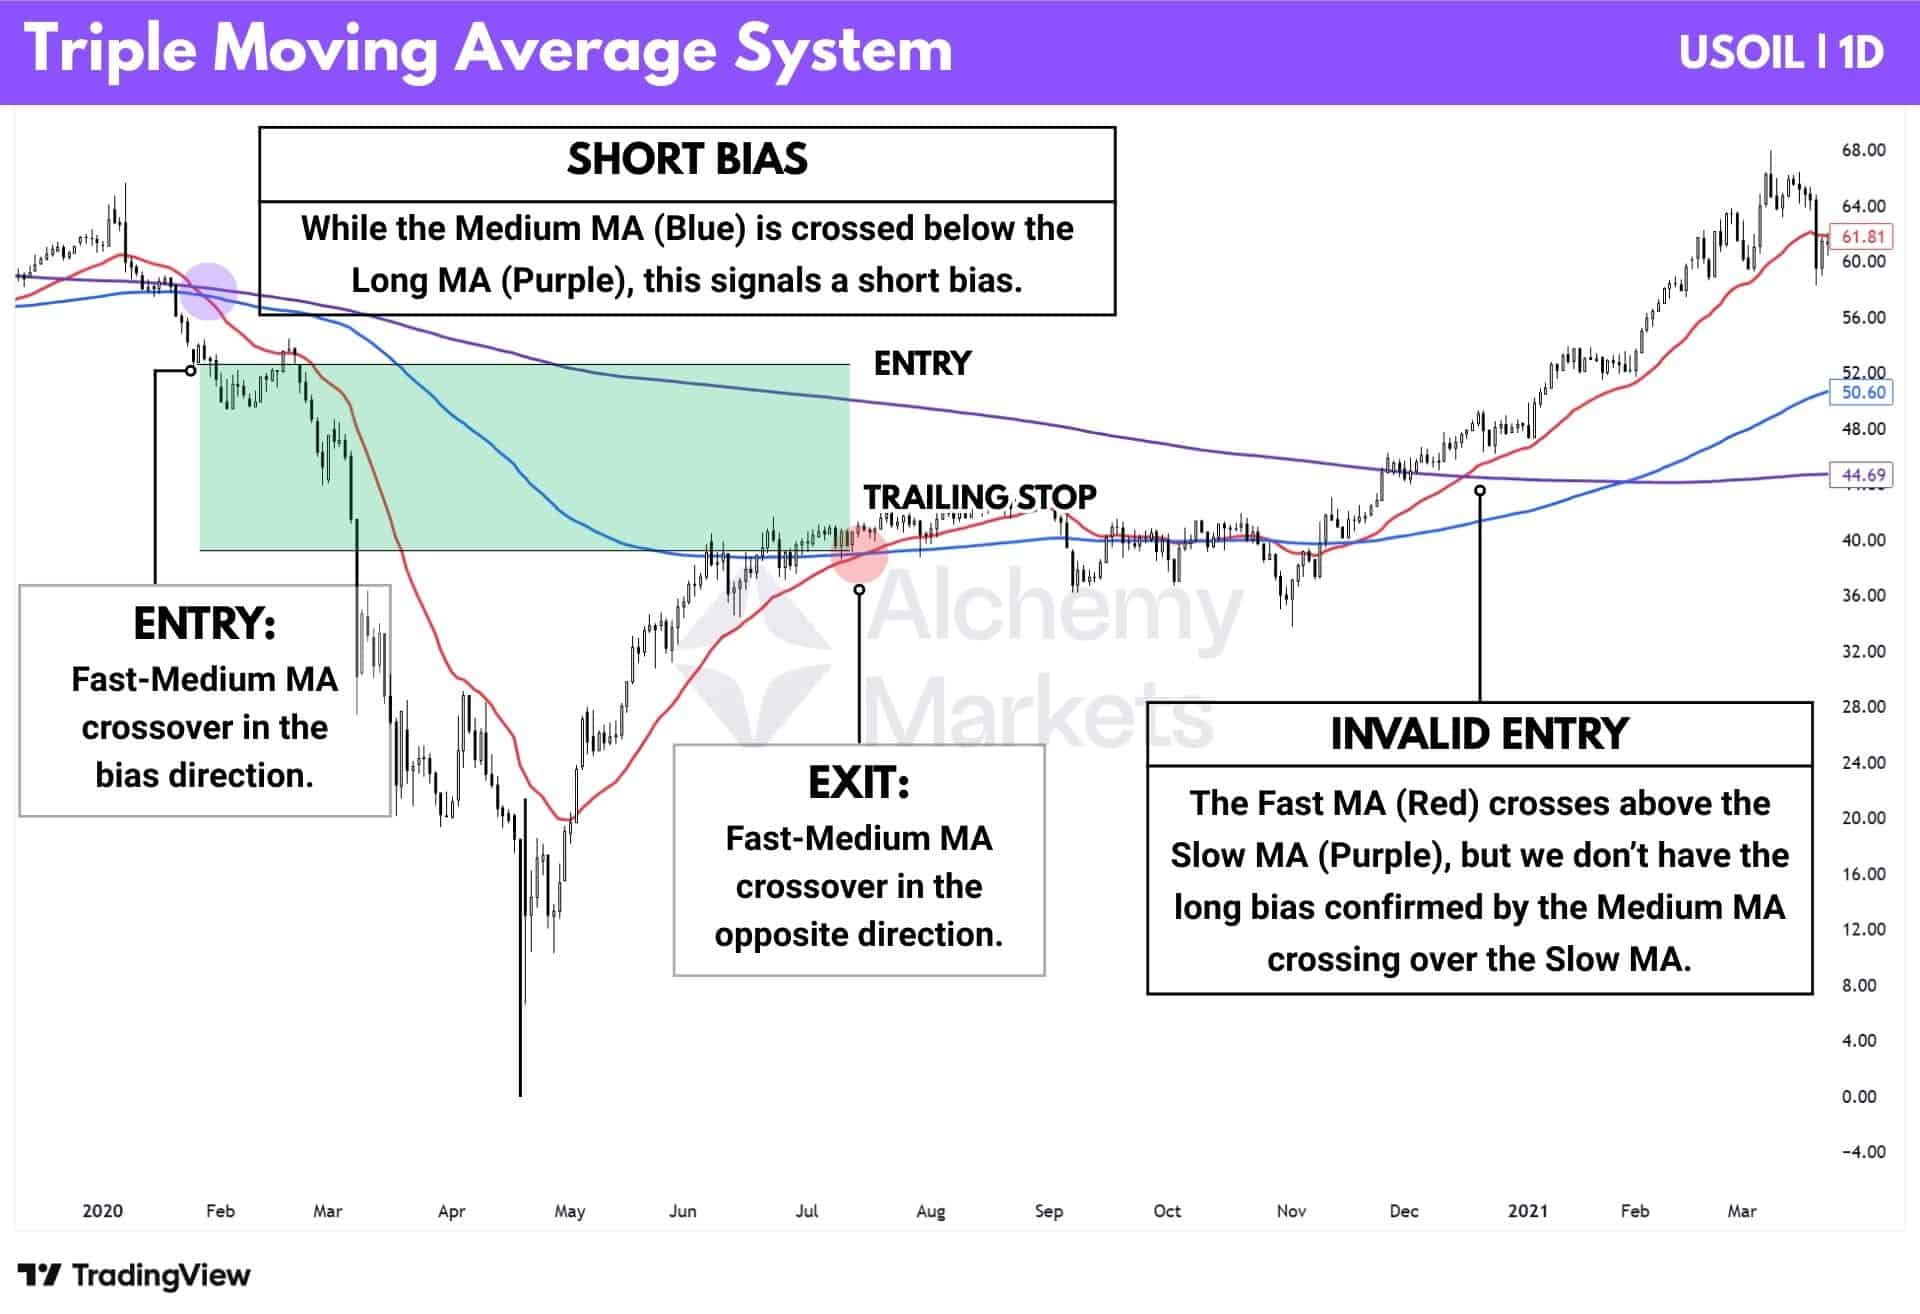
When the fast average is above the medium average, and the medium average is above the slow average, the system maintains a bullish bias. When the alignment flips, the bias turns bearish.
Entries occur when the fast moving average crosses above the medium average while both remain on the correct side of the long-term average. Exits occur when this alignment breaks.
| Key rules of the strategy |
| Bullish when medium MA > slow MA; bearish when the order is reversed. |
| Enter when the fast MA crosses the medium MA in the direction of the existing alignment. |
| Exit when the MA alignment breaks. |
| In Curtis Faith’s testing, he used 25-EMA (fast), 150-EMA (medium), and 350-EMA (slow) |
Like all moving average systems, the triple MA strategy performs best in sustained trending environments. Its strength lies in filtering noise and avoiding premature entries, but this comes with the weakness of providing slow signals, or sometimes missing out on trends completely; as shown in the chart above.
What is the logic behind Turtle Trading theory?
Turtle Trading is built on one core idea: big market trends are rare but powerful, and a mechanical system can capture a portion of those trends by cutting losses early and holding winners for as long as they run.
The logic relies on four principles:
- Breakouts reveal the start of a potential trend
- Volatility defines position size and stop placement
- Most trades will lose small, but the few winners cover everything
- Rules remove emotional decisions and enforce consistency
Trend-following works because markets move in cycles of expansion and contraction. The Turtle rules wait for expansion, manage risk through volatility, and use mechanical exits to avoid giving back profits.
Advantages of Turtle Trading
Structured Rules
The turtles had strict rules for every aspect of their trading. The predefined nature of these rules help reduce room for error and emotional trading.
Risk Management
This was the most valuable component of the turtles’ trading approach. Their volatility-based sizing and fixed stops keep losses small, even during losing streaks.
Adaptability
Provided appropriate tweaks, the system works on any liquid market including forex, commodities, indices, and even in crypto markets, which wasn’t available in the 1980s.
Trend Following
The turtles used a strategy that performed best in strong trending markets, whether bullish or bearish. By aligning with the macrotrend, they positioned themselves to catch the big directional moves.
You Can Automate Trend Following
Due to the rules being mechanical, the system is simple to code and backtest. It isn’t like trading with a Fibonacci retracement, where human eyes are needed to accurately discern where to apply the tool, for instance.
Potential For High Returns
Although most Turtle trades ended in small losses, the occasional winner tended to run far. These large home runs were the cornerstone of the system, balancing out the frequent small losses and driving long-term profitability.
Applicable to multiple financial instruments
Turtle Trading can be applied across a wide range of liquid markets, including equities, forex, commodities, indices, and crypto. Its rules are asset-agnostic, allowing the same framework to be used wherever strong trends and sufficient liquidity exist.
Disadvantages of Turtle Trading
Requires discipline and patience
Turtle Trading, as its name suggests, is a long term strategy. Many traders struggle with remaining disciplined over this long duration of time, which can span years.
Mechanical Nature
The system is fully mechanical, requiring traders to take every signal regardless of recent performance. This removes emotion but offers no flexibility when trades feel uncomfortable.
Drawdowns
Frequent small losses are normal in Turtle Trading and are offset only by occasional large winners. These drawdowns can be difficult to tolerate, especially for newer or undercapitalised traders.
Complexity for Beginners
While conceptually simple, the rules involve position sizing, pyramiding, and volatility-based stops can be overwhelming. Misunderstanding these elements often leads to poor execution or even discourages it.
No Fundamental Analysis
Turtle Trading ignores fundamentals entirely and reacts only to price movement. Traders looking for explanations behind market moves may find this approach unsatisfying.
Will miss short-term opportunities
The strategy focuses on long-term trends and ignores many short-term or mean-reverting setups. In choppy markets, this can result in repeated small losses or long inactivity.
Turtle Trading in Bitcoin and Crypto
Backtests show that classic Turtle Trading rules can work on Bitcoin, but results are inconsistent and heavily dependent on timeframe, volatility regime, and execution rules.
In practice, performance improves only when the system is adapted with tighter risk controls and filters, as crypto’s rapid volatility shifts tend to produce frequent whipsaws under the original rules.
Turtle Trading vs Turtle Soup Strategy
The ‘Turtle Soup Strategy’ is an interesting strategy you may have heard floating around on the internet, and conceptually, it is a strategy that focuses on trading fakeouts. These are basically false breakouts.
The name is a tongue-in-cheek play on the 1980’s Turtle Trading System, which is all about trading breakouts, and then staying in a trend for as long as a trailing stop system allows. Essentially, the turtle soup strategy trades scenarios which “cook” the turtles, turning them into soup.
Unfortunately, a cool thematic focus and name is where their similarities end. At its core, the turtle trading approach is all about adapting a patient psychology with a trend-following system.
The turtle soup strategy on the other hand, comes from a Smart Money Concepts background, and using SMC market structure trading concepts such as Change of Character, Break of Structure, and Liquidity Sweeps to trade fakeouts.
FAQ
What happened to the original Turtles after the experiment?
After the experiment ended, results varied. Some Turtles went on to manage money successfully, while others left trading or struggled once the original conditions and backing were removed.
What happened to Richard Dennis?
Richard Dennis continued trading for years but experienced significant drawdowns later in his career and eventually stepped back from active trading, focusing more on philanthropy and political causes.
What happened to William Eckhardt?
William Eckhardt continued managing money and later co-founded Eckhardt Trading Company, where he focused on systematic and quantitative trading strategies.
Why use turtle trading rules?
The Turtle rules emphasise risk control, discipline, and consistency, removing emotional decision-making from trading. They are often used as a foundation for systematic trend-following approaches.
Is Turtle Trading a day trading strategy?
Typically, no. Turtle Trading was designed as a longer-term trend-following system, originally traded on daily charts and held for weeks or even months. The edge comes from capturing sustained trends, not intraday noise.
To adapt it for day trading, you would need to shorten the breakout lookback periods, reduce ATR-based stops, and accept a much higher frequency of false breakouts. At that point, the strategy stops behaving like classic Turtle Trading and becomes a different system altogether
What are the Best Turtle trading books?
The most respected titles are The Complete TurtleTrader, Trend Following, and Following the Trend, which focus on process, risk, and real-world application rather than rigid rule copying.
Together, they give a balanced view of Turtle Trading as a foundation for systematic trend-following, not a plug-and-play strategy.
What markets does Turtle Trading work best on?
Turtle Trading works best in markets that trend cleanly and for extended periods. Commodities, major forex pairs, indices, and some cryptocurrencies tend to suit it well, especially during strong macro-driven moves. It performs poorly in choppy, range-bound environments. Without sustained directional movement, the system can suffer from repeated small losses.
How important is position sizing in Turtle Trading?
Position sizing is absolutely critical. It is arguably more important than the entry itself. The Turtle system is built around volatility-adjusted position sizing using ATR, ensuring each trade risks a consistent percentage of capital regardless of market conditions. This allows traders to survive long losing streaks and stay in the game long enough to catch the few large trends that drive overall profitability.
How have turtles entered trades?
Trades were entered using breakout-based rules, most commonly Donchian channel breakouts aligned with the prevailing trend direction.
How are turtle trades conducted?
Positions were sized using volatility-based risk management, with predefined stops, pyramiding rules, and strict limits on portfolio risk.
Can traders profit from the turtle trading strategy today?
Most research suggests the original rules no longer deliver the same edge without adaptation, but the core principles remain effective when modified for modern markets.
Is the Turtle trading strategy back tested?
Yes. Numerous independent backtests exist, showing mixed results that vary widely by market, timeframe, and implementation.
How reliable are Turtle Trading Strategies?
The strategy is reliable in its logic but inconsistent in short-term performance, with long drawdowns being a normal feature rather than an exception.
References
- Covel, M. W. (2007). The Complete TurtleTrader: How 23 Novice Investors Became Overnight Millionaires. HarperCollins.
- Faith, C. M. (2007). Way of the Turtle: The Secret Methods that Turned Ordinary People into Legendary Traders. McGraw-Hill.
- Schwager, J. D. (1989). Market Wizards: Interviews with Top Traders. Harper Business.


