


Written by:

Reviewed by:


Bearish
Bullish
- December 31, 2025
- 17 min read
Liquidity Sweep Explained with Examples
A fisherman doesn’t chase fish one by one. He knows where they’ll gather, drops his bait, and waits. When the time’s right, he casts his net and hauls them all in.
That’s how Smart Money hunts too. It doesn’t chase; it sets traps.
These traps are called liquidity sweeps, which are sudden market jolts designed to pull you in, flip you over, and leave you watching as price runs the other way.
In this guide, we’ll break down how SMC traders identify and trade these powerful yet often misunderstood patterns across Forex, Stocks, Commodities, and Crypto.
What Is a Liquidity Sweep?
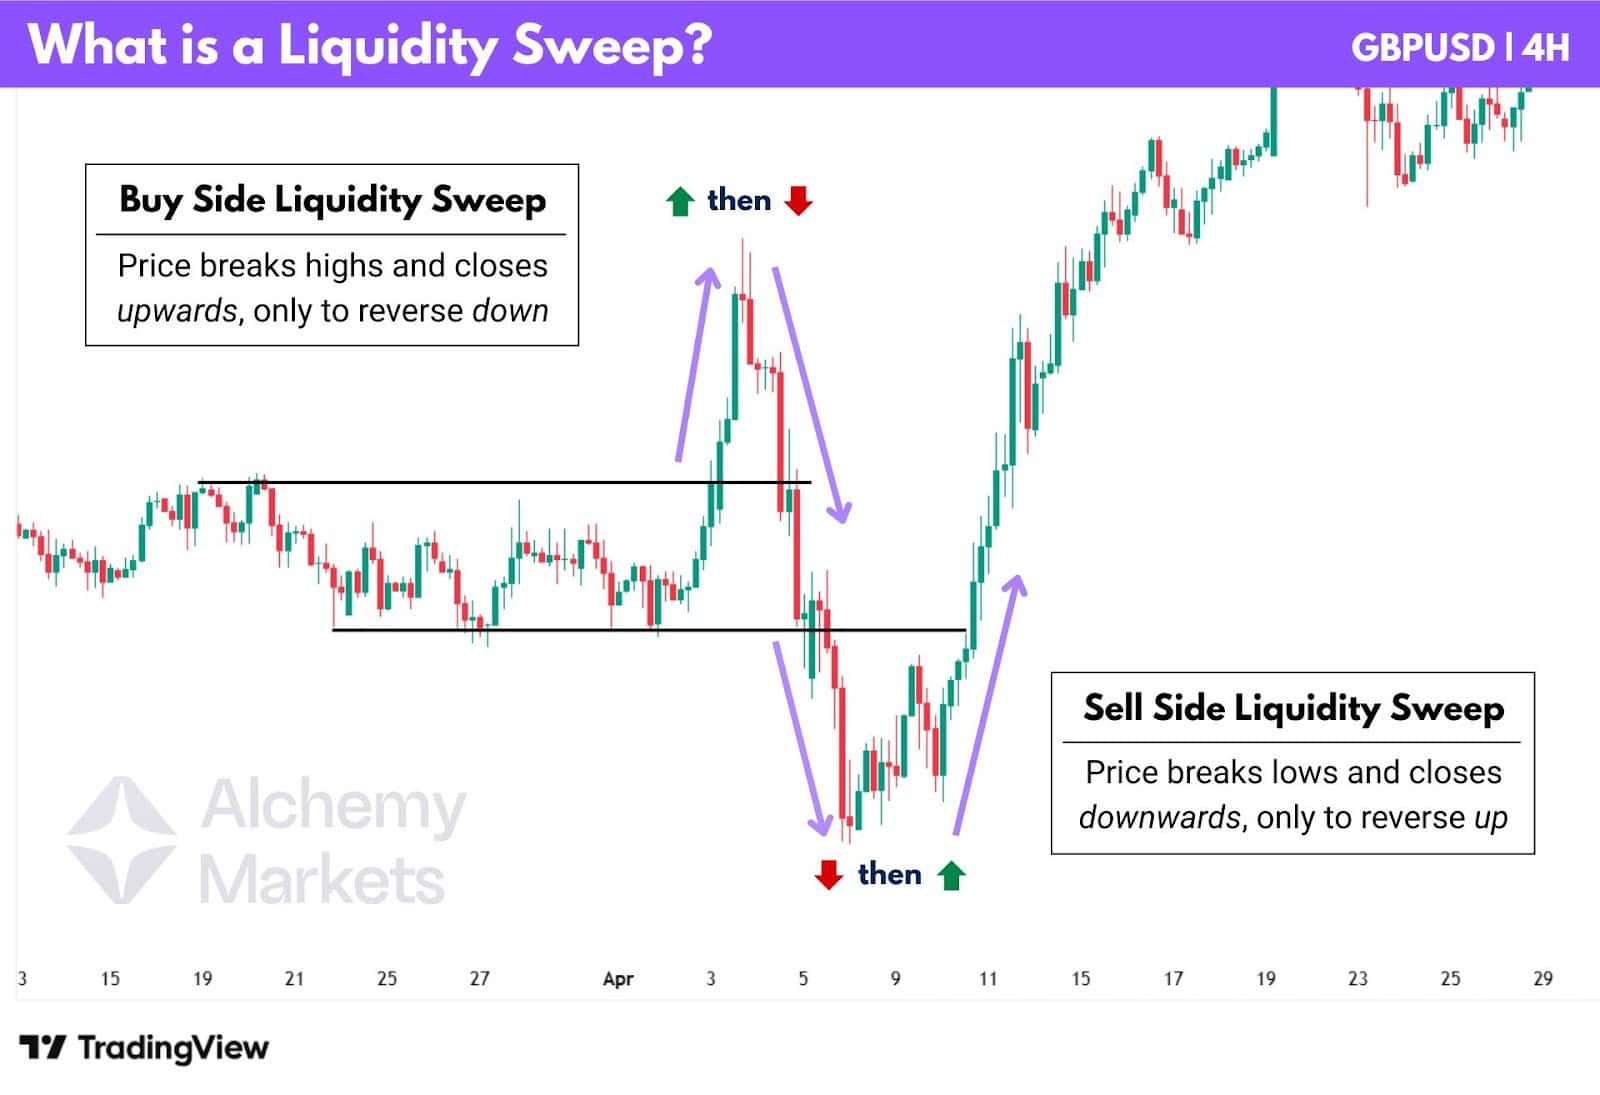
A liquidity sweep is a false break of structure, followed by a sharp reversal. This happens when the price goes beyond a known supply or demand zone, stays there briefly, but then reverses.
To many traders, it looks and feels like price manipulation. In some cases, it is.
But the real reason it happens comes down to trading liquidity. When someone wants to buy, someone else must sell. And when you’re a large financial institution managing hundreds of millions, you need large clusters of sell orders if you want to buy, and vice versa.
| Tip: Retail traders often use extreme leverage, sometimes up to 1000x, creating ideal liquidity for smart money to sweep. Highly levered positions, tight stops, and large volumes make them easy targets for liquidation. |
What is Liquidity in Trading
Liquidity refers to money committed in the market. It’s what moves price; when buying liquidity outpaces selling, price pushes higher, and vice versa.
High trading liquidity is crucial because it lets large positions get filled with minimal slippage. This is the core of trading liquidity: big players can enter or exit smoothly. When liquidity thins out, even small orders can distort price, which is why institutions actively hunt for large liquidity volumes before deploying size.
For liquidity sweeps, we focus on resting orders sitting in the order book, such as:
- Limit Orders
- Stop Loss Orders
- Liquidation Levels
In Smart Money Concepts, institutions monitor order flow (a fancy word for incoming buy and sell activity), to see where major liquidity pools build up. When clusters of stops or liquidation levels form, price is often pushed into those areas so Smart Money can trigger that liquidity and fill their trades efficiently.
This constant interaction between retail orders and institutional positioning is a key driver of the price movement we see across all markets.
What Are Liquidity Zones
Liquidity zones are areas on the chart where large volume orders cluster. In Smart Money Concepts, these zones often sit just beyond order blocks because traders naturally place their stops and breakout entries there. Knowing where they exist helps in identifying liquidity sweeps.
These pockets typically include:
- Stop losses from traders protecting positions.
- Buy stops and sell stops from breakout traders.
- Liquidations from leveraged positions that fail.

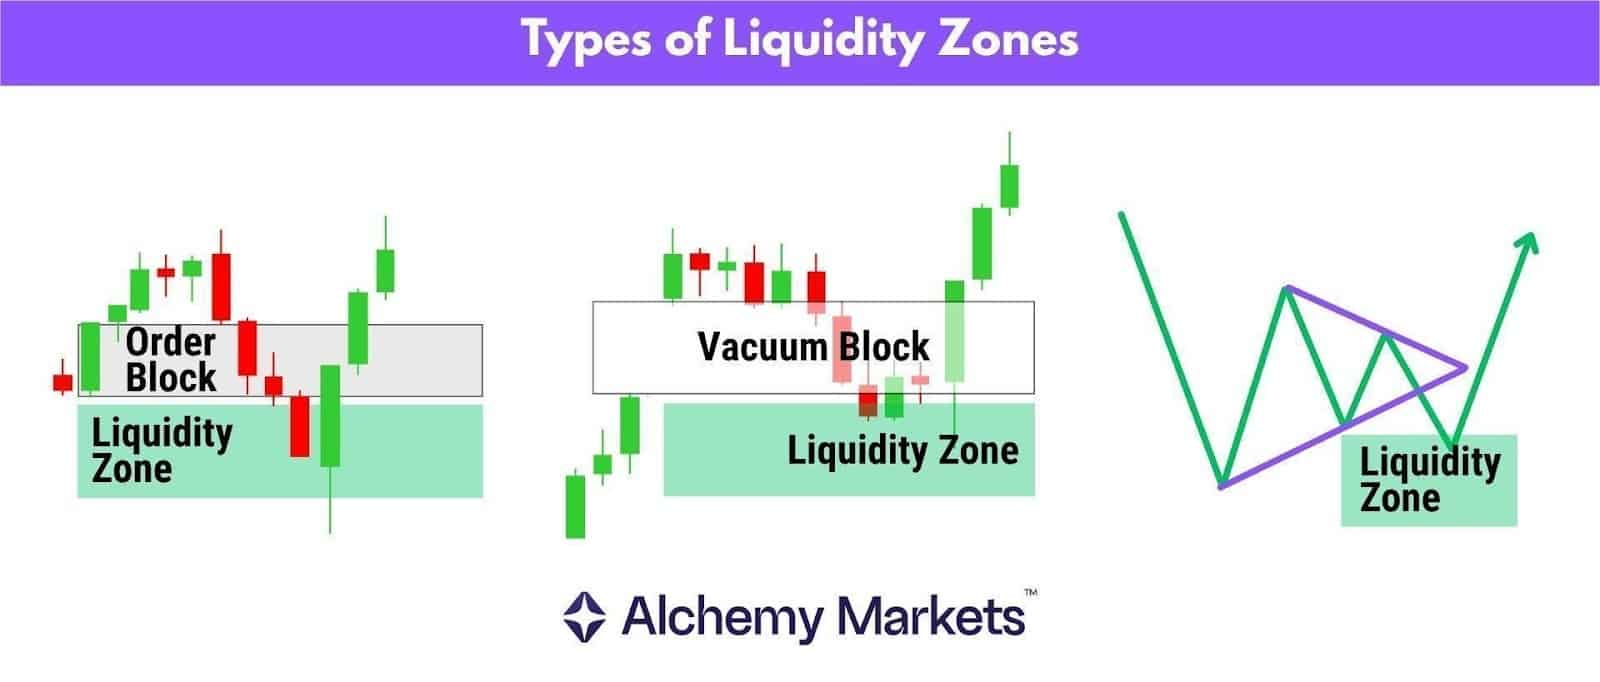
There are two types of liquidity zones:
- Buyside liquidity above resistance order blocks, where buy stops, short stop losses, and short liquidations gather.
- Sellside liquidity below support order blocks, where sell stops, long stop losses, and long liquidations accumulate.
When price taps into these areas it triggers these resting orders, opens breakout entries, and forces liquidations. This burst of volume lets institutions execute large orders and often turns a move that looks like a breakout into a liquidity sweep.
Just one pro tip before you move on…
Liquidity zones aren’t just limited to order blocks. They are often built up at levels that are obvious, widely watched, and ideal for Smart Money to exploit. These include market gaps (vacuum blocks), psychological levels such as round numbers like $100, and even popular pattern trendlines that attract breakout traders.
| Key Takeaway: Obvious market structures serve as liquidity magnets, such as order blocks, gaps, or widely watched patterns. |
How Liquidity Sweeps Works
A liquidity sweep looks like a genuine breakout or breakdown, but it quickly reverses in the opposite direction. It’s designed to trigger stops and force liquidations before Smart Money steps in.
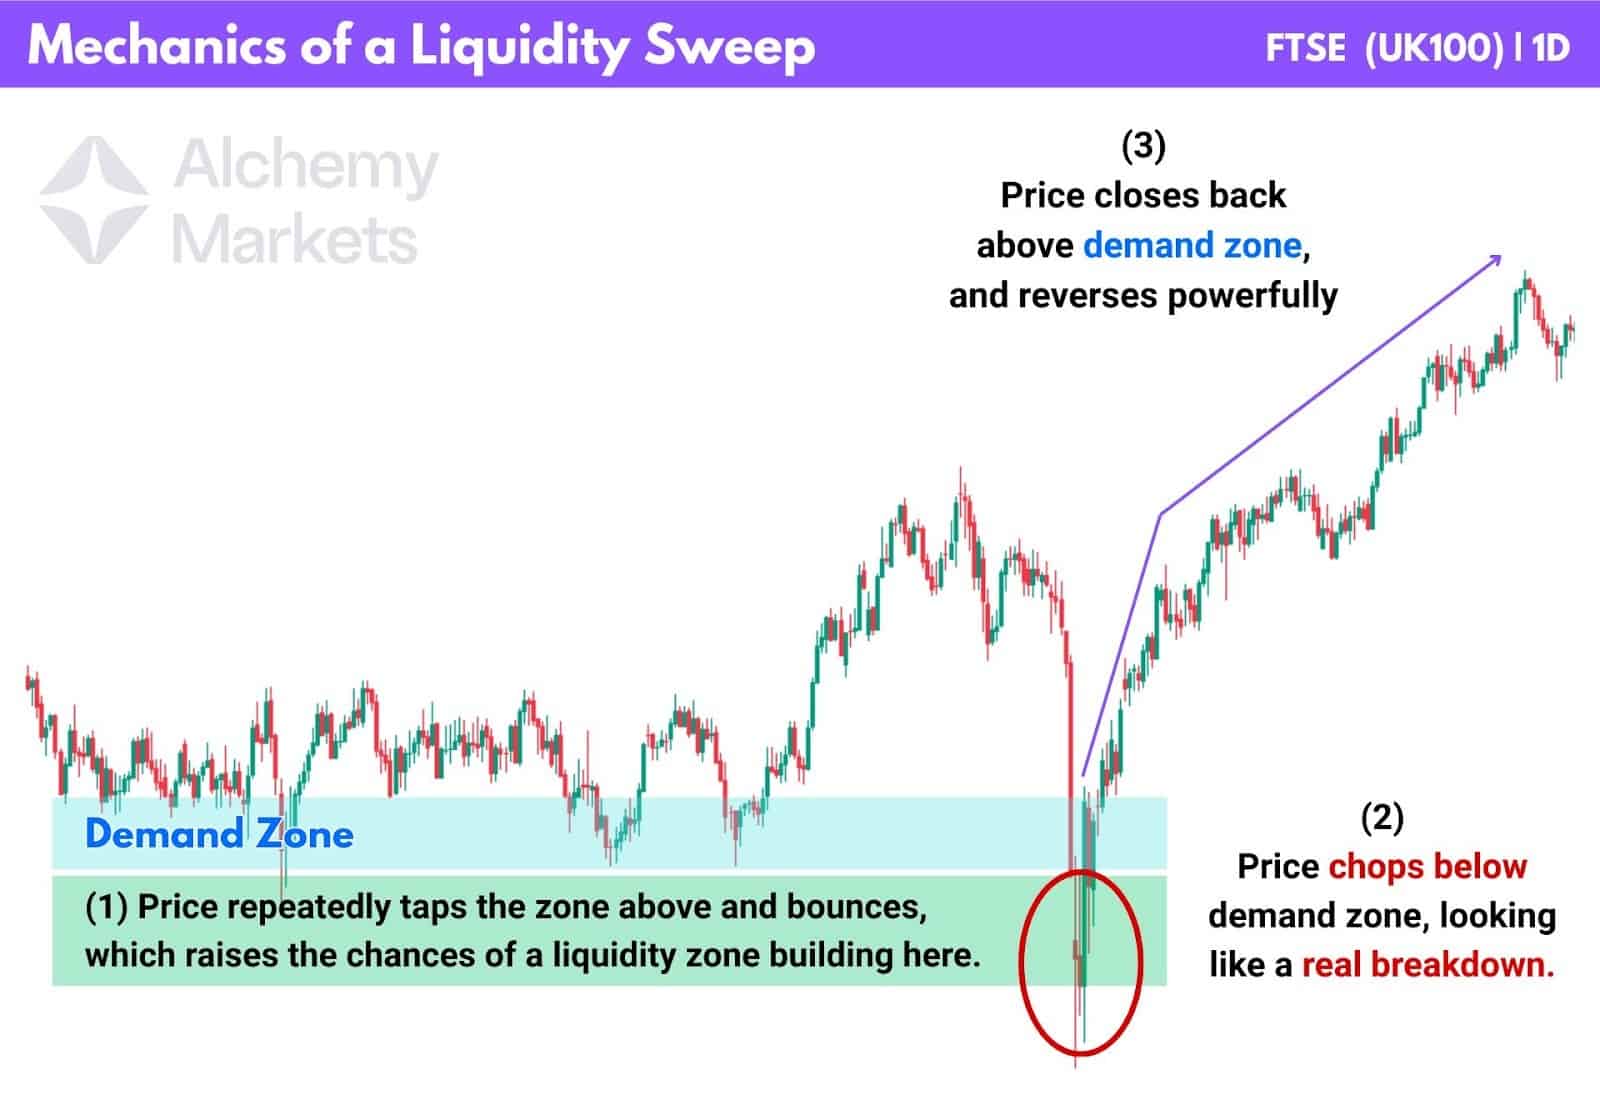
Three core ingredients define a liquidity sweep:
- A key zone. A supply or demand area where price has pivoted multiple times, signalling liquidity build‑up. This can also simply be an order block, or an area with multiple OB’s stacked.
- A false break. Price briefly closes beyond the zone, convincing traders the breakout is real. This simultaneously triggers stops and entices breakout traders to buy or sell.
- A sharp reversal. Price snaps back inside the zone as Smart Money enters using the liquidity from those stop‑outs.
By understanding these mechanics, you can identify liquidity sweeps as they form, avoid being trapped in false breakouts, or even benefit from trading these setups.
Note: If the price only wicks beyond the zone and closes back inside the same candle, it’s called a liquidity grab. Functionally, it behaves the same as a sweep.
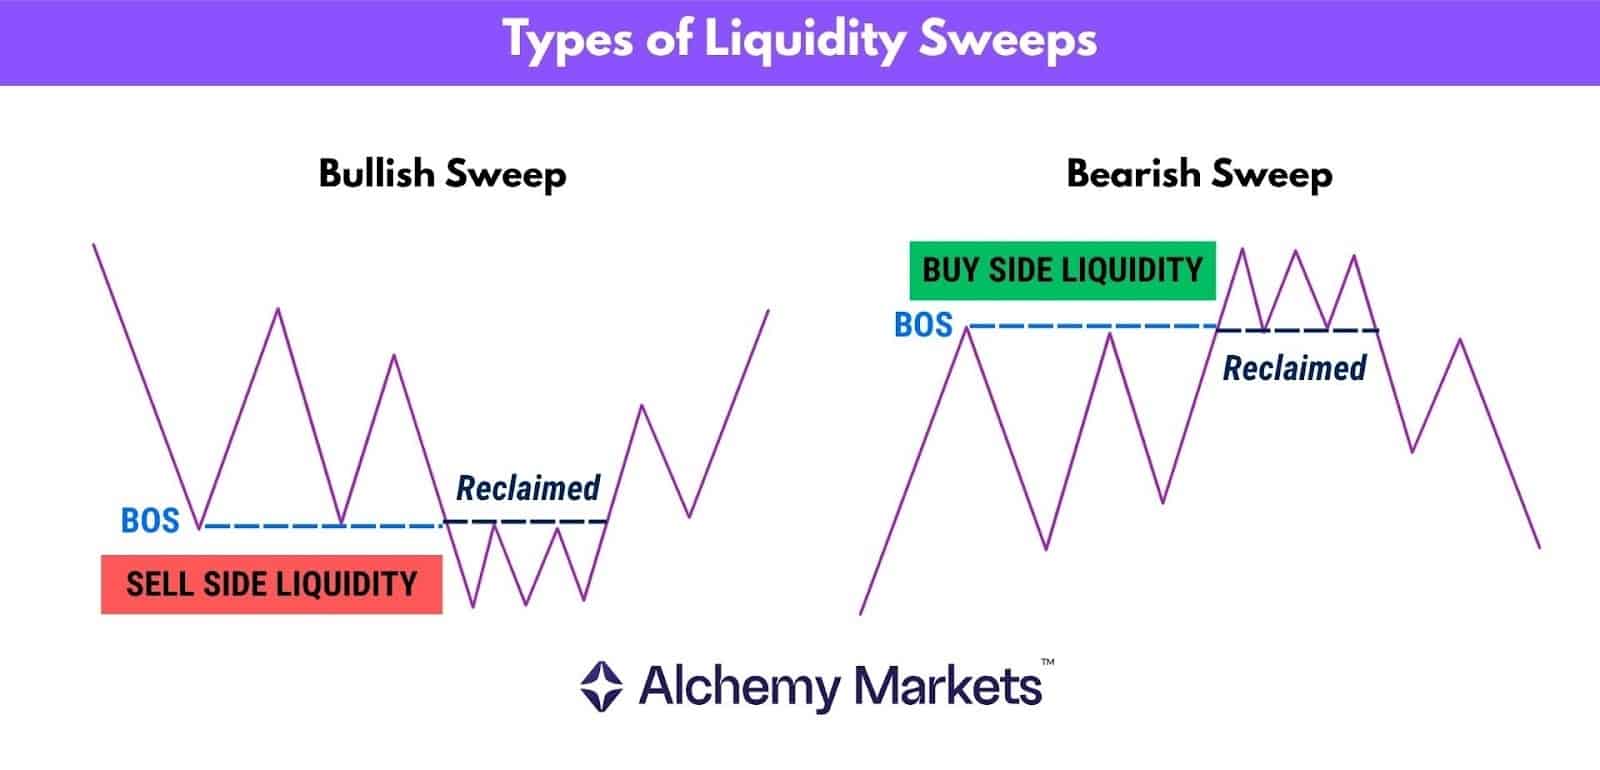
How to Identify a Liquidity Sweep?
In SMC-styled technical analysis, traders can identify a liquidity sweep when price creates a break of structure (BOS), fails to continue in that direction, and then reclaims the order block that was initially broken by the BOS. The failed continuation and quick reclaim signal that liquidity has been cleared and that Smart Money may be entering in the opposite direction.
Buyside Liquidity Sweep
A buyside liquidity sweep is a bearish setup that forces short stop losses to trigger.
Remember, stop losses on short positions are buy orders, creating a surge of buying activity that Smart Money can sell into. Once price dips back below the Break of Structure (BOS) level, the likelihood of a bearish reversal increases significantly.
Look for the following:
- Watch for a Break of Structure (BOS) to a new high.
- Mark out the order block at the previous high, or the supply zone (resistance) where multiple order blocks align.
- Wait for price to close below the lowest point of the order block or zone to confirm weakness and validate the bearish sweep.
Sellside Liquidity Sweep
A sellside liquidity sweep is a bullish setup that forces long stop losses to trigger.
In this case, stop losses on long positions are sell orders, which provide Smart Money with the liquidity needed to buy into those sells and drive prices upward.
Look for the following:
- Watch for a Break of Structure (BOS) to a new low.
- Mark out the order block at the previous low, or the demand zone (support) where multiple bullish order blocks align.
- Wait for price to close above the highest point of the order block or zone to confirm strength and validate the bullish sweep.
How to Use Liquidity Sweeps in Trading
Liquidity sweeps can be powerful clues that a market move isn’t what it seems. They can help you avoid getting trapped in fake outs, or even catch reversals once Smart Money has finished collecting liquidity.
Before diving into the strategies themselves, it helps to understand how liquidity sweeps interact with other Smart Money tools:
- Order Blocks – The key price zones where institutional orders are likely sitting.
- Fair Value Gaps (FVGs) – The imbalances price often revisits after a sweep.
Order Blocks
An Order Block (OB) is the price range of the candle that forms at the start of a pivot.

They are either:
- The full range of the lowest candle before an upswing or,
- The highest candle before a downswing.
In Smart Money trading, OBs act as support or resistance zones, and often become targets for liquidity sweeps, since stop losses and liquidations usually sit just behind them.
| Quick tip: We only consider OB’s to be valid when the fourth candle after the pivot closes beyond its range, confirming follow-through. |
Fair Value Gaps
A Fair Value Gap (FVG) is a three-candle pattern that can occur when the price moves dramatically, after tapping into a price zone. So, when a liquidity sweep happens, a FVG has a high chance of occurring.
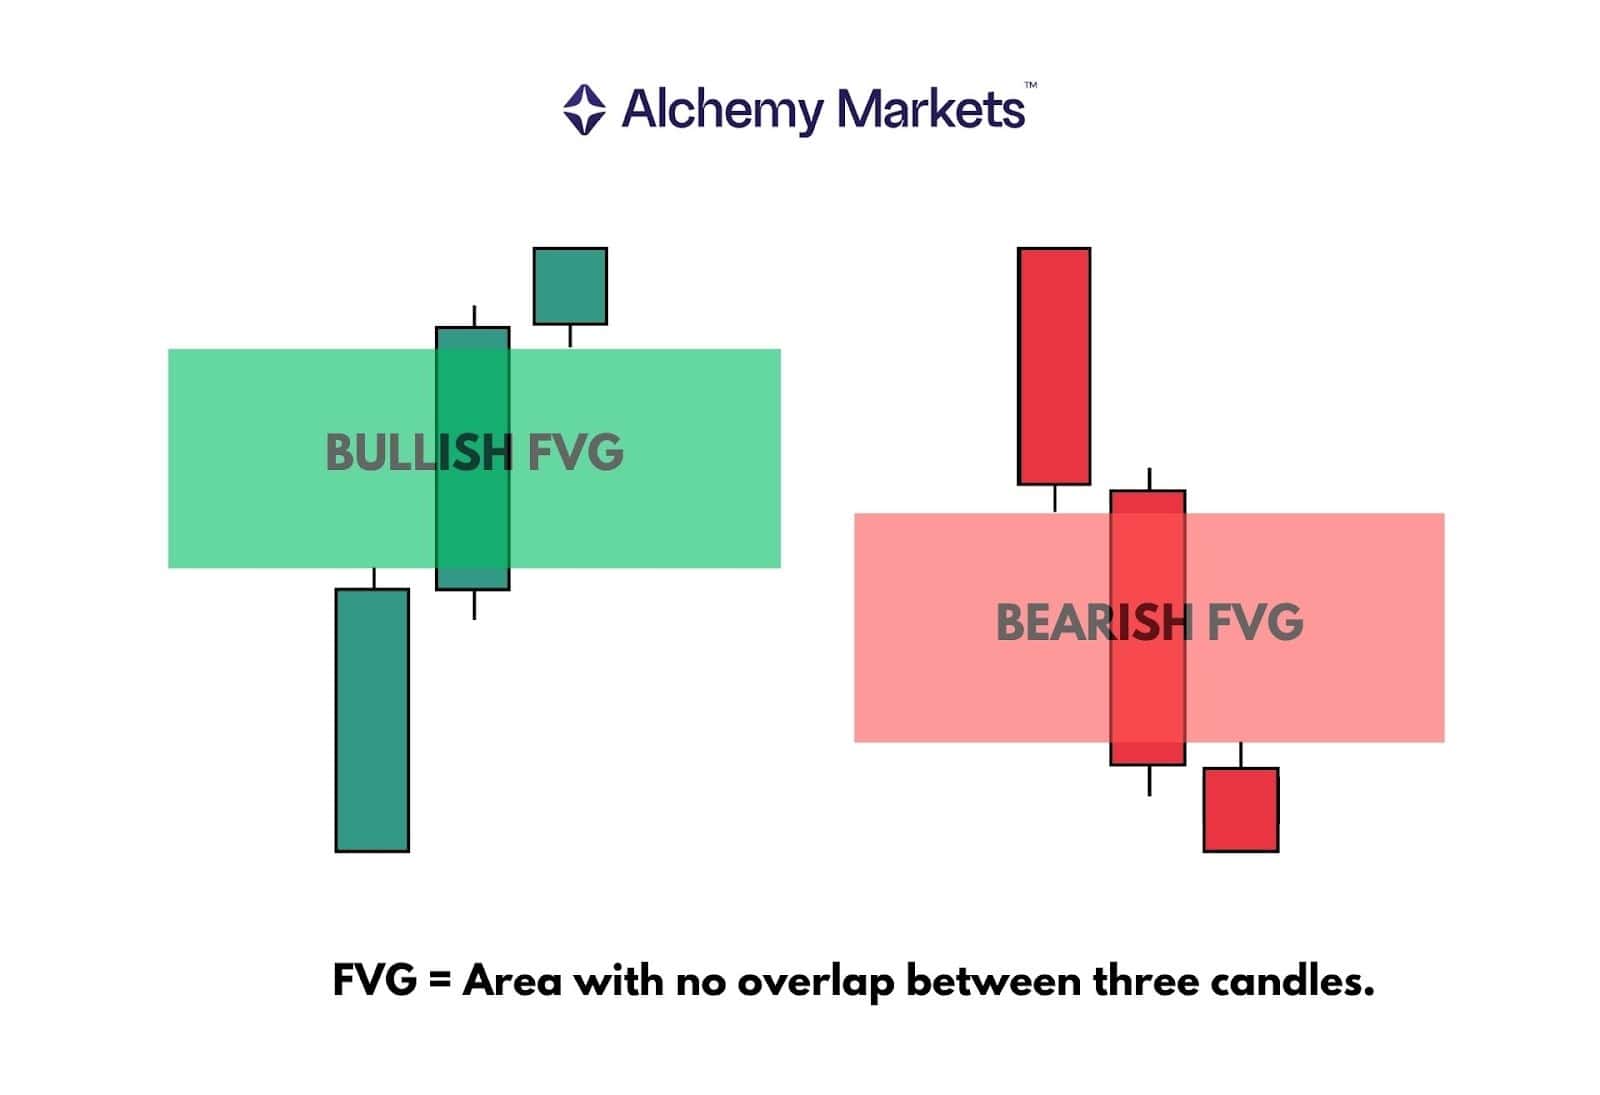
This signals strong momentum and often acts as a retracement target during liquidity sweeps, allowing SMC traders to enter once a liquidity sweep signal has been confirmed.
Now let’s see these concepts in action, where an Order Block, Fair Value Gap, and liquidity sweep align perfectly.
Liquidity Sweep Example
In the liquidity sweep chart below, UKOIL breaks above $75, briefly taps the $80 zone, then drops back below the previous high’s order block.
The daily closes above resistance made the breakout appear genuine, but once price fell back under the OB, it became the first clear sign that Smart Money had executed a liquidity sweep.

This drop also formed a Fair Value Gap (FVG) providing another clue of institutional involvement, since only large players have the liquidity to move the market decisively. This gap acts as both a confirmation and entry point for SMC traders to trade the liquidity sweep.
What to Do After a Liquidity Sweep?
Once a liquidity sweep completes, the next step is confirming that the reversal is real. Traders usually wait for price to reclaim the order block or structure level that was broken during the sweep. A shift in order flow, a clean close back inside the zone, or a Fair Value Gap forming in the reversal direction are common signs that Smart Money has finished collecting liquidity and the real move is beginning.
Liquidity Sweep Trading Strategies
Before going into the steps, it helps to understand how a liquidity sweep chart shows the relationship between liquidity zones, order blocks, and Fair Value Gaps.
SMC Liquidity Sweep Strategy
This strategy combines the key principles of Smart Money Concepts (SMC) into a cohesive liquidity sweep setup.
Core idea:
- Identified trend sets the direction for the anticipated reversal.
- Use Order Blocks (OBs) to identify liquidity zones, which often sit just behind them.
- Use Fair Value Gaps (FVGs) to confirm institutional activity for entry confidence.
- Use those FVGs as entry zones once the sweep has occurred.
Here is a step-by-step breakdown of the strategy:
- Identify the trend:
- Determine the prevailing market trend.
- If the trend is down, expect false breaks to the upside, before the downtrend resumes.
- If the trend is up, expect false breaks to the downside, then for the uptrend to resume.
- Mark out order blocks:
- Focus on OBs aligned with the trend.
- In an uptrend, track bullish OBs; in a downtrend, monitor bearish OBs.
- Wait for a sweep:
- Watch for price to sweep liquidity beyond an OB.
- Then wait for price to reclaim the OB, falling back below (for shorts) or rising back above (for longs).
- Wait for FVG confirmation:
- The formation of an FVG during the sweep signals institutional momentum entering the market.
- The formation of an FVG during the sweep signals institutional momentum entering the market.
- Enter on the FVG retrace:
- Once price retraces into the new FVG and shows a clear rejection (with a successful candle close), enter the trade.
- Once price retraces into the new FVG and shows a clear rejection (with a successful candle close), enter the trade.
- Set risk and targets:
- Stop loss placed behind the Fair Value Gap.
- Set multiple targets, placed at order blocks that act as roadblocks against your trade up until 1:2 risk-reward.
- Or keep things simple, and set your target to 1:2 risk-reward.
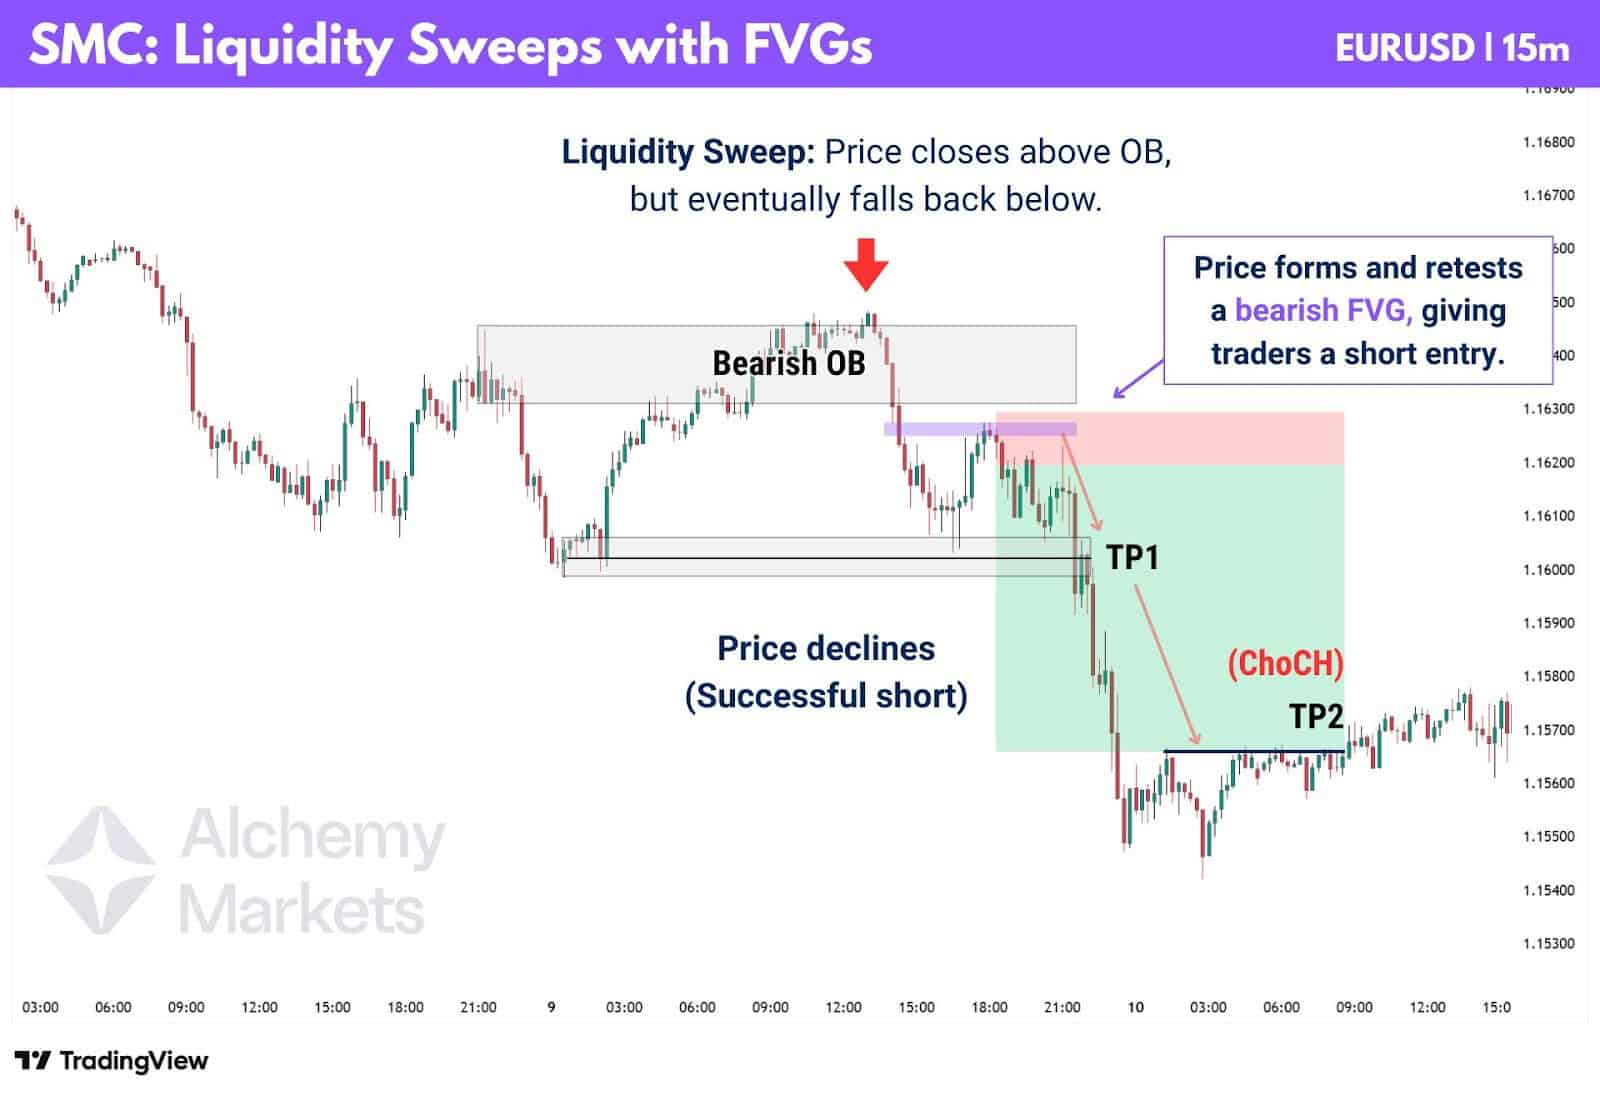
For more advanced traders, you may exit at signs of exhaustion in your trade direction. In the chart example, the trade setup is short. So once a bullish ChoCH forms, it signals potential exhaustion in the trade; giving us a cue to exit.
Failed Breaker Blocks Liquidity Sweep Setup
A breaker block (BB) is simply a flipped order block (OB). When a bullish OB fails, it becomes a bearish BB, and vice versa.
The logic here is that if a BB itself fails to hold, it signals that Smart Money used it as a fakeout to lure traders. After the trap has been set, market conditions are shifted back to respecting the original OB zone.

To trade this setup, follow these steps:
- Look for clusters of order blocks that align closely together.
- Once they break, combine them into a single BB zone.
- During a liquidity sweep, price should drive beyond this zone, invalidating the BBs.
- Then upon a retracement to this zone, if the price reacts and pivots, it effectively restores the original role of the order blocks.
- Enter a trade on a closing candle during a successful retest (closing back out the BB zone).
Targets should be previous pivot levels or order blocks, aiming for at least a 1:2 risk-to-reward. Place your stop loss just beyond the failed BB zone to stay protected against another fakeout.
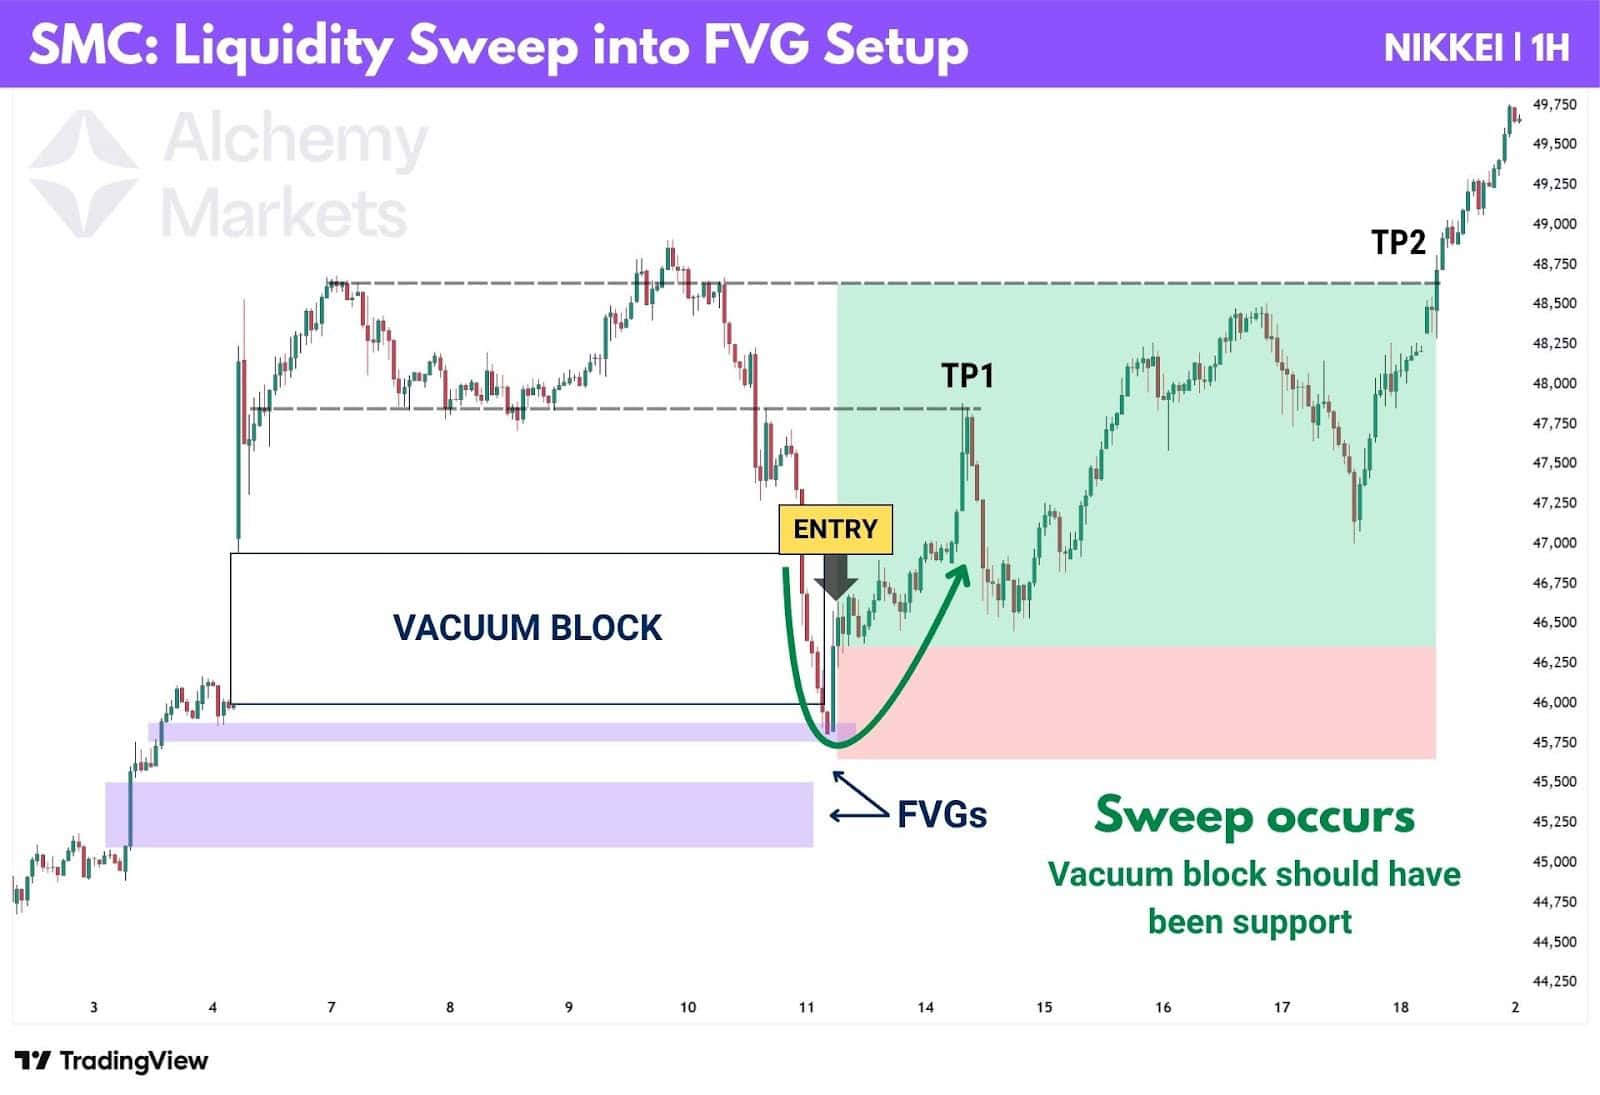
Liquidity Sweep into Fair Value Gap Setup
Another setup to watch is when price sweeps liquidity into a Fair Value Gap before reversing. In this move, price pushes beyond a key support or resistance zone, triggering stop losses, breakout orders, and liquidations. The catch is that a Fair Value Gap often sits just beyond the zone, and Smart Money targets that imbalance before reversing price.
Remember how we mentioned that liquidity zones don’t only form around order blocks?
This applies here too, and even for the setups discussed earlier. A key support or resistance zone can take many forms: an order block, a vacuum block, or even another Fair Value Gap.
In the chart below, price swept through a vacuum block that should have held as support, tapped the Fair Value Gap just below, and sharply reversed.
To trade this setup, follow these steps:
- Identify a clear zone that previously acted as support or resistance.
- Mark any nearby Fair Value Gaps that lie beyond this zone.
- Wait for price to sweep beyond the block, triggering stops and breakout entries.
- Watch for price to tag the Fair Value Gap and show a strong pivot candle.
- Enter on a confirmation candle, placing your stop loss behind the FVG and beyond the order block.
Targets can be placed at prior swing highs or lows, or the next opposing order block, aiming for at least a 1:2 risk-to-reward ratio. This approach captures the reversal move while keeping your trade protected from another potential sweep.
Is There a Liquidity Sweep Indicator?
No, there’s no built-in and native Liquidity Sweep indicator on TradingView or MetaTrader. SMC traders rely on manual chart work, using volume spikes, order blocks (OBs), and fair value gap (FVG) confluence to identify potential sweep zones.
Non-SMC traders can use simple tools like trendlines, chart patterns, and supply–demand zones to map where stop losses and liquidation levels tend to cluster.
There are community-made indicators that highlight OBs, FVGs, or liquidity zones, but their accuracy depends entirely on how they’re coded, so they should be used with caution.
Liquidity Sweep Trading Advantages
Recognising and trading liquidity sweeps offers several benefits:
| Advantages of Trading Liquidity Sweeps | |
|---|---|
| Aligns with Smart Money intent | Since sweeps occur in areas where retail stop orders cluster, understanding them allows traders to align with the actions of institutional players. |
| Flexible across timeframes | Liquidity sweeps can be traded on lower timeframes for scalping or higher timeframes for swing trading. |
| Supports volume analysis | Combining sweeps with tools like market profile, footprint charts and delta indicators helps confirm whether a sweep is genuine. |
| Enhances risk management | Sweeps highlight where stop‑loss clusters sit, enabling traders to refine entry and stop placement for better reward‑to‑risk ratios. |
Liquidity Sweep Trading Disadvantages
Like any trading approach, liquidity sweeps have downsides:
| Disadvantages of Trading Liquidity Sweeps | |
|---|---|
| Difficult for beginners | Distinguishing a genuine sweep from a trend continuation (liquidity run) requires experience, especially during high volatility. |
| Subjective interpretation | Sweeps can be hard to spot in markets with low volume or unstable liquidity, leading to more false signals. |
| Risk of trading against the trend | Since sweeps often begin with a break against the prevailing trend, entering prematurely adds risk if the reversal fails to materialise. |
| Not a stand‑alone strategy | Liquidity sweeps alone don’t guarantee success; they must be combined with other concepts like order blocks, FVGs or market structure to form a robust trading plan. |
Liquidity Sweep vs Liquidity Grab
The difference between a liquidity sweep and a liquidity grab lies in their duration and depth. A liquidity sweep is essentially an extended version of a liquidity grab meaning the grab is pushing deeper into support and resistance levels and lasting longer in both time and price movement.
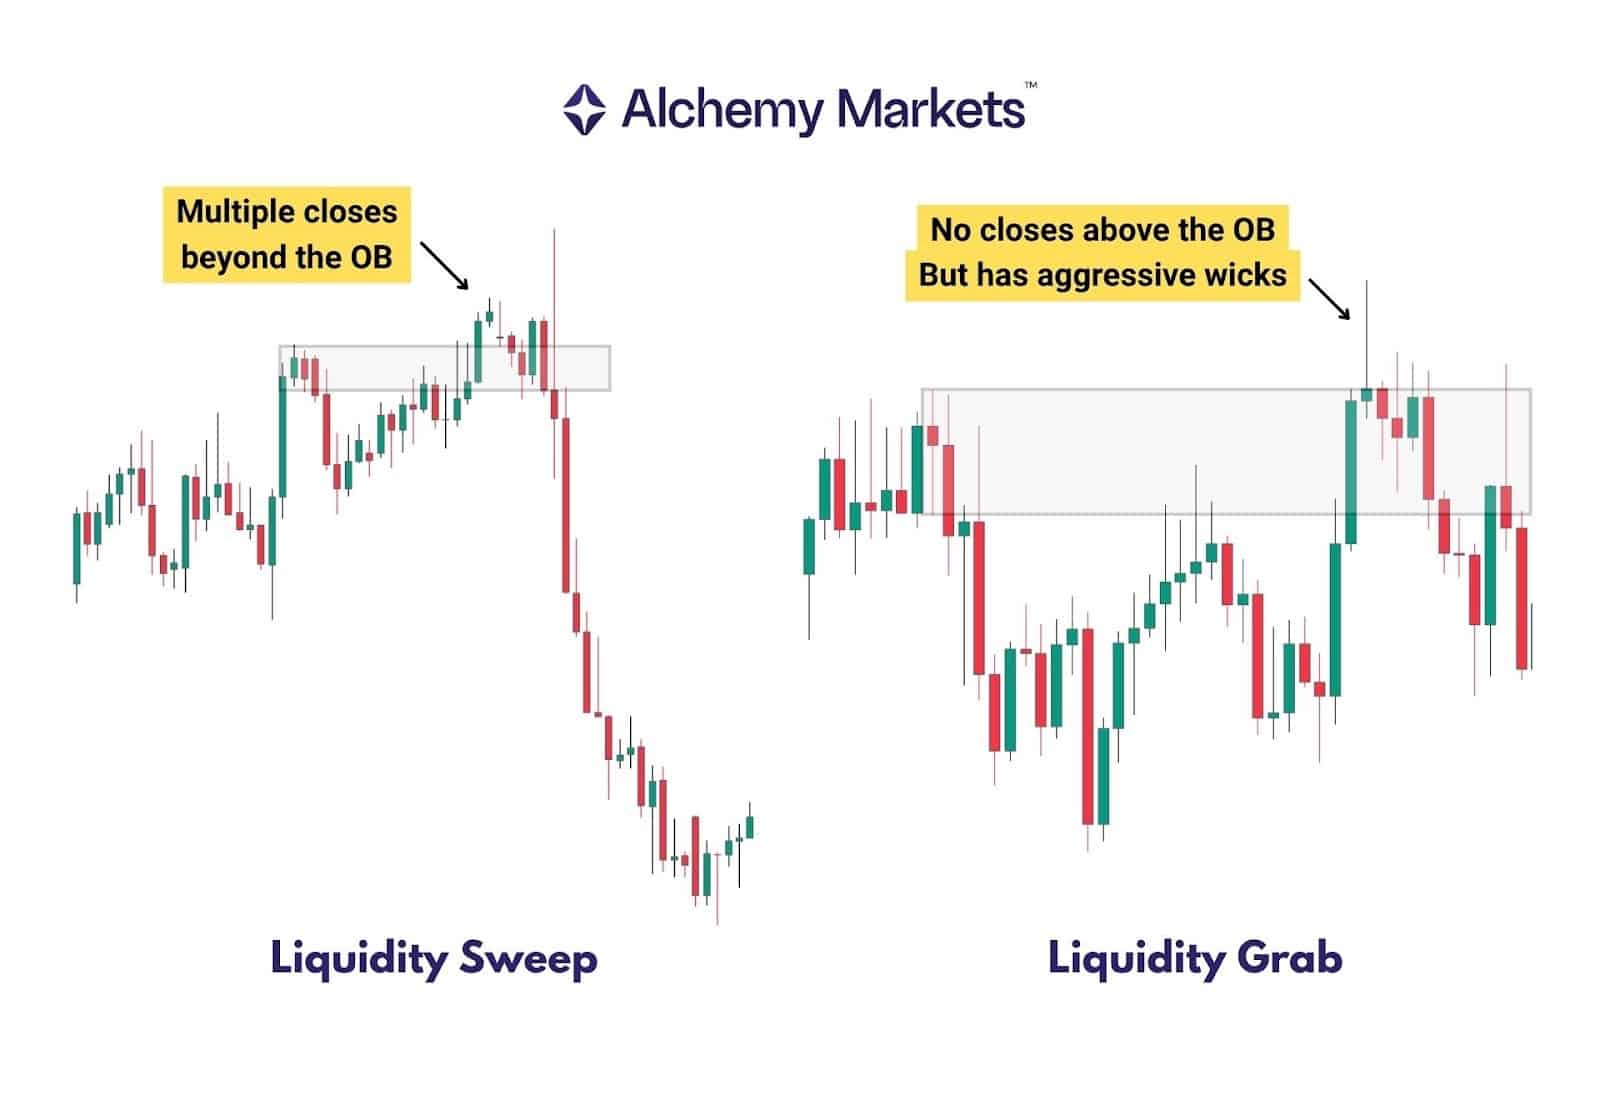
Liquidity Sweeps are broader pushes beyond an order block or a support/resistance zone. They often produce multiple candle closes beyond the range, making the move appear like a convincing breakout.
Liquidity Grabs, on the other hand, are quick stabs into a key zone that reverse within a single candle or leave behind a long wick. They often resemble hammer or shooting star formations appearing at critical support or resistance levels, signalling a rapid rejection rather than a sustained breakout.
Liquidity Sweep vs Break of Structure
A Break of Structure (BOS) signals a genuine shift in market direction, showing that price has moved beyond a previous high or low and continues to build momentum in that direction.
A liquidity sweep plays on that belief, and thus, it mimics a real breakout. A BOS may appear at first, but when price fails to hold above or below the broken level, it’s the first clue that a liquidity sweep is in play.
The easiest way to tell them apart is by follow-through:
- After a BOS, price holds beyond the broken level and forms a new structure.
- After a liquidity sweep, price quickly reclaims the level, invalidating the breakout.
Retail vs Smart Money Mindset
Retail traders typically chase breakouts. They react to price action emotionally, overlooking underlying market dynamics.
When price clears a resistance, they buy; when it breaks support, they sell. Smart Money does the opposite; they create the breakout to trigger retail stops and then take the other side of those trades.
- Retail mindset: Reactive and emotional.
- Smart Money mindset: Strategic and anticipatory.
Understanding liquidity sweeps shifts your perspective from chasing moves to recognising where the crowd will be trapped. Instead of following price, you start following institutional logic: seeing why and how liquidity moves markets.
FAQ
Can you trade solely using Liquidity Sweeps?
Yes, but not efficiently. Liquidity sweeps work best when paired with structure tools such as Order Blocks and Fair Value Gaps. These help confirm whether the sweep is likely to reverse or continue.
What is the best timeframe to trade Liquidity Sweeps?
Sweeps occur across all timeframes, but higher timeframes (1H–4H) tend to filter noise and highlight stronger institutional setups. Lower timeframes (1M–15M) are better for refining entries once the sweep is identified.
What is a liquidity sweep in forex trading?
In forex, liquidity sweeps occur when price briefly breaks a support or resistance level to trigger stop losses or pending orders, giving Smart Money access to liquidity before reversing.
Is there a technical indicator for liquidity sweep?
No single indicator identifies them perfectly. However, traders often use swing-high/swing-low indicators, volume spikes, and OB/FVG confluence to spot potential sweep areas.
What is a liquidity sweep in the smart money concept?
It’s a deliberate manipulation by institutions to engineer liquidity by clearing retail stops and positioning themselves for the true move.
Where does Smart Money find liquidity for their order books?
Mainly around obvious highs, lows, and psychological levels, where clusters of stop losses sit. These act as liquidity pools that institutions can use to fill large orders efficiently.
Is liquidity sweep bullish?
It can be. A sell-side sweep below a support level often precedes a bullish reversal, while a buy-side sweep above resistance typically signals a bearish reversal. Context and not direction determine the bias.


