


Written by:

Reviewed by:

Bearish
- March 24, 2026
- 18 min read
Rounding Top Pattern Trading Guide
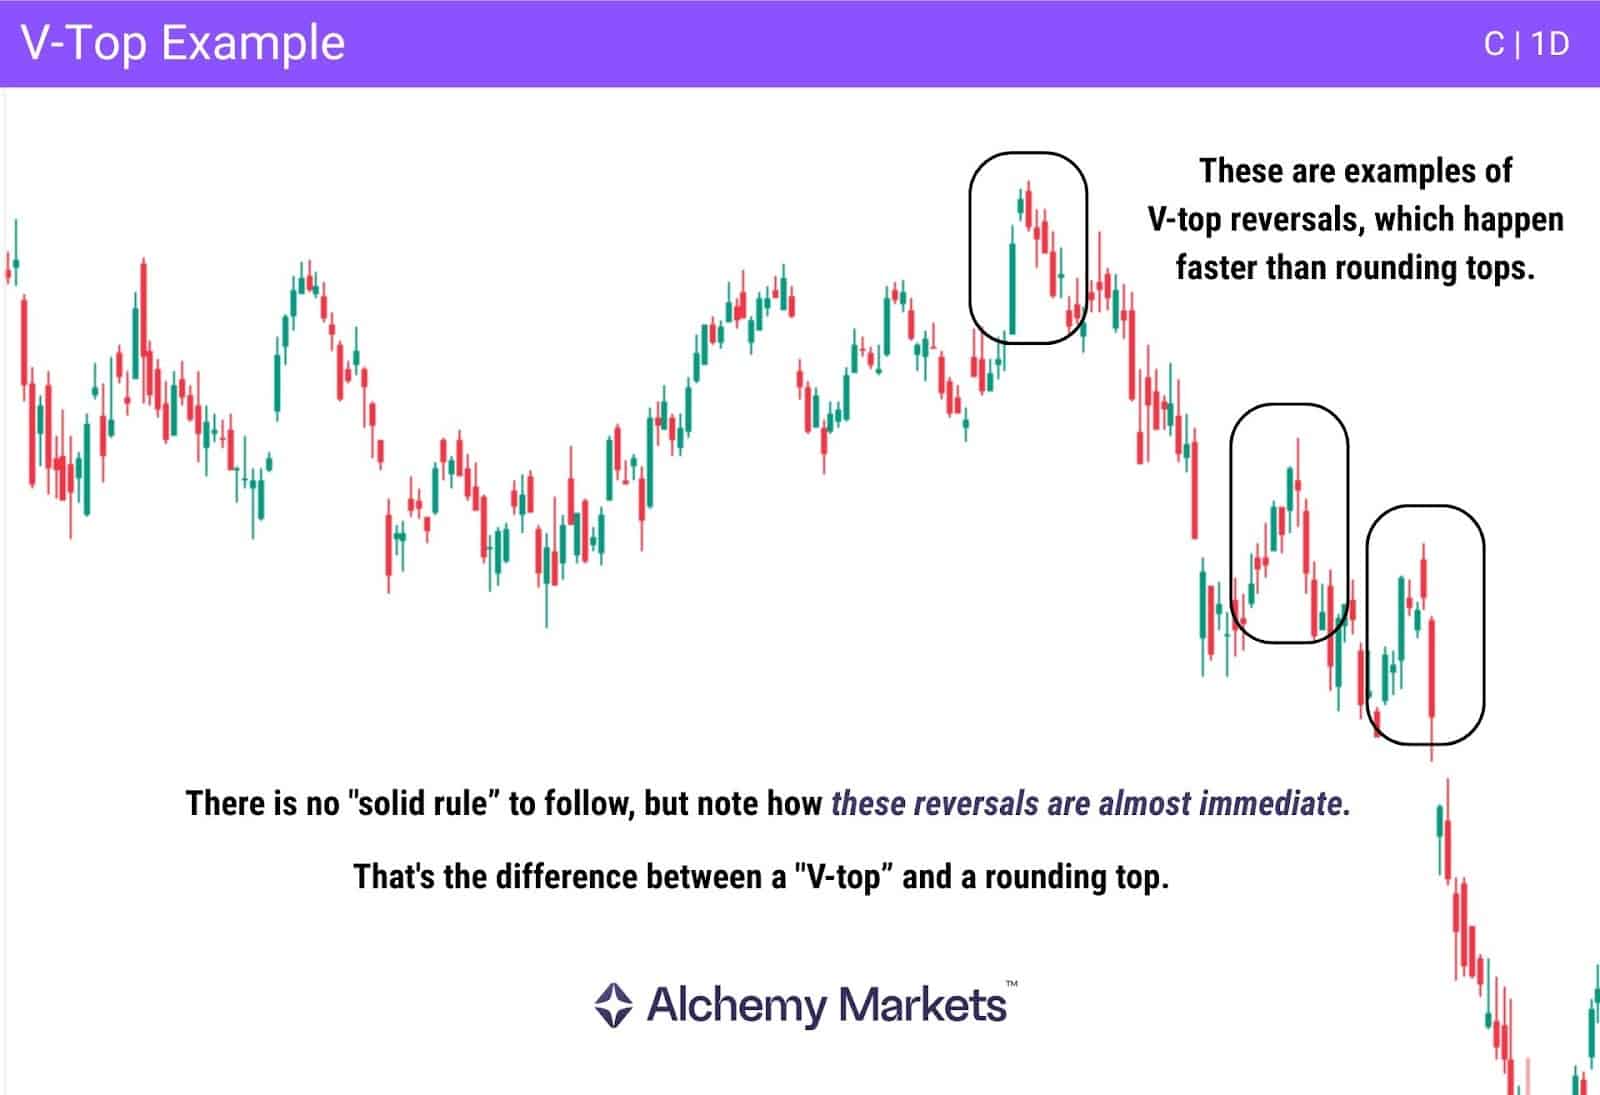
A rounding top pattern, sometimes referred to as an “inverted saucer”, is a bearish reversal pattern that signals there has been a gradual shift in the market sentiment from bullish to bearish.
Unlike the sharper “V-top” pattern, this pattern represents a slow exhaustion of buyers and a steady takeover by sellers.
What is a Rounding Top Pattern?
The rounded top is a technical chart pattern used by traders to identify when a market could be seeing the end of an uptrend.
The price of the asset or market moves upward, reaches a plateau where buying and selling pressure equals out, and then begins a slow descent.
This is a bearish signal that a lot of traders use to decide when to short, or take note that an uptrend is coming to an end.
Key characteristics:
- Occurs after a sustained bullish phase or uptrend.
- The price action forms a convex shape as the upward momentum starts to fade.
- Ideally, the volume should follow the price action. Higher on the move up, tapering off near or at the peak, and increasing again as the market begins to drop.
What is a Rounding Top Pattern Breakout?
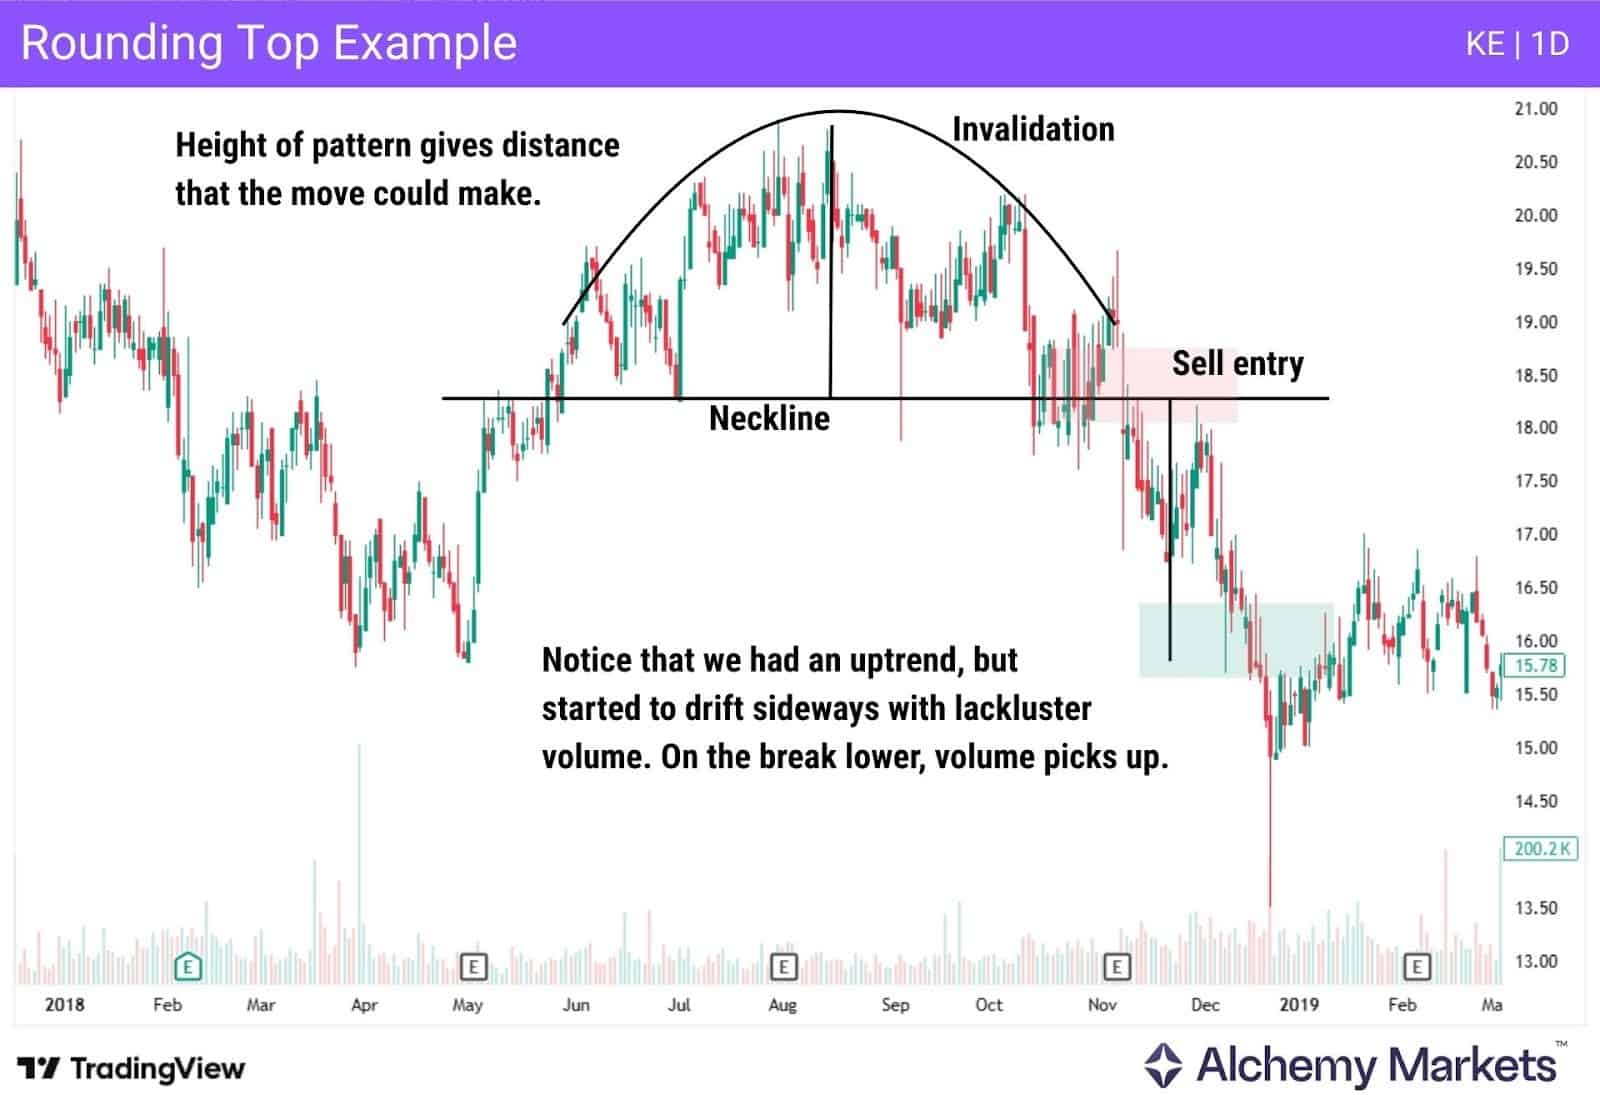
A rounding top pattern breakout, as seen in the chart earlier, is a price decline equal to the height of the pattern.
For this to happen, the rounding top reversal pattern should break a critical prior low (neckline), which looks like the starting point of the formation.
What is a Double Rounding Top pattern?
The “Double Rounding Top” pattern takes longer to form than most other exhaustion patterns, as there is an initial move higher and exhaustion, a dip, and then a repeat of the first exhaustion phase.
In short, it is a pattern where two consecutive rounding tops form side by side. It is a variation of the classic Double Top pattern, with “double top” acting as an umbrella term that includes both sharp (inverted-V) and rounded exhaustion structures. Both are examples of a market that cannot continue higher.
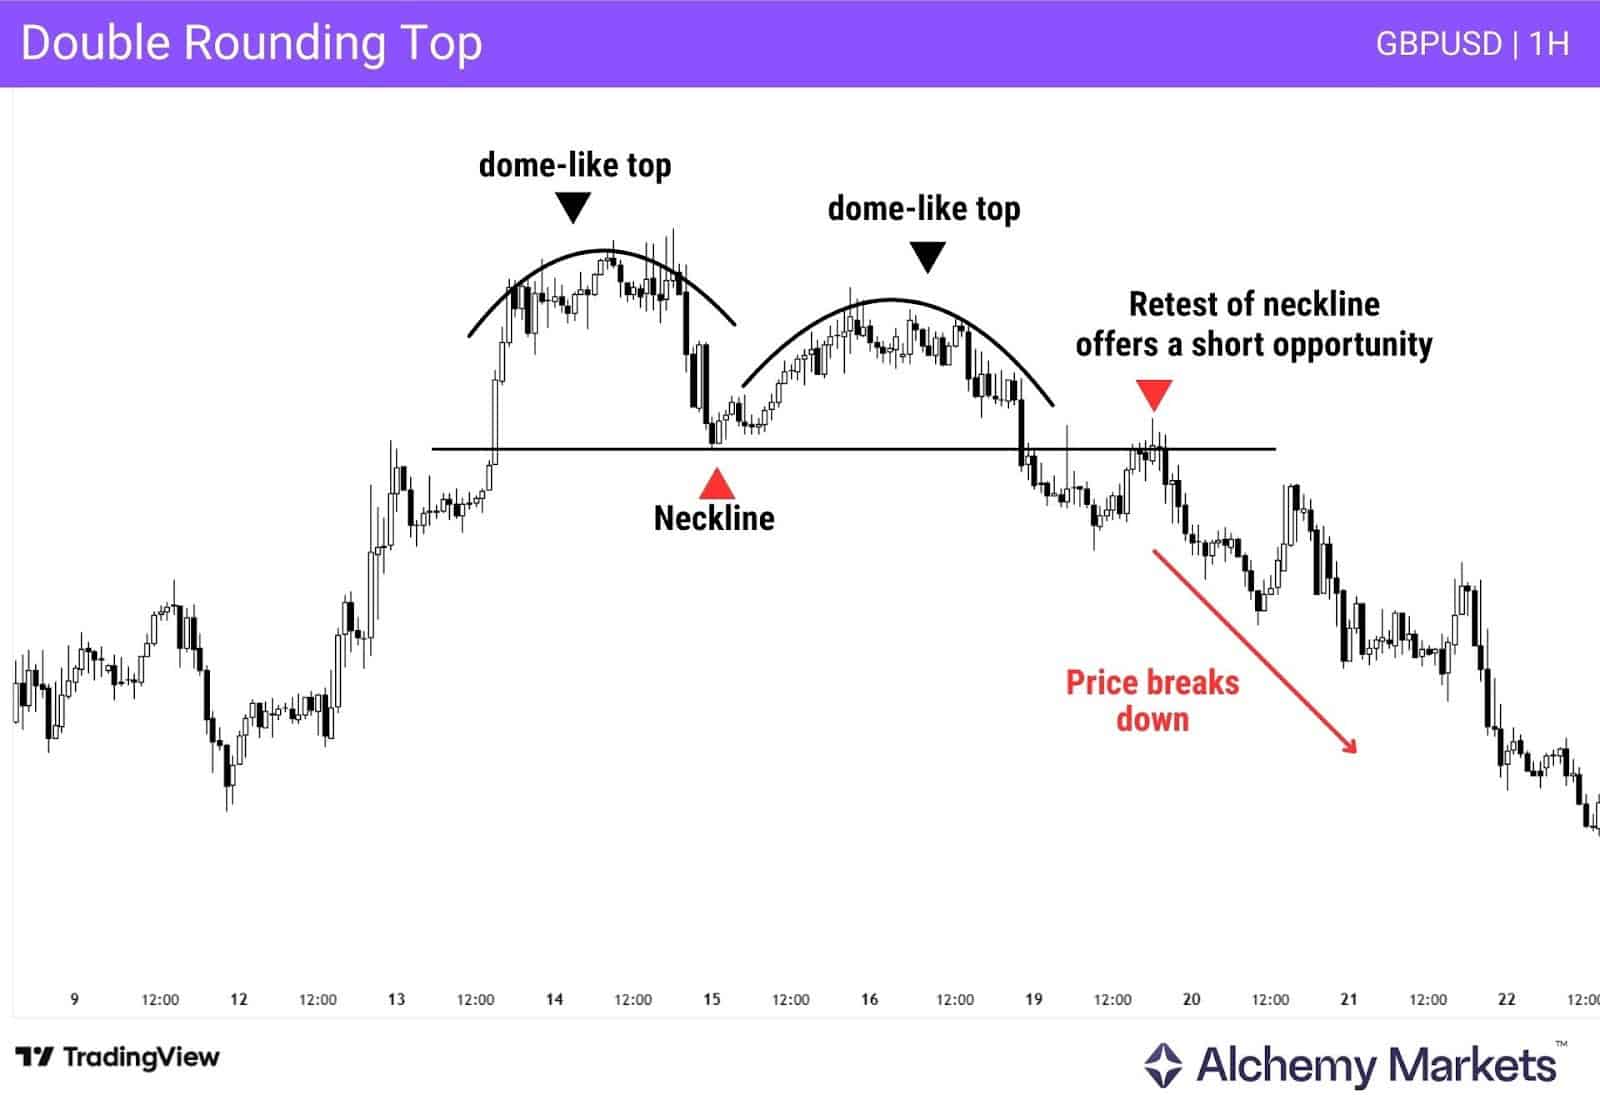
To identify a Double Rounding Top, look for a clear move higher leading into a convex exhaustion phase. Candle ranges should contract and the price trajectory should flatten near the highs, creating a smooth, dome-like structure.
Price should then gently roll over, forming a swing low. At this stage, price typically attempts to move higher again into roughly the same area, where it stalls once more. This creates the chance for a second rounding top to form, and completes the structure.
This price behaviour can often be recognised early, and traders are able to draw a horizontal neckline at the swing low formed after the first rounding top. This level gives a clear reference level for where bearish momentum is likely to truly kick in, once that level breaks.
How to Identify the Rounding Top Pattern?
Identifying a rounding top pattern can be tricky at times, but using some of the most common elements for identification can help.
The most important aspect is that an asset has risen aggressively, but then begins to gradually drift / consolidate sideways, quieting down the overall momentum of the market.
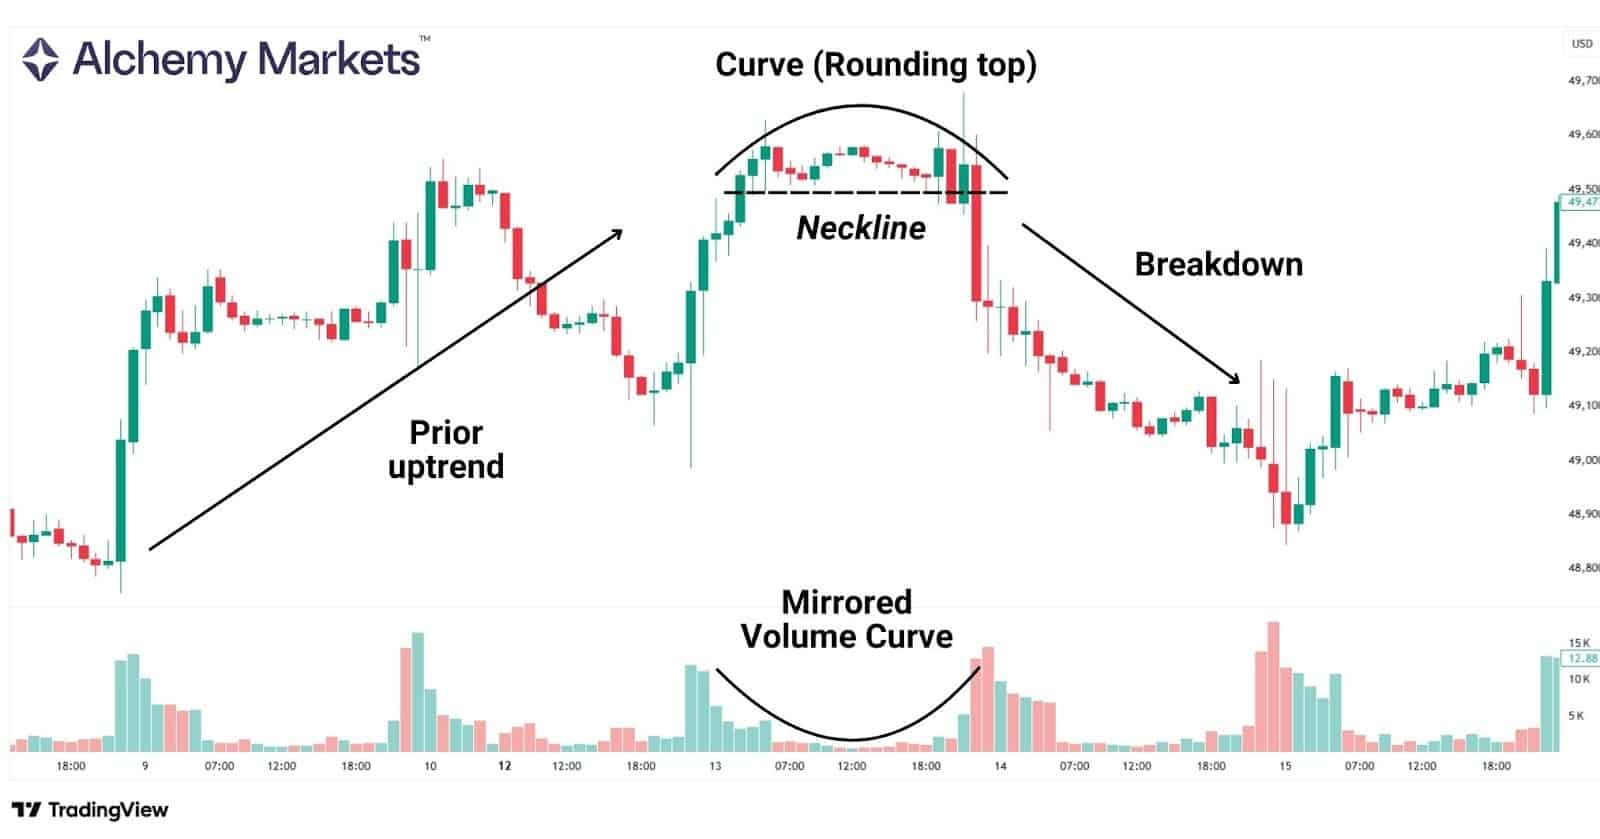
The volume of the market can play a big part as well, as the sideways, or plateau area should see less volume traded than the previous uptrend. This results in a mirrored volume curve, where the price and volume are curved in opposite directions.
Next, there should be a drifting lower, accompanied by increased volume, showing more aggressive selling. Traders can use a “neckline” to show where the pattern started, or even a support level to determine when the market is truly ready to roll over.
Key Characteristics of Rounding Top
The rounding top pattern is defined by a few keys points as listed below:
- Prior uptrend: The pattern forms after a significant move higher.
- Curve: The pattern creates a sequence of higher highs that will gradually flatten out at the top area, forming a dome shape.
- Volume profile: Volumes will often mirror the price curve, tapering off at the top of the dome shape, forming a convex “U” shape.
- Neckline: The rounding top pattern has a support level, or “neckline” at the base of the dome.
How Does Rounding Top Pattern Chart Work?
The rounding top technical pattern is used as a visual representation of exhaustion in a financial market. The market will “plateau” at the top of a curve, as price action begins to wane a bit. The number of buyers and sellers pushing the market becomes nearly equal, leading to a period of consolidation.
Once the market sentiment starts to shift, as price fails to make new highs, bearish traders begin to assert their dominance of the market. The market starts to shift from “buy the dip” to “sell the rally. Once the market breaks below the established neckline on a closed candle, the rounding top is considered valid. Typically, traders will use the height of the dome as a measure of how far the market falls below the neckline for a potential target. For example, if the dome is $5 “tall”, then the market is expected to fall at least $5 on a close below that neckline.
What Does a Rounding Top Tell You
The rounding top tells you that the market could be getting ready to “roll over”, and start falling. The bullish momentum is failing, and supply has finally begun to outweigh the demand for the asset. The buyers are simply starting to lose the battle, which is confirmed when price breaks below the support level formed by the pattern. The support level is found at the lowest point of the dome formed.
Importance of Rounding Top Patterns
The rounding top pattern is an important technical analysis tool that many traders use because it has a roughly 60% chance of success according to some studies.
The rounding top pattern takes longer to form than a “V-top”, and this means that the market has had a longer amount of time to determine the overall trajectory of momentum. This can often kick off a bearish trend, and even offers a stop loss guide, as the market turning around and breaking back above the pattern obviously negates it.
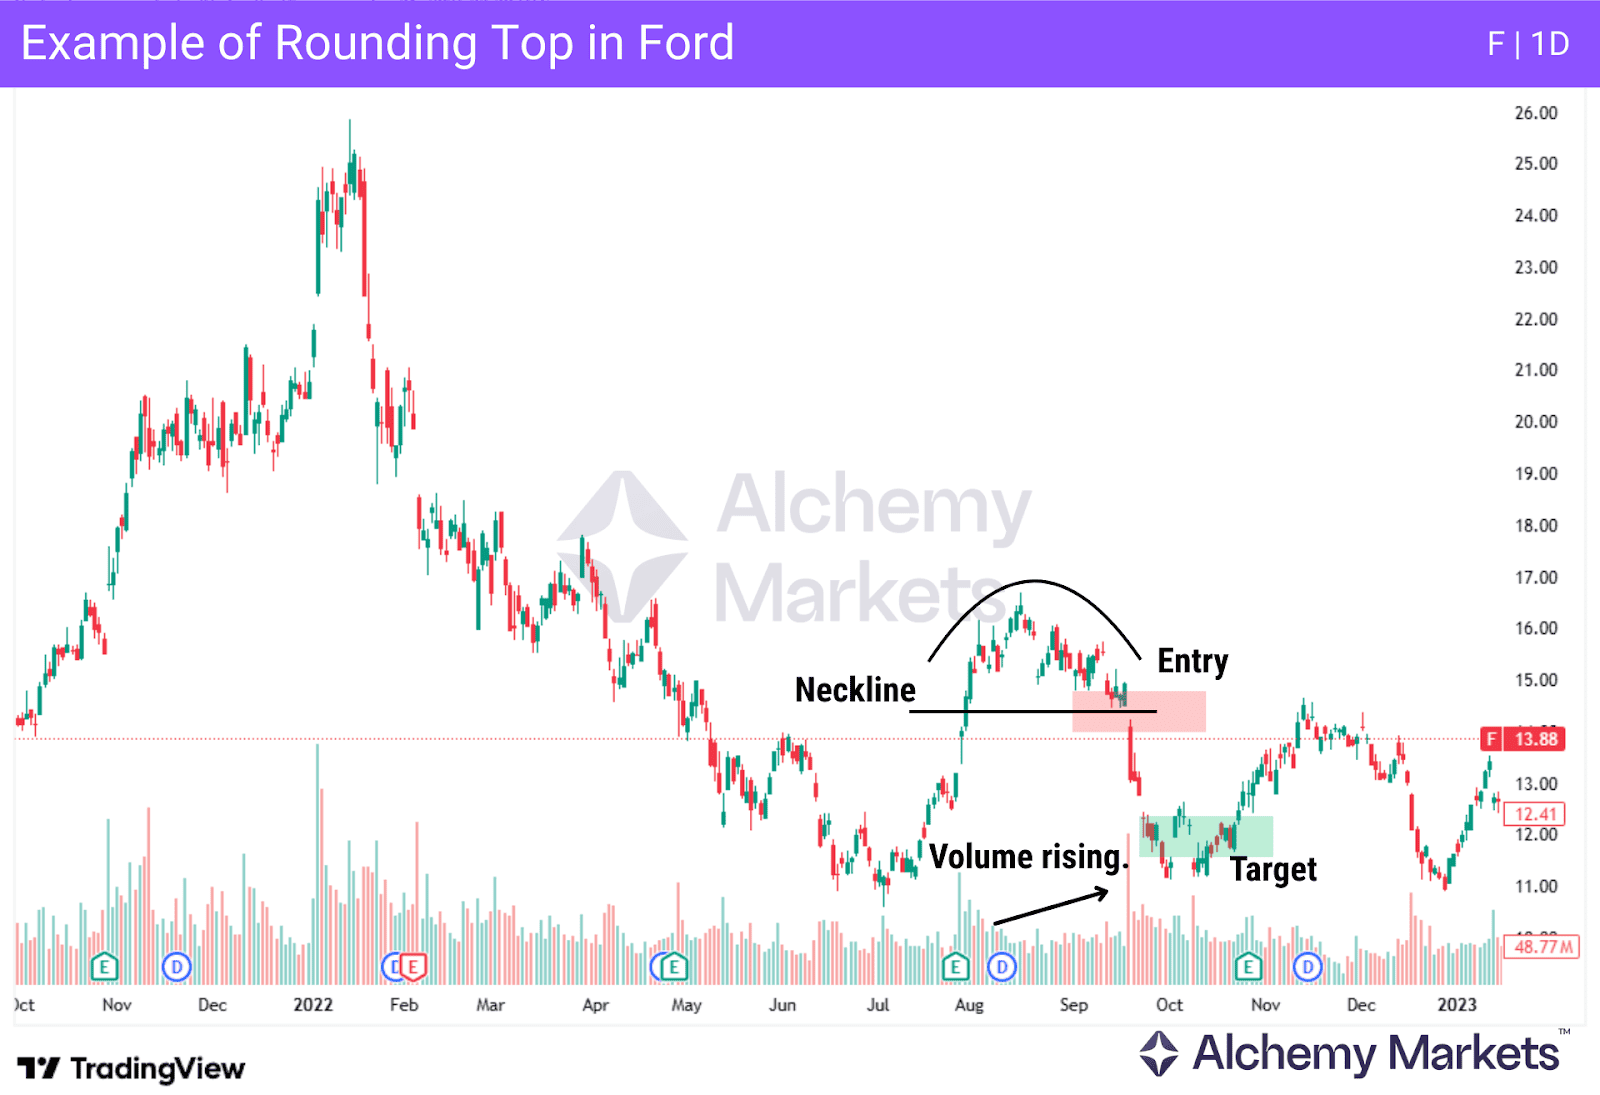
Rounding Top Pattern Example
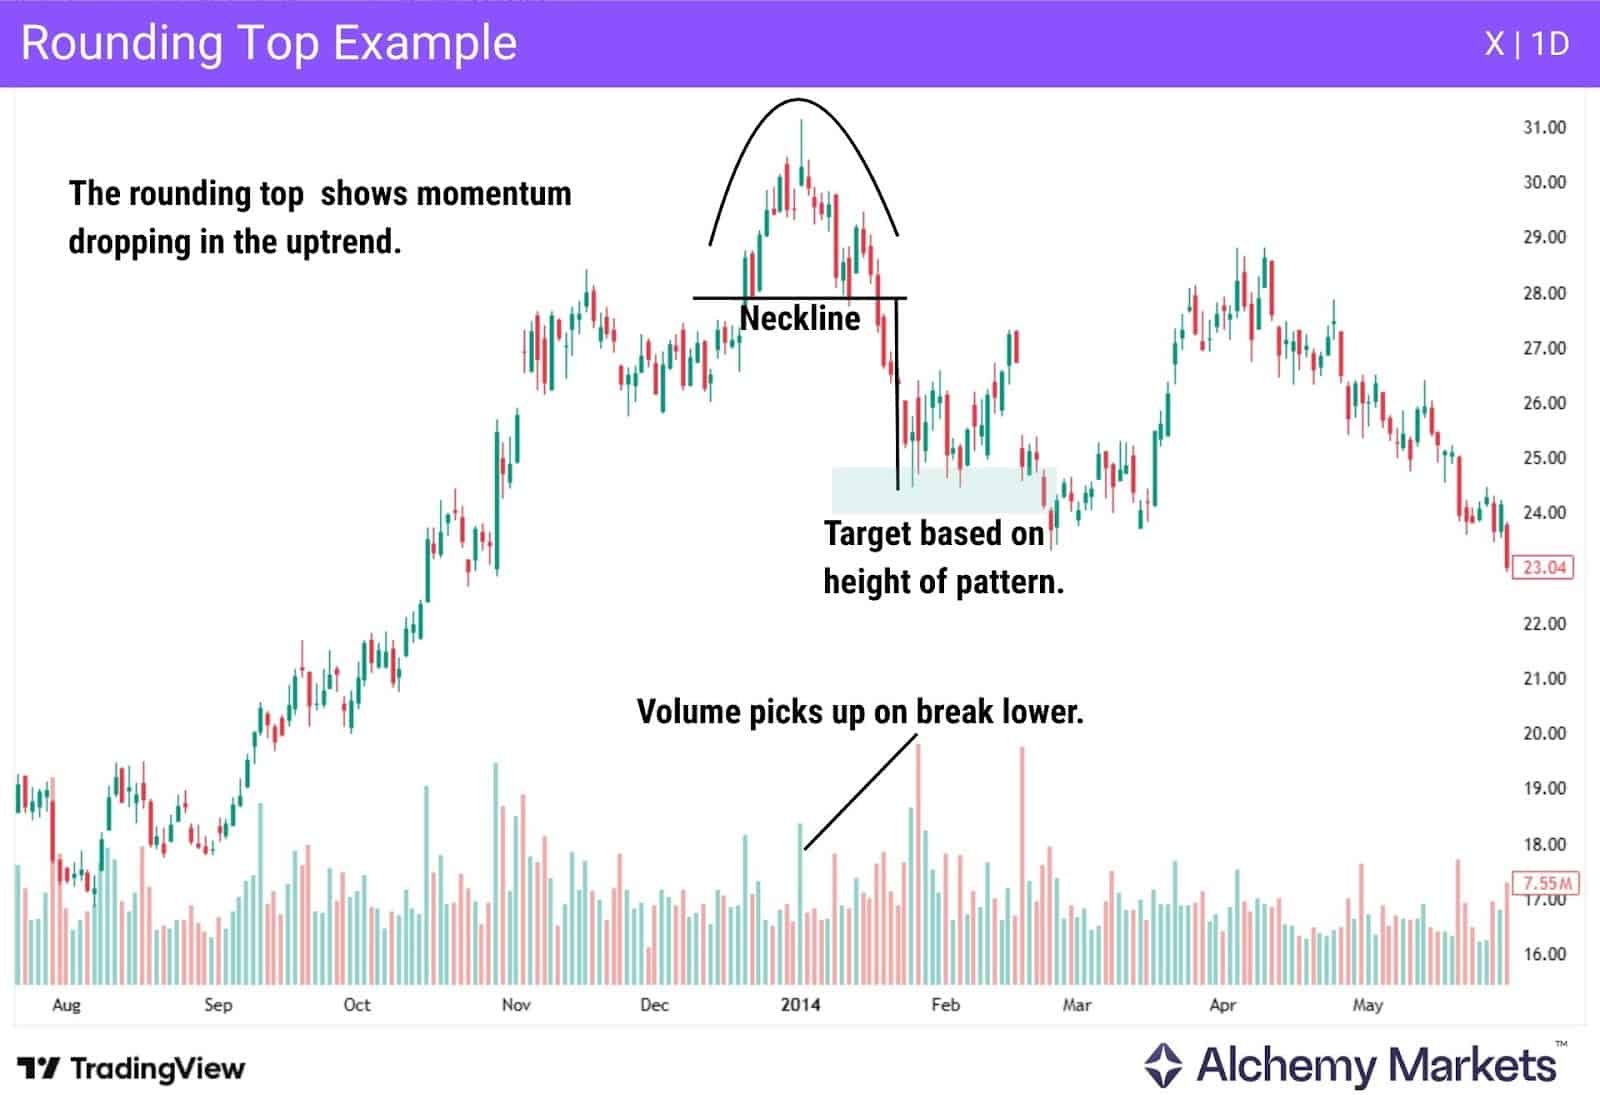
The chart above shows a typical rounding top pattern. The slightly decreasing volume at the top suggests that traders are starting to lose faith in US Steel near the $30 level. As the market rolled over, the volume started to pick up and broke lower.
The “neckline” is the support level from where the dome shape formed, an area where the market breaking below signals the breakout point has been violated, and the sellers start to take control. The rising volume on the move lower confirms the idea that the market is likely to fall.
Rounding Top Pattern Trading Strategies
There are several ways to trade rounding top reversal patterns, and they generally fall into two camps:
- Trading the breakout from the neckline of a rounding top formation,
- Or anticipating the peak of a rounding top and shorting from there.
In this section, we’ll go over several ways one could trade a rounding top pattern on a CFD trading platform.
Rounding Top Pattern with Trend Reversal Strategies
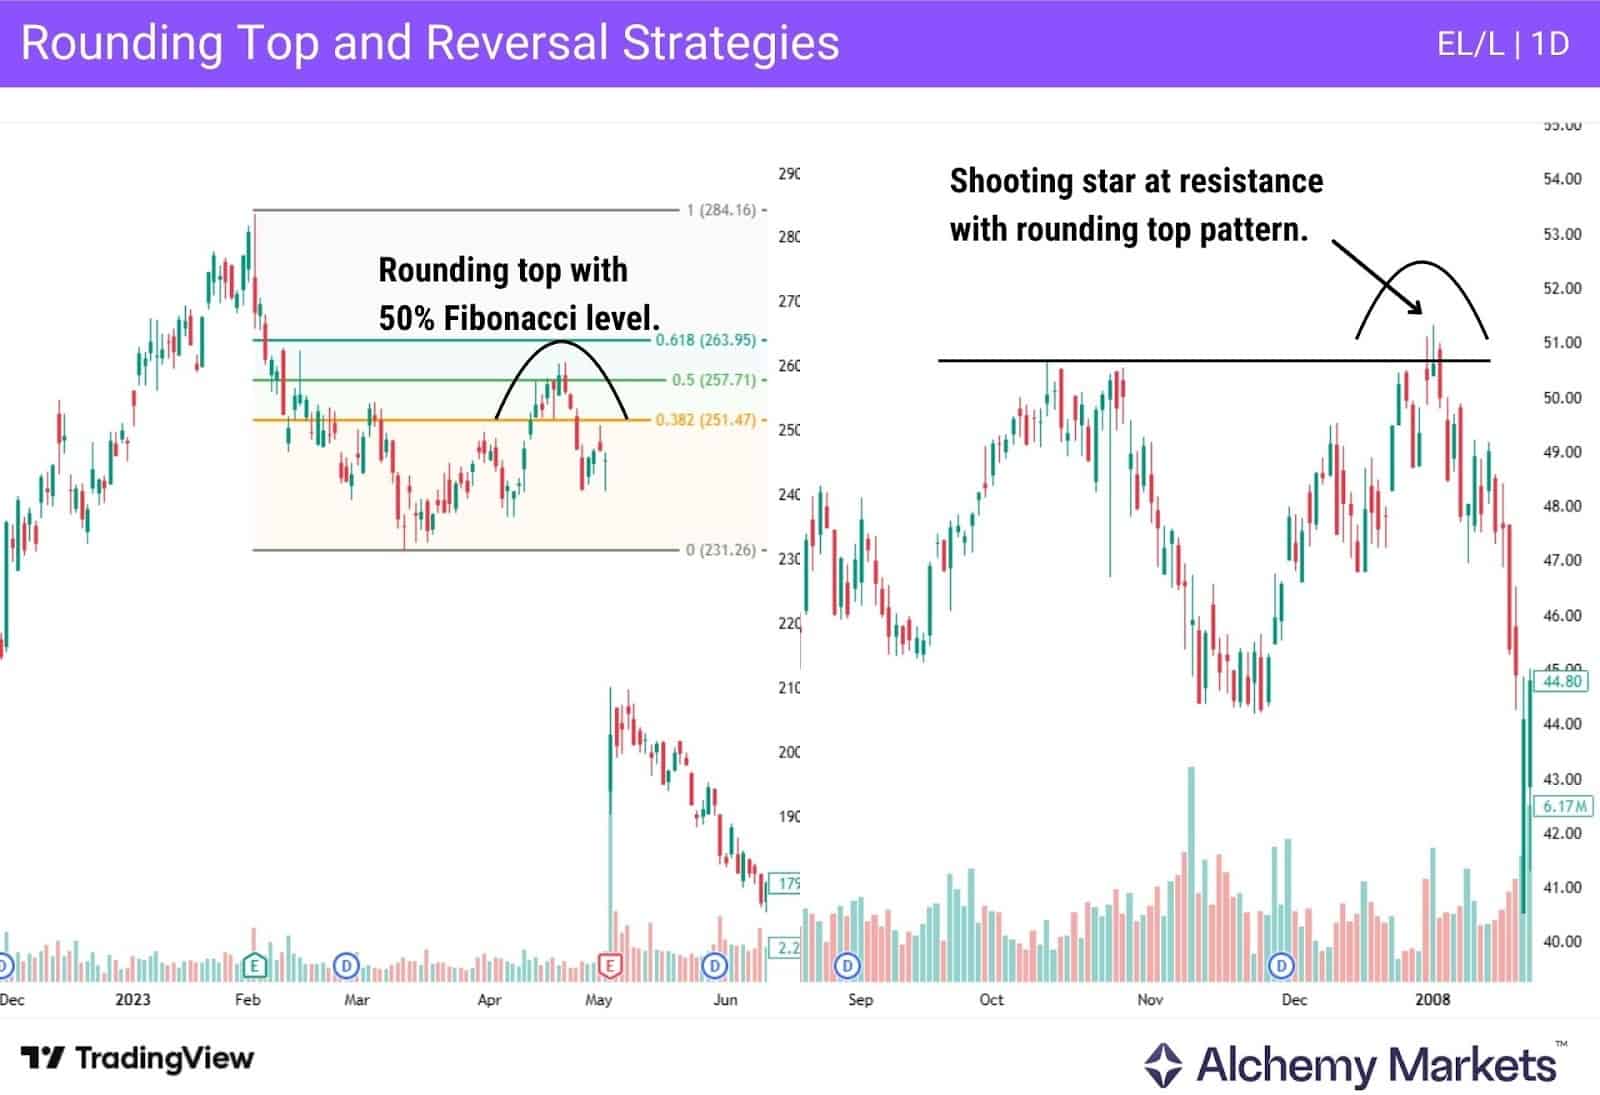
Using trend reversal strategies such as trading them with shooting star candles, overbought conditions on your favorite indicator, or even Fibonacci levels is a popular way to trade. Fibonacci is a mathematical calculation that is found in many natural patterns.
Some traders believe there is some reasoning to using them for support and resistance levels. The fact that someone might use rounding tops and Fibonacci means that a lot of traders could be thinking the same thing. This ensures that as many people as possible are all looking to get short of the market.
Rounding Top Pattern with RSI
RSI, or Relative Strength Index is one of the most popular indicators out there. It gives simple exhaustion signals of “overbought” or “oversold”.
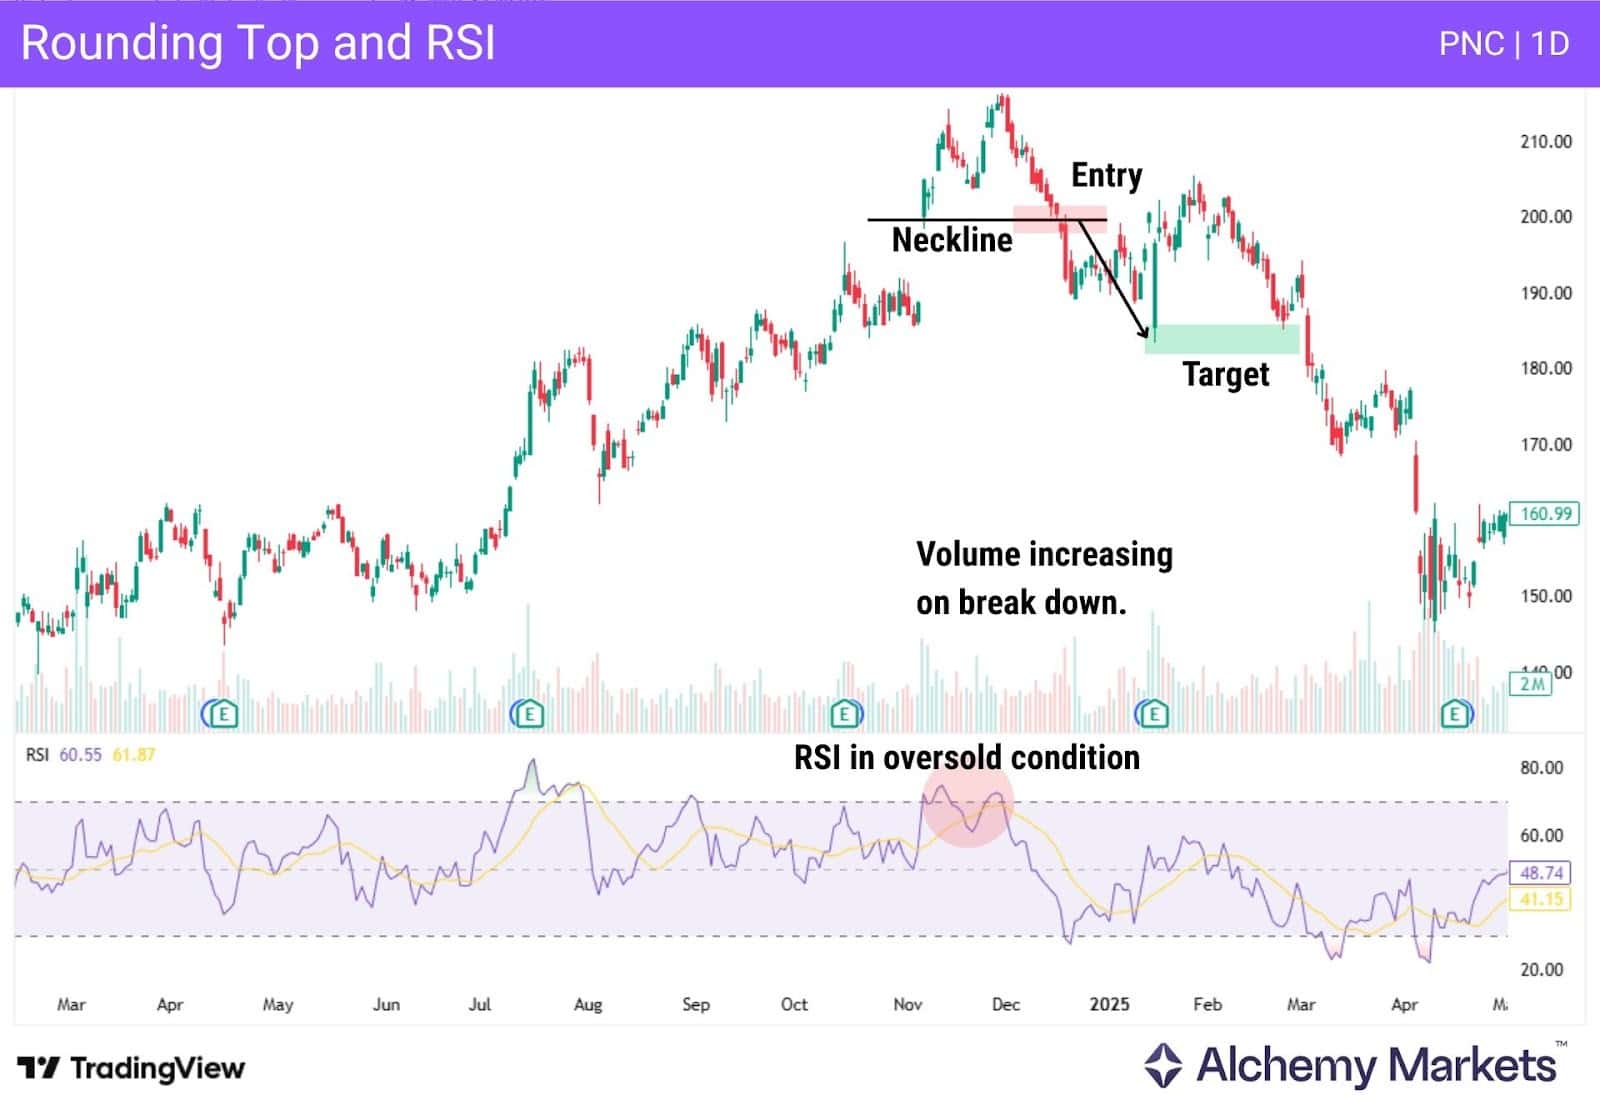
When trading rounding tops, we want to pay attention to “overbought” signals (RSI >70), which suggests that price has moved upwards too far and too fast; putting it at higher risk for a decline in bullish momentum.
The chart above showed that PNC Bank was getting overbought, as the market was heading into the rounding top. Once the market broke below the neckline, the volume picked up. This is one way many traders confirm the breakout point in the set up.
Rounding Top Pattern with Moving Averages
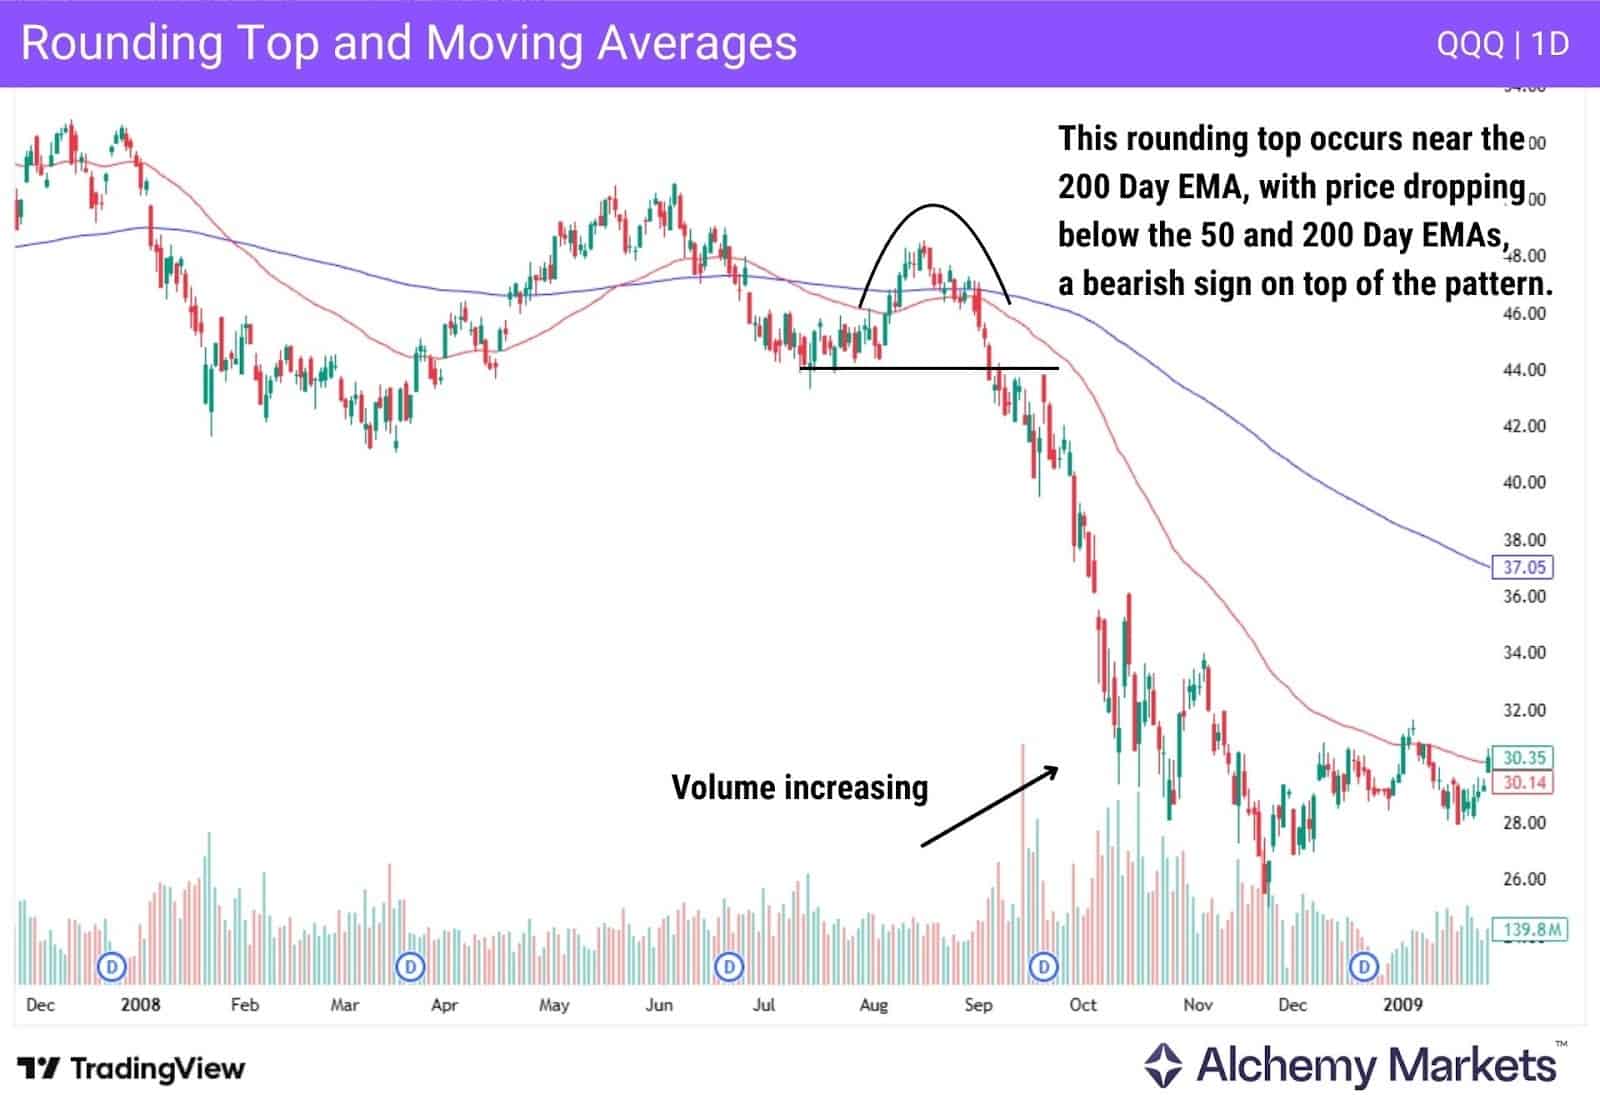
Moving averages are calculated as the average price of a set period of candlesticks. This can show the trend, and can also be used as dynamic support and resistance.
The moving average is a curving line that can give the overall “picture” of the trend. When it curves up, things are bullish, when it curves down, not so much. A curve down (Bearish) is what we’re looking for on a moving average when trading rounded tops.
In practice, many traders will only sell if the price is below an EMA, or buy if it is above it. In the example above, since the breakout is comfortably below our moving averages, a trade can be considered.
Rounding Top Pattern with VWAP
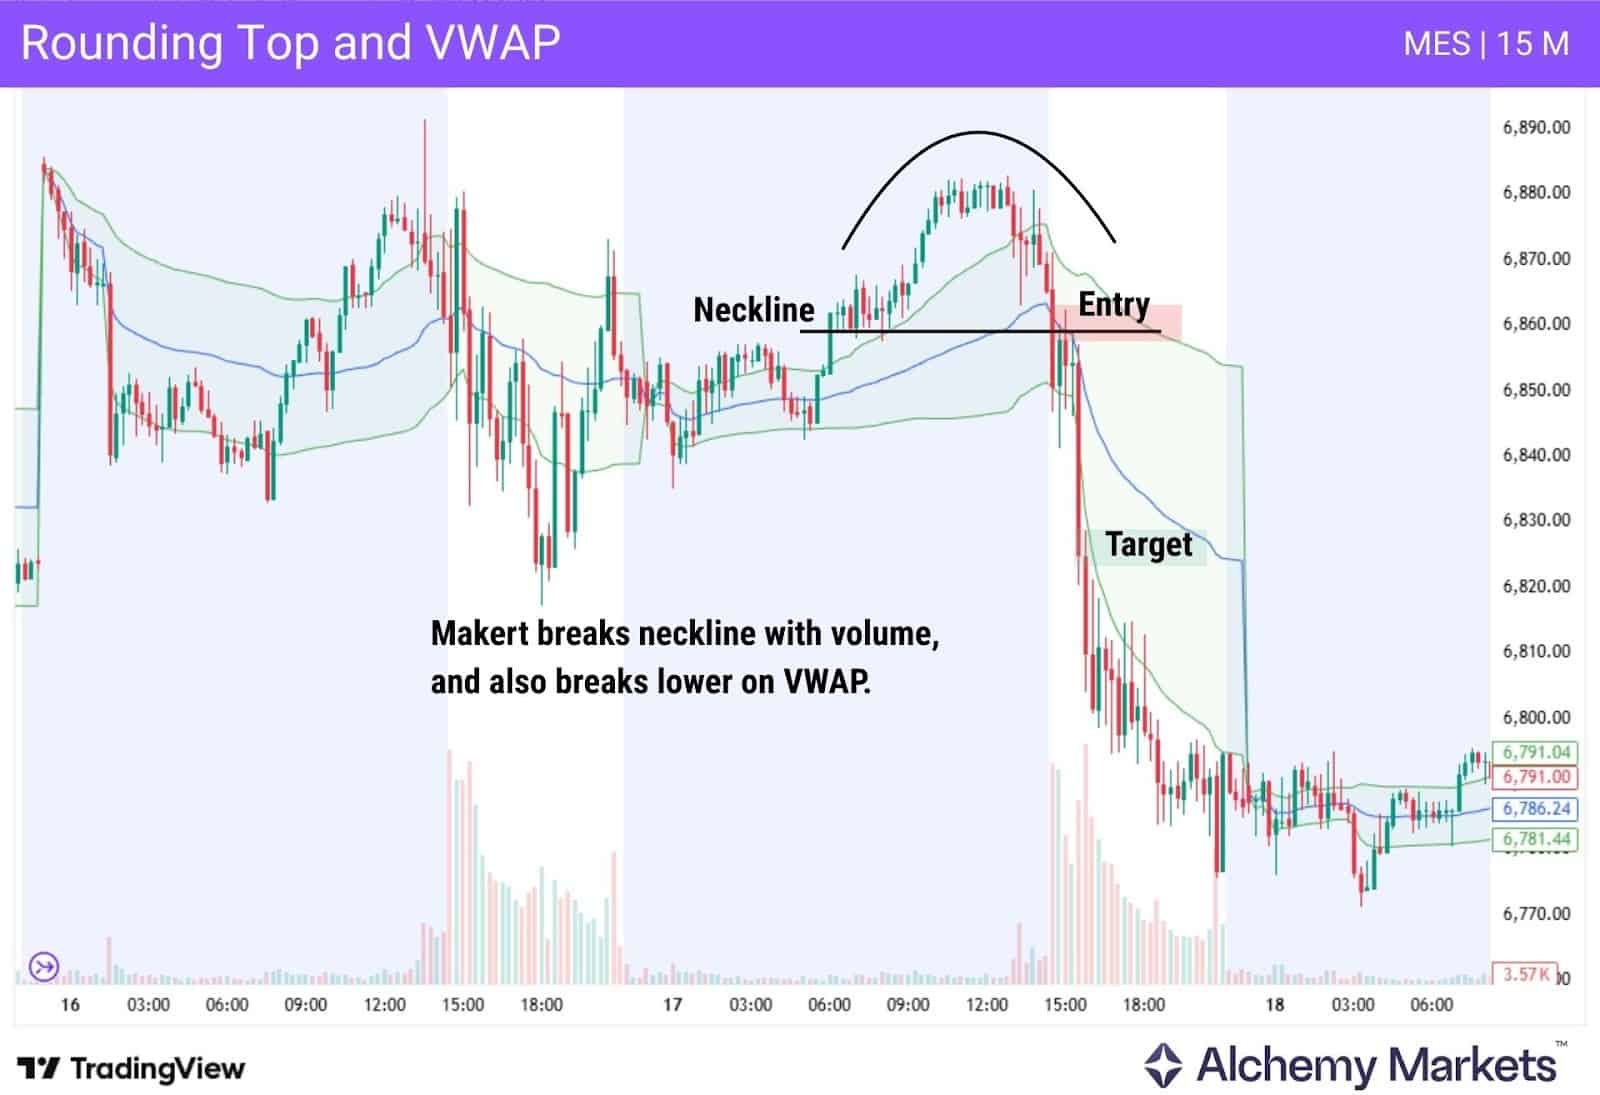
VWAP, Volume Weighted Average Price, is an indicator that many intraday traders use to determine dynamic support and resistance. The idea is that the middle line represents the average price of the positions in the market, suggesting when price is below or above it.
The other two lines are based on standard deviations; though most traders simply focus on the VWAP line itself.
When the rounding top pattern forms, and the market breaks below the VWAP, it suggests that the pattern will be traded by not only the technical traders, but also those who follow order flow.
Rounding Top Pattern with ATR
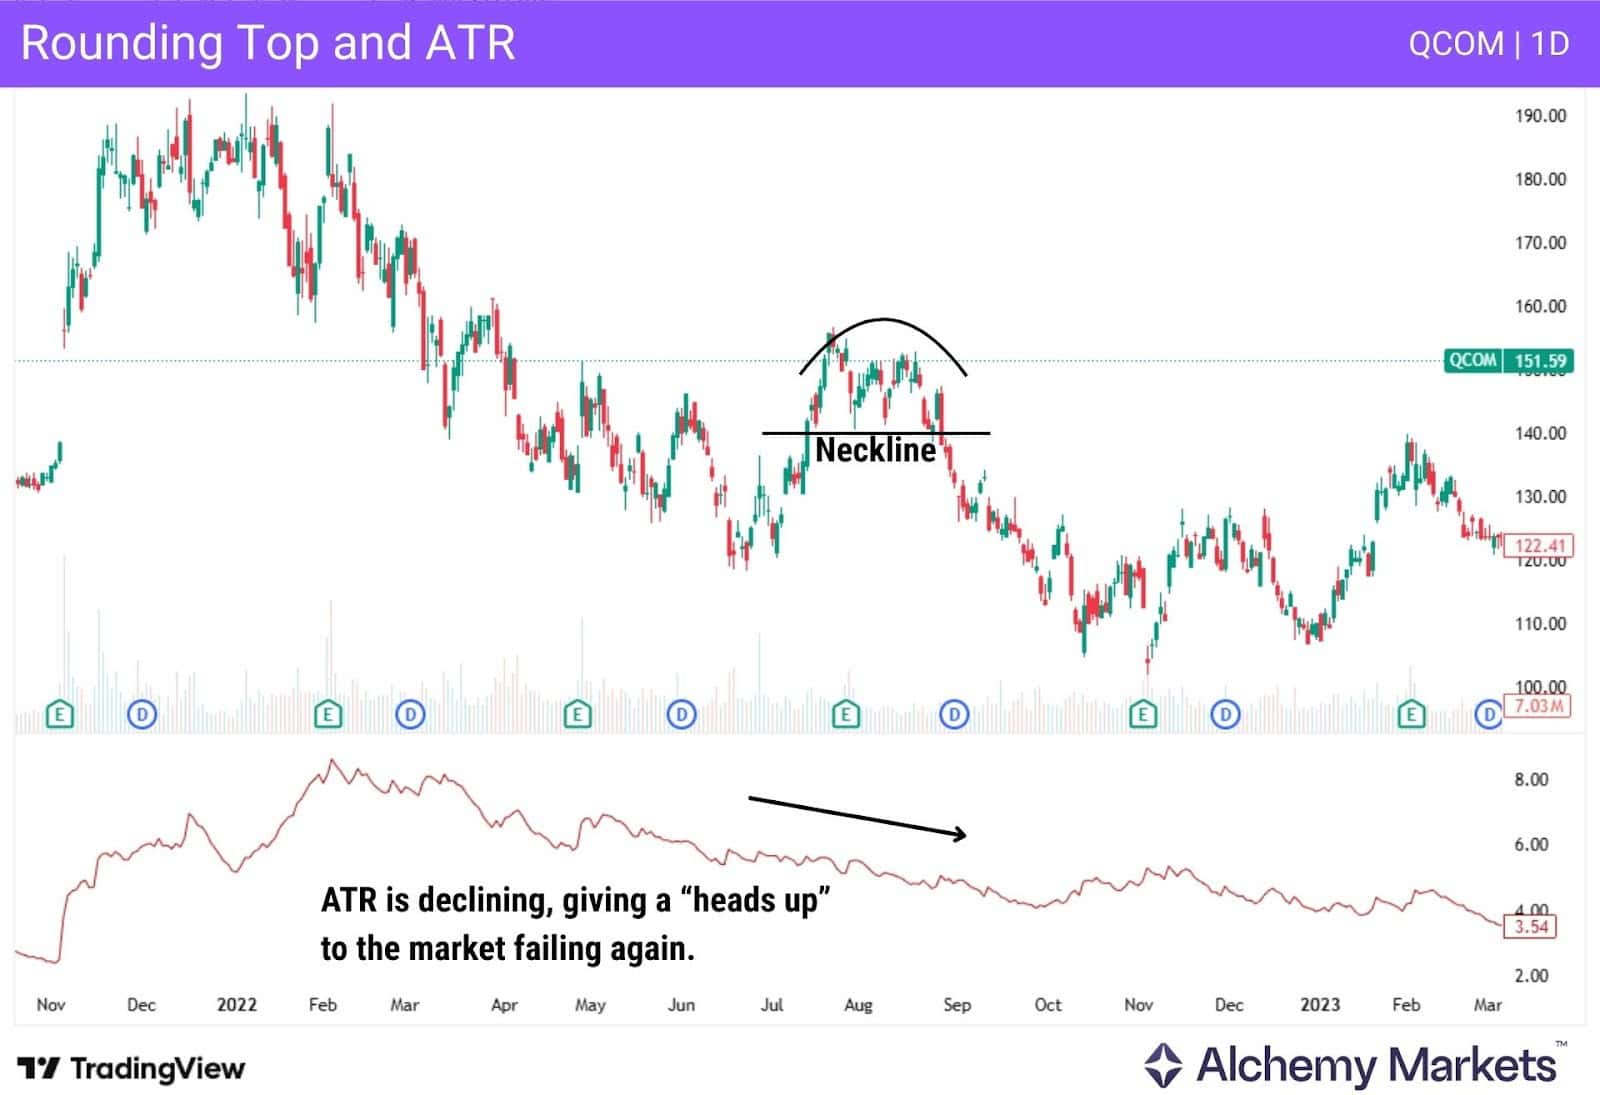
The Average True Range indicator measures the average range of each candle of a specified period. It can tell you many things, and is typically used by intraday traders to see “how far” an asset could move for the session. However, it is also used, as seen above, as another signal that a market could be running out of steam. A shrinking number could suggest a lack of interest.
In the chart above, you can see that the range of the market for QCOM was drifting lower, before the rounding top kicked off a continuation of the longer-term negativity after a short-term rally. In other words, lack of interest, coupled by a slight increase in volume, shows that the buyers simply do not have strength.
Advantages of Trading the Rounding Top
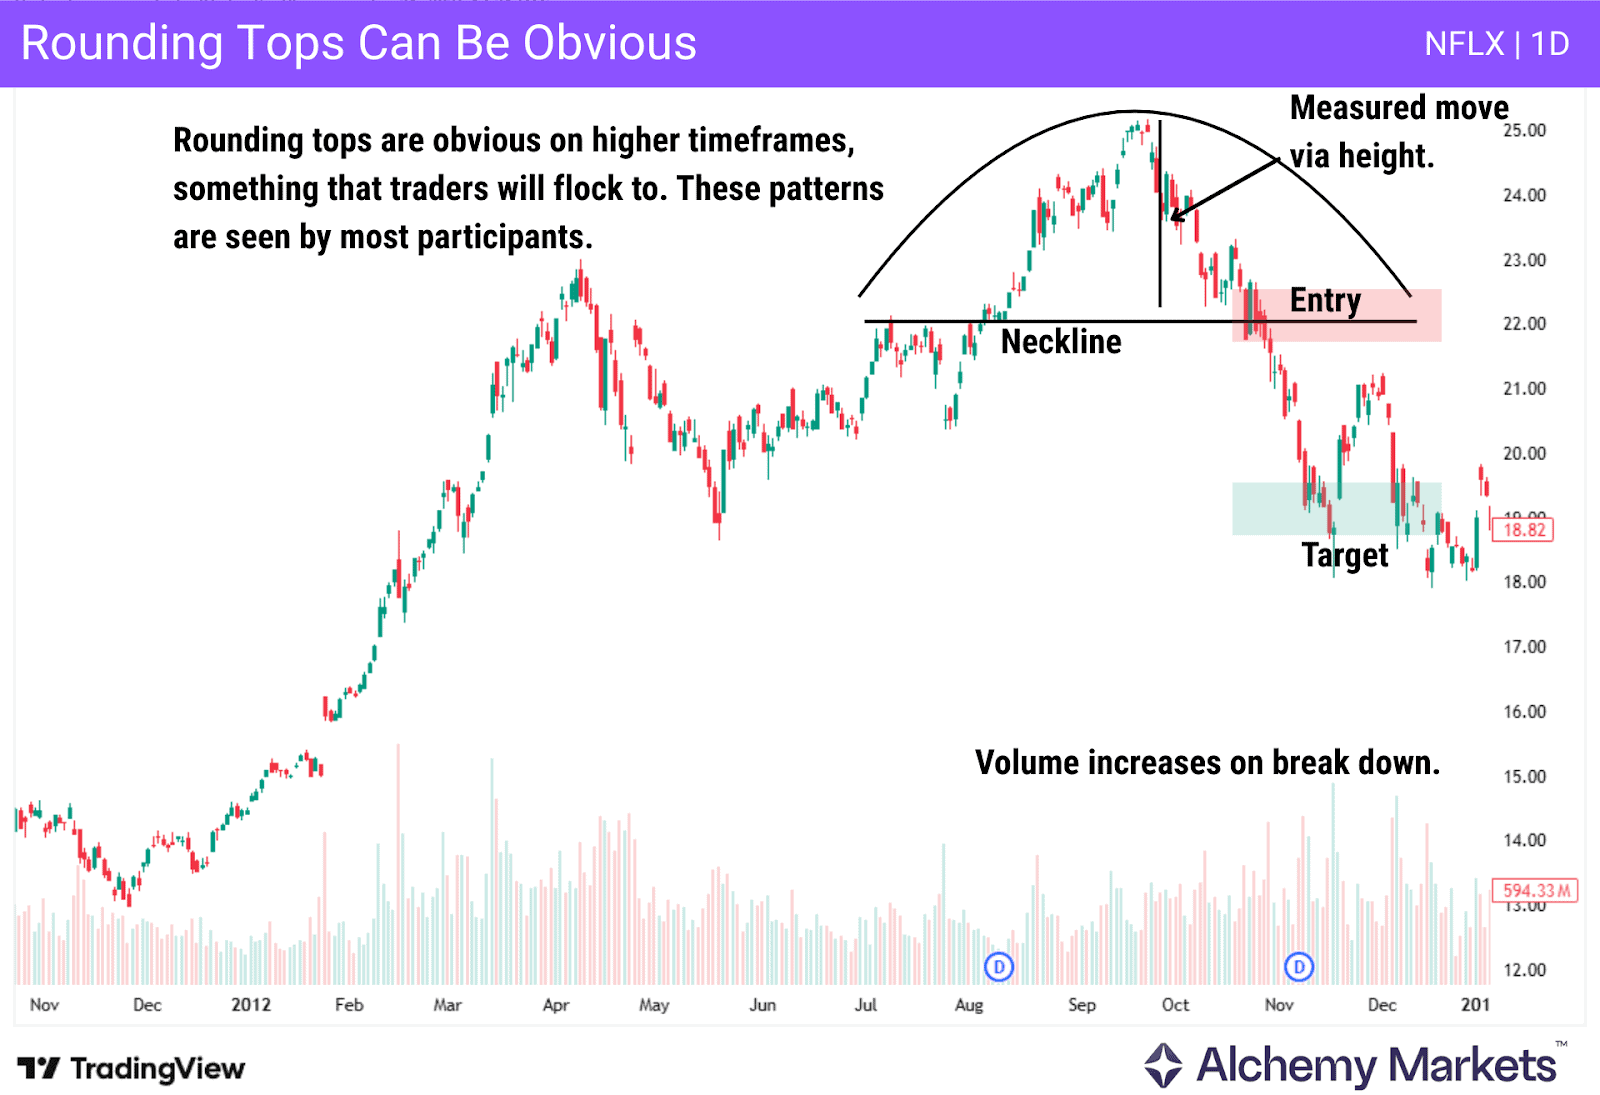
One of the biggest advantages of trading the rounding top is that it is easy to spot. This means that most other traders will be aware of the chart pattern, meaning that the rounding top is “widely known” by market participants. Furthermore, when price breaks the lowest point of the pattern, all of the bulls are now losing money, which can create a rush out of the asset.
Because of this, traders with even the slightest amount of pattern recognition skills will be watching the market struggle, and market sentiment start to change overall. This is the end of the bullish trend, and with declining volume as well, this means many traders will be on the same side as the traders looking for the rounding top to kick off bearish price action.
Disadvantages of Trading the Rounding Top
The biggest disadvantage of trading the rounding top is that it can take time to play out. Because of this, it can lead to traders trying to get into the market too early. Unfortunately, like any other technical analysis pattern, there can be false signals, and this is why it is important to look for confirmation, typically in the form of declining volume, a support price level being broken, and perhaps confirmation from an indicator as well.
Rounding Top vs Head and Shoulders
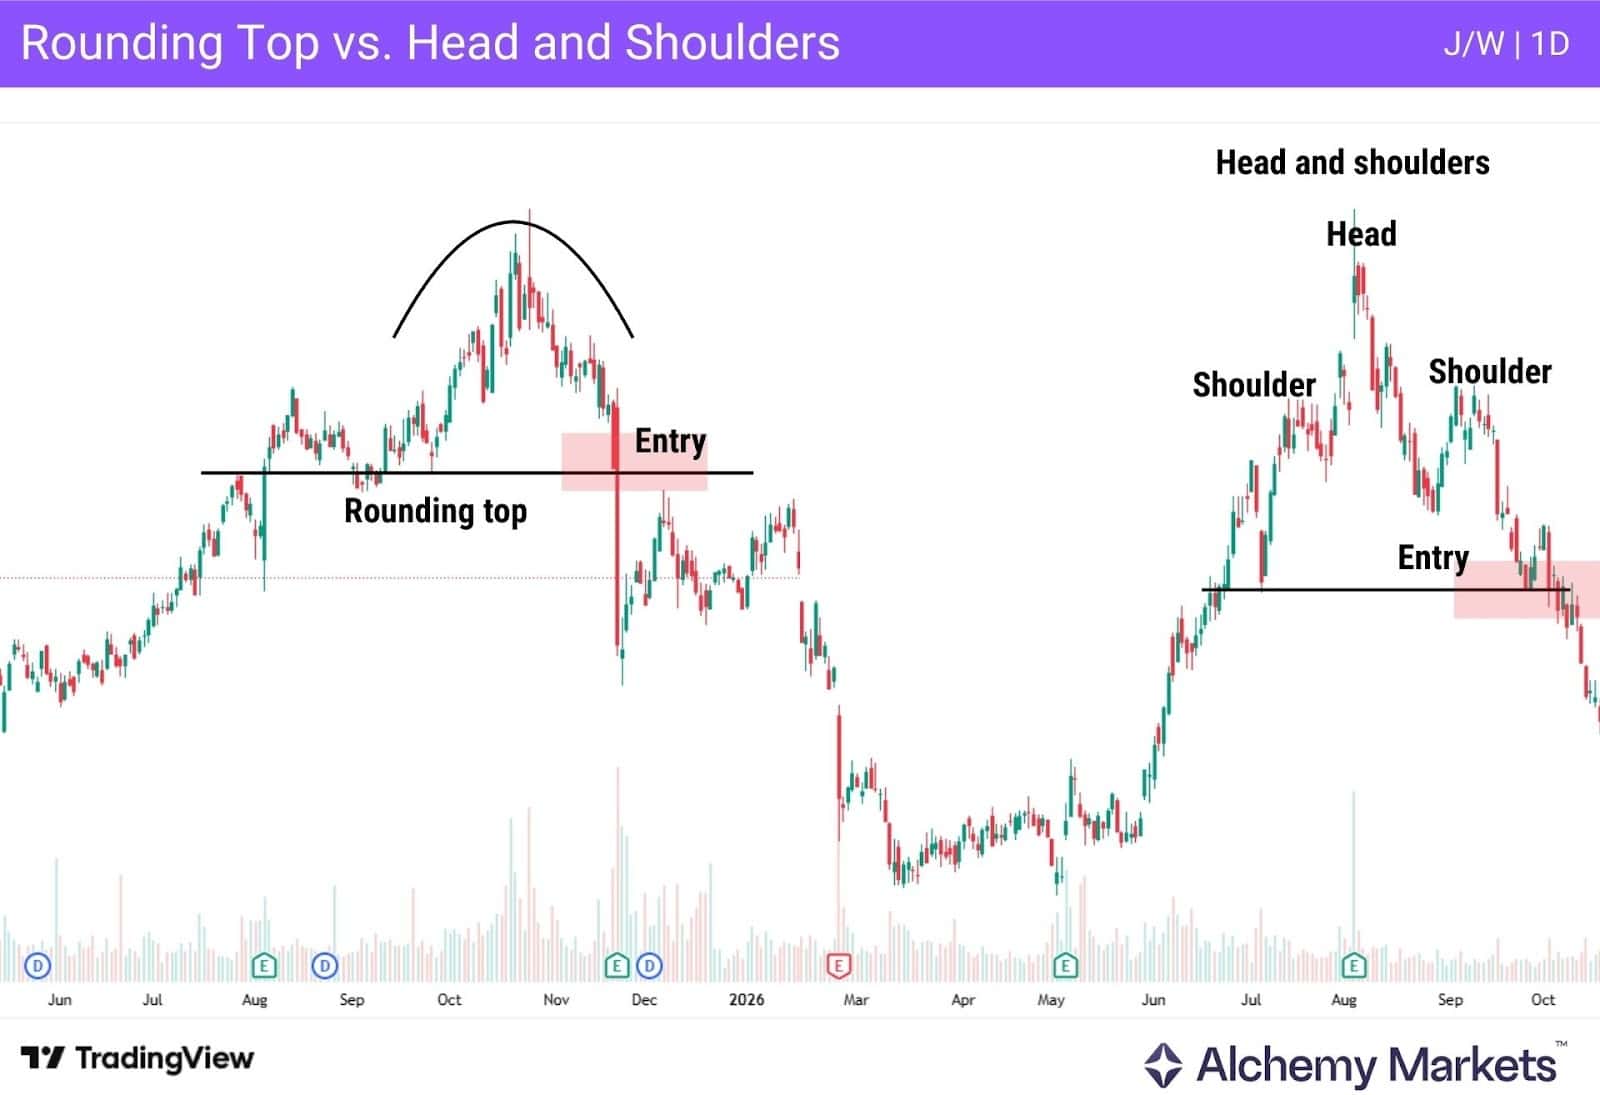
A rounding top reversal pattern is quite a bit different than a head and shoulders, although they are both bearish reversal signals.
As the rounding top is a gradual shift in market sentiment, forming a dome shape as traders start to become less and less interested in the asset.
In comparison, the head and shoulders pattern is characterised by a distinct peak, surrounded by two other smaller ones, one on each side. This three peak pattern shows that the initial peak and pullback suggests the uptrend is still intact. The second peak, or “head”, is another higher high, however, the third peak is lower than the “head.” This shows that the buyers didn’t have as much power this time. There is also a “neckline” in this pattern, which is the confirmation of the trend shifting.
Rounding Top vs Bearish flags
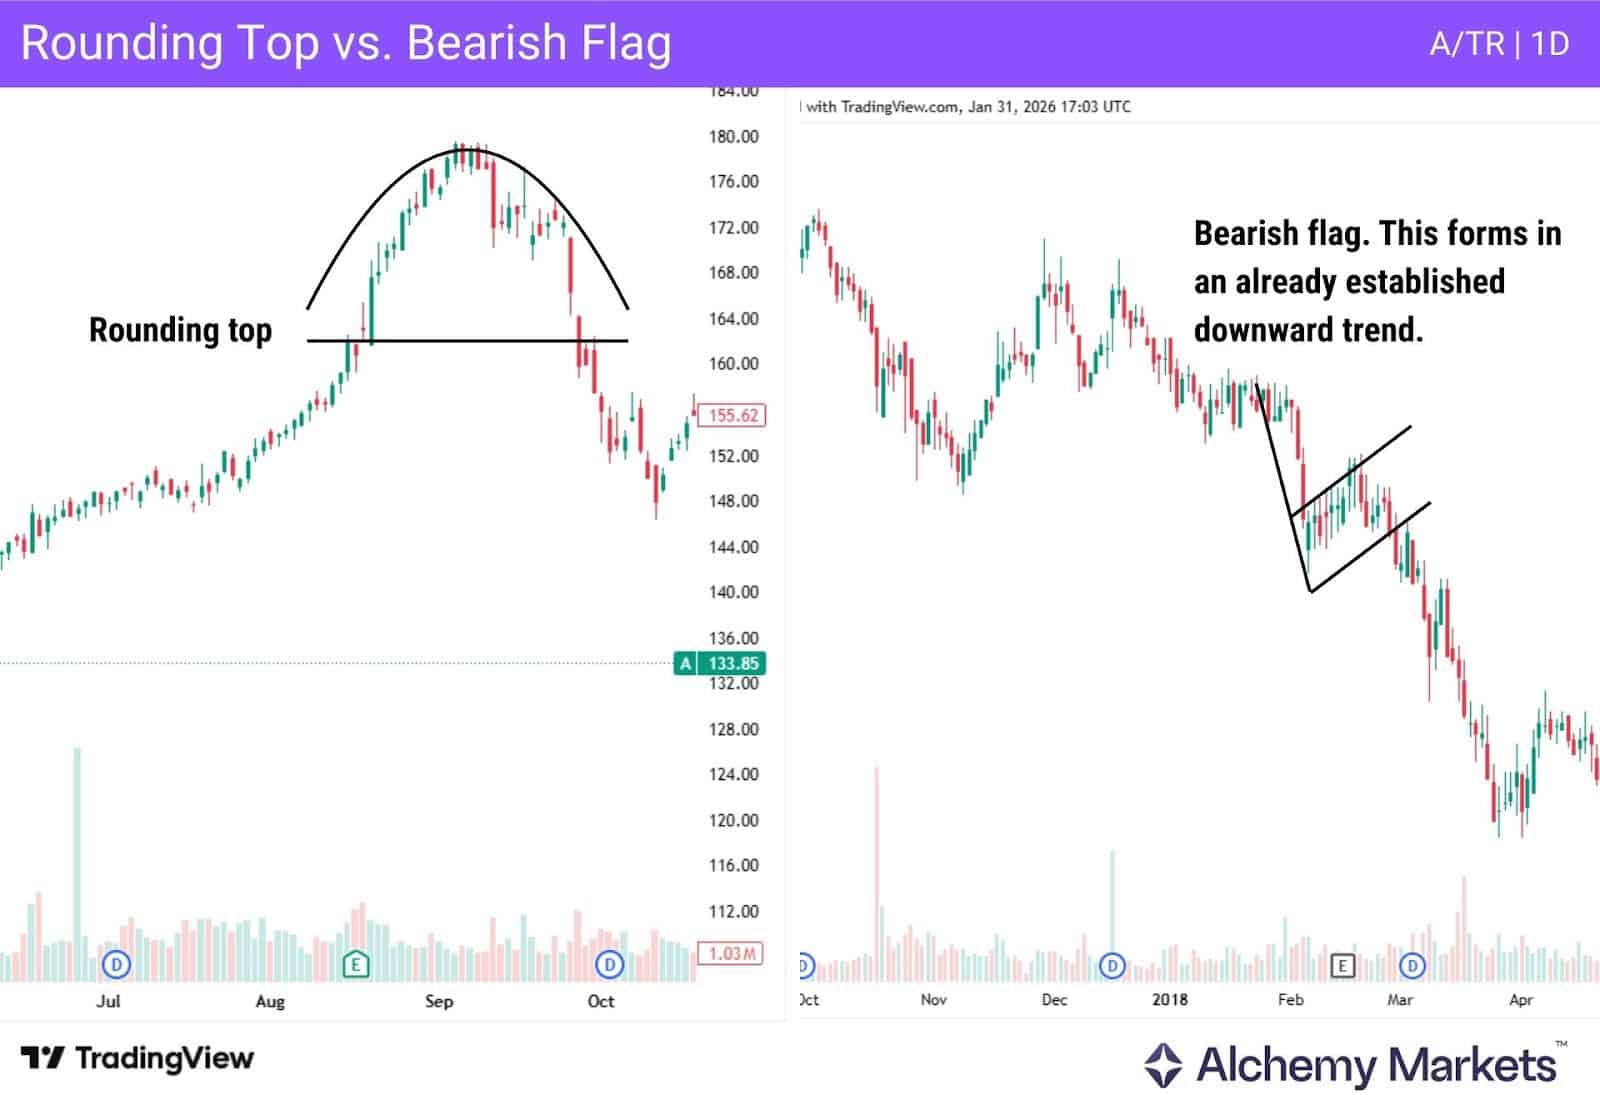
The rounding top is a dome that shows a gradual shift in perception and momentum for a market. This can lead to the market selling off later, but the bearish flag is a continuation pattern, which follows a downtrend. The rounding top is a reversal pattern.
Rounding Top vs Double Top
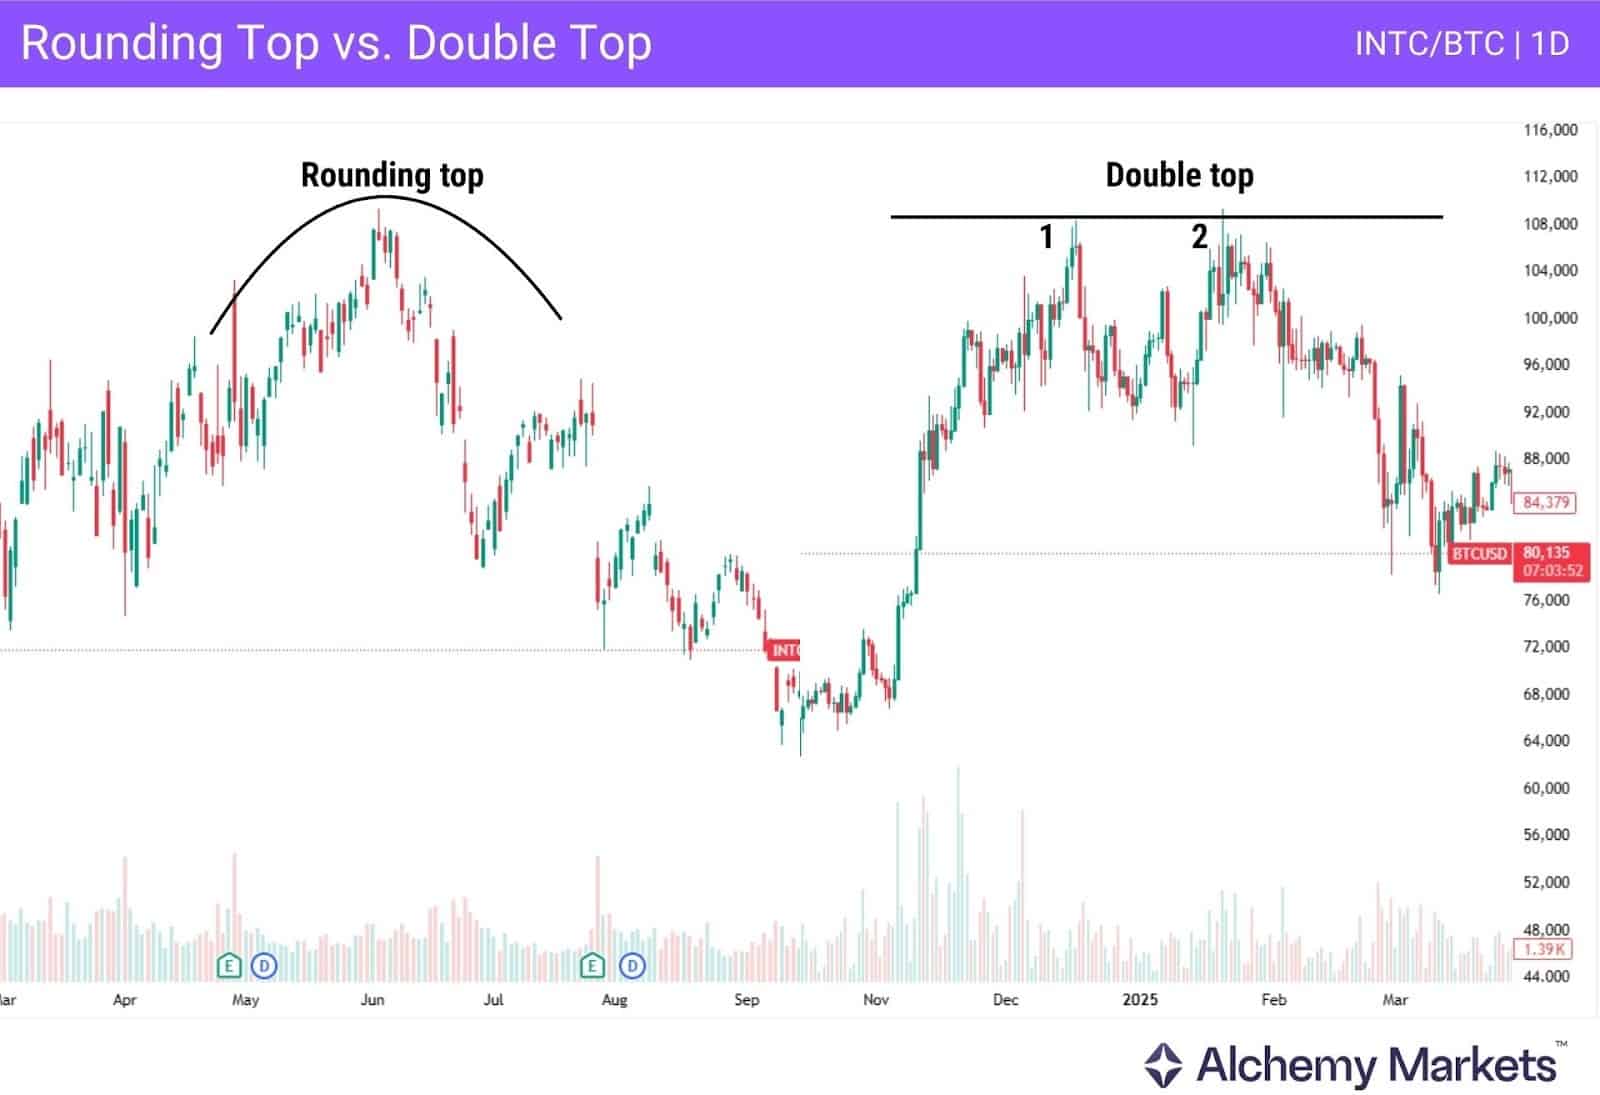
While the rounding top and the double top essentially say the same thing, there are a couple of things to think about here. The double top is formed by two distinct peaks, while the rounding top is one long gradual dome being formed.
Both have “necklines”, where the market starts to break down. In a sense, you can think of the double top as the “faster” version of the rounding top. Once the market breaks the lowest point of these patterns, the same result is assumed. Both also can signal the end of a bullish trend.
Rounding Top vs Rounding Bottom
The rounding bottom reversal pattern is the exact opposite of the rounding top, as it forms after a downtrend, but cannot continue the drop. It is an upside down dome that forms as the market gradually becomes more and more bullish.
Simply put, a rounding top creates a face-down curve, while the rounding bottom creates a face-up curve.
Both show that the market is starting to show a lack of momentum in the prior trend’s direction, and the volume can show signs of dropping as well.
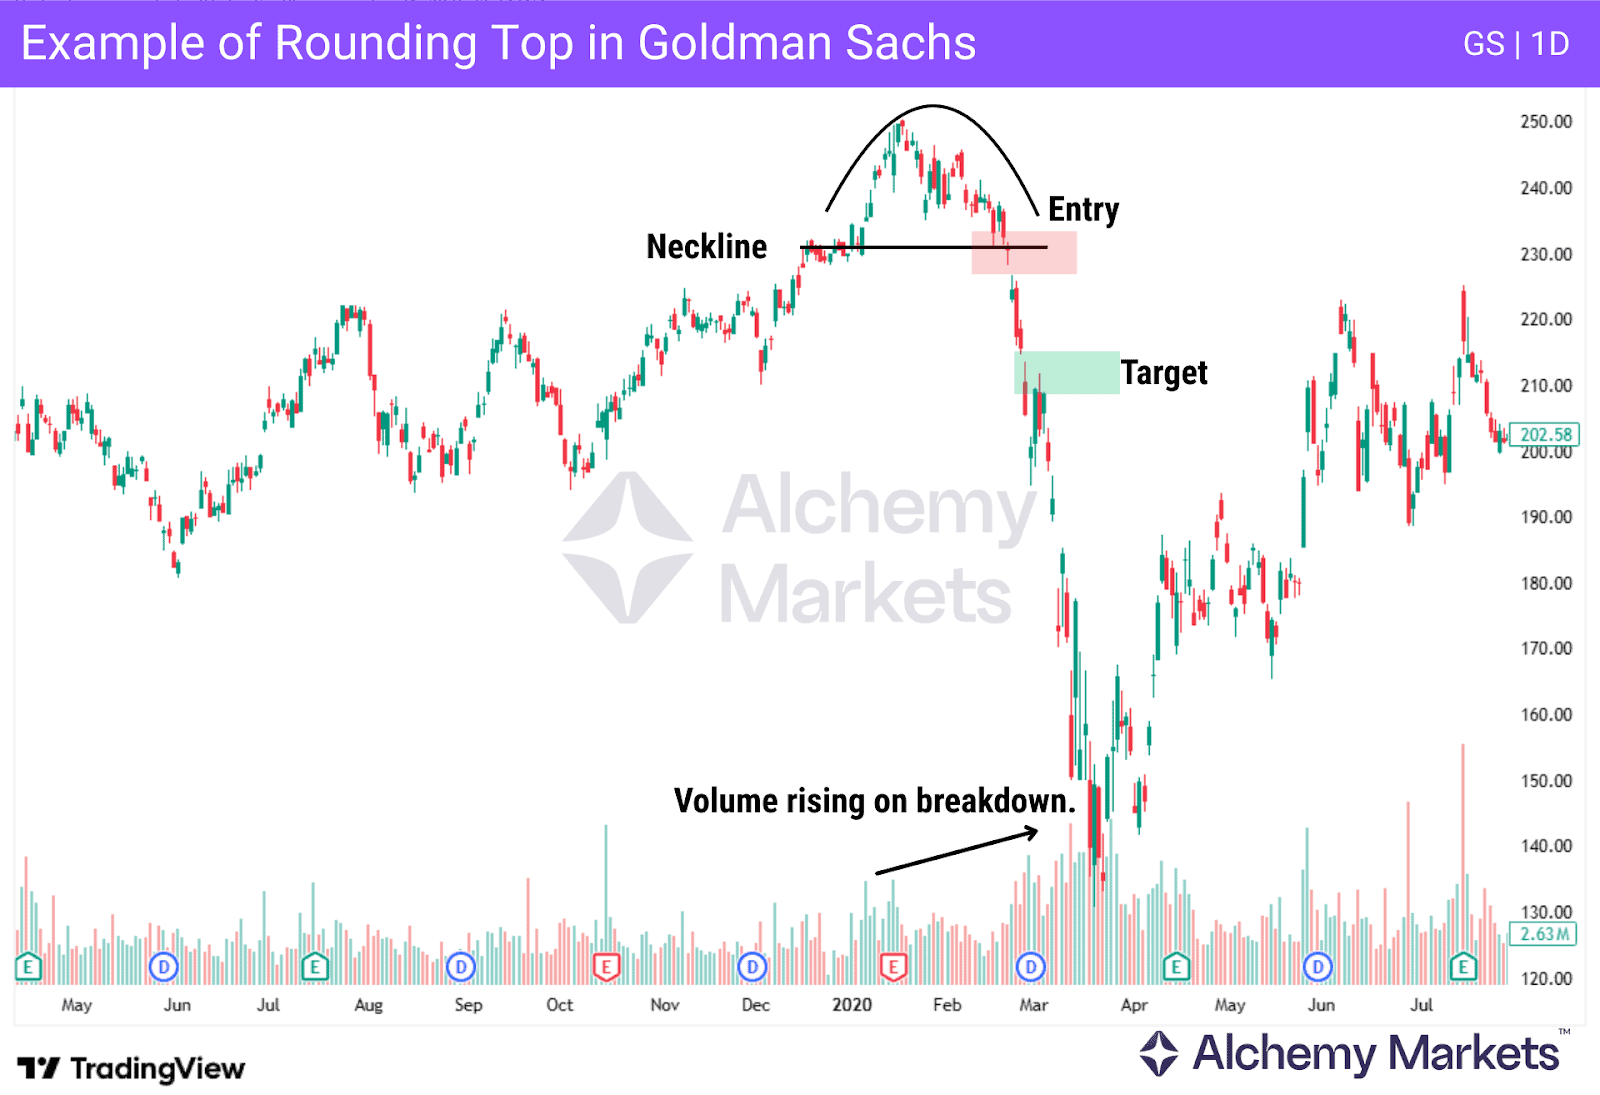
Rounding Top Stock Patterns
Here is another example on Goldman Sachs:
Rounding Top FAQs
While the rounding top pattern itself is fairly common and simple in its implementation, there are some questions that are fairly common for traders looking to use this trading pattern in the financial markets.
What are the Common Rounding Top Pattern Mistakes to Watch Out For?
The common mistakes that are found with trading the rounding top pattern to watch out for include:
Risk management: Unfortunately, many traders will completely abandon risk management when trading this pattern, mainly because it is such an obvious signal.
Rushing the trade: The traders that use the rounding top can sometimes try to rush getting into the trade, instead of waiting for the proper confirmation, such as when price breaks below the “neckline”, or declining volume at the top, and increasing volume when the market drops.
Confirmation signals: Trading these patterns without the confirmation signals that are recommended can lead to traders looking at consolidation as a rounding top.
Ignoring market environment: Sometimes traders will see a rounding top, but ignore the fact that the market isn’t changing, it’s just “stuck in limbo.” This happens from time to time.
What Is the Best Time Frame To Use for the Rounding Top?
Rounding top chart patterns can form on any timeframe, and their implication will vary depending on the timeframe used. As a general rule, and this is true with almost all technical analysis, the higher the timeframe, the better a pattern will tend to be. This is because it takes a long time, and a lot of trades to form it. This means that the conviction of the potential move will be the calculation of many, not just a few traders.
Most people tend to look for this pattern on daily and weekly charts, but those who are particularly nimble may trade this technical analysis pattern on shorter timeframes.
How Do I Confirm a Rounding Top Pattern?
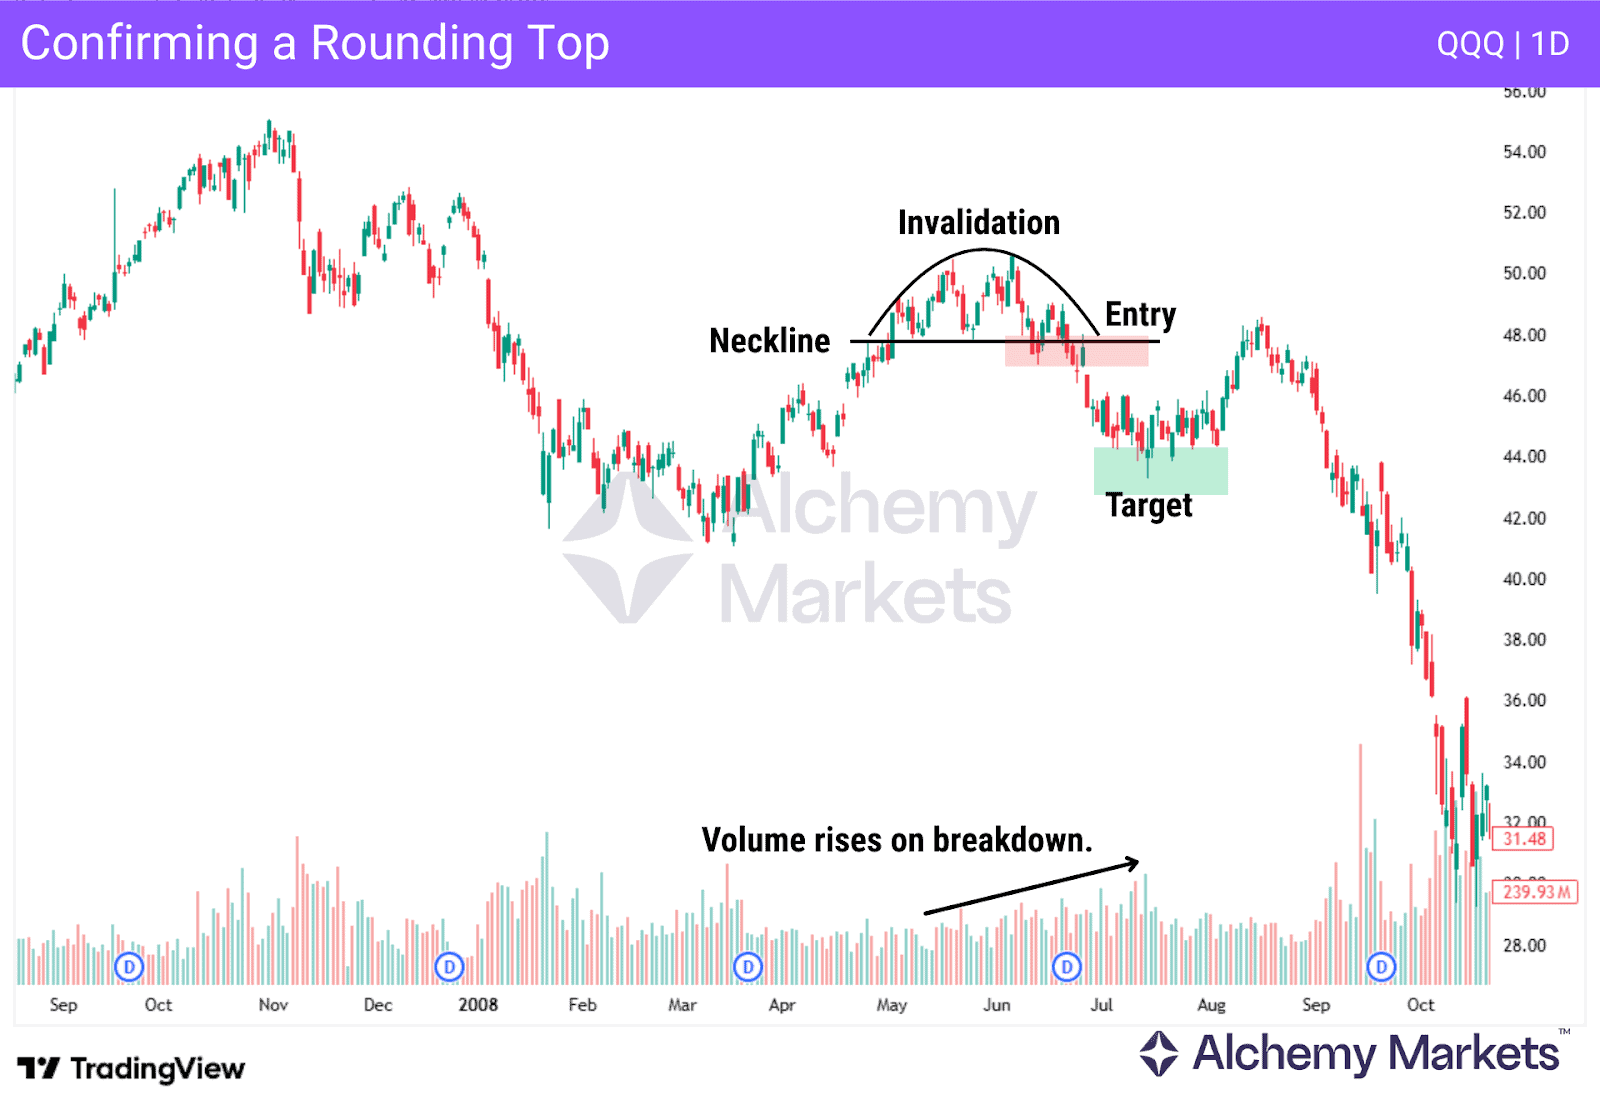
When a potential rounding top chart pattern forms, the more you have “working in your favour”, the better off you will be. The most important part of successfully trading this curved shape is to be patient. Sometimes, this pattern can take some time to work itself out.
One of the major factors is volume. The gradual decline of volume as the price actions flattens is a good sign, especially when volume perks up on the way back down. The confirmation of a break of the price level that started the entire pattern is also a good way to avoid being burnt by a failed set up.
Can rounding top patterns fail to reverse the trend?
The rounding top chart pattern is thought to be fairly reliable, but they can and do fail to reverse the trend sometimes. The market following conditions can cause a failure of the pattern:
Failed Reversal: The rounding top reversal pattern fails if the price of the market doesn’t break below the neckline of support level that is associated with the pattern, and instead continues its previous trend, as market participants have chosen to continue buying.
Continuation Signal: Sometimes what ends up looking like a rounding top chart pattern is actually a period of overall consolidation, before the market negates the rounding top formation, and continues to rise as it breaks to a new high.
Breakout Strength: The importance of a candle close below the neckline or support level cannot be overstated. This gives confirmation that the momentum is moving to the downside. Without it, or a candle that fails to close below that level, shows indecision.
False Breakouts: In markets, sometimes technical analysis fails us. There is no way around that, but waiting for confirmation signals, such as a candle close below the neckline price level can help.
How long does it take for a rounding top pattern to form?
There is no “set in stone” timeframe for a rounding top chart pattern to form. However, on daily charts, it is not uncommon for the dome shape to take several weeks, or even months to fully develop.
As a general rule, the longer it takes for the pattern to form, the more reliable the pattern and breaking of the support line tends to be.
Are there variations of the rounding top pattern?
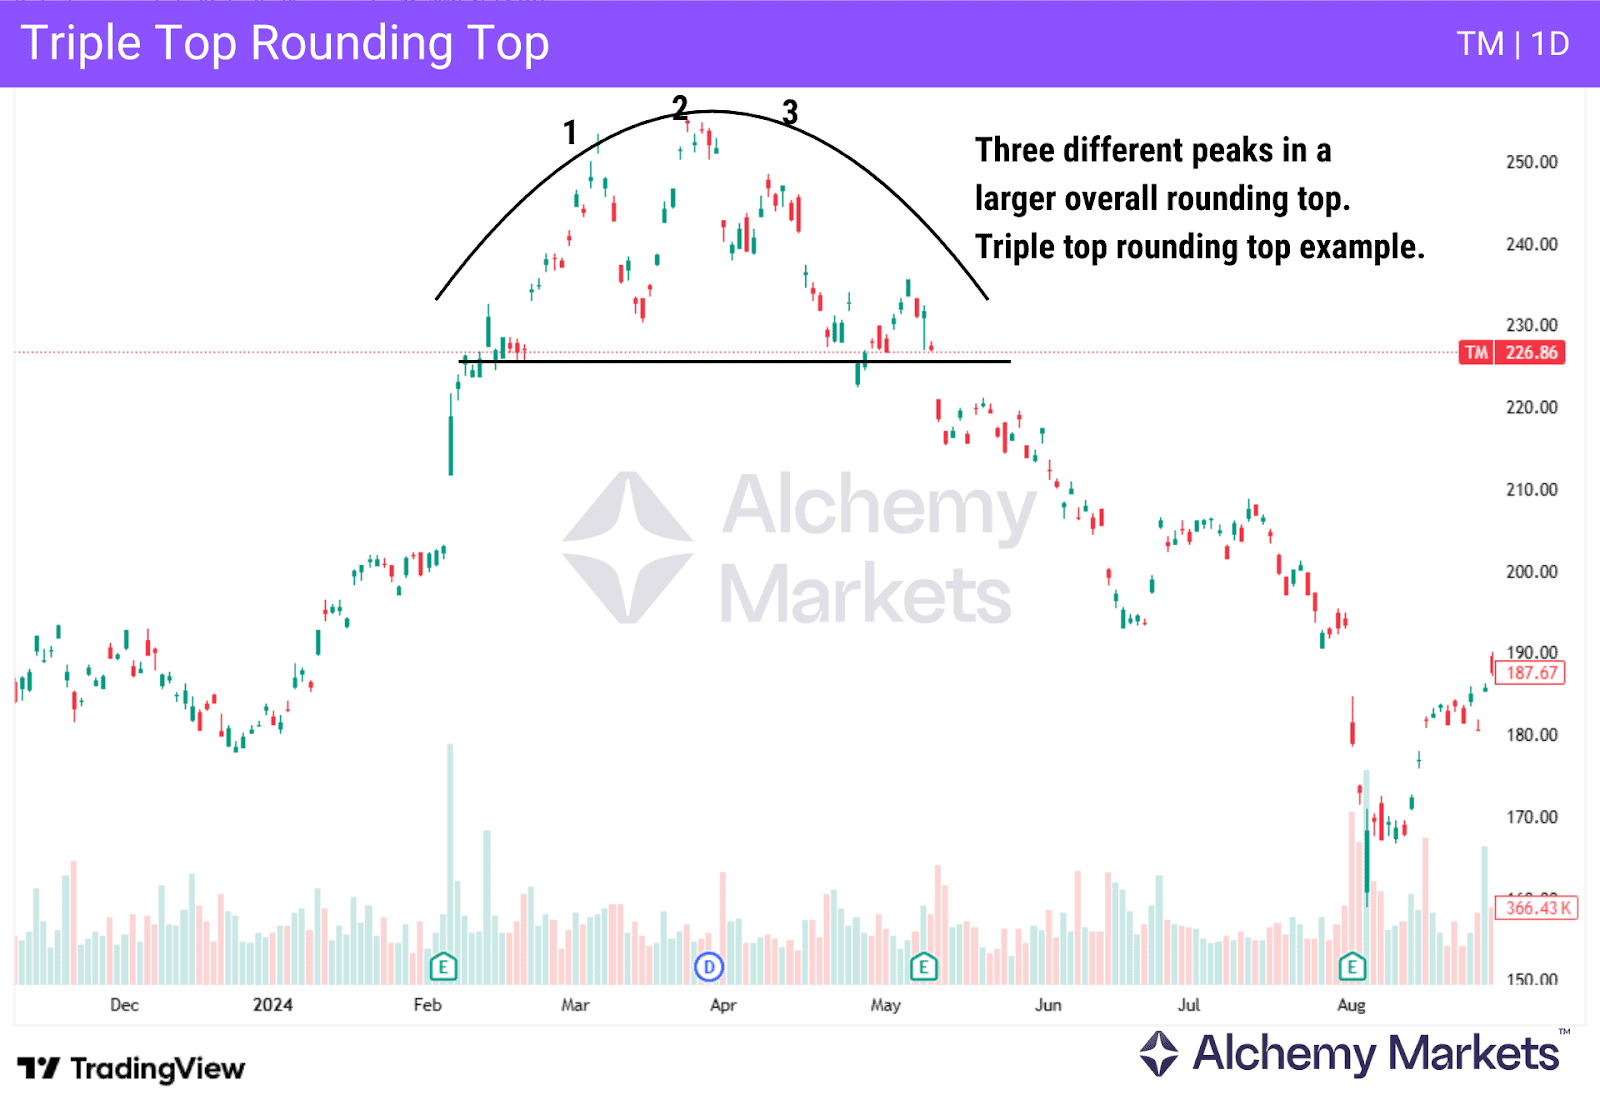
There are a few variations of the rounding top chart pattern, such as the asymmetrical rounding tops which have unequal sides, extended rounding tops which are prolonged patterns, and others such as double and triple tops which are three smaller rounding tops in a row. Regardless of the variation, all are confirmed when price breaks the neckline or support line.
How reliable is the Rounding Top Pattern?
While the rounding top is considered a solid bearish signal, the trader must rely on confirmation and market conditions. The success rate of the rounding top chart pattern is approximately 64%, and a low failure rate of 15%, making it important.
Are Rounding Tops More Reliable on Daily or Intraday Charts?
Longer-term charts are almost always more reliable regardless of the pattern. The rounding top chart pattern on a weekly chart, for example, is catching the broader shifts in market sentiment, while an intraday chart might simply be capturing a suddenly short-term news headline that causes noise.
Can Volume Alone Validate a Rounding Top Pattern?
No, not at all. The role of volume is important, but at the end of the day, price movement will determine what happens. Pattern recognition is important, and although volume can help, a rounding top being formed is the most important piece. The addition of volume, or other indicators, can simply help, not determine.
Can a Rounding Top Pattern occur in both uptrends and downtrends?
Despite what you may think at first glance, yes. The rounding top pattern can signal a correction to a longer-term bullish market. This can lead to a temporary reversal of the markets, only to see the longer-term investor continue to buy and push prices higher eventually.
Is Rounding Top Pattern bullish or bearish?
A rounding top pattern is bearish, as it is the slowing of bullish momentum, followed by selling pressure that accelerates over time. In the middle, you see sideways action, as traders become less convicted in the bullish momentum.


