Written by:

Reviewed by:

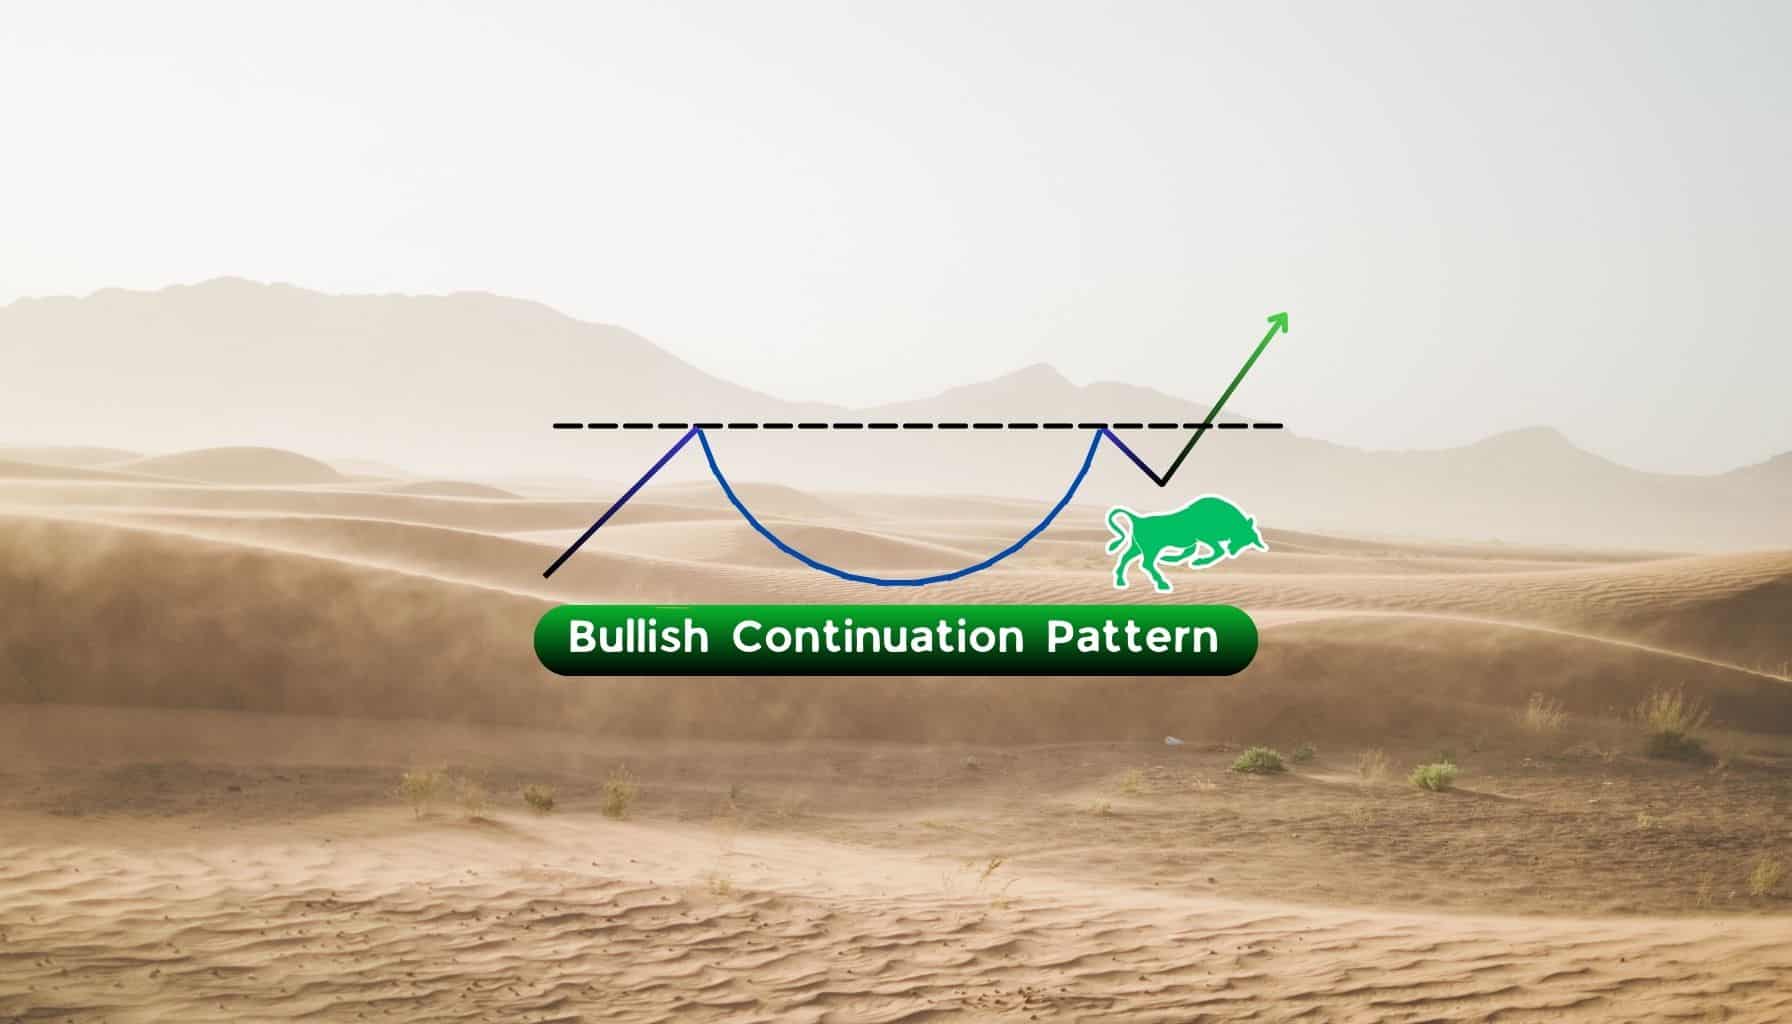
Bullish
- September 16, 2024
- 23 min read
Cup and Handle Pattern Explained With Examples
What is a Cup and Handle Pattern?
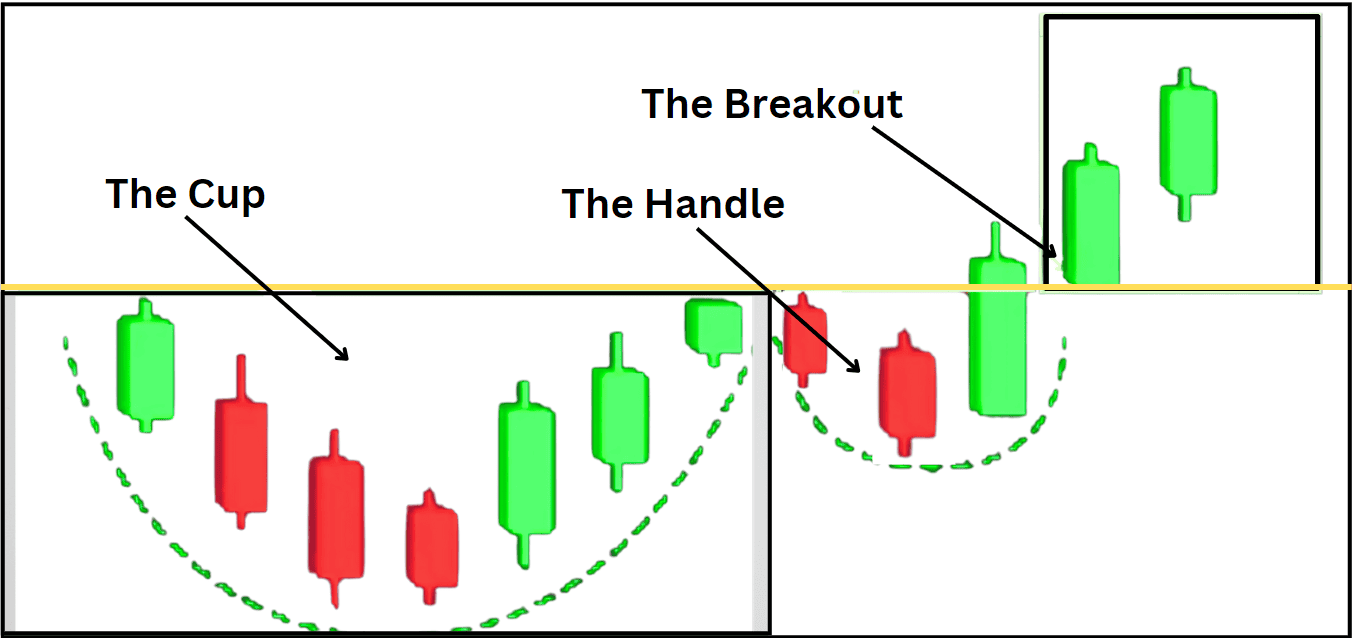
The “Cup and Handle” pattern is a bullish continuation pattern used in the technical analysis of financial markets. It resembles the shape of a tea cup on a price chart. The cup portion of the pattern typically appears as a “U” shape, while the handle appears as a shallow consolidation period. In essence, the cup represents a large period of consolidation, while the handle represents a smaller consolidation prior to a continuation of the uptrend.
This pattern usually develops over a trading range that spans several days, weeks, or even months, sometimes extending beyond a year, making it one of the longest-forming chart patterns out there. Traders often use this technical chart pattern to identify bullish signals in stocks, securities, or crypto markets and take long positions.
This tutorial explains everything you need to know about the cup and handle pattern and how to trade it, regardless of your trading experience.
How to Identify the Cup and Handle Pattern?
Identifying this pattern on the charts is typically a straightforward process as the pattern develops in three distinct phases. Here’s a simplified guide to help you recognise this pattern quickly:
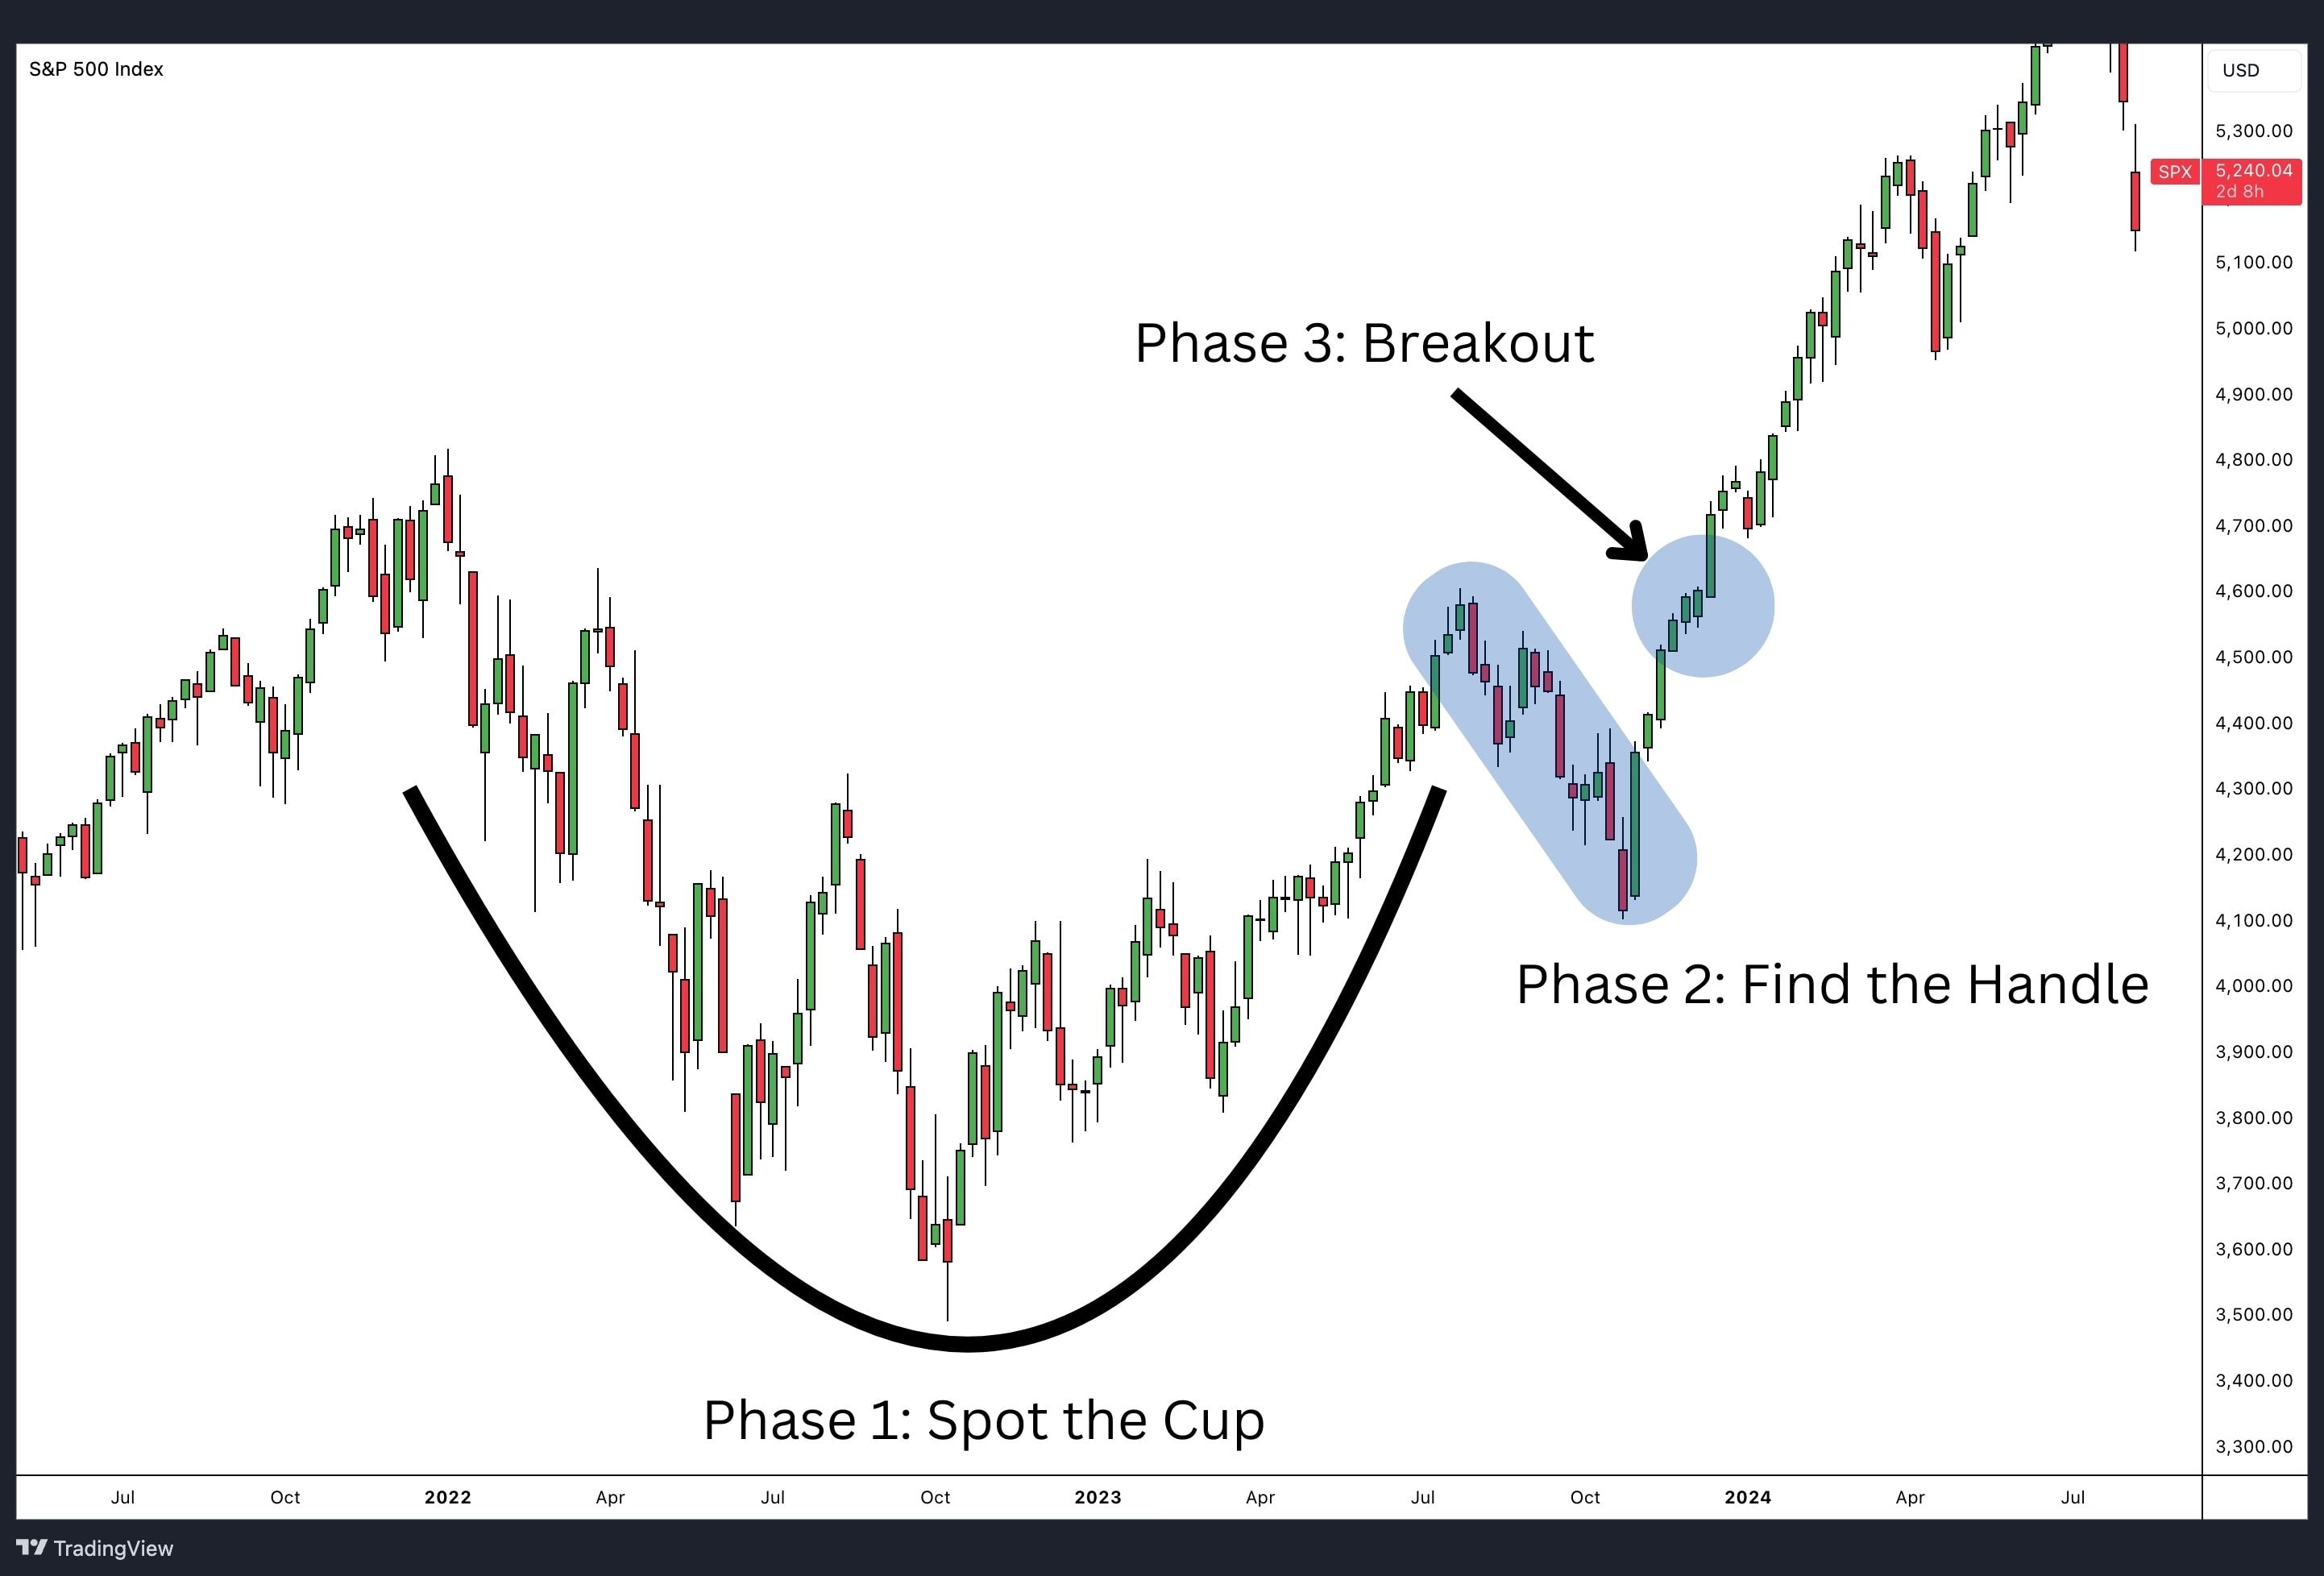
- Phase 1 – Spot the Cup: The cup forms as a “U” shape formation after a price increase. It begins with a gradual price drop, bottoms out, and then rises back. There should be a balance and symmetry with an even curvature on both sides of the cup. The right side of the cup should be close in price to the left side, indicating a stable market in a consolidation phase of the prevailing uptrend.
- Phase 2 – Find the Handle: The handle pattern occurs as the second stage of the cup and handle pattern. The handle patterns are an additional base and price consolidation after retesting the previous high during the cup formation. The handle should appear as a smaller, shallower version of the cup, often resembling a bull flag or bull pennant pattern. Ideally, the handle should be about a third of the size of the cup and should not drop significantly, shaping in the upper third of the cup. This phase is crucial as it represents the final testing area before the stock breaks higher.
- Phase 3 – Confirm the Breakout: The third and final stage of the bullish continuation pattern is the breakout. This phase is signaled when the price breaks above the handle’s upper trendline, surpassing the resistance level. This surge represents the culmination of building pressure from buyers driving the price upward as the pattern completes.
For traders, the breakout is an important buy signal, suggesting the pattern’s resistance is cleared and a rally may have further to travel.
Key Rules for Identifying a Cup and Handle Pattern
To confirm that you have identified a cup and handle pattern correctly, here are some key rules to follow:
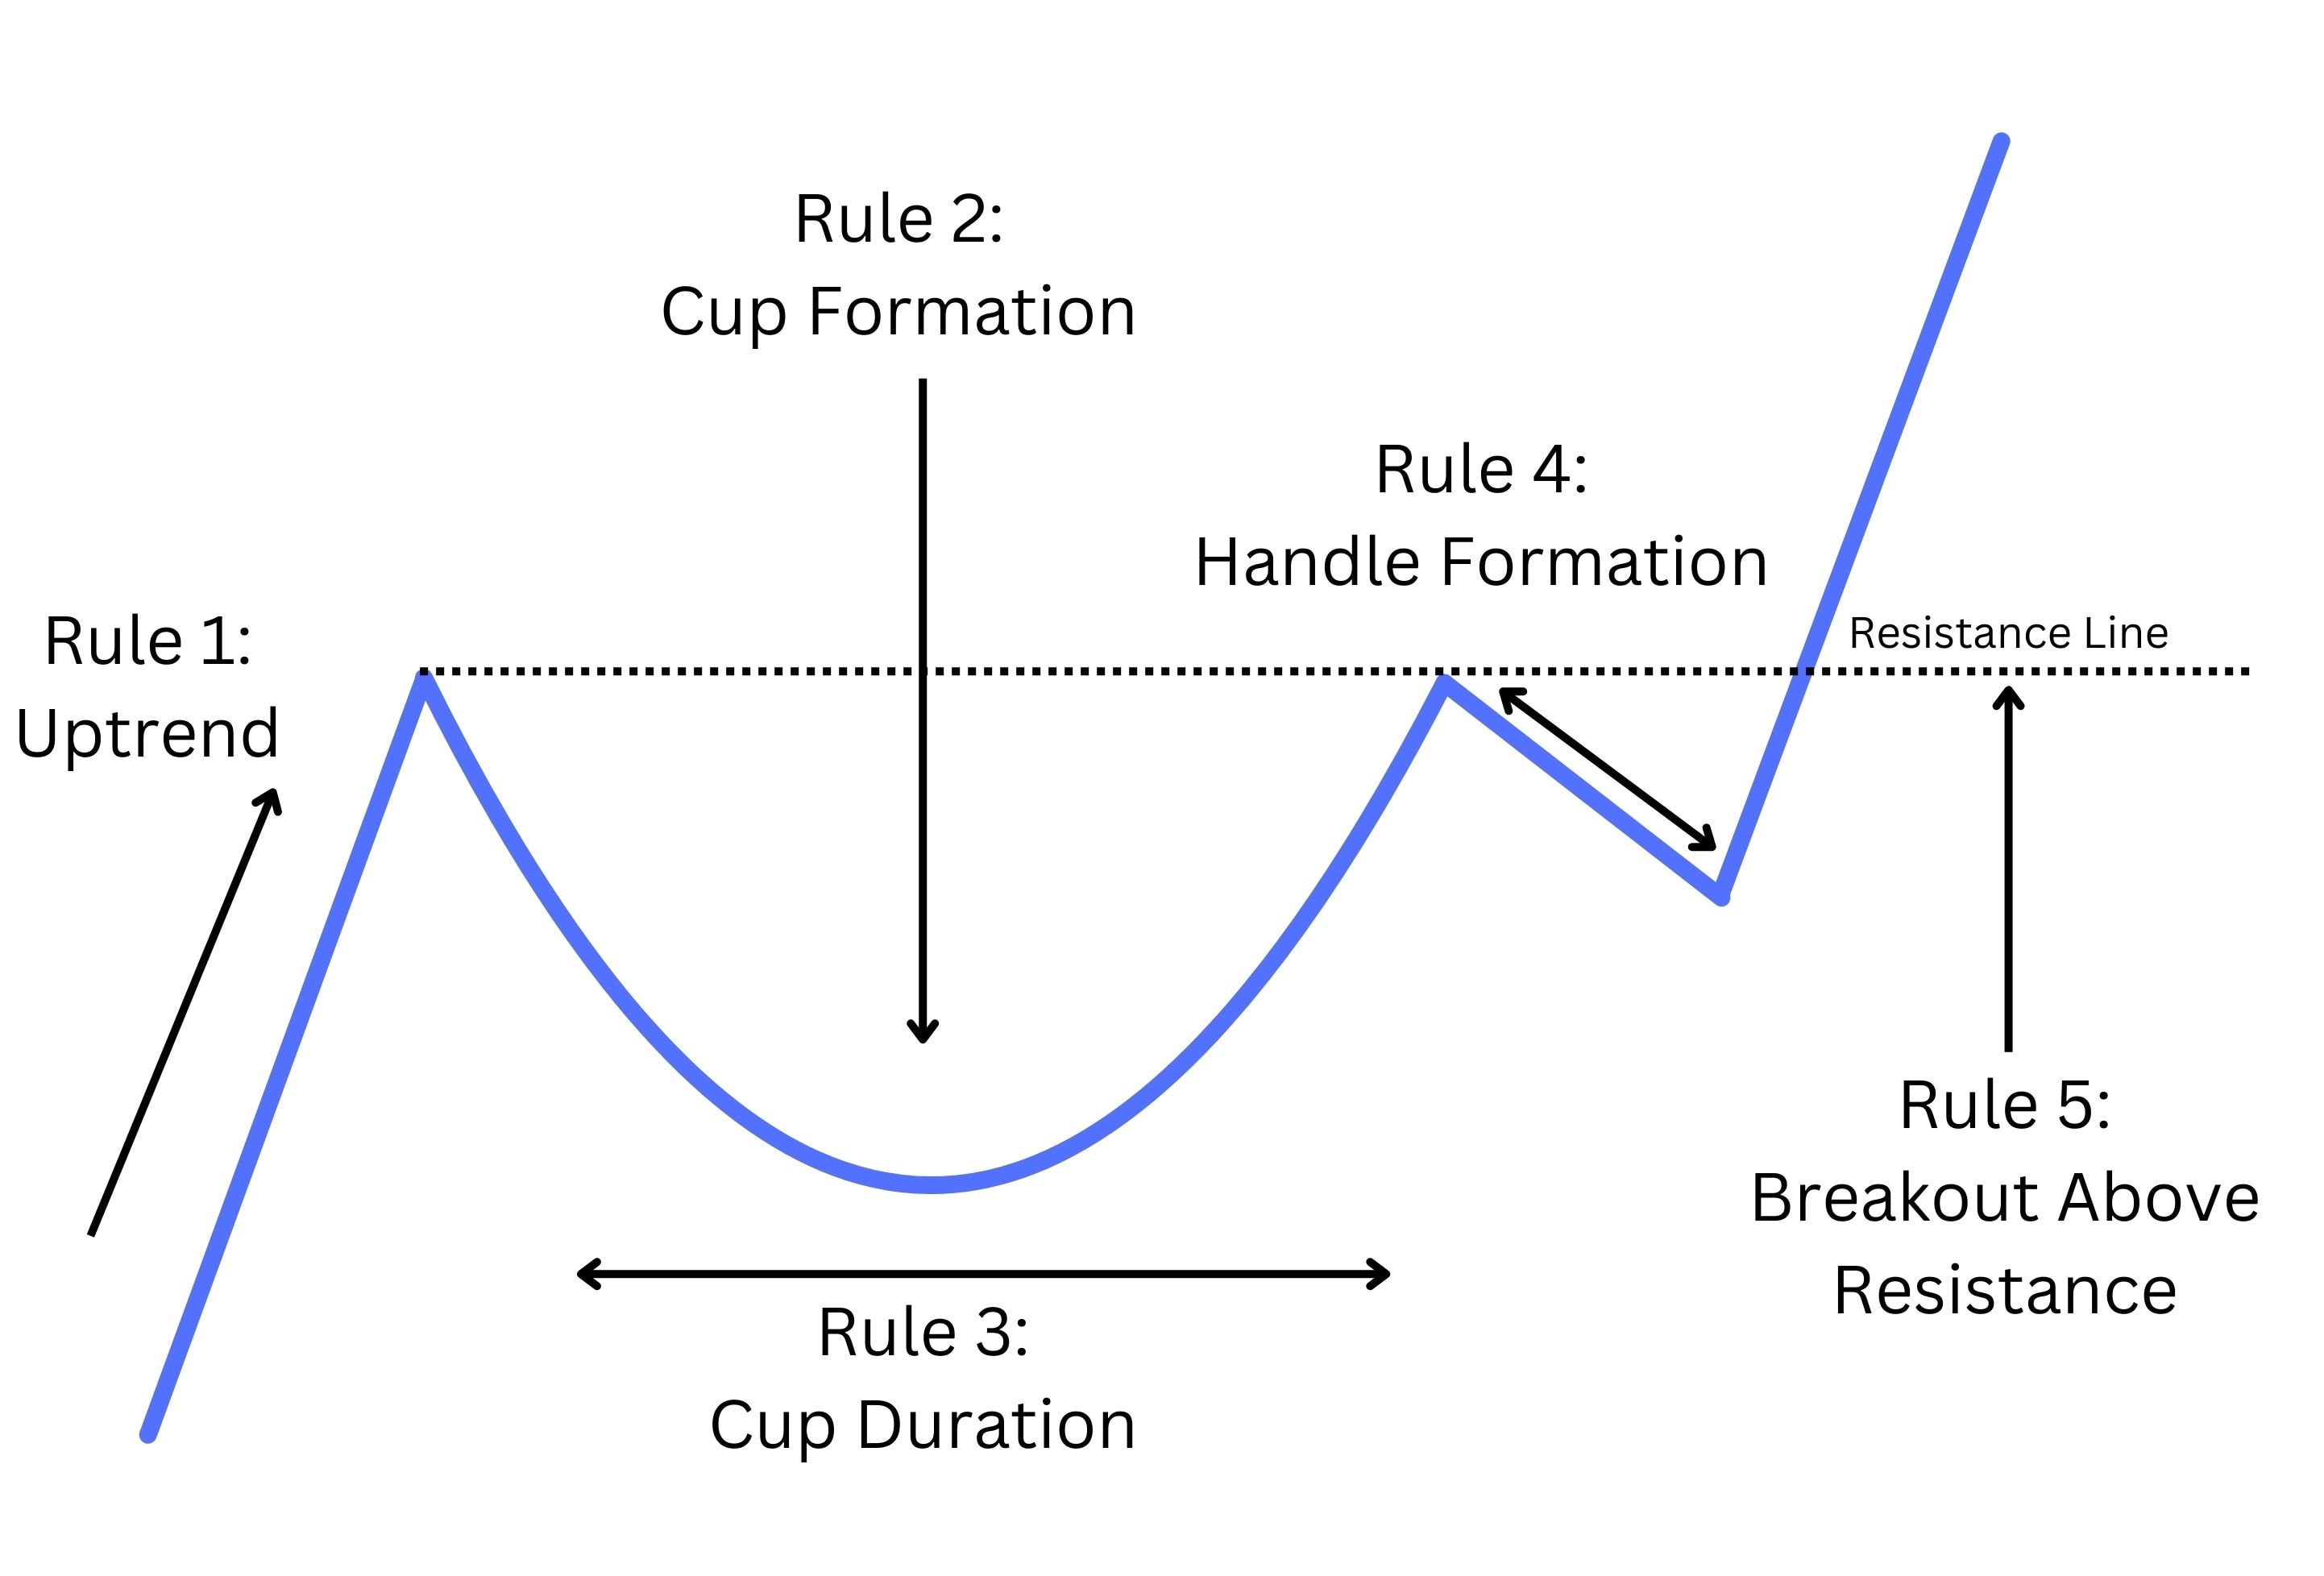
1. Ensure A Previous Uptrend
The cup and handle is a bullish continuation pattern, which means there needs to be a previous uptrend prior to the cup pattern developing. Look for a consistent series of higher highs and higher lows for the asset. If there was no prior trend or if the prior trend was choppy, false signals may appear.
2. The Cup Forms
You’ll notice the asset breaking its consistent series of higher highs and higher lows as a near-term top develops. This could be due to a broader choppy market or a broader market correction kicking off the cup portion of the chart pattern. The price declines to form the left side of the cup. A steady price decline is often preferred over a more abrupt and severe price decline. This steady decline shakes out weak holders who give up on the asset and do not anticipate a rebound anytime soon. The cup shape should resemble the letter “U” and can also appear “V”-shaped. The depth of the cup should be between one-third to two-thirds of the pattern’s previous uptrend, reflecting consolidation within a larger uptrend. Applying the Fibonacci retracement tool, the depth of the cup should run between the 38% to 61% retracement levels. The bottom of the cup should not consume more than two-thirds of the previous uptrend. If it does, it is considered too deep and may not be a reliable cup and handle. You can use the Fibonacci retracement tool to determine the cup depth—if the stock price retraces below the 61.8% Fibonacci level and resides there for a while when forming the cup, you may want to steer clear and reassess.
3. Cup Duration
After finding support, the price bottoms and rallies to retest the previous high. Sometimes, the right side of the cup and handle pattern reaches above the previous high or falls slightly short of the high. The key component is that the price rallied back close to the previous high formed by the left side of the cup. This is followed by an increase in trading volume as the stock price recovers to its peak. The cup pattern typically spans one to six months. A longer formation period establishes a solid base for a potential breakout.
4. Handle Pattern Forms
After using significant strength to rally back and retest the left side cup handle high, a secondary base forms as the handle. The handle of the cup should ideally not dip below the 50% Fibonacci retracement level should remain in the upper half of the cup height. Exceeding this range may indicate a weak pattern or potential failure. For higher chances of success, aim for the handle to be above the 38.2% Fibonacci level of the cup’s depth. The time duration of the handle is about one-third the length of time as the cup’s duration. A shallower cup may lead to less time spent in the handle, indicating underlying strength.
5. Break Out Above Resistance – The Final Confirmation
As the handle completes, prices would rally again to retest the handle and cup resistance. A successful break of the handle would trigger a bullish entry. A successful breakout typically includes increased volume as buyers arrive in large numbers. Sometimes, after a breakout, the price may linger near the breakout point or circle back to retest the point of breakout. These occurrences are typical when resistance breaks. The target price for a cup and handle pattern is a measured move of the distance of the cup applied to the breakout of the handle pattern.
These rules aren’t just about recognising chart patterns and shapes – they’re about understanding market psychology of the mass traders involved in trading the asset.
Can the Cup and Handle Chart Pattern Be Found in Bear Markets?
The cup and handle pattern, while predominantly a bullish continuation pattern in bullish or neutral markets, can also emerge in bear markets. However, its interpretation and effectiveness may differ in such conditions.
In a bear market, this technical indicator might indicate a potential reversal or a slowdown in the selling pressure, suggesting an attempt by the market to stabilise and a shift towards bullish sentiment. This often happens when certain sectors, assets, or stock prices show strength against the general market downtrend.
However, caution is essential. The pattern’s reliability in a bear market may not match its strength in a bullish environment. Overall bearish market sentiment can overshadow individual bullish signals. Therefore, it’s important to consider the broader market trends and market sentiment when you spot this pattern.
If the broader market is rallying in an uptrend, then the cup and handle pattern is more likely to succeed. If the broader market is correcting, then any breakouts are likely to be weak and fail.
What Are the Expected Price Movements After a Cup and Handle Pattern?
Here’s what you can typically expect in terms of price movements following the completion of a cup and handle pattern:
- Breakout Surge: The key movement is at the breakout point of the handle’s resistance, often accompanied by increased volume, leading to a sharp upward move.
- Potential Pullback: A post-breakout pullback or retest of the breakout level is common. This offers traders an entry opportunity if they missed the initial breakout point. However, the price shouldn’t drop below the handle’s support level to maintain the bullish signal.
- Continued Uptrend: After the breakout and any pullback, an uptrend is expected. The length and strength of this trend, often indicated by trading volume, usually align with the direction of the breakout.
- Price Target Projection: Traders usually set a price target by measuring the vertical distance from the bottom of the cup to the resistance level of the handle. Then, they extend that same distance upward from the breakout point to arrive at the measured move target.
What Factors Contribute to the Reliability of the Cup and Handle Pattern?
The reliability of the cup and handle pattern depends on several factors. Recognising these factors can help you assess the strength and validity of the pattern before making a trade decision:
Duration of the Pattern
Generally, a longer duration between the formation of the cup and handle increases the reliability of the pattern. On average, the entire pattern should develop over several weeks to several months, with the cup typically taking 1 to 6 months to form, followed by the handle, which usually lasts for 1 to 4 weeks. This prolonged accumulation phase indicates stronger buying pressure and a greater potential for a breakout.
Volume
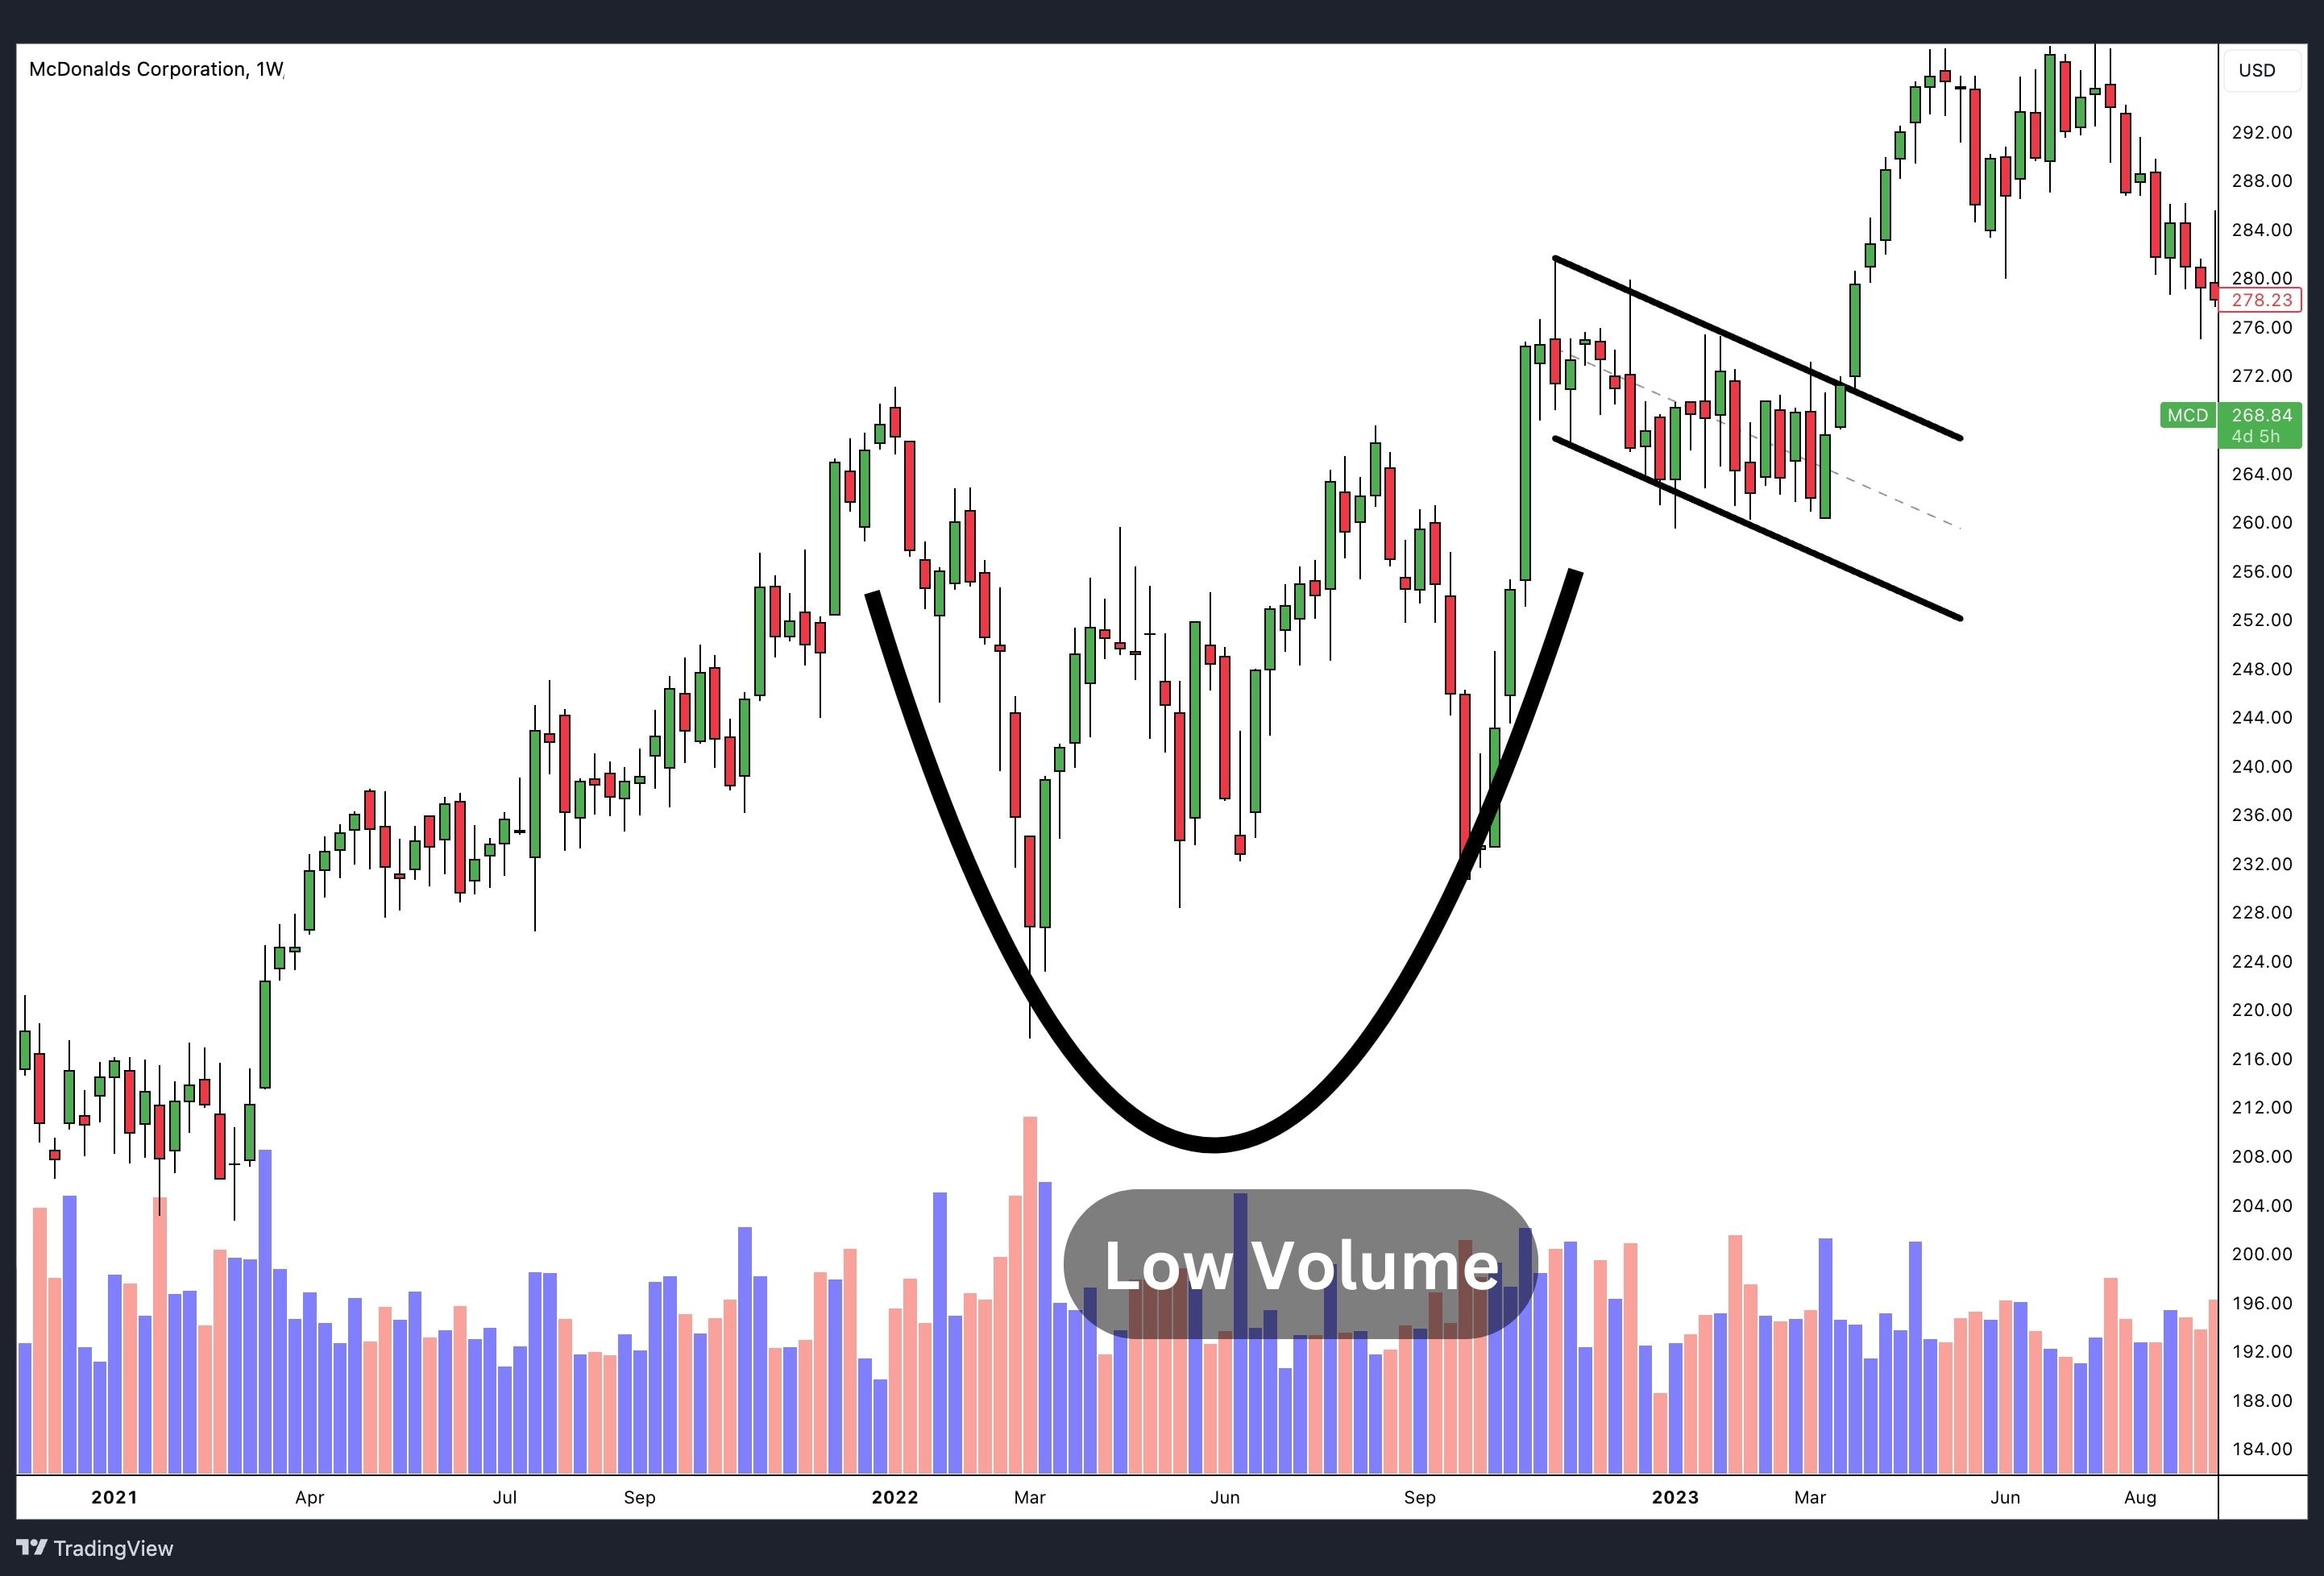
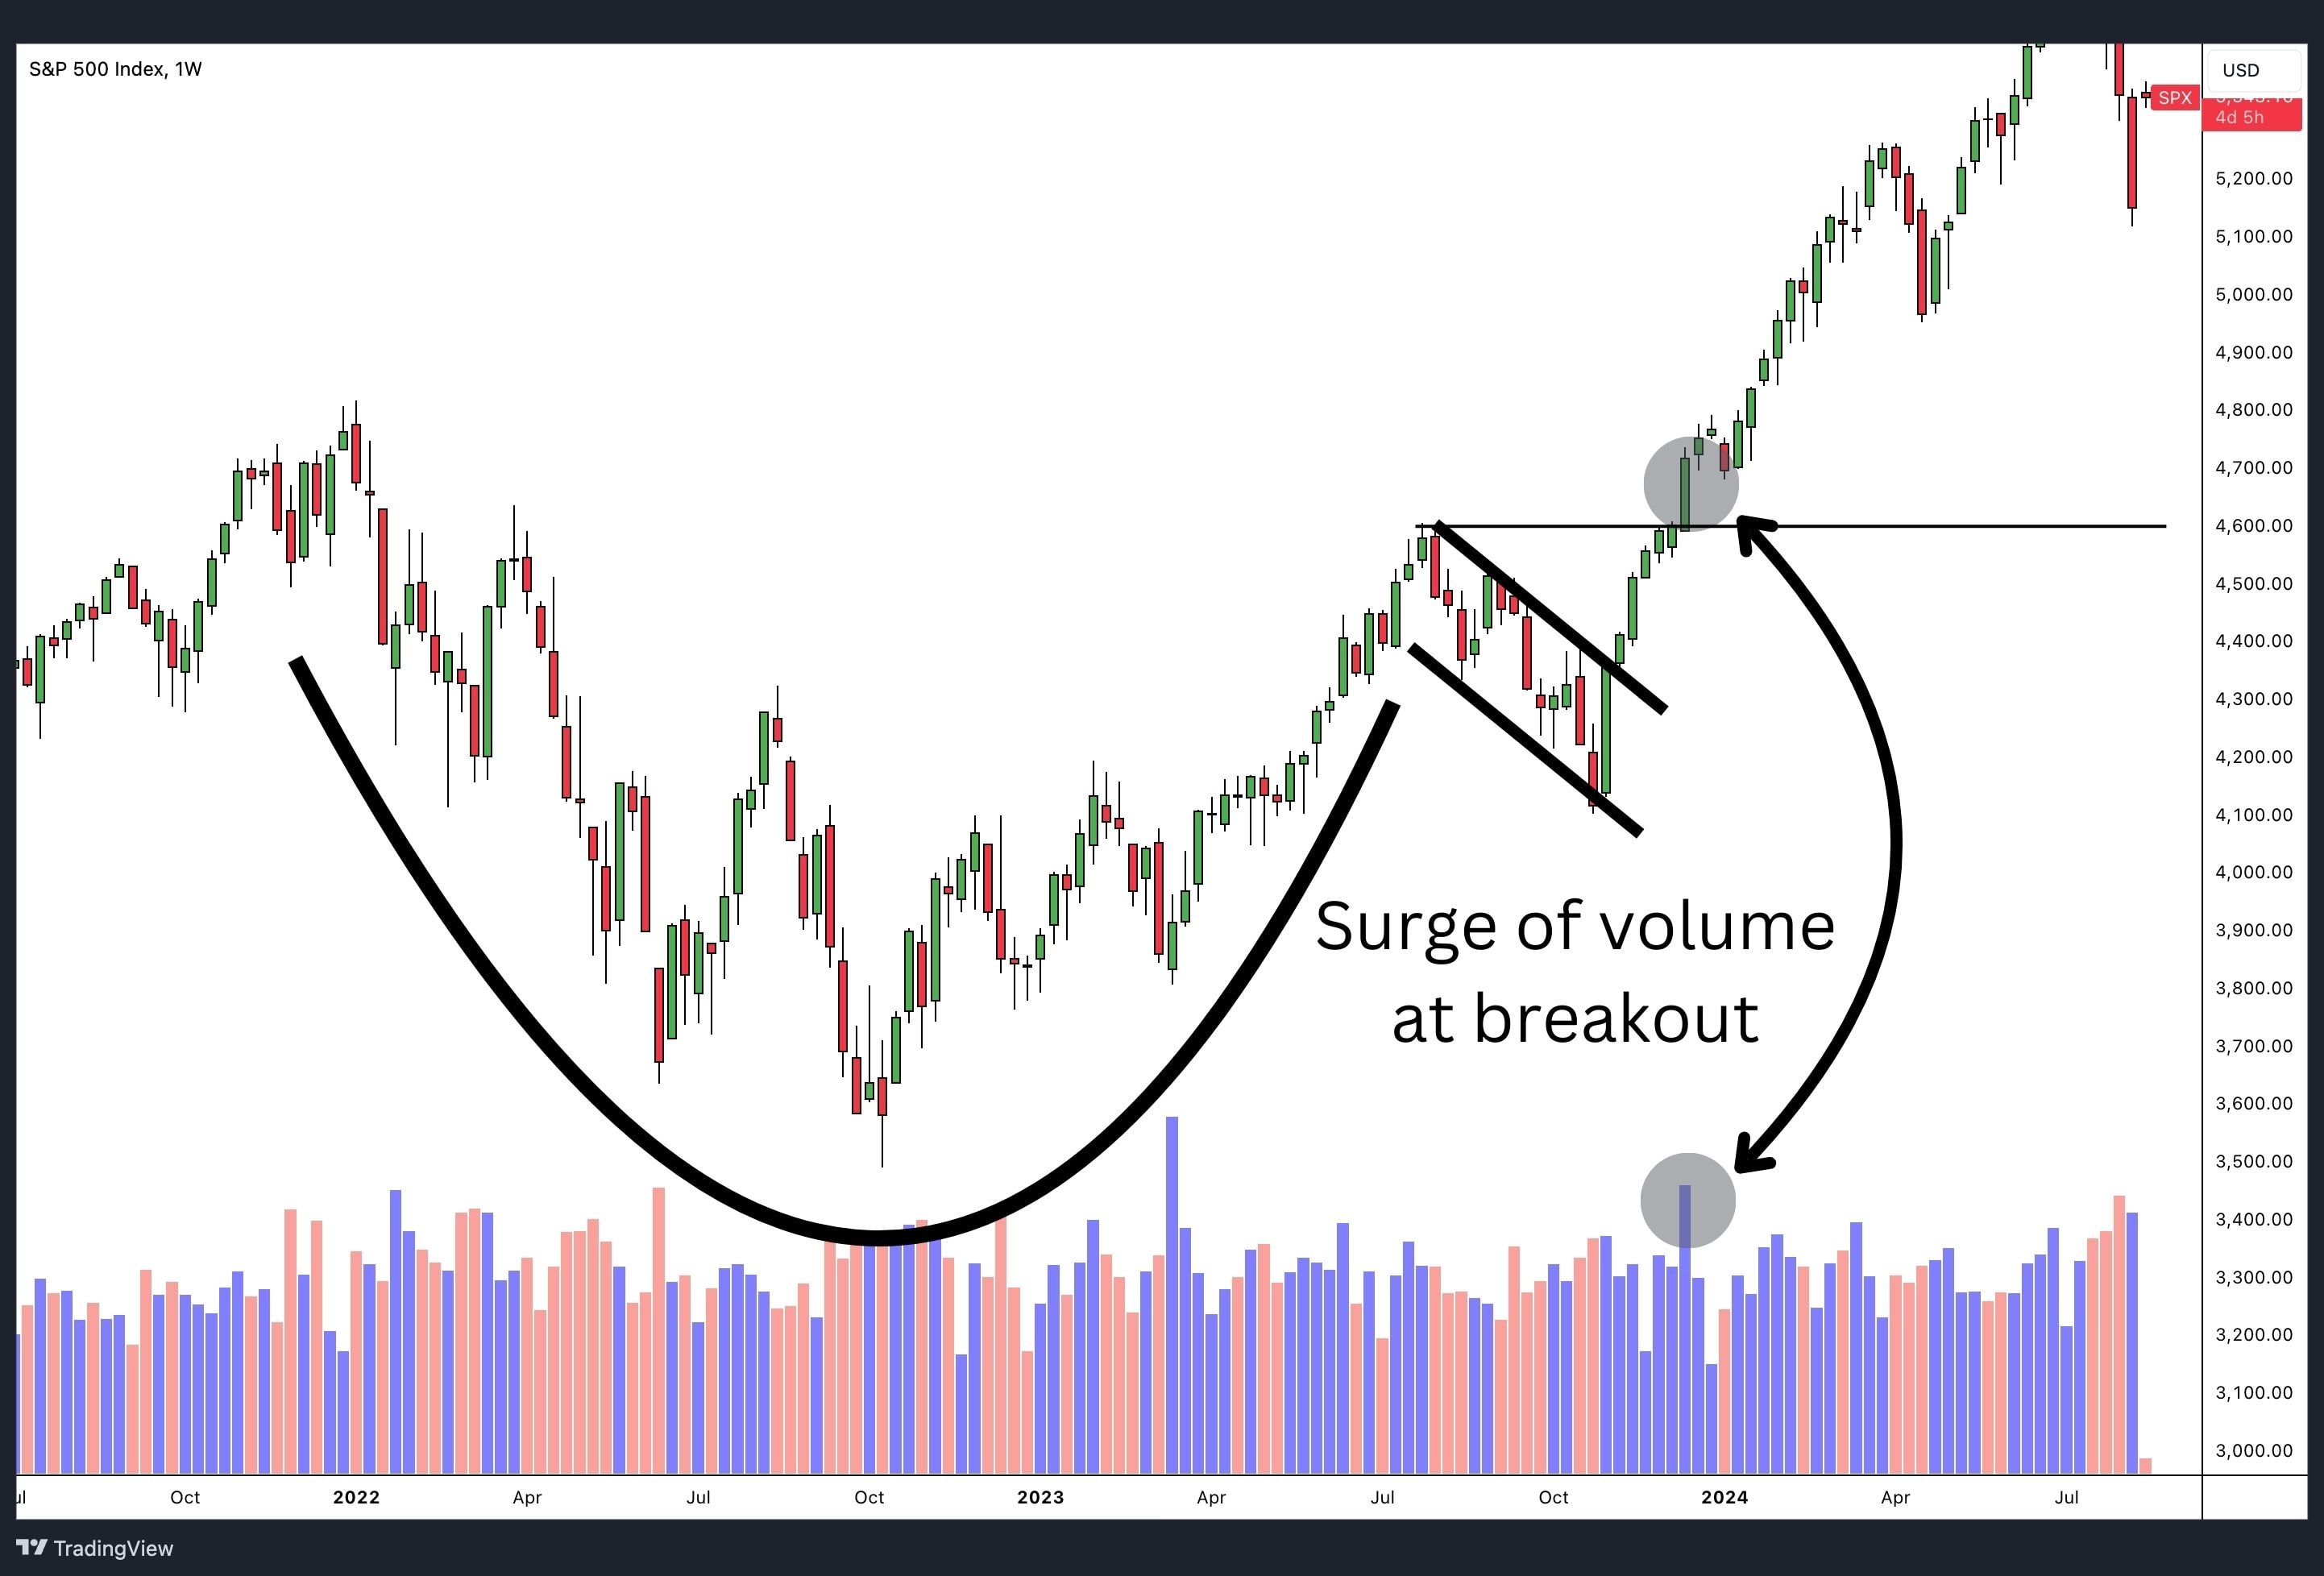
During the initial phase of the cup formation, the volume should decline, followed by a subsequent increase in volume during the second half of the cup and the handle formation. This pattern indicates a decrease in selling pressure and a rise in buying interest, reinforcing the pattern’s credibility.
Handle Length
A shorter handle is preferred as it shows a more immediate continuation of the uptrend after the consolidation. Ideally, the handle should form over 1 to 4 weeks. Handles that take longer to form can indicate a weaker breakout and increase the potential for a trend reversal. It all depends on the overall timeframe the cup and handle pattern presents itself.
Cup Depth
Ideally, the depth of the cup should fall within the range of one-third to two-thirds (38.2%-61.8% retracement level) of the previous uptrend’s length. This specific range indicates a healthy market correction and enhances the reliability of the pattern.
Handle Formation
The handle should ideally take a symmetrical and downward-sloping form, resembling a flag or pennant in some instances. This visual pattern signifies a gradual reduction in selling pressure and a rise in bullish sentiment, thereby reinforcing the reliability of the pattern.
Retracement Level
If the handle retraces and closes below the 50% retracement level of the previous uptrend’s length, it may suggest a weakened pattern and the possibility of a trend reversal.
Confirmation
The cup and handle pattern is confirmed when the price surpasses the resistance level of the handle, accompanied by high trading volume. This signals robust buying interest and serves as validation for the pattern.
With these factors in mind, let’s take a look at some examples of the cup and handle pattern.
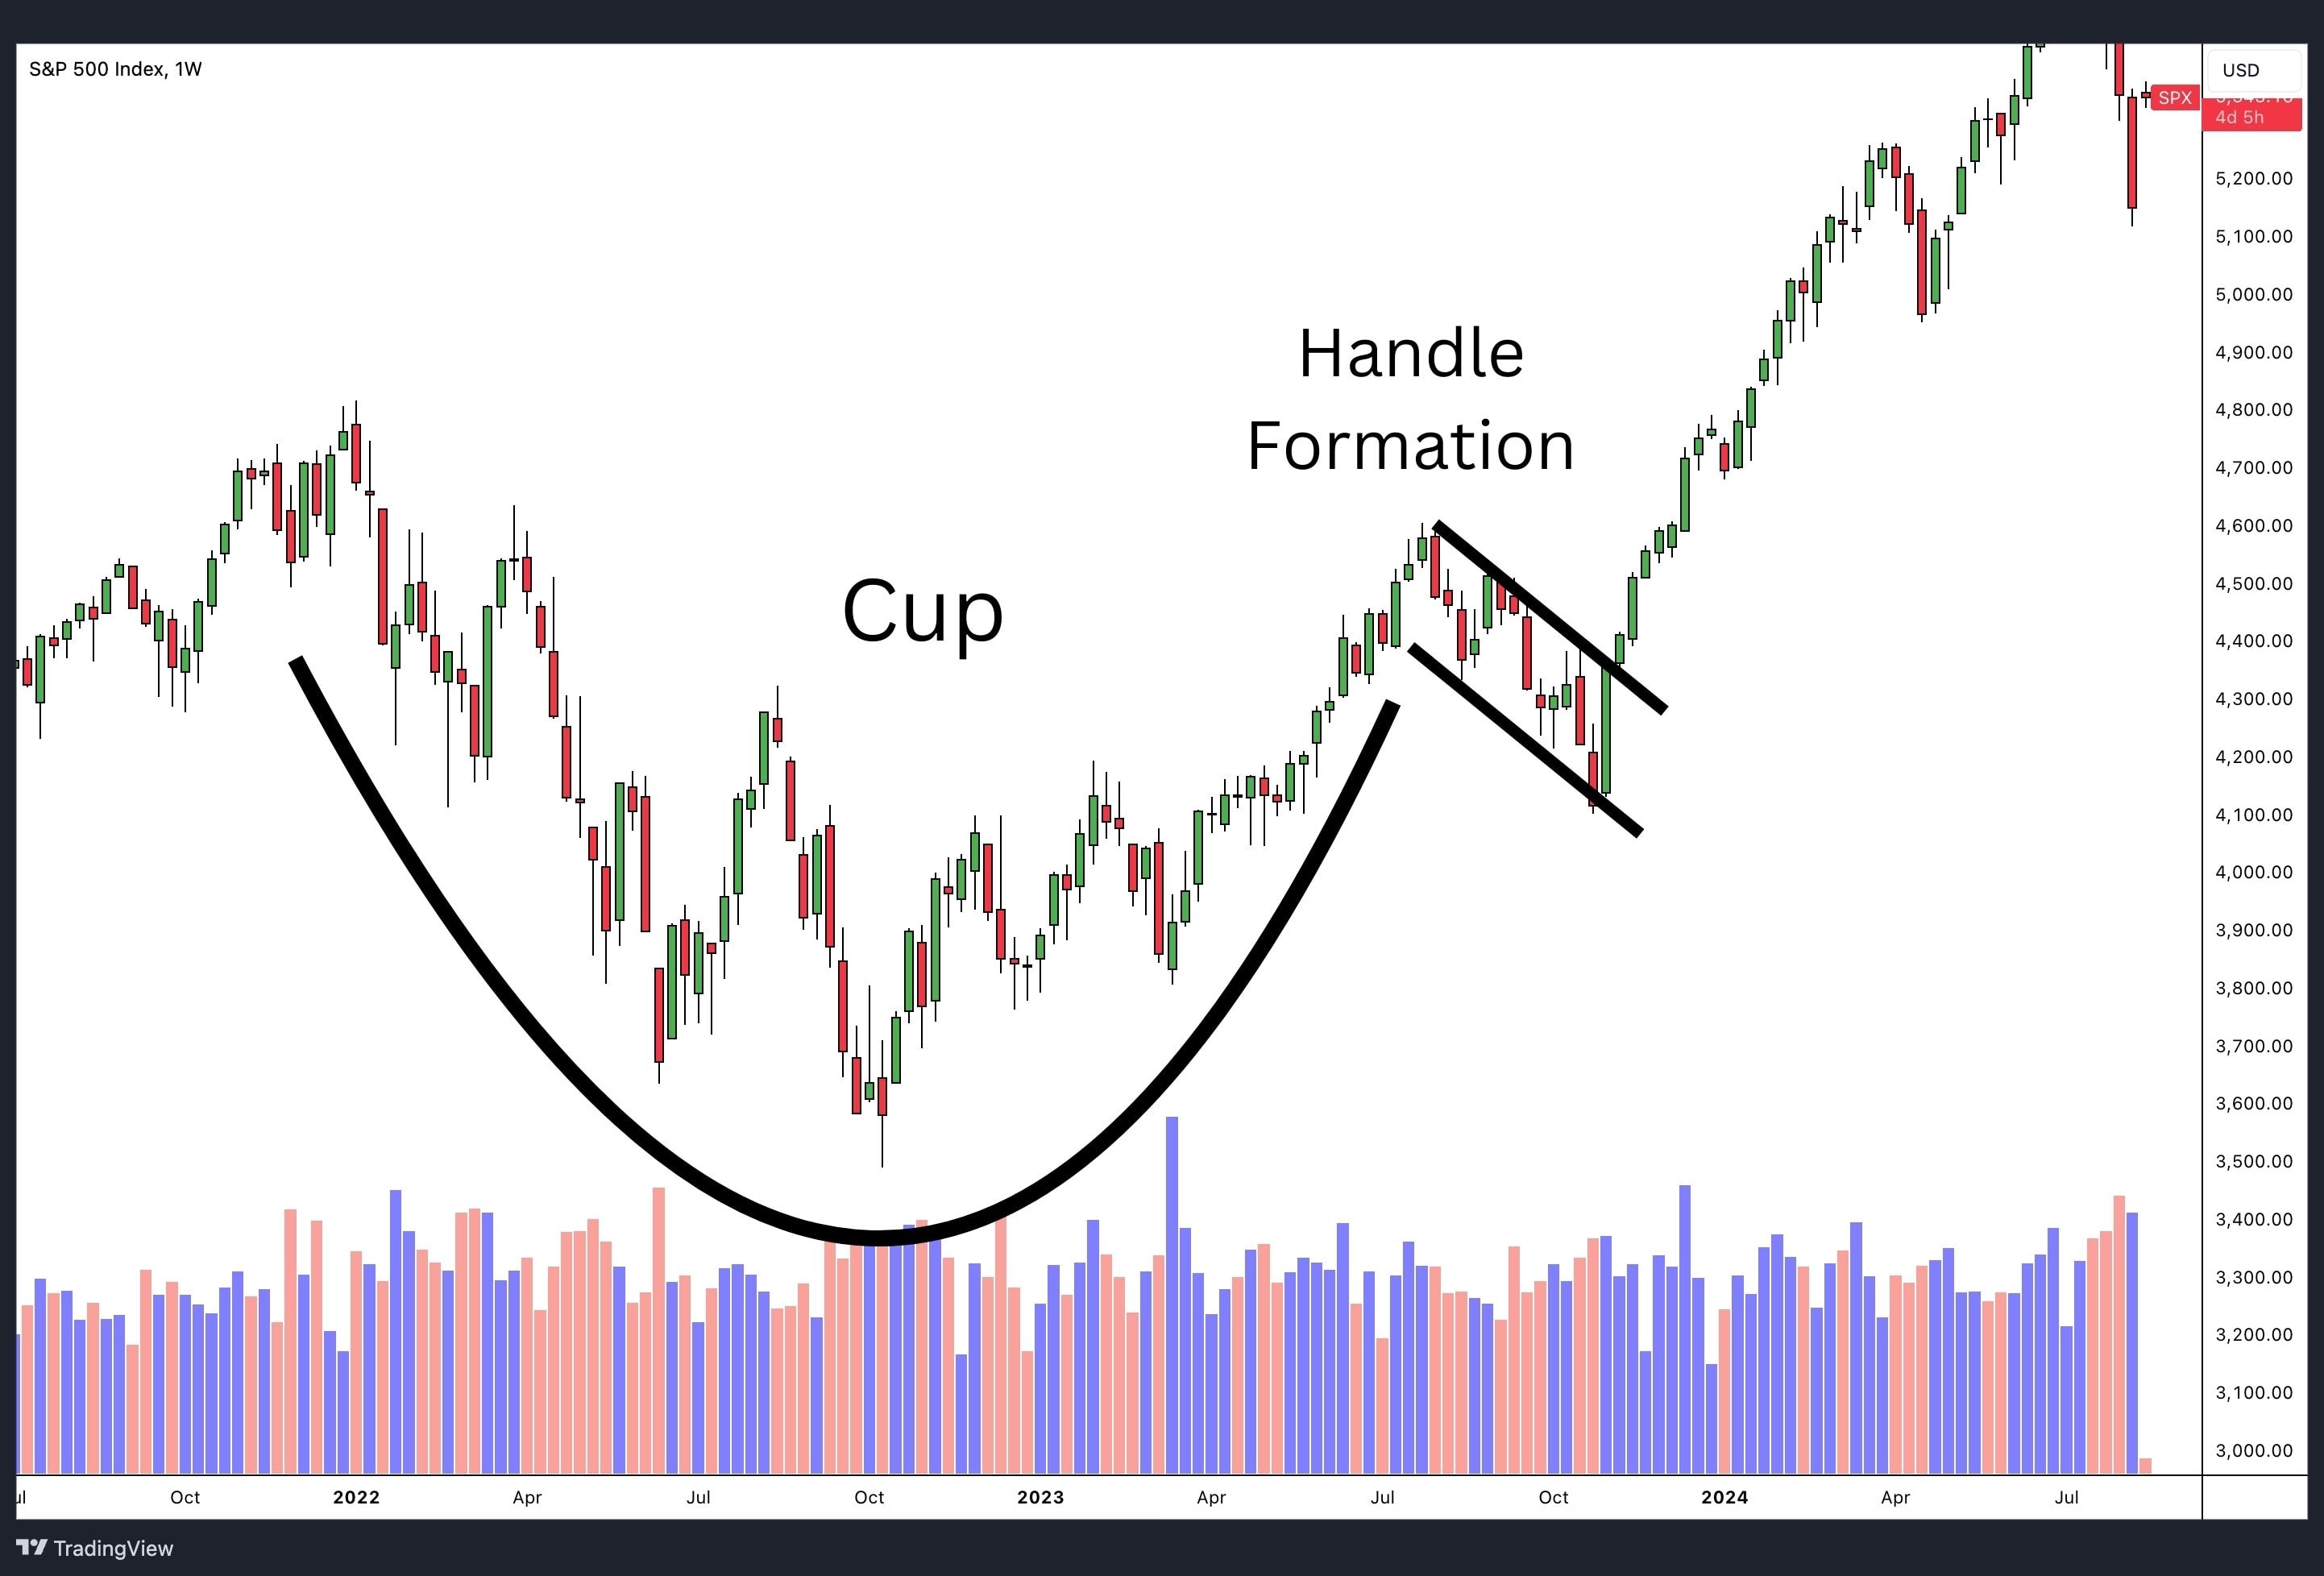
Cup and Handle Pattern Examples
Silver
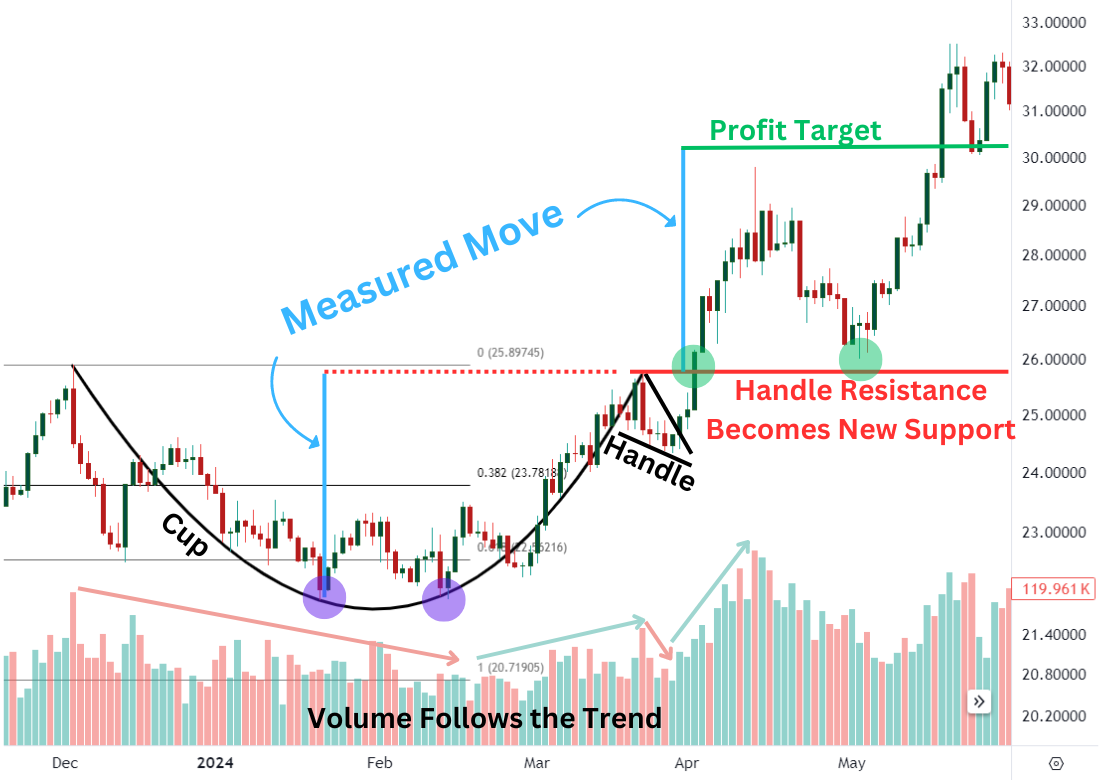
In December 2023, silver prices reached a high of $25.893 before falling to the January 2024 low of $21.904, shaping the left side of the cup. The left side of the cup retraced slightly more than 61.8% of the previous uptrend.
After a period of consolidation, prices began to rise in an effort to return to prior levels, shaping the right side of the cup. Interestingly, the consolidation at the bottom of the cup was a double bottom pattern (purple circles). The double bottom is a bullish pattern that signals when a trend may change from down to up. In this case, the double bottom shaped the bottom of the cup.
Notice how volume was declining as the left side of the cup was formed, then volume began to increase shaping the right side. As the handle was formed, volume again declined, illustrating how volume tends to display the trend.
The peak of the right side of the cup occurred just above the key psychological level of $25, which was followed by a decline to $24 (the handle). The handle formed in a falling wedge shape, shaking out the last weak holders. Then, the price broke above handle resistance and eventually continued higher.
Silver prices just missed the measured move target and declined back to the breakout point on declining volume. Resistance, when broken, turns into new support for prices, and that is what happened to silver.
As prices approached the support zone created by the previous handle resistance, a dragonfly doji formed, signalling a resumption of the uptrend, reaching the measured move profit target.
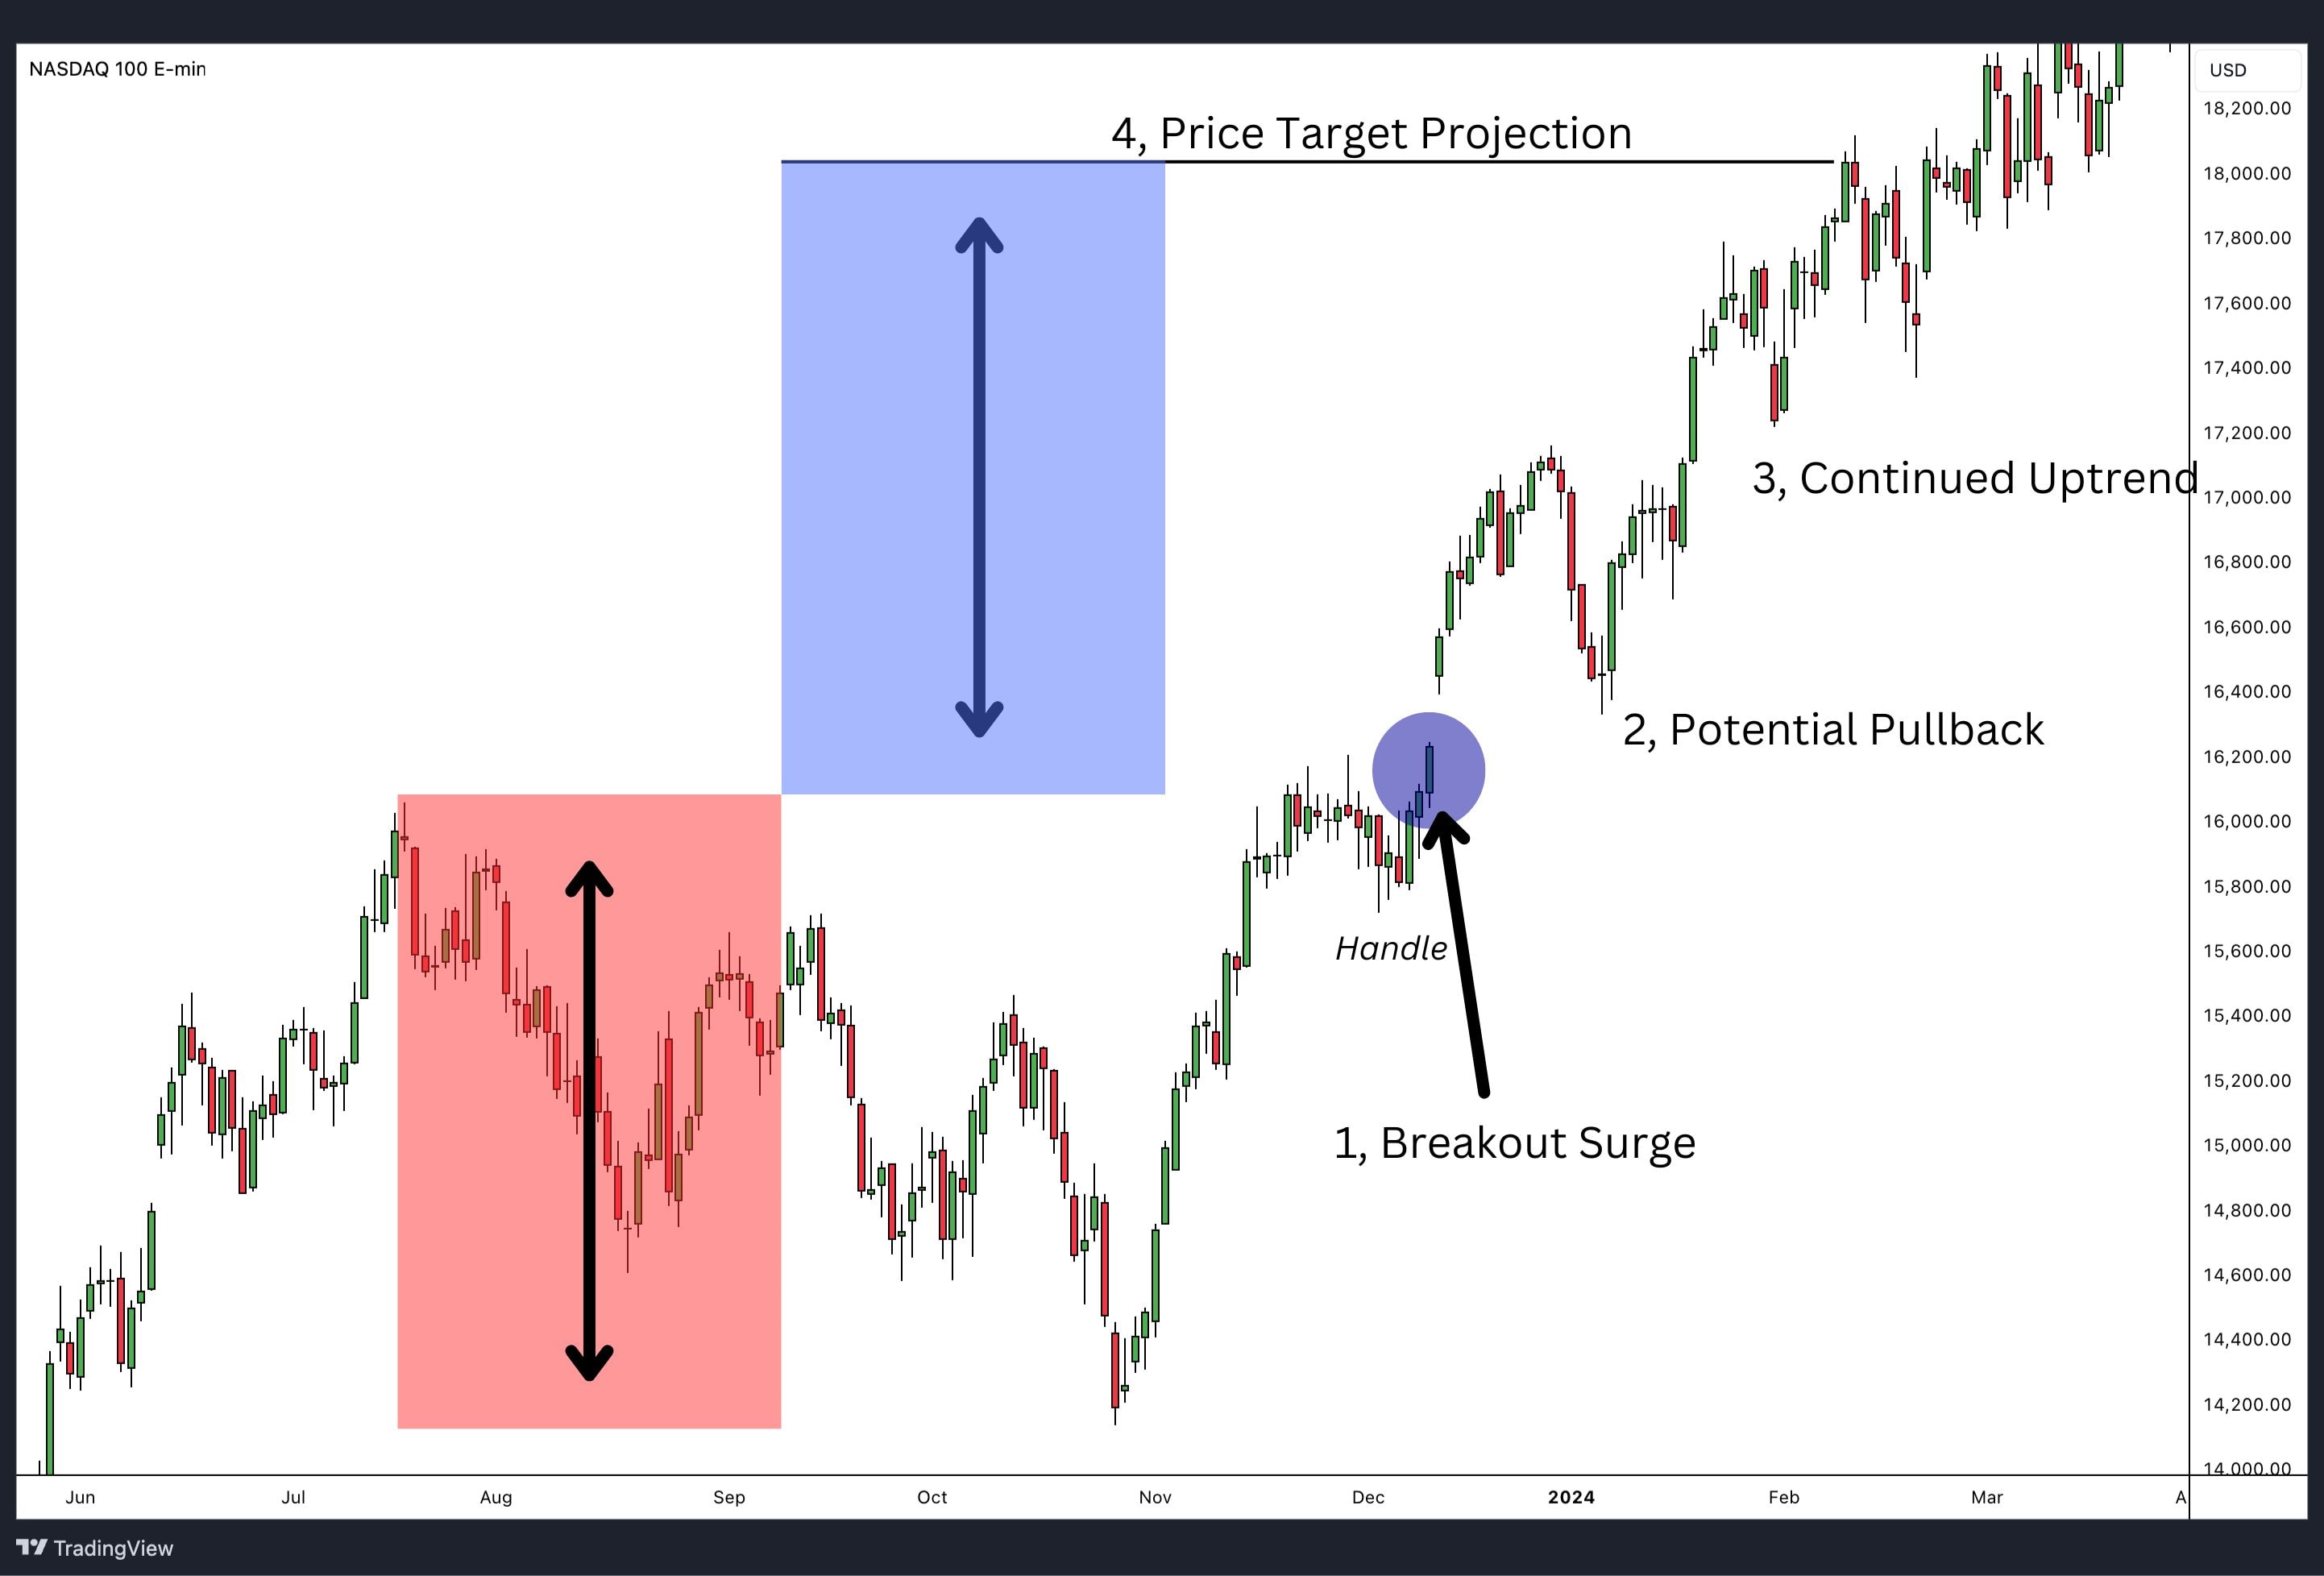
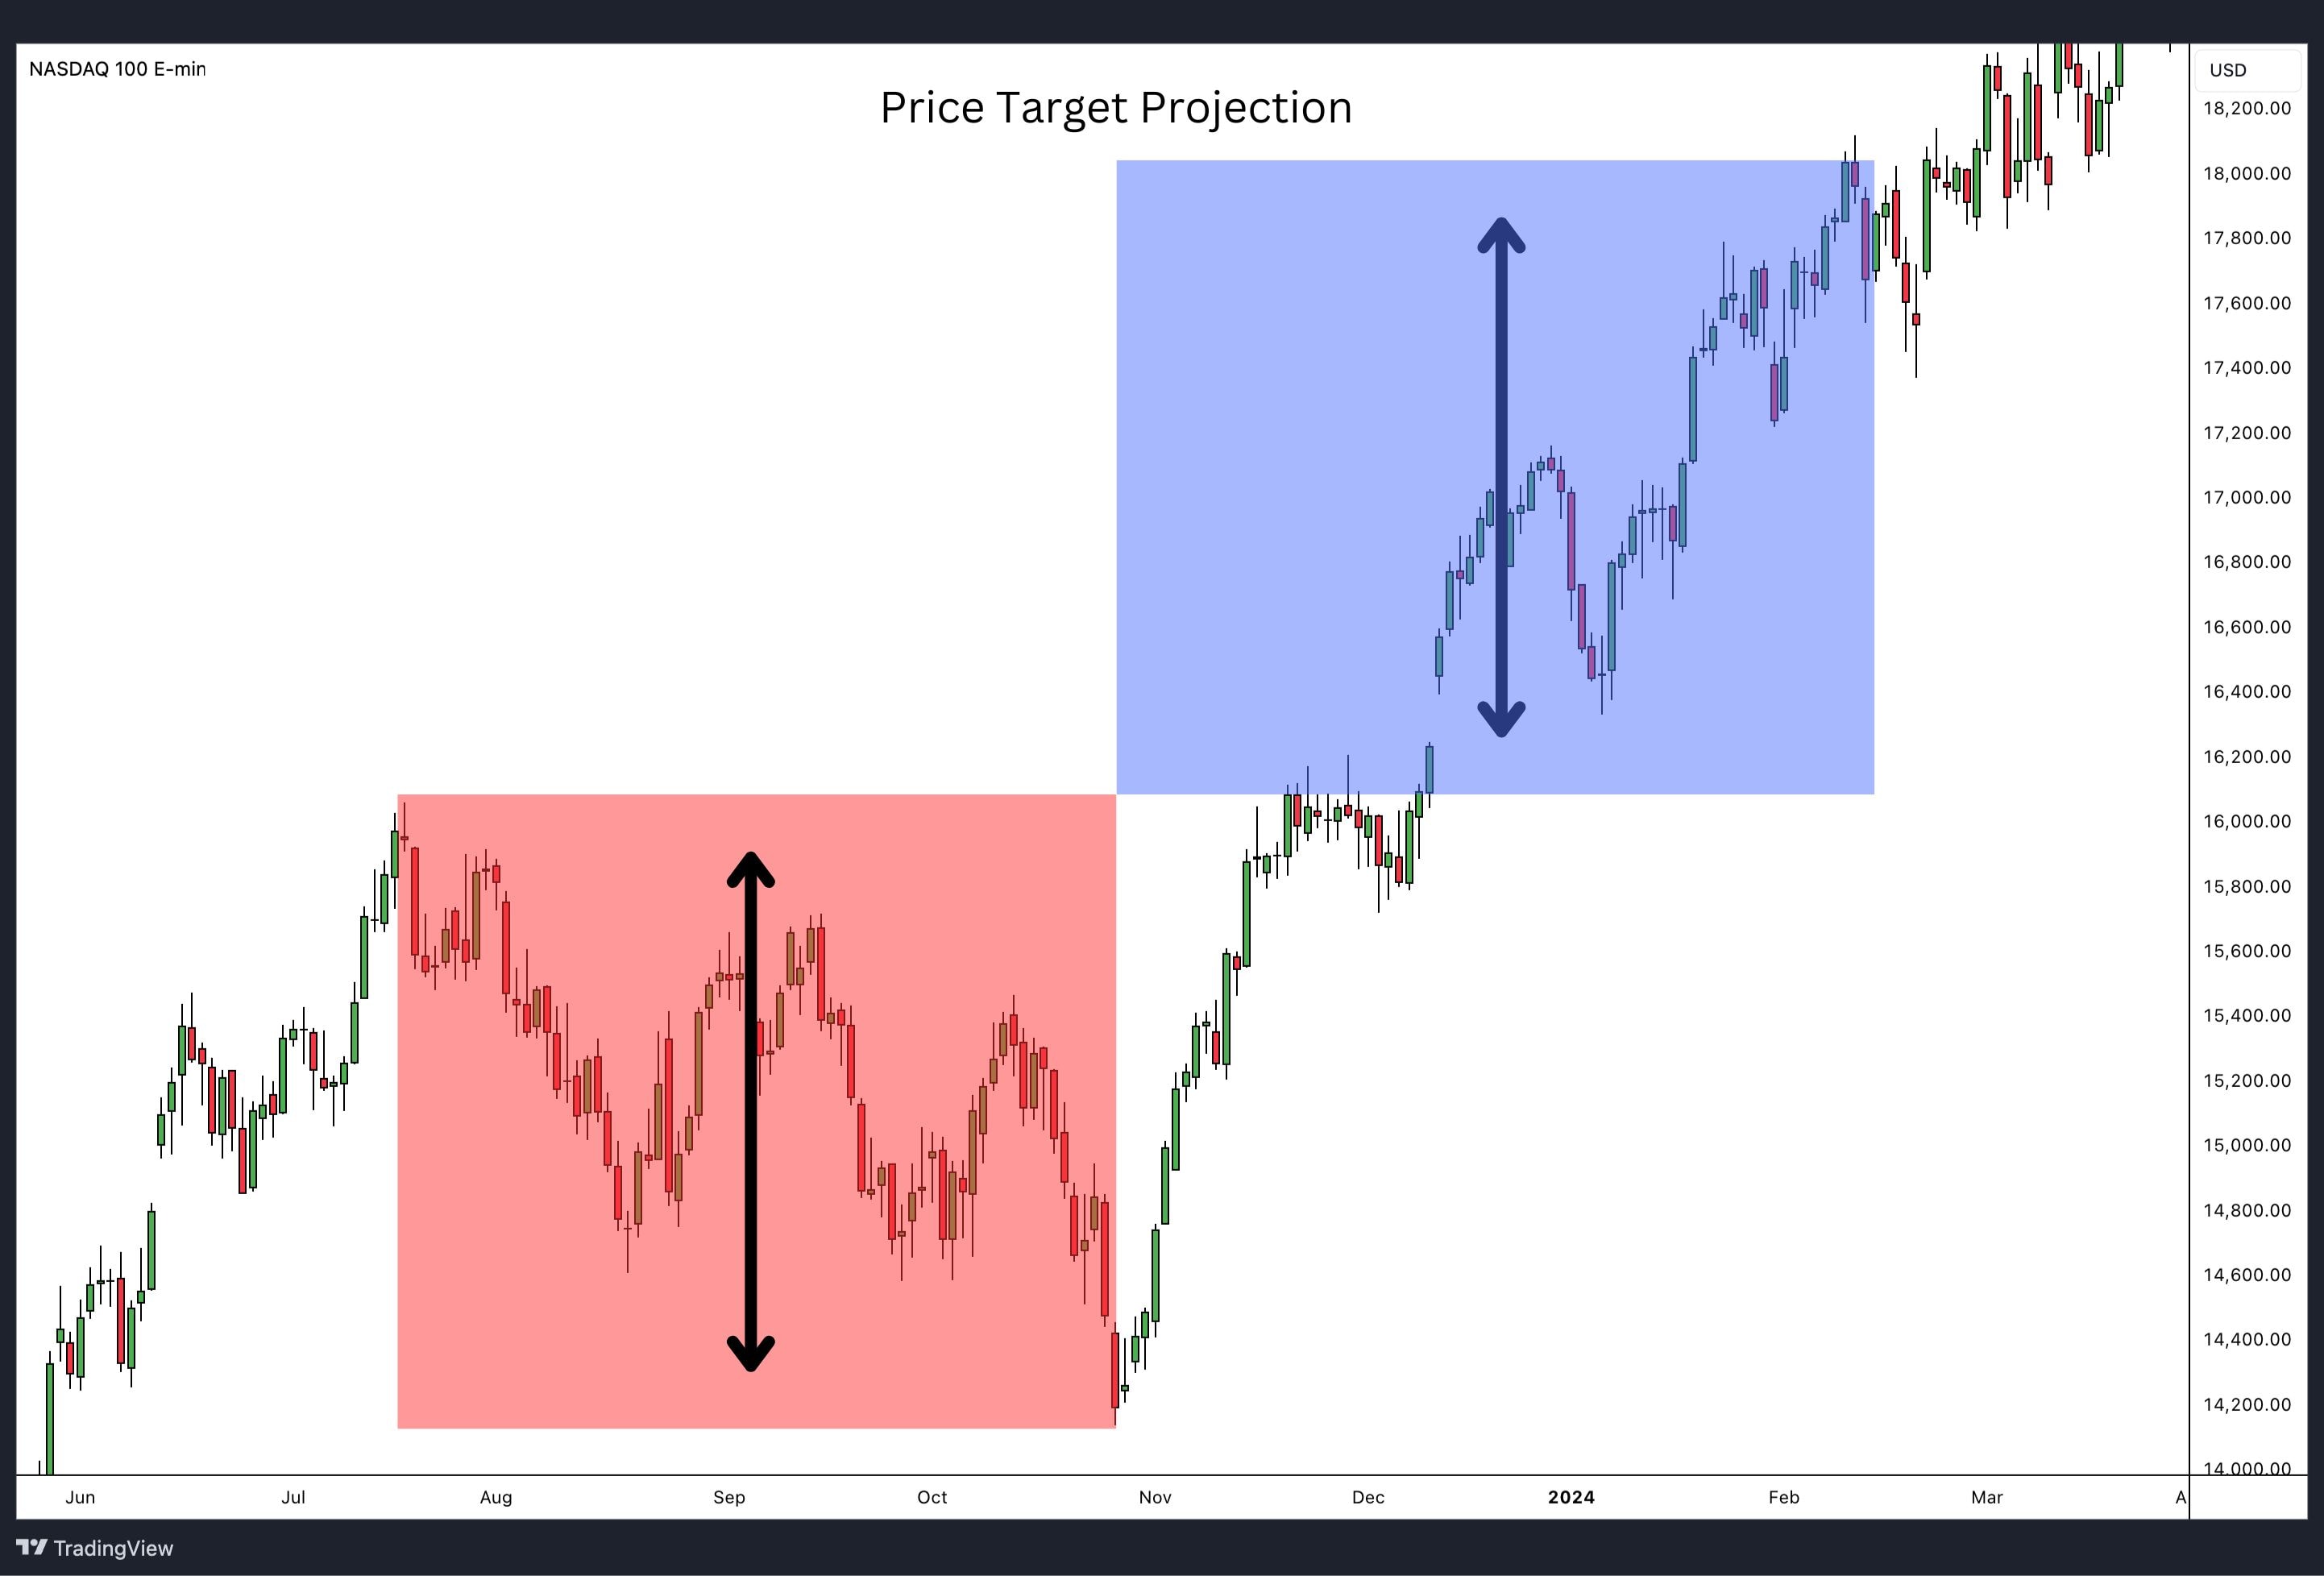
NASDAQ
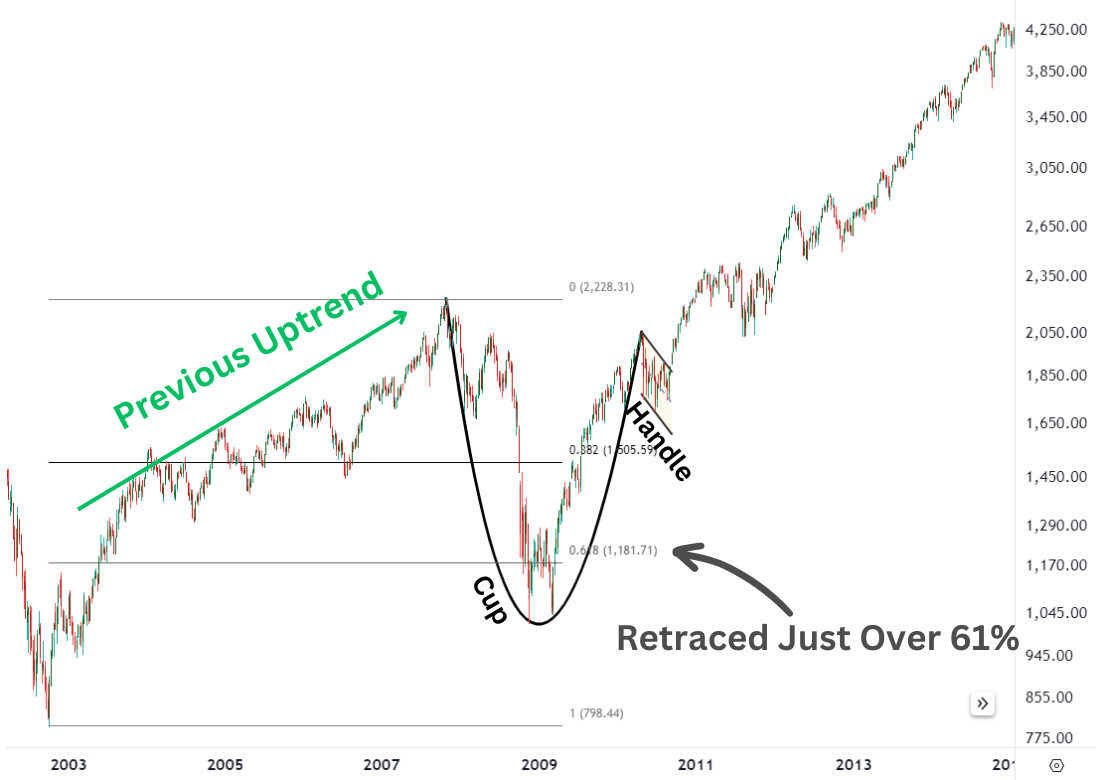
A market index like the Nasdaq 100 might exhibit a Cup and Handle formation over several months or years. During the credit freeze of 2007-2008, the Nasdaq 100 (NDQ) retraced just slightly more than 61.8% of the previous uptrend as stock market valuations were significantly reduced.
As the markets began to thaw from the freeze, the NDQ rallied back to near its old high but faltered, shaping the cup pattern.
Then, the handle began to develop and took shape like a bullish flag. In this instance, the handle is the flag portion of the bullish flag and signals a potential bullish breakout.
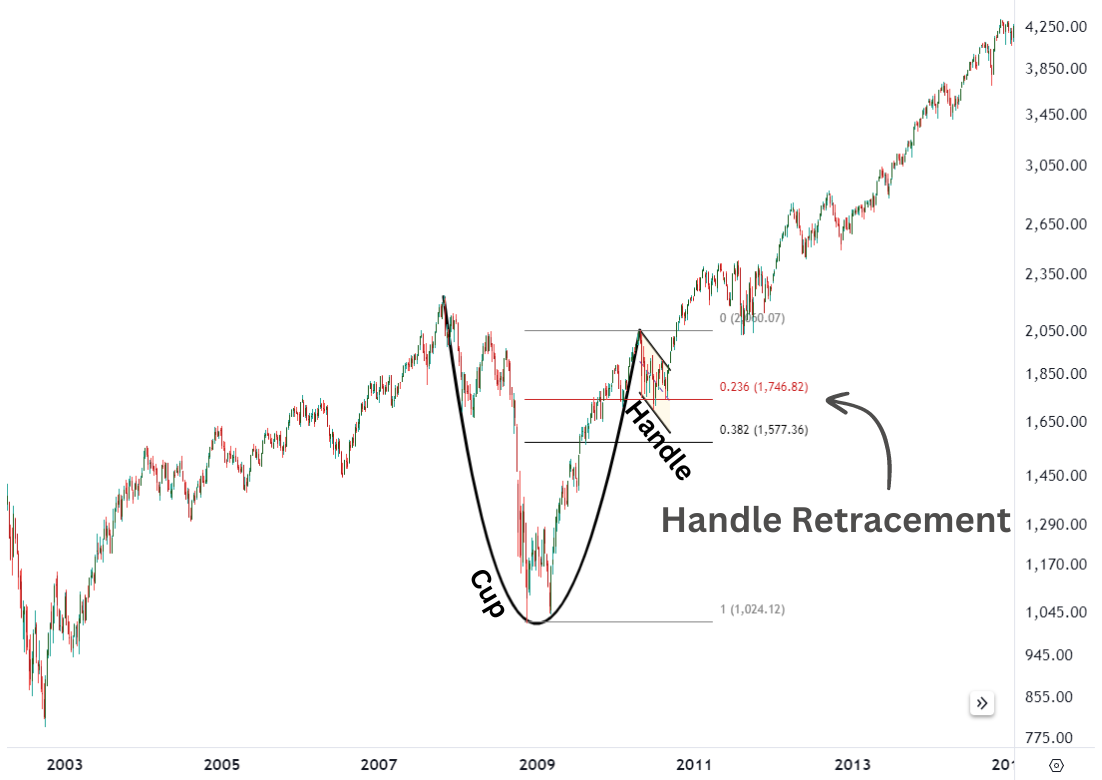
The handle pattern declined and retraced about 23% of the cup’s height, well within the guidelines for a handle to form. After spending four months carving the handle pattern, prices began to break out of the handle’s horizontal line acting as resistance.
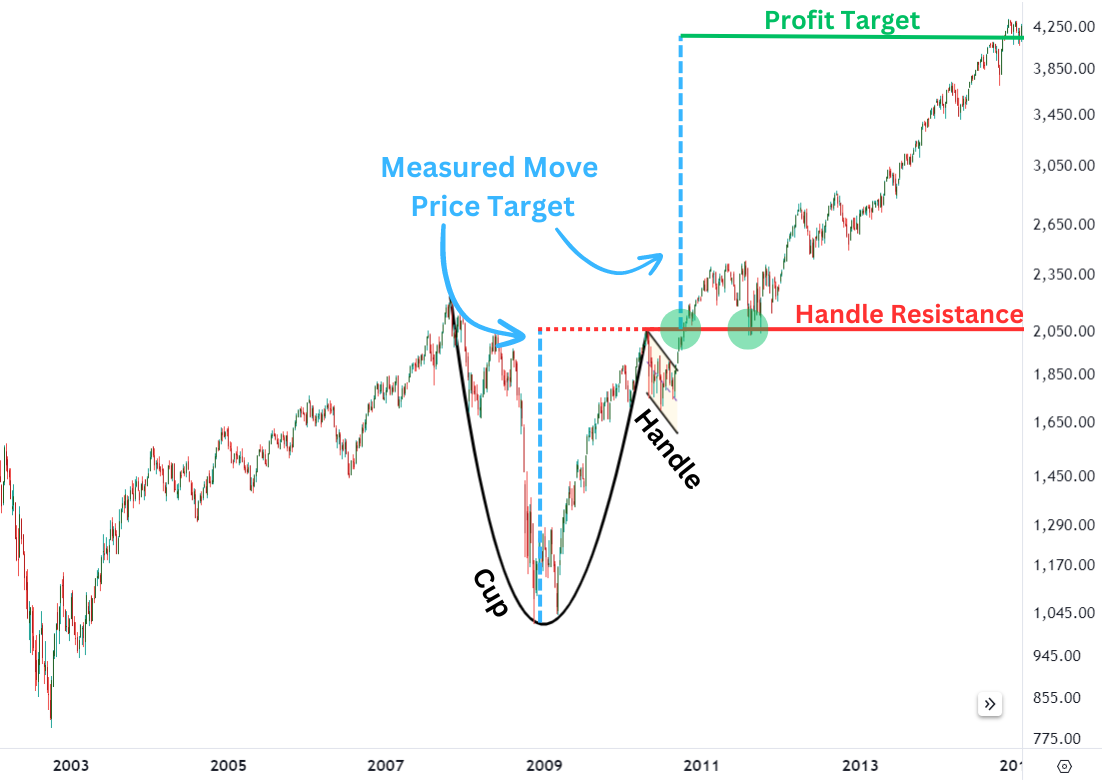
The measured move in this example is the blue dotted line measuring the depth of the cup to the high of the handle, then projecting that distance from the handle high.
The NDQ broke higher, then retraced back to the breakout point. The former resistance became new support and a launchpad for the NDQ to jump higher. Prices eventually reached the profit target several years later.
When to Trade the Cup and Handle Pattern?
Timing is a critical aspect of trading. The same applies when trading with the cup and handle, or any pattern for that matter. Here are some key considerations for timing your trade with this pattern, including evaluating the risk-to-reward ratio:
During Pattern Formation
While the cup and handle pattern is predominantly traded as a complete formation, you can also trade it by stages as the market reacts to certain pre-determined key levels. Since it is uncertain whether a full cup and handle will form, these strategies may not offer as favourable risk-to-reward ratios as waiting for a breakout above the handle. Here are the steps for trading during the pattern formation:
From the Cup’s Bottom
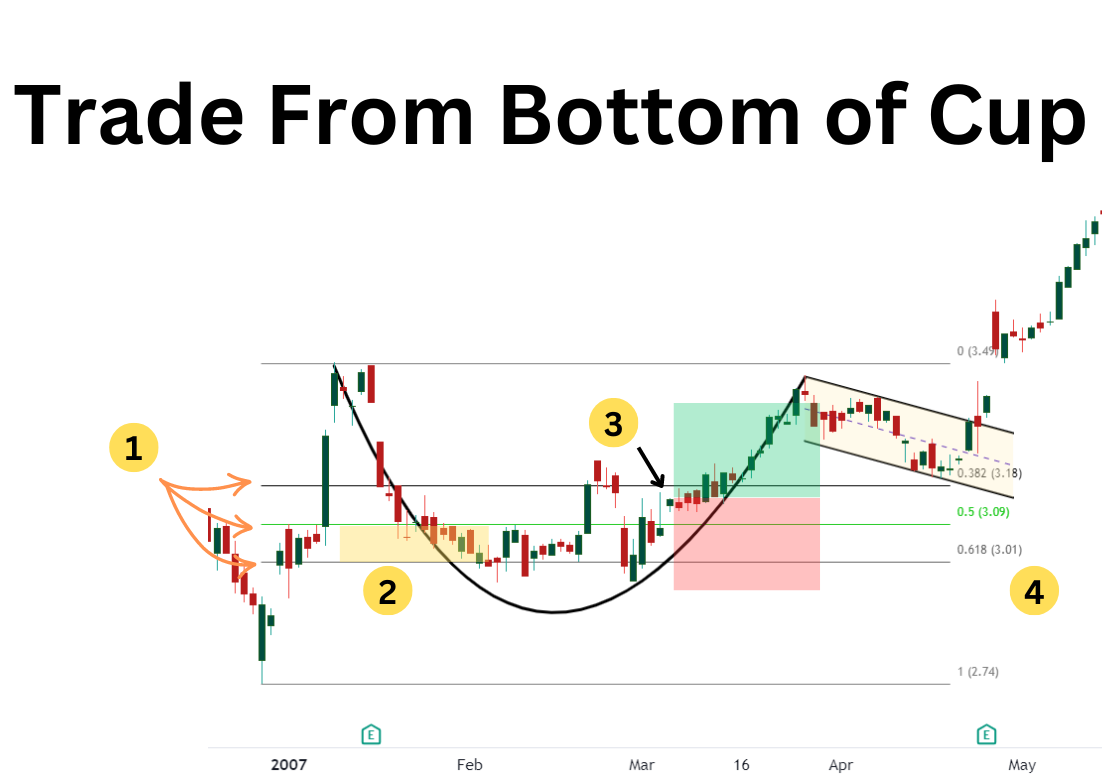 Step 1: Utilize the Fibonacci Retracement Tool
Drag the Fibonacci Retracement tool from the lowest point to the highest point of the previous uptrend. Set the retracement levels at 38.2%, 50%, and 61.8%.
Step 2: Monitor Price Movement and Consolidation
Allow the price to reach the 50%-61.8% retracement level and consolidate for a period. Avoid entering the trade immediately as the price touches the Fibonacci levels. This consolidation phase may last for a while, ranging from days to weeks or even months.
Step 3: Wait for Final Confirmation
Wait for a final confirmation before proceeding. This confirmation can be obtained from additional technical indicators, volume analysis, significant rejections at support levels, anomalies, or candlestick patterns. For example, in the chart above, Apple (AAPL) gapped higher and held above the 50% retracement level, indicating a potential buy signal.
Step 4: Execute the Trade
Execute the trade upon receiving the final confirmation. Place stop orders below the cup’s bottom and set the price target at a 1:1 risk-to-reward ratio.
The Momentum Shift From the Cup’s Bottom
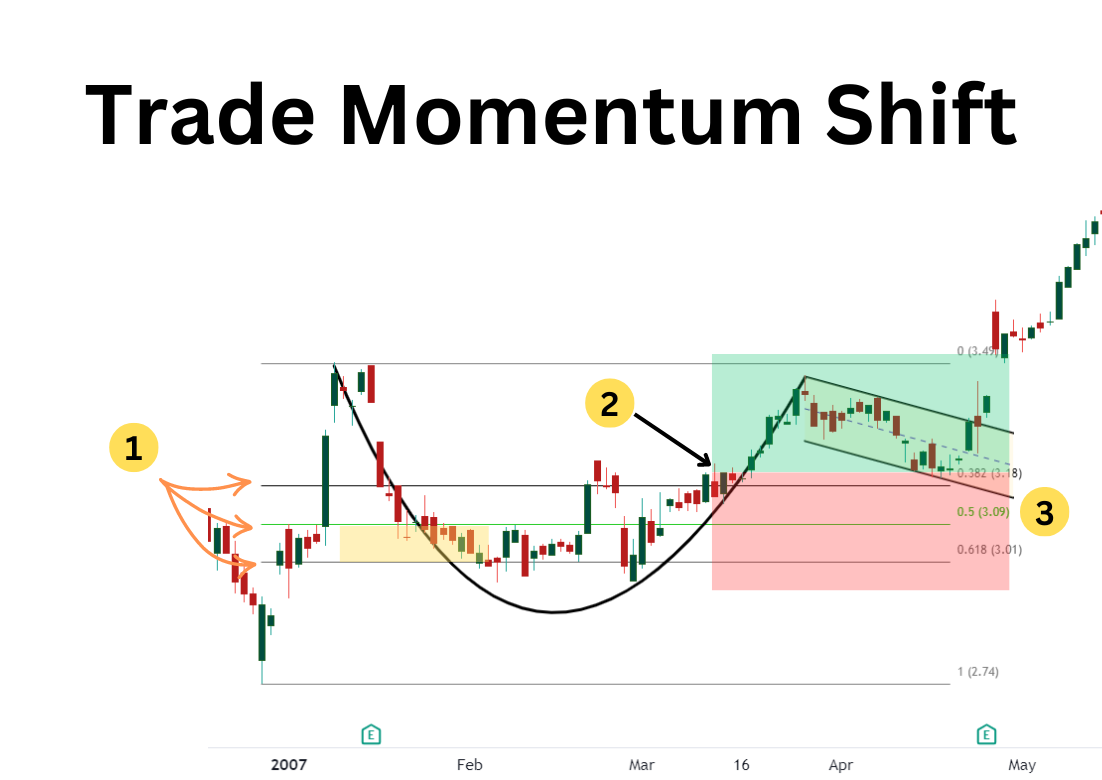 This trading strategy also offers an aggressive entry with a controlled risk zone. Here are the steps to follow for capitalising on the momentum shift from the cup’s bottom:
Step 1: Follow Initial Setup
Follow a similar process as when taking a trade from the cup’s bottom, but be patient and wait a little longer.
Step 2: Wait for Price Confirmation
Wait for the price to push above the 38.2% retracement level and form a strong bullish candle as a final confirmation.
Step 3: Execute the Trade
Execute the trade once the final confirmation is received. Place stop orders below the 61.8% retracement level and set a price target at the previous high. In the AAPL chart above, a bullish candle reclaimed the 38.2% Fibonacci retracement level. A trader would open a long position with a stop loss below the low of the cup, targeting the previous high.
After a Fully-Formed Cup and Handle
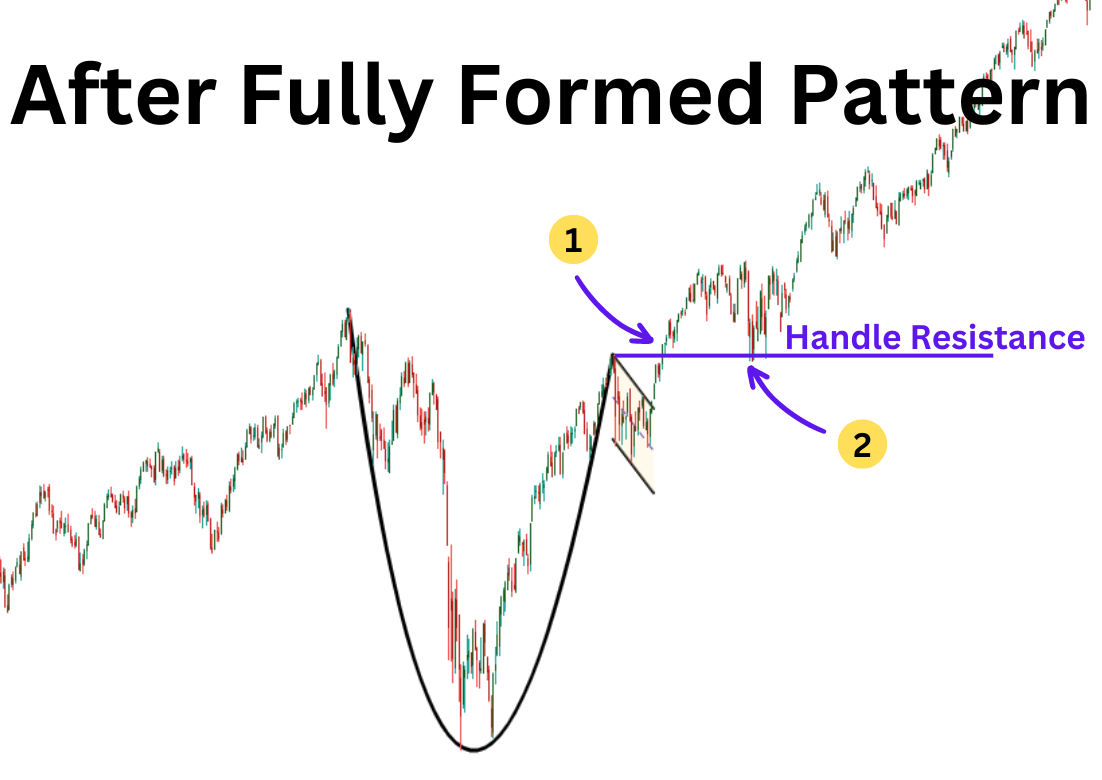
At the Breakout:
The optimal entry point is during the breakout when the price surpasses the resistance of the handle, preferably accompanied by an increase in volume. Entering at this point allows leveraging the initial bullish momentum.
After a Pullback (If Any):
A post-breakout pullback can provide another opportunity to enter the trade, especially for those who missed the initial breakout. It is essential to ensure that the pullback is stable and the price remains above the lower end of the handle.
Protecting Your Trade With Stop-Loss Orders
Incorporating stop-loss orders is a key component of risk management when trading the cup and handle pattern, or any chart pattern for that matter. Sometimes, the price movement isn’t what you expect, and the pattern fails.
Strategically setting stop-loss orders is essential to safeguard your investment against substantial losses if the market trends counter to your forecast. Below is a guide on positioning stop-loss orders while trading this pattern:
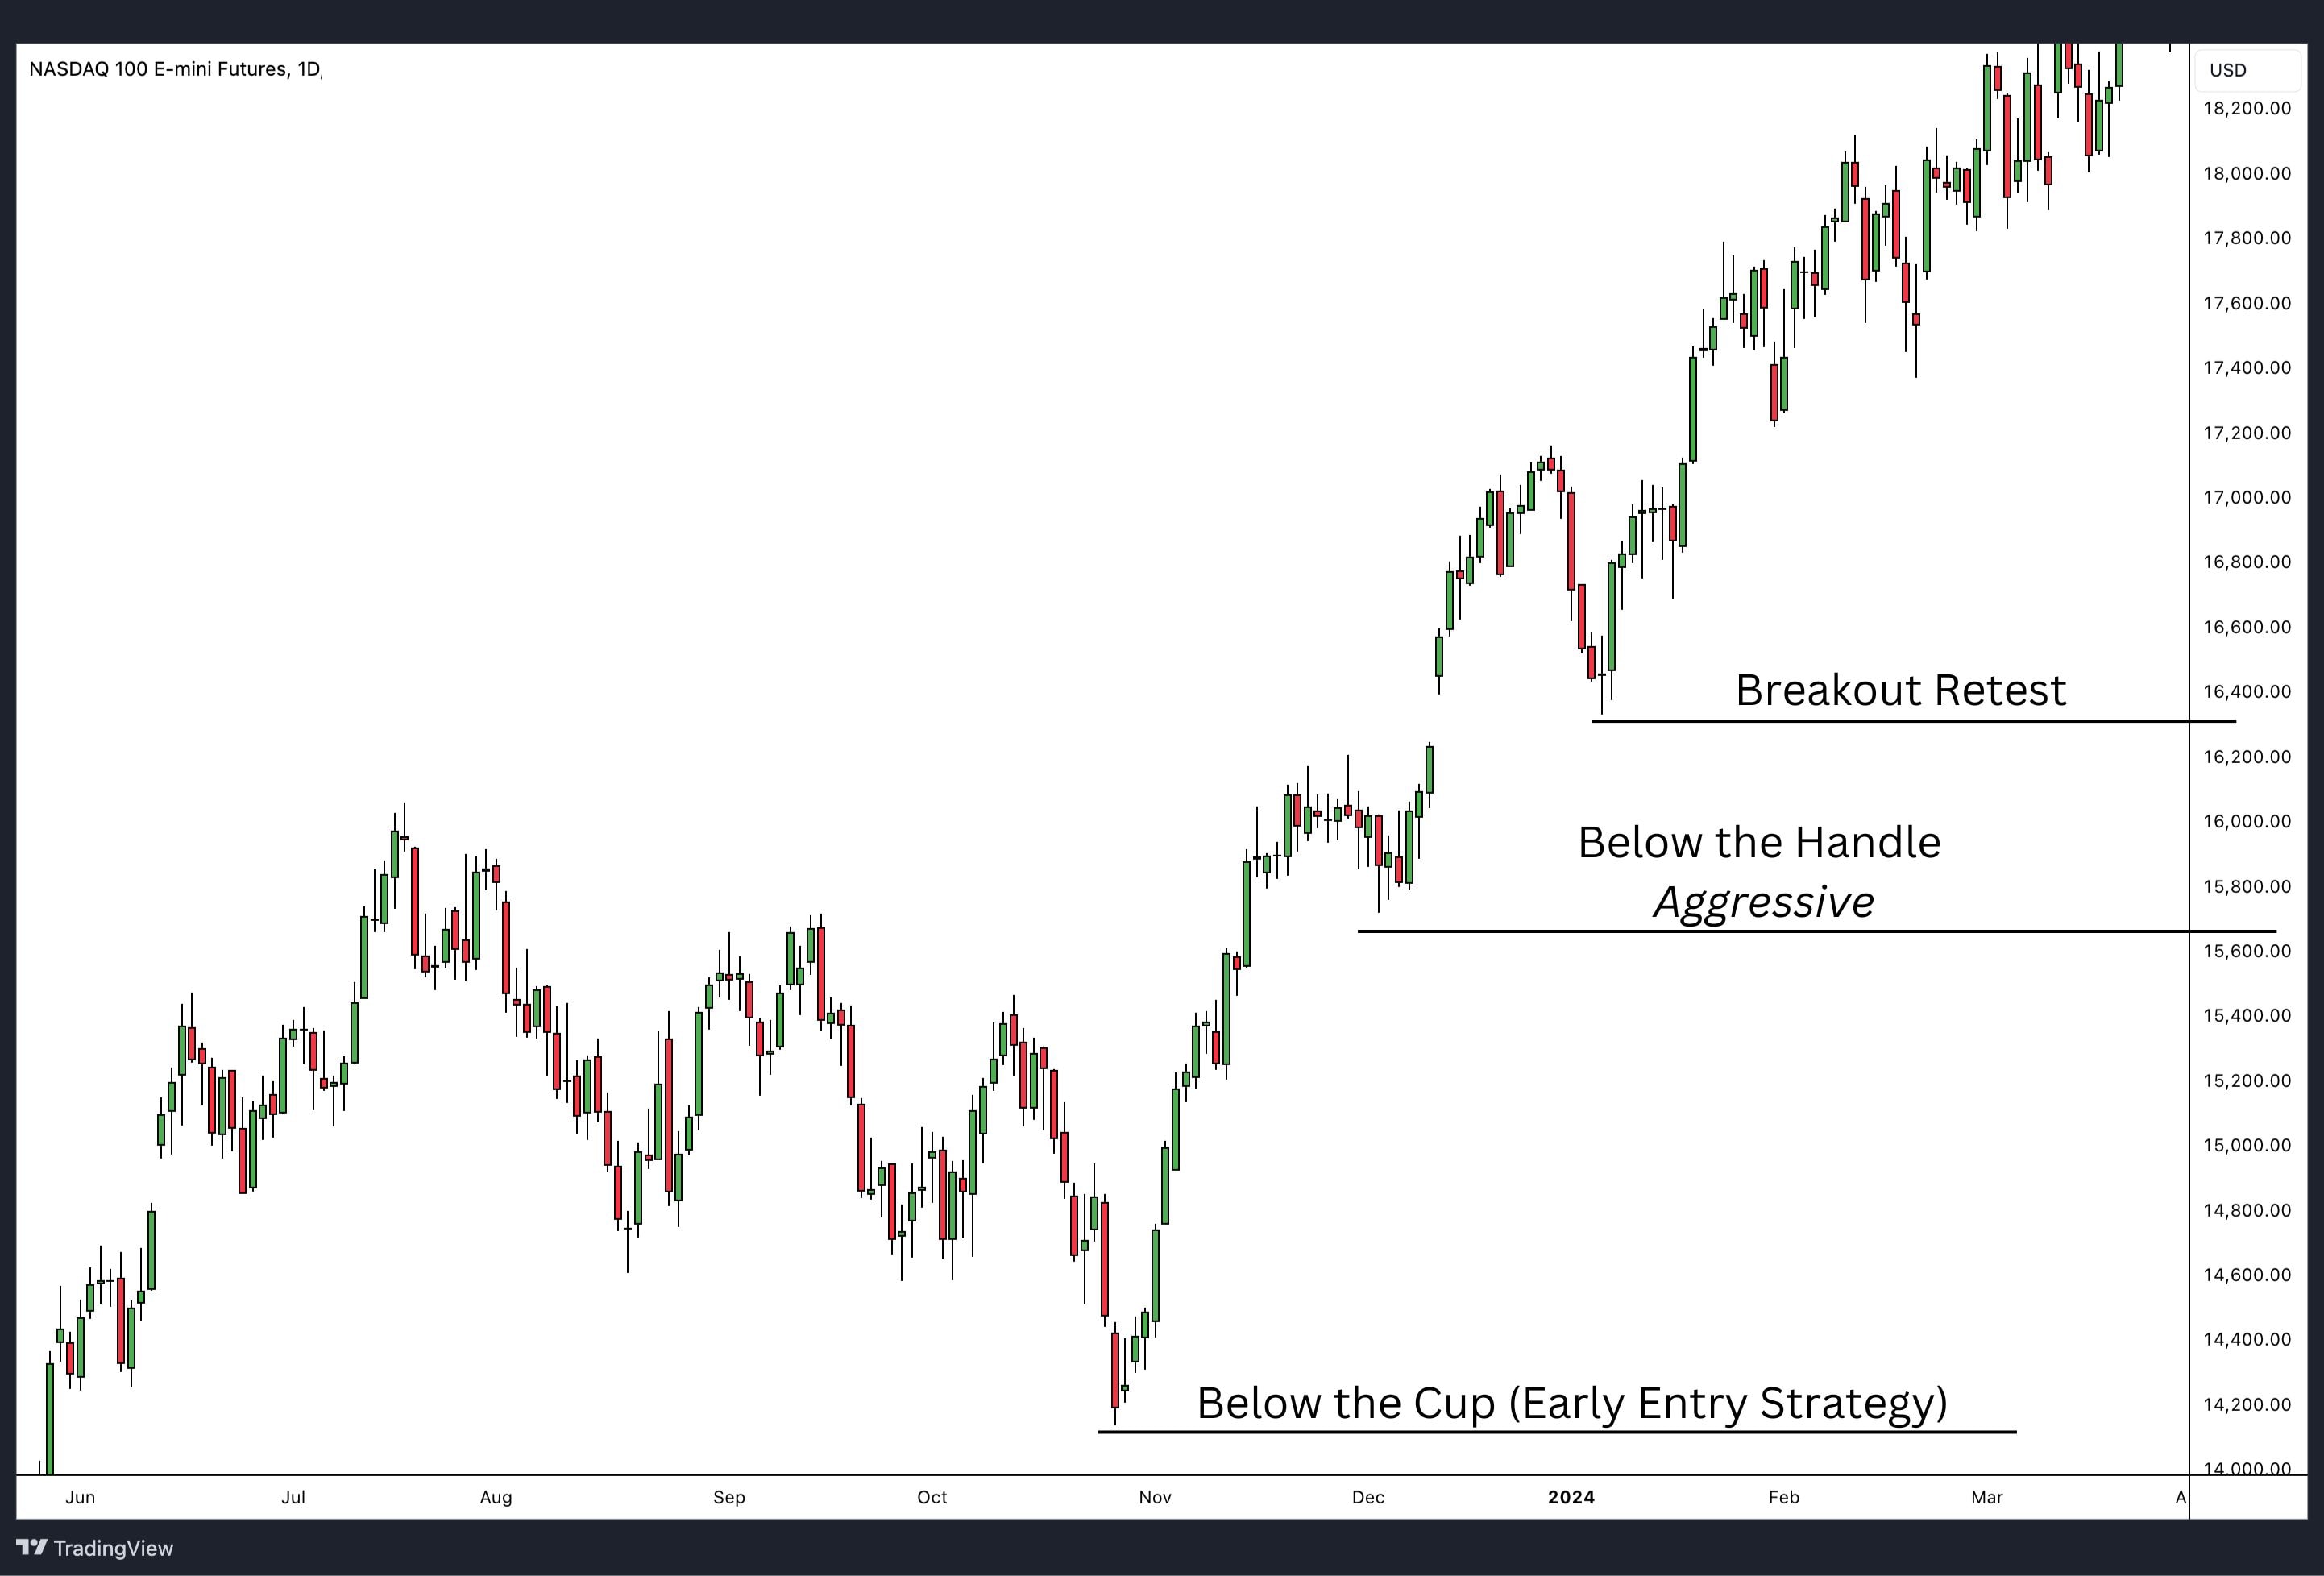
Below the Cup (Early Entry Strategy):
If you trade near the bottom of the cup, place the stop-loss just below the low of the cup. This protects your position if the price falls below this level, indicating the pattern may not be forming correctly.
Below the Handle:
Position the stop-loss under the handle’s lowest point. If the price declines below this, it may signal the pattern isn’t unfolding as expected, potentially leading to further declines.
Breakout Retest:
Set a stop-loss below the breakout level after a breakout and subsequent pullback. This strategy accommodates some market movement while guarding against major reversals.
Ongoing Adjustment:
Regularly review and adjust stop-loss orders as the market changes. Move the stop-loss to breakeven or use a trailing stop-loss to secure profits as the trade progresses.
Remember: Align your stop-loss with your risk tolerance, considering the amount you’re willing to risk and allowing for necessary market fluctuations.
When to Take Profit With the Cup and Handle Pattern
Deciding when to take profits is crucial in maximising the effectiveness of trading the cup and handle pattern. Here are strategies and considerations for determining the optimal moment to exit a trade:
- Projected Price Target: Set a profit target based on the cup’s depth, projecting this distance upward from the breakout level to establish a take profit exit point.
- Resistance Levels: Consider structural resistance levels from previous uptrends as potential zones to take profits, especially if the price nears these levels.
- Trend Reversal Indicators: Watch for reversal signals using candlestick patterns or indicators like RSI or MACD. Signs of weakening momentum might signal a time to exit.
Advantages of Trading on the Cup and Handle Pattern
The cup and handle pattern offers several advantages to traders, making it a popular chart pattern in technical analysis. Some of the key advantages are:
High Probability of Success:
The cup and handle pattern has a high probability of success, making it an attractive trade setup for traders. According to technical analysis experts, this pattern has a success rate of around 65 – 70%. – Research by Thomas Bulkowski.
Defined Risk Reward Ratio:
By identifying key support levels and setting a stop-loss order, traders can determine their risk-reward ratio before entering the trade. Most traders look for at least a 1 to 2 risk to reward ratio. This helps in managing risk and avoiding large losses, but if the trade works out, the gains would cover multiple losses.
Easy to Identify:
Once you understand the characteristics of the cup and handle pattern, it becomes easy to identify on price charts. This makes it accessible to both beginner and experienced traders alike.
Strong Price Movements:
The price movements after a cup and handle pattern breakout tend to be strong and prolonged, making it an attractive trade for those looking for significant returns in a relatively short amount of time. However, not all trades work out so utilize a stop loss to minimize any potential losses.
Broad Market Application:
The cup and handle pattern is usable across diverse markets, including stocks, commodities, currencies, indices, cryptocurrencies, and more.
Disadvantages of Trading on the Cup and Handle Pattern
Along with its many advantages, the cup and handle pattern also has some drawbacks that traders should be aware of:
False Breakouts:
As with any technical analysis pattern, false breakouts can occur even after a clear cup and handle formation. Traders need to be cautious and wait for confirmation before entering a trade and incorporate an appropriately placed stop loss to mitigate losses.
Subjectivity:
The pattern’s identification can vary among traders, leading to different interpretations and unreliable entry and exit points for some.
Time-Consuming:
Identifying a cup and handle pattern can be a time-consuming process, especially for traders who are new to technical analysis. It requires patience and practice to spot this pattern accurately.
Not Always Reliable:
While the cup and handle pattern has a high success rate, it is not always reliable by itself. Traders should consider other factors such as market conditions, news events, and overall trends before entering a trade solely based on this pattern.
Difficult to Trade in a Downtrend:
As the cup and handle pattern is a bullish continuation pattern, it can be challenging to trade in a downtrend market. Traders need to be cautious and wait for a trend reversal before considering this pattern.
What Are the Thoughts of Some Traders About the “V” Bottom Cup and Handle Pattern?

The ‘V’ bottom cup and handle pattern, a variation of the traditional cup and handle, often sparks diverse opinions among traders. This pattern features a sharper and more rapid rebound in the lower half of the cup’s formation, resembling a ‘V’ shape rather than a ‘U’ shape. Here are some common viewpoints:
A U-Bottom Pattern:
A U-bottom pattern is characterised by a slow, gradual decline in prices followed by stabilisation, allowing for a psychological shift among traders. This leads to exhausted selling pressure and a steady recovery, indicating stable, sustained upward trends.
Psychology of V-Bottom Patterns:
A V-bottom pattern emerges from a rapid decline in prices due to significant events, followed by aggressive buying. This sharp recovery reflects strong bullish sentiment and quick market reactions, indicating brief but strong confidence in the market.
Trader Sentiment Comparison:
U-bottoms are favoured by traders looking for stable, long-term investments, while V-bottoms attract those seeking rapid returns from sharp market reversals.
Common Cup and Handle Pattern Mistakes to Watch Out For
One common mistake is prematurely identifying a cup and handle pattern before it has fully formed. While it is possible to trade the pattern in stages, it is important to take into account other confluences that can assist in the decision-making process. Here are a few additional common mistakes to be mindful of:
Cup Too Deep:
The depth of the cup may vary, but it is generally recommended to be between one-third and two-thirds of the previous uptrend. When the cup is deeper, it requires the bulls to exert more energy than usual to push the asset price back up to its previous high. Consequently, the handle breakout could be affected, potentially resulting in the stock price not continuing its expected upward move after the breakout.
Handle Too Deep:
The handle is meant to shake out the last weak holders near the cup highs. If the handle trends lower too much, then more buying strength is needed to simply get the price back to the handle highs. That leaves little to no strength left for a breakout attempt. A handle that corrects too deep can lead to a false breakout or no breakout at all.
Cup and Handle Pattern vs Reverse Cup and Handle Pattern
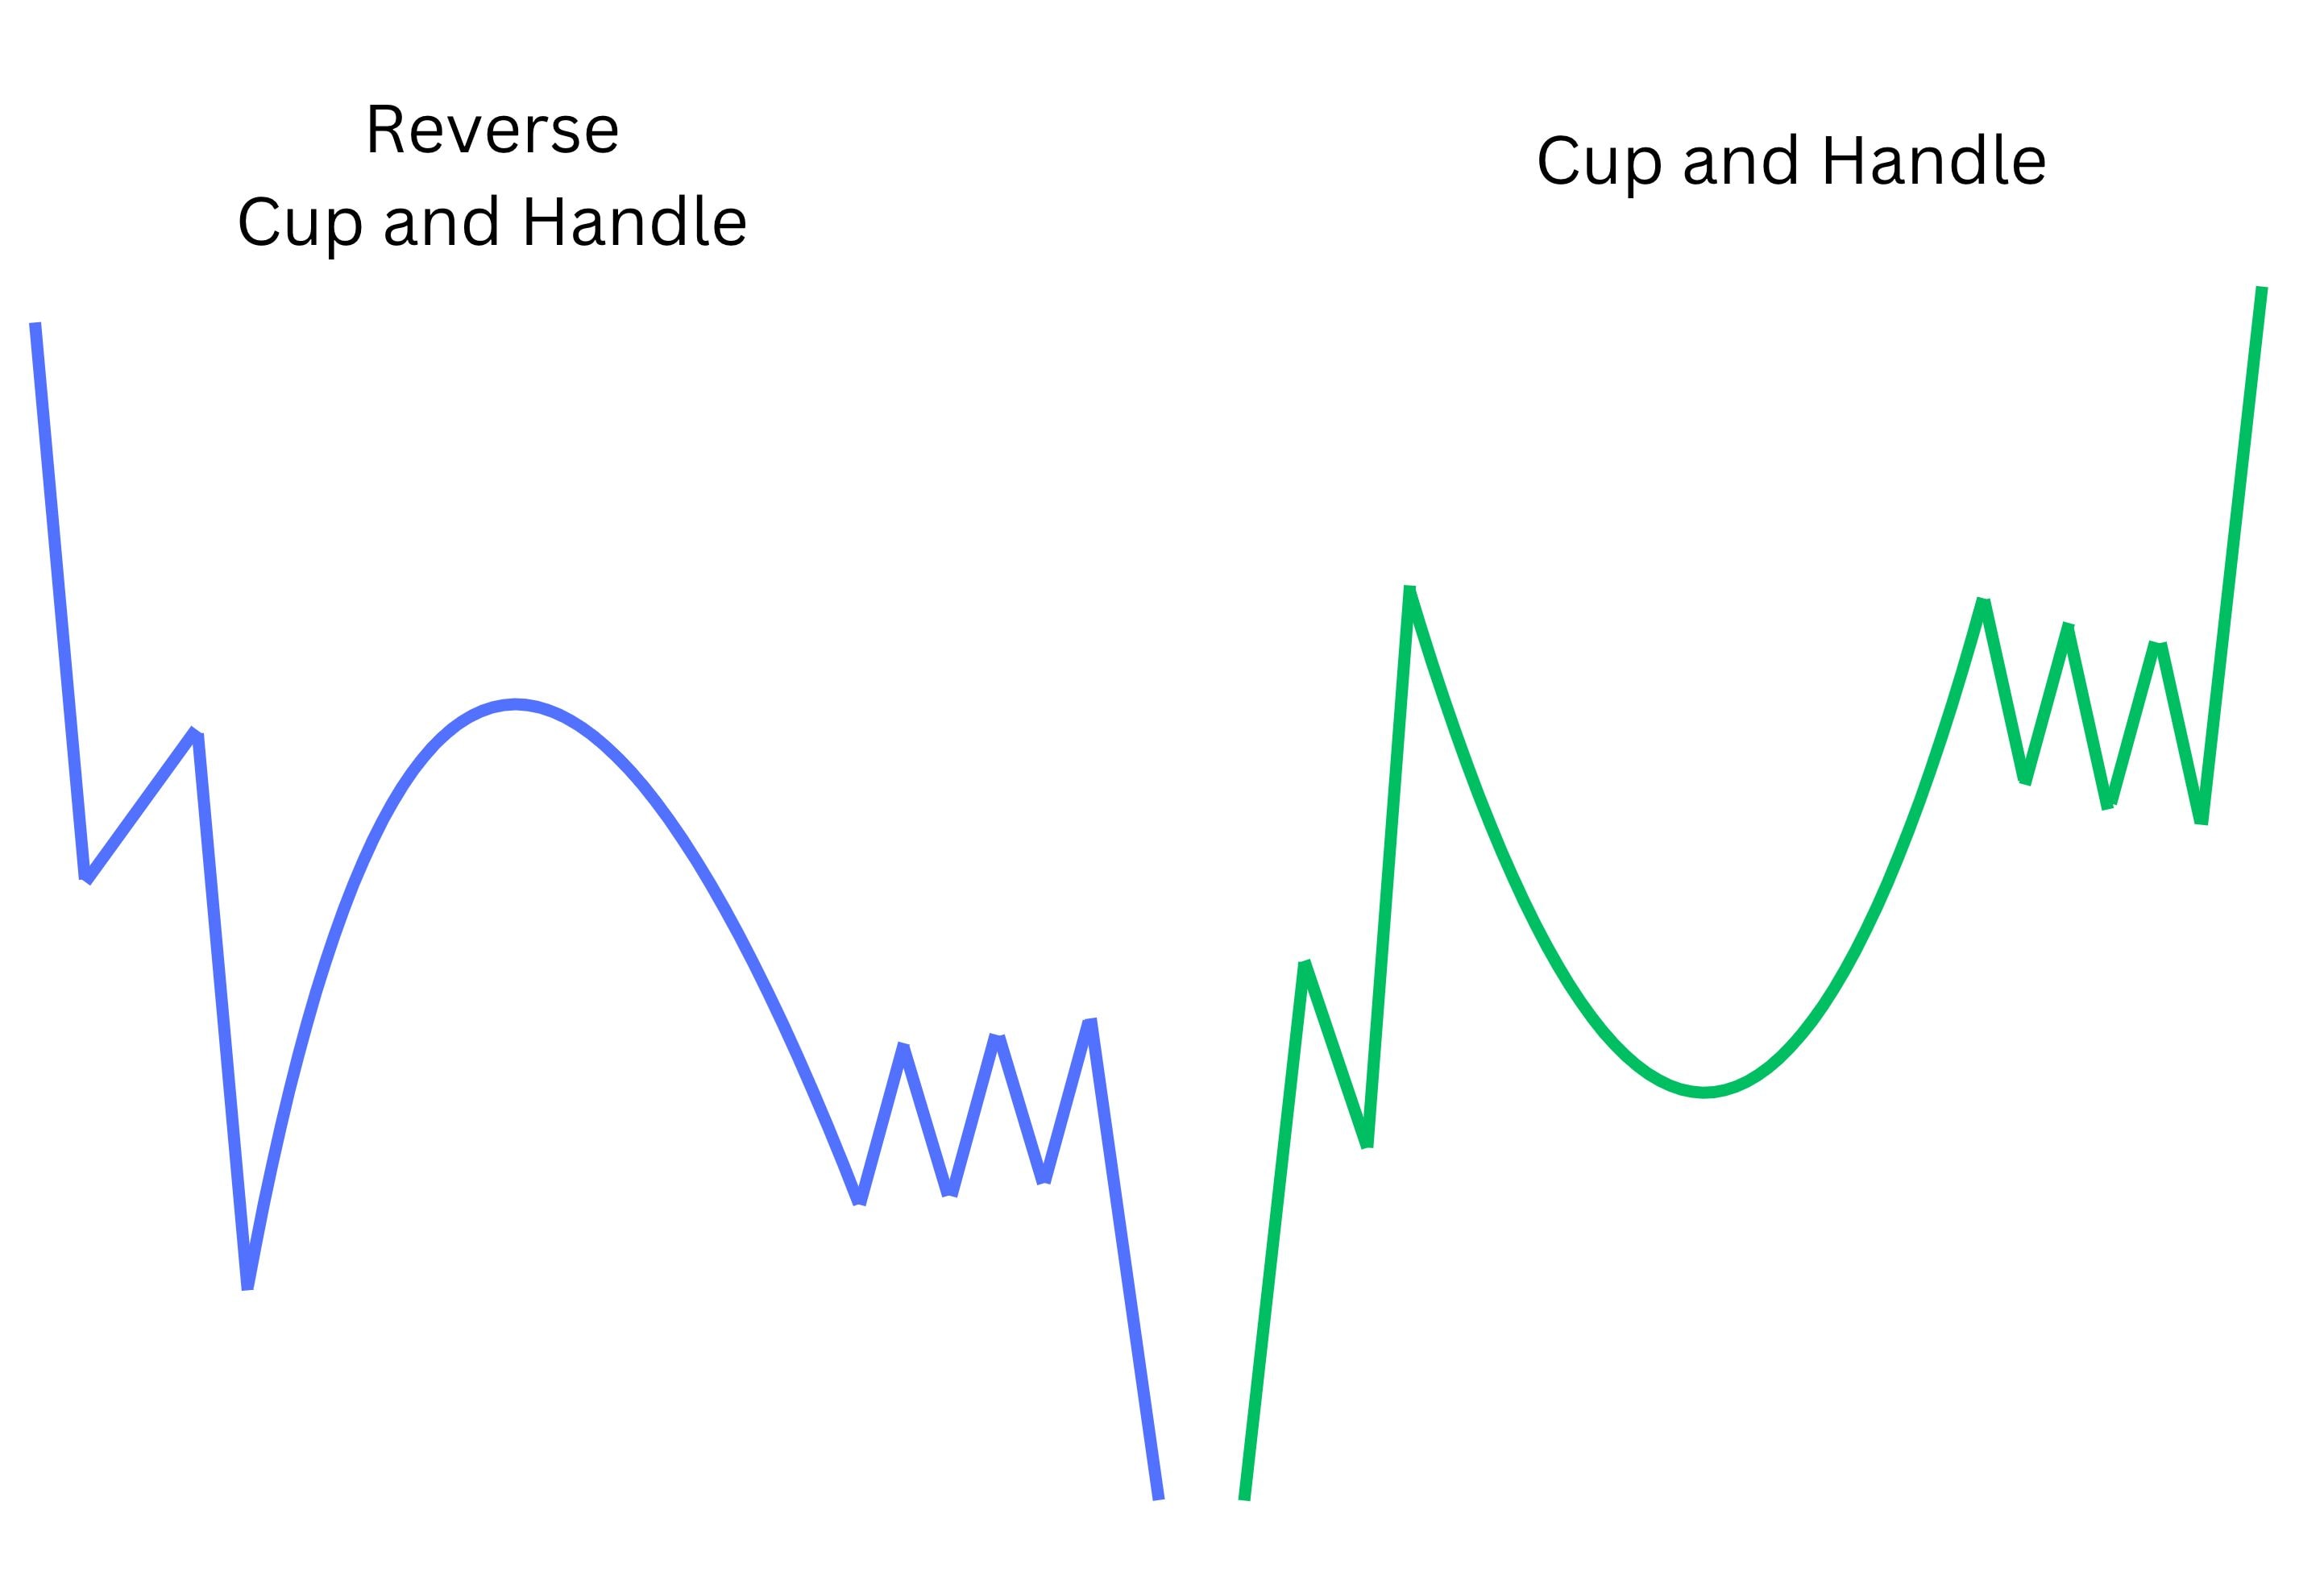
The reverse cup and handle pattern, also known as the inverted cup and handle, is the bearish counterpart to the traditional cup and handle pattern. While the traditional pattern features a “U” shape signaling a bullish continuation, the reverse pattern forms an inverted “U” shape, often resembling a double top pattern. This inverted cup suggests a bearish reversal, with the handle forming a bearish flag or bear pennant, indicating further downward momentum.
In essence, while the cup and handle is a strong bullish signal found in rising markets, the reverse cup and handle is a powerful bearish signal, typically identified in declining markets. Traders use the traditional pattern to enter long positions during a breakout, whereas the reverse pattern is used for short-selling opportunities when the price breaks below the handle’s support
FAQ
Is the cup and handle pattern bullish or bearish?
Yes, the cup and handle pattern is considered a bullish continuation pattern. It typically indicates that an asset’s price is transitioning from a bearish trend to a bullish one, suggesting potential for future upward movement in price.
Can a cup and handle pattern form in a day?
Generally, no. The cup and handle pattern typically forms over a longer period, ranging from several weeks to months. The pattern involves a gradual and sustained change in market sentiment that cannot be condensed into a single day.
How long does it typically take for a cup and handle pattern to form?
The formation period for the pattern typically ranges from a few weeks to several months. The ‘cup’ usually takes longer to develop, while the ‘handle’ is a shorter consolidation phase.
Who first identified the cup and handle pattern?
The cup and handle pattern was first recognised and popularised by William J. O’Neil, an esteemed stock investor and founder of Investor’s Business Daily, in his book “How to Make Money in Stocks.”
What is the importance of the 200-day moving average in the cup and handle pattern?
The 200-day simple moving average indicates the direction of the longer-term trend. The cup and handle is a bullish consolidation pattern. Therefore, you ideally you want to see the cup and handle pattern form above the 200-day moving average indicating the long-term trend is still up.
What is the reversal downtrend for cup and handle pattern?
The reversal downtrend is an unsuccessful attempt to break out. It occurs when the price fails to follow through above the handle, resulting in a deviation from the target levels. As a result, prices eventually break support rendering the pattern null and void. In simpler terms, the cup and handle pattern shows a failed breakout, leading to a reversal in the opposite direction.