Written by:


- Opening Bell
- October 27, 2026
- 6 min read
Colossal News Week: Will Banks Hold Rates and Tech Stocks Recover?
This week is absolutely colossal for traders and investors.
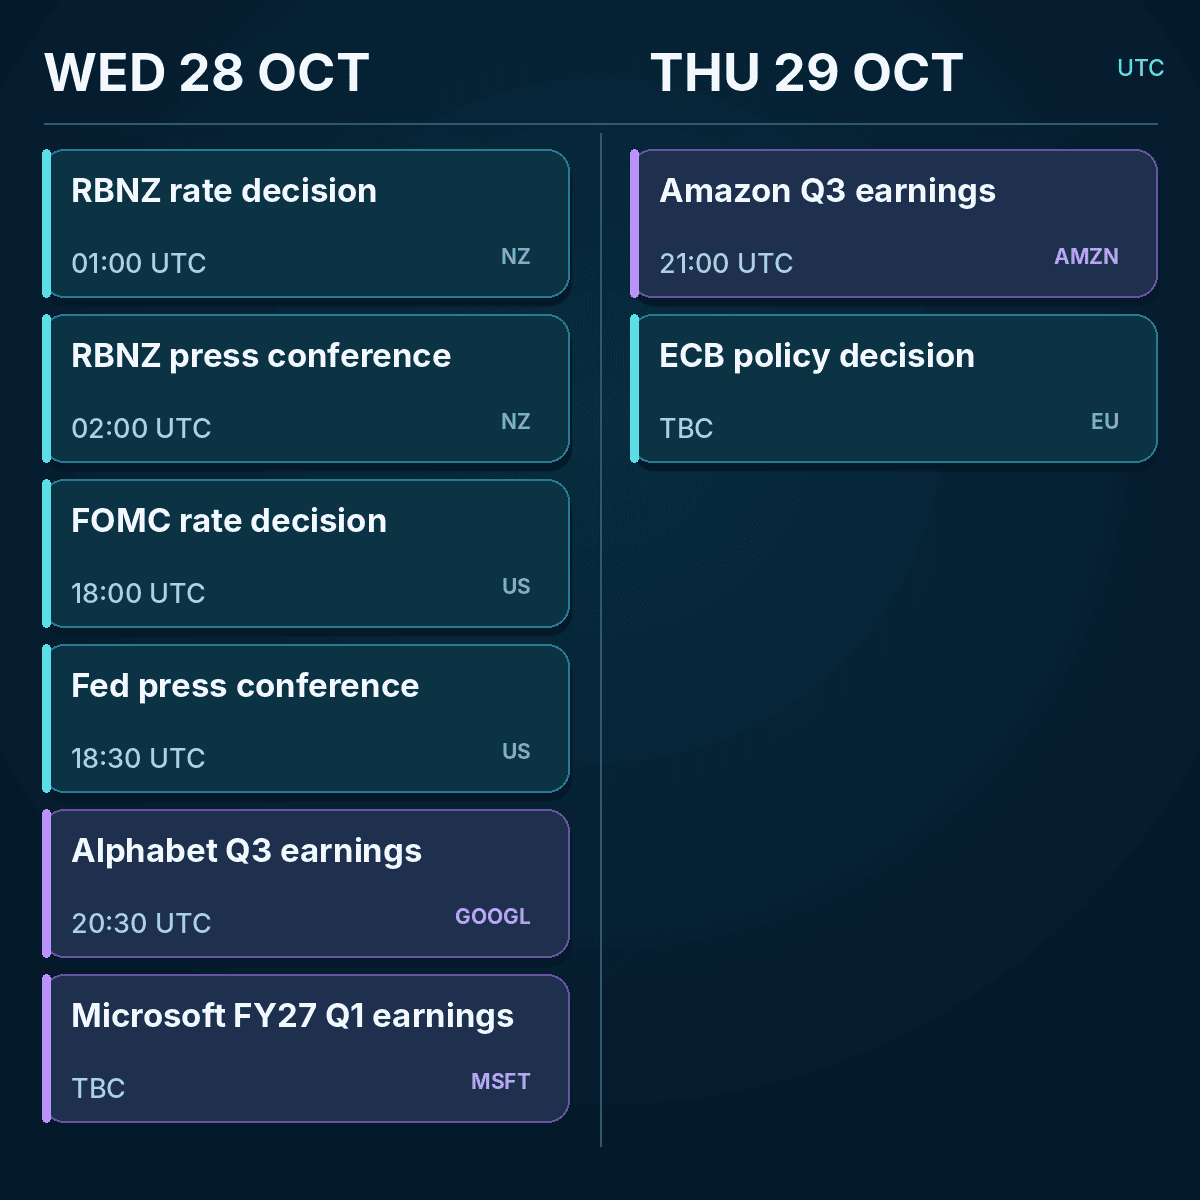
We have a big day on Wednesday, with Microsoft and Alphabet earnings and the FOMC rate decision all stacked together, just after Tuesday night’s RBNZ decision. Then on Thursday, we have Amazon earnings and the ECB rate decision.
This is happening at the same time as tech stocks have plummeted.
The Nasdaq has fallen about 7.73% from its highs, and semiconductors (SMH) are down roughly 18% from their lower high. Google has declined 11.75% over the past 12 days, while Amazon trades 13% below its July highs.
The question now is: Are tech stocks oversold as we move into critical economic events?
Nasdaq is forming a Bullish Divergence
Nasdaq is currently trading at a critical volume profile level at ~$28,867 and forming a bullish divergence on the daily Stochastic RSI. This indicates conditions favourable for a rally, even if temporary.
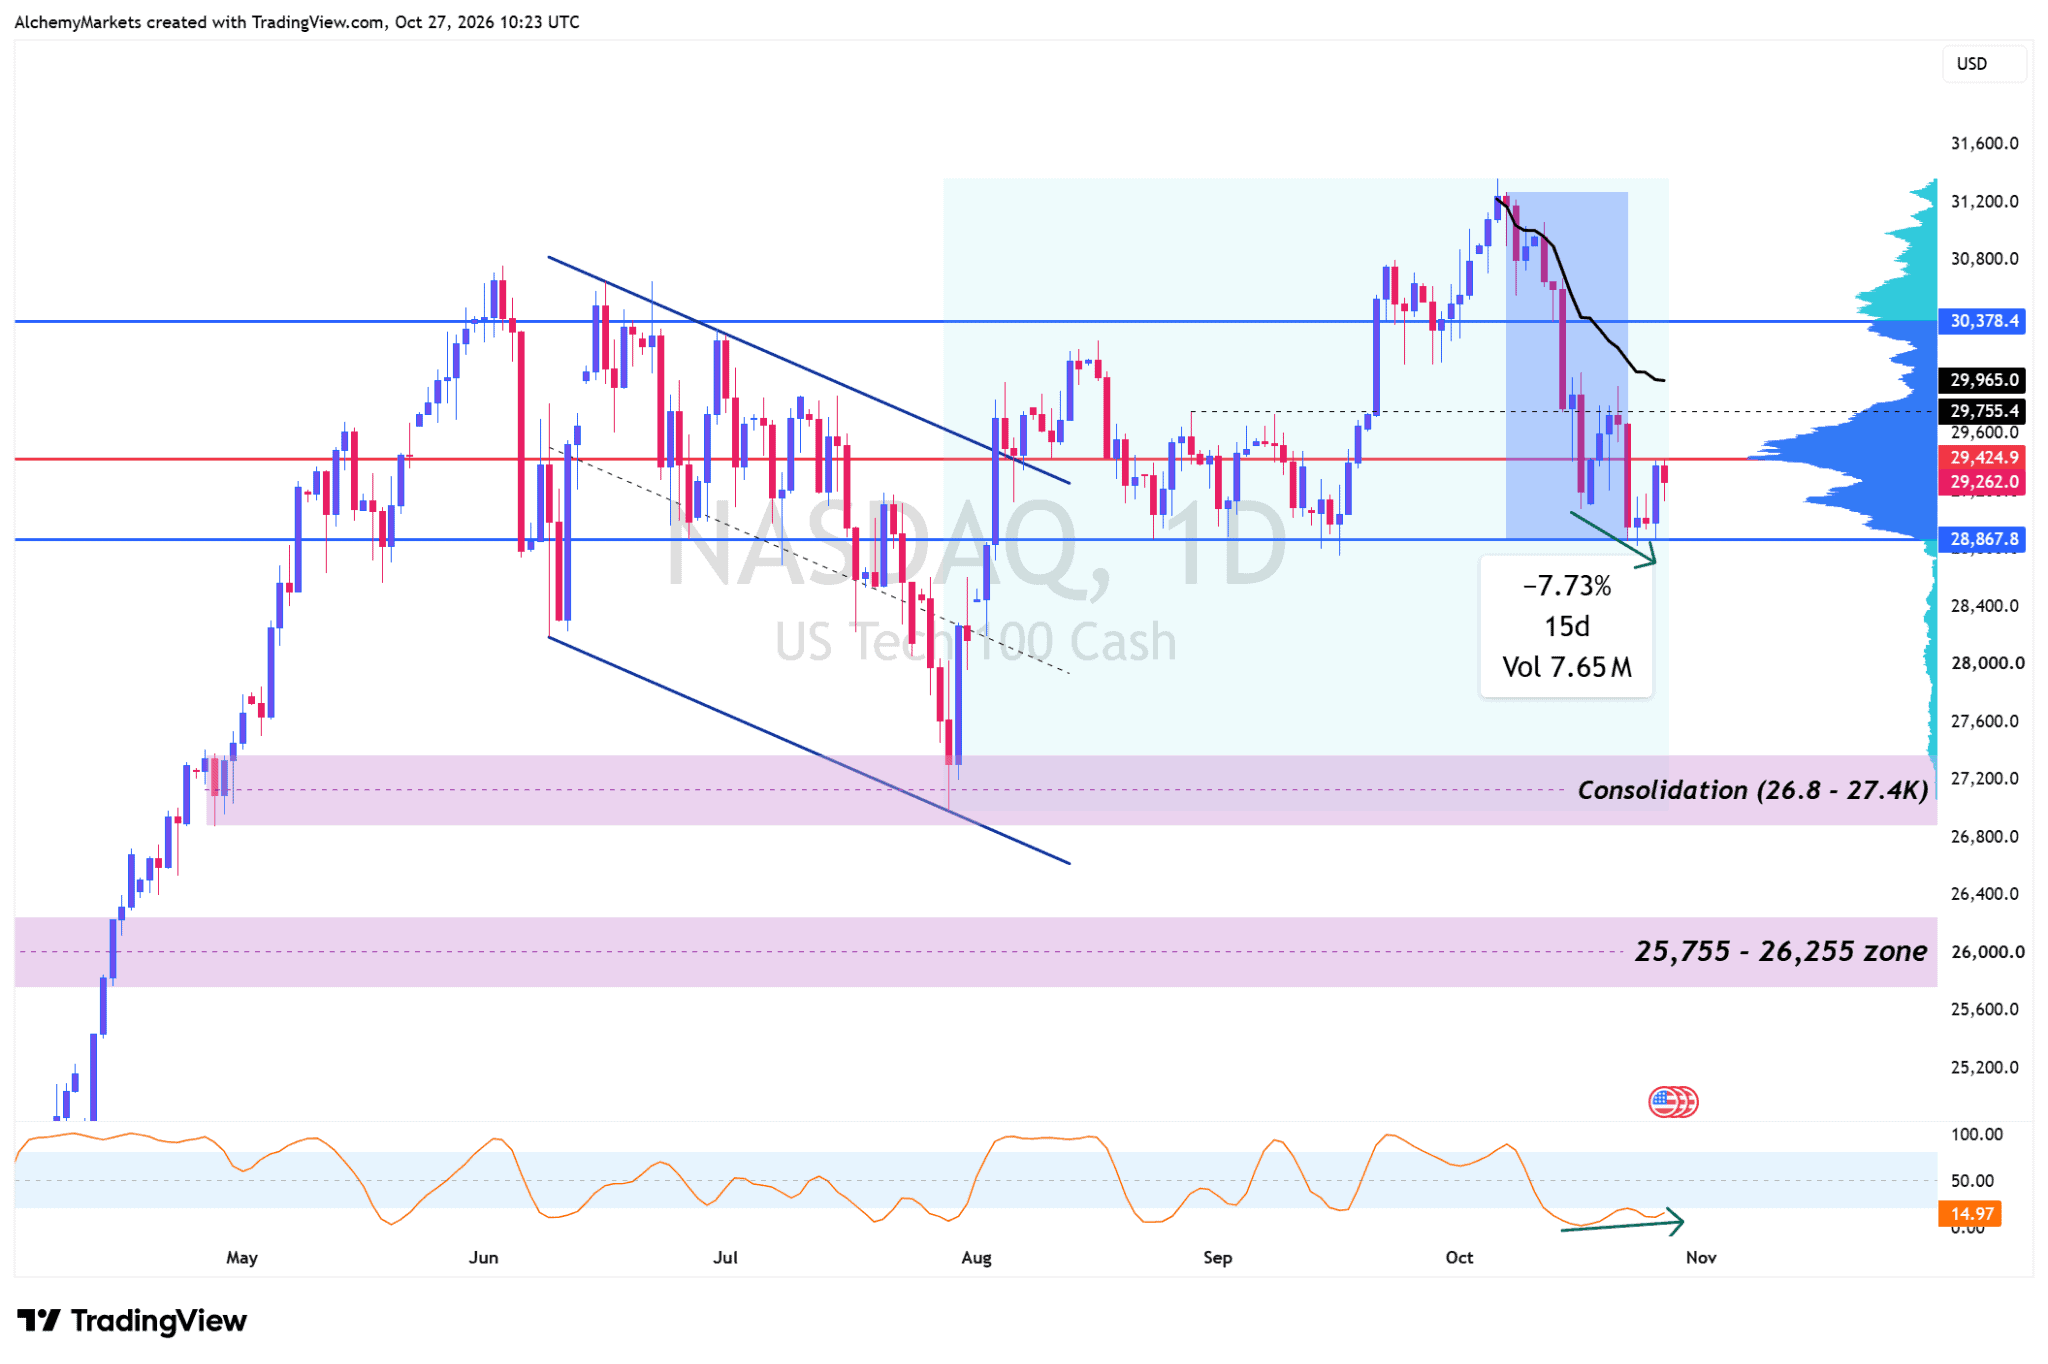
Currently, the main resistances to watch are 29,755 (previous high), 29,965 (anchored vWAP) and 30,378 (value area high and breaker block). From a technical perspective, a rally from here could be short-lived.
Conversely, should Nasdaq break below 28,867, we could see a rapid fall back to 26.8–27.4K due to the remarkably thin volume profile sitting below this support.
Earnings and Financial Announcements to Watch
That being said, the upcoming FOMC is being viewed as a majority hold decision. What the markets are currently pricing in is the hawkish guidance they expect to hear, as December’s rate hike decision currently sits at 81.4%.
But if the guidance is more dovish than expected, then tailwinds may hit the markets and give tech stocks the boost they need to flip the short-term downtrend.
Combined with the FOMC are the earnings to watch. Should the big AI names within the MAG7, like Microsoft, Alphabet and Amazon, prove that capex and free cash flow are not issues, then they should see tailwinds as well.
That being said, technical price action should take precedence over earnings. Recently, positive earnings have not acted as expected for big names such as Netflix and Micron.
Google’s expectations are as follows:
| Metric | Expected | Previous quarter |
| Revenue | $127.91bn | $119.80bn |
| EPS | $3.03 | $9.11 |
The previous EPS included a large investment-related gain, so the headline comparison is not like-for-like.
What investors are looking for:
For Google, I’d watch Search and Cloud growth, plus whether the AI spending is showing up in free cash flow.
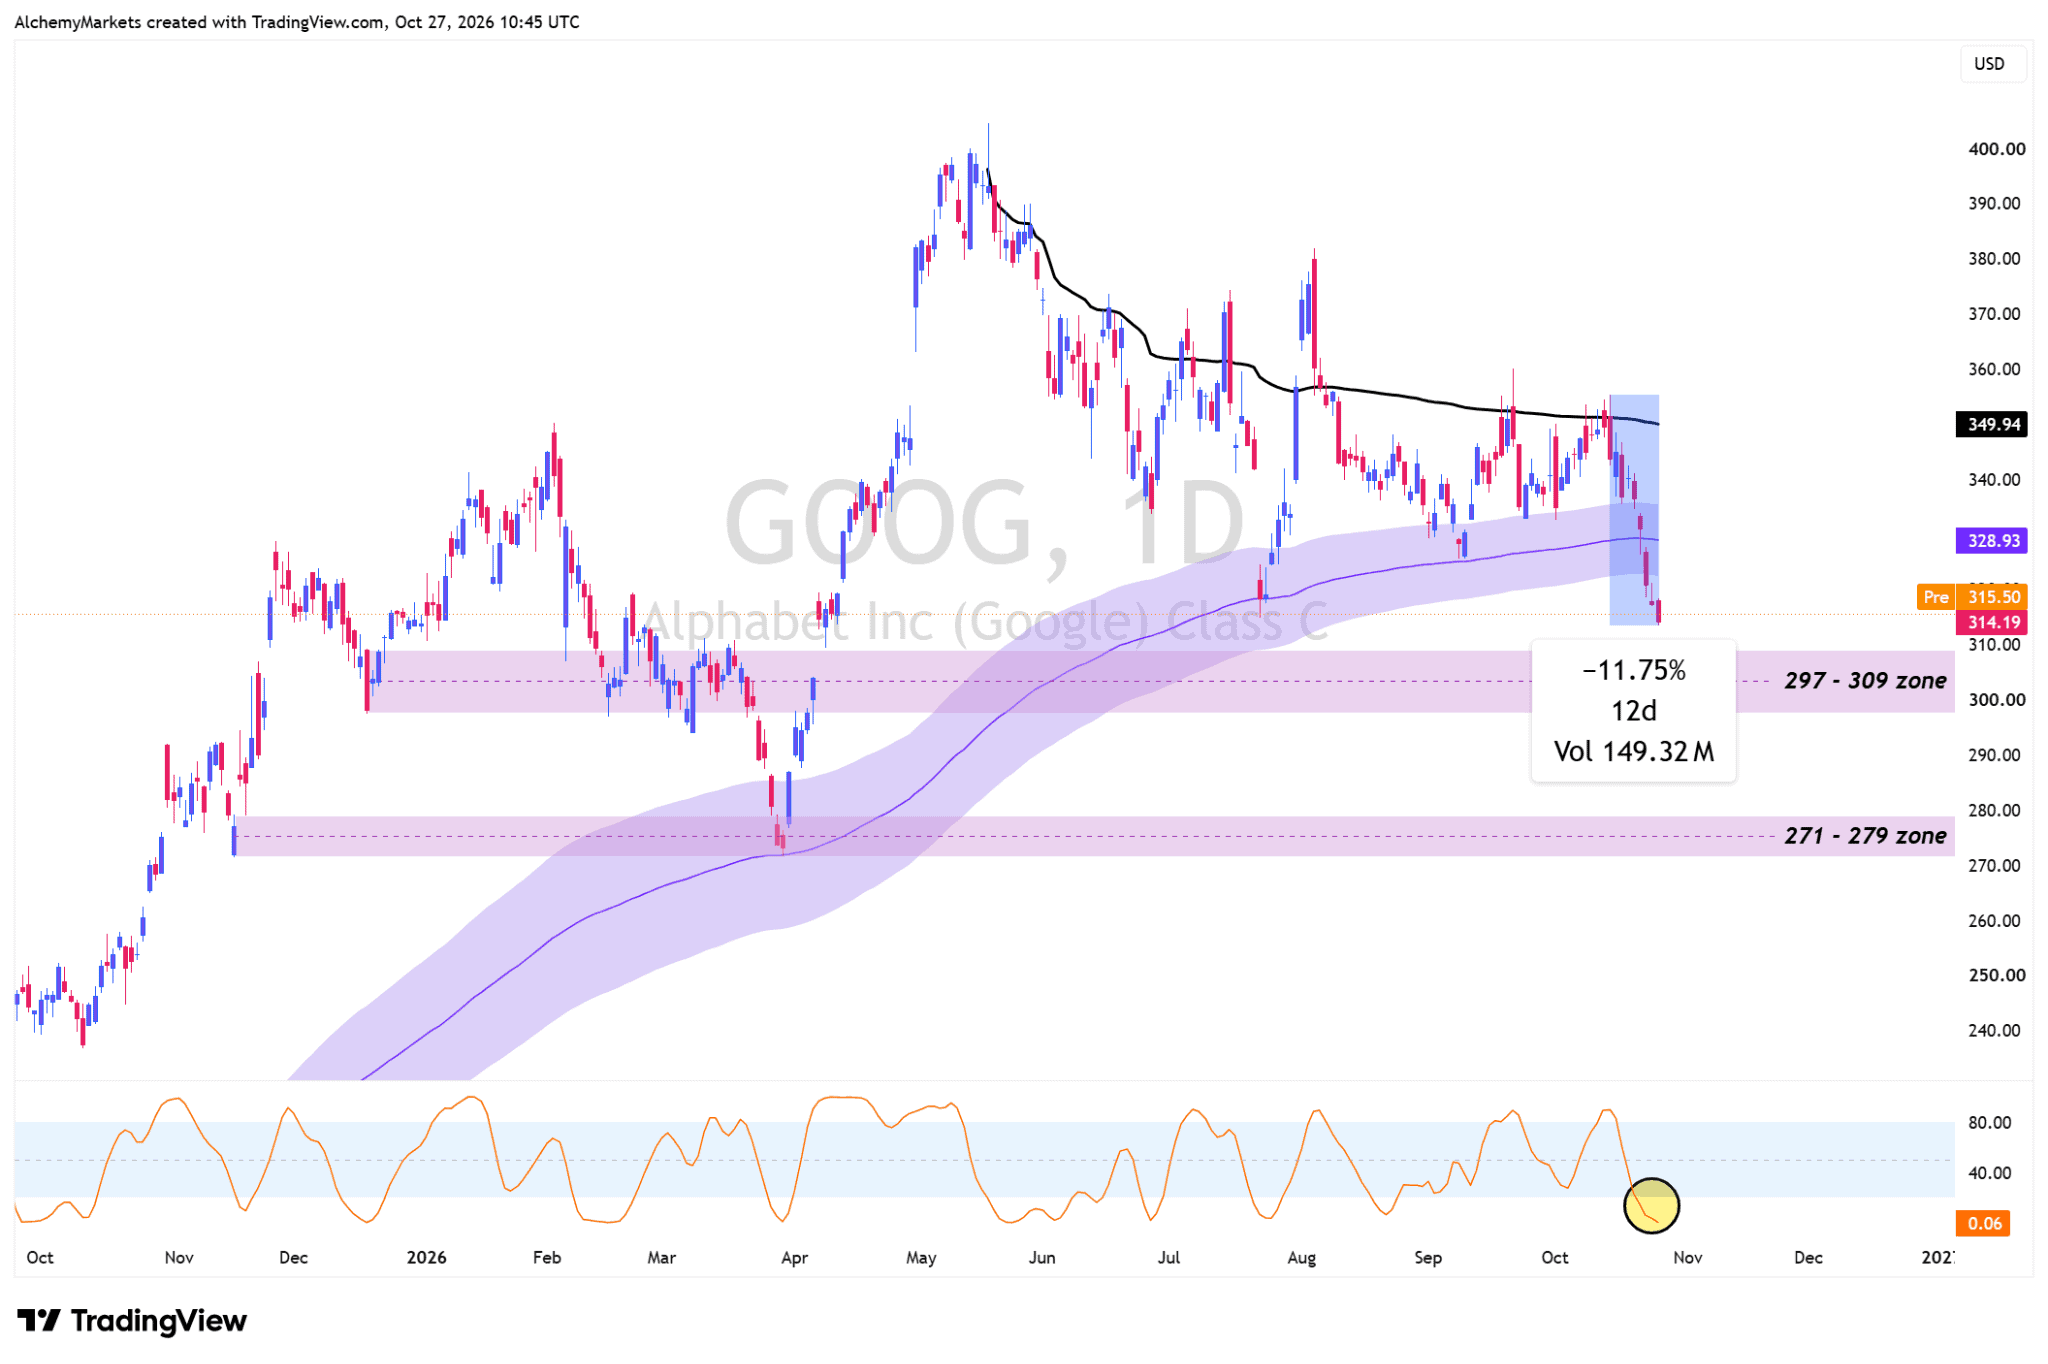
From a technical perspective, Google has traded in a clear downtrend for the past 12 days and is very oversold. Typically, when a stock is moving in a clear direction into earnings, I’m personally biased towards a reversal — unless a huge surprise takes place.
Google has broken the purple band (200 daily EMA zone), a clear behavioural change. This means a rally from here could meet the EMA zone as resistance, followed by the anchored vWAP at 349.94.
Conversely, moving even lower would bring the stock to 297–309, where Google could find support for a potential sideways or relief rally.
Microsoft’s expectations are as follows:
| Metric | Expected | Previous quarter |
| Revenue | $90.63bn | $90.01bn |
| EPS | $4.71 | $4.74 |
What investors are looking for:
For Microsoft, I’d watch Azure growth and whether the capex bill is being justified by stronger AI revenue and cash flow.
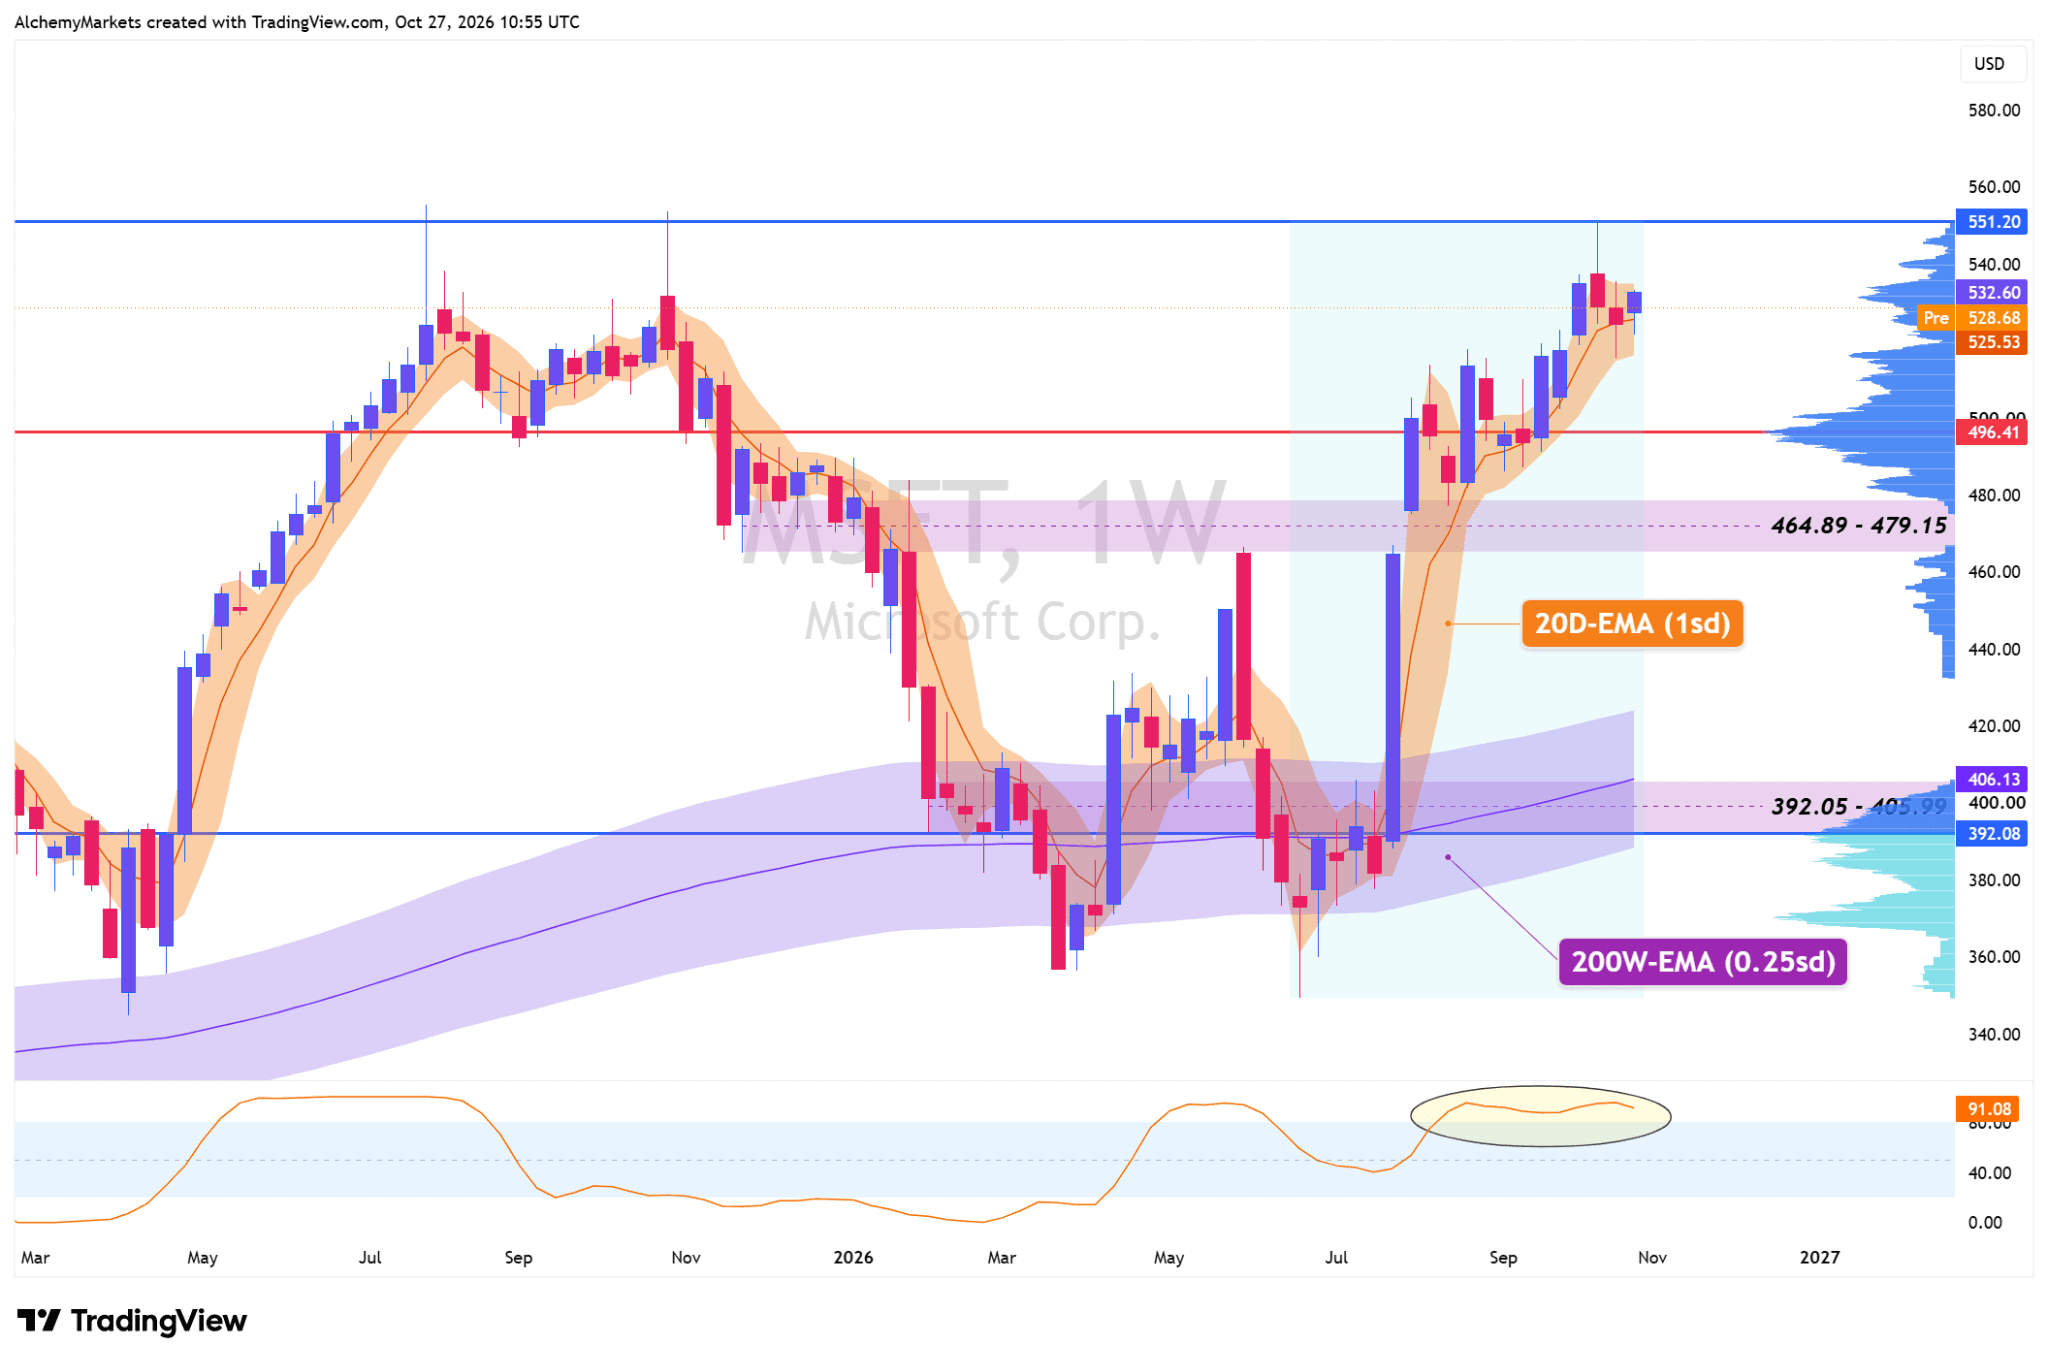
Note that Microsoft is unlike the others: the stock is actually moving higher rather than lower. This does worry me as we move into earnings because it leads me to believe the positivity could already be priced in.
Additionally, the stock is very, very overbought. On the weekly timeframe, the stock has remained elevated at overbought levels for 10 weeks now, gaining a rough estimate of 13%.
Microsoft is currently grinding higher on the 20-day EMA band (1 standard deviation) in orange. The first sign of weakness would be a daily close below this band.
Near-term downside targets, should a reversal occur, are $500 and 464.89–479.15 (daily support zone and unfilled gap). The upside target remains straightforward at $551.20, where the all-time high sits.
Amazon’s expectations are as follows:
| Metric | Expected | Previous quarter |
| Revenue | $202.16bn | $200.61bn |
| EPS | $1.96 | $5.75 |
The previous EPS included a large investment-related gain, so the headline comparison is not like-for-like.
What investors are looking for:
For Amazon, it’s AWS growth, retail margins and the cost of building out AI infrastructure.
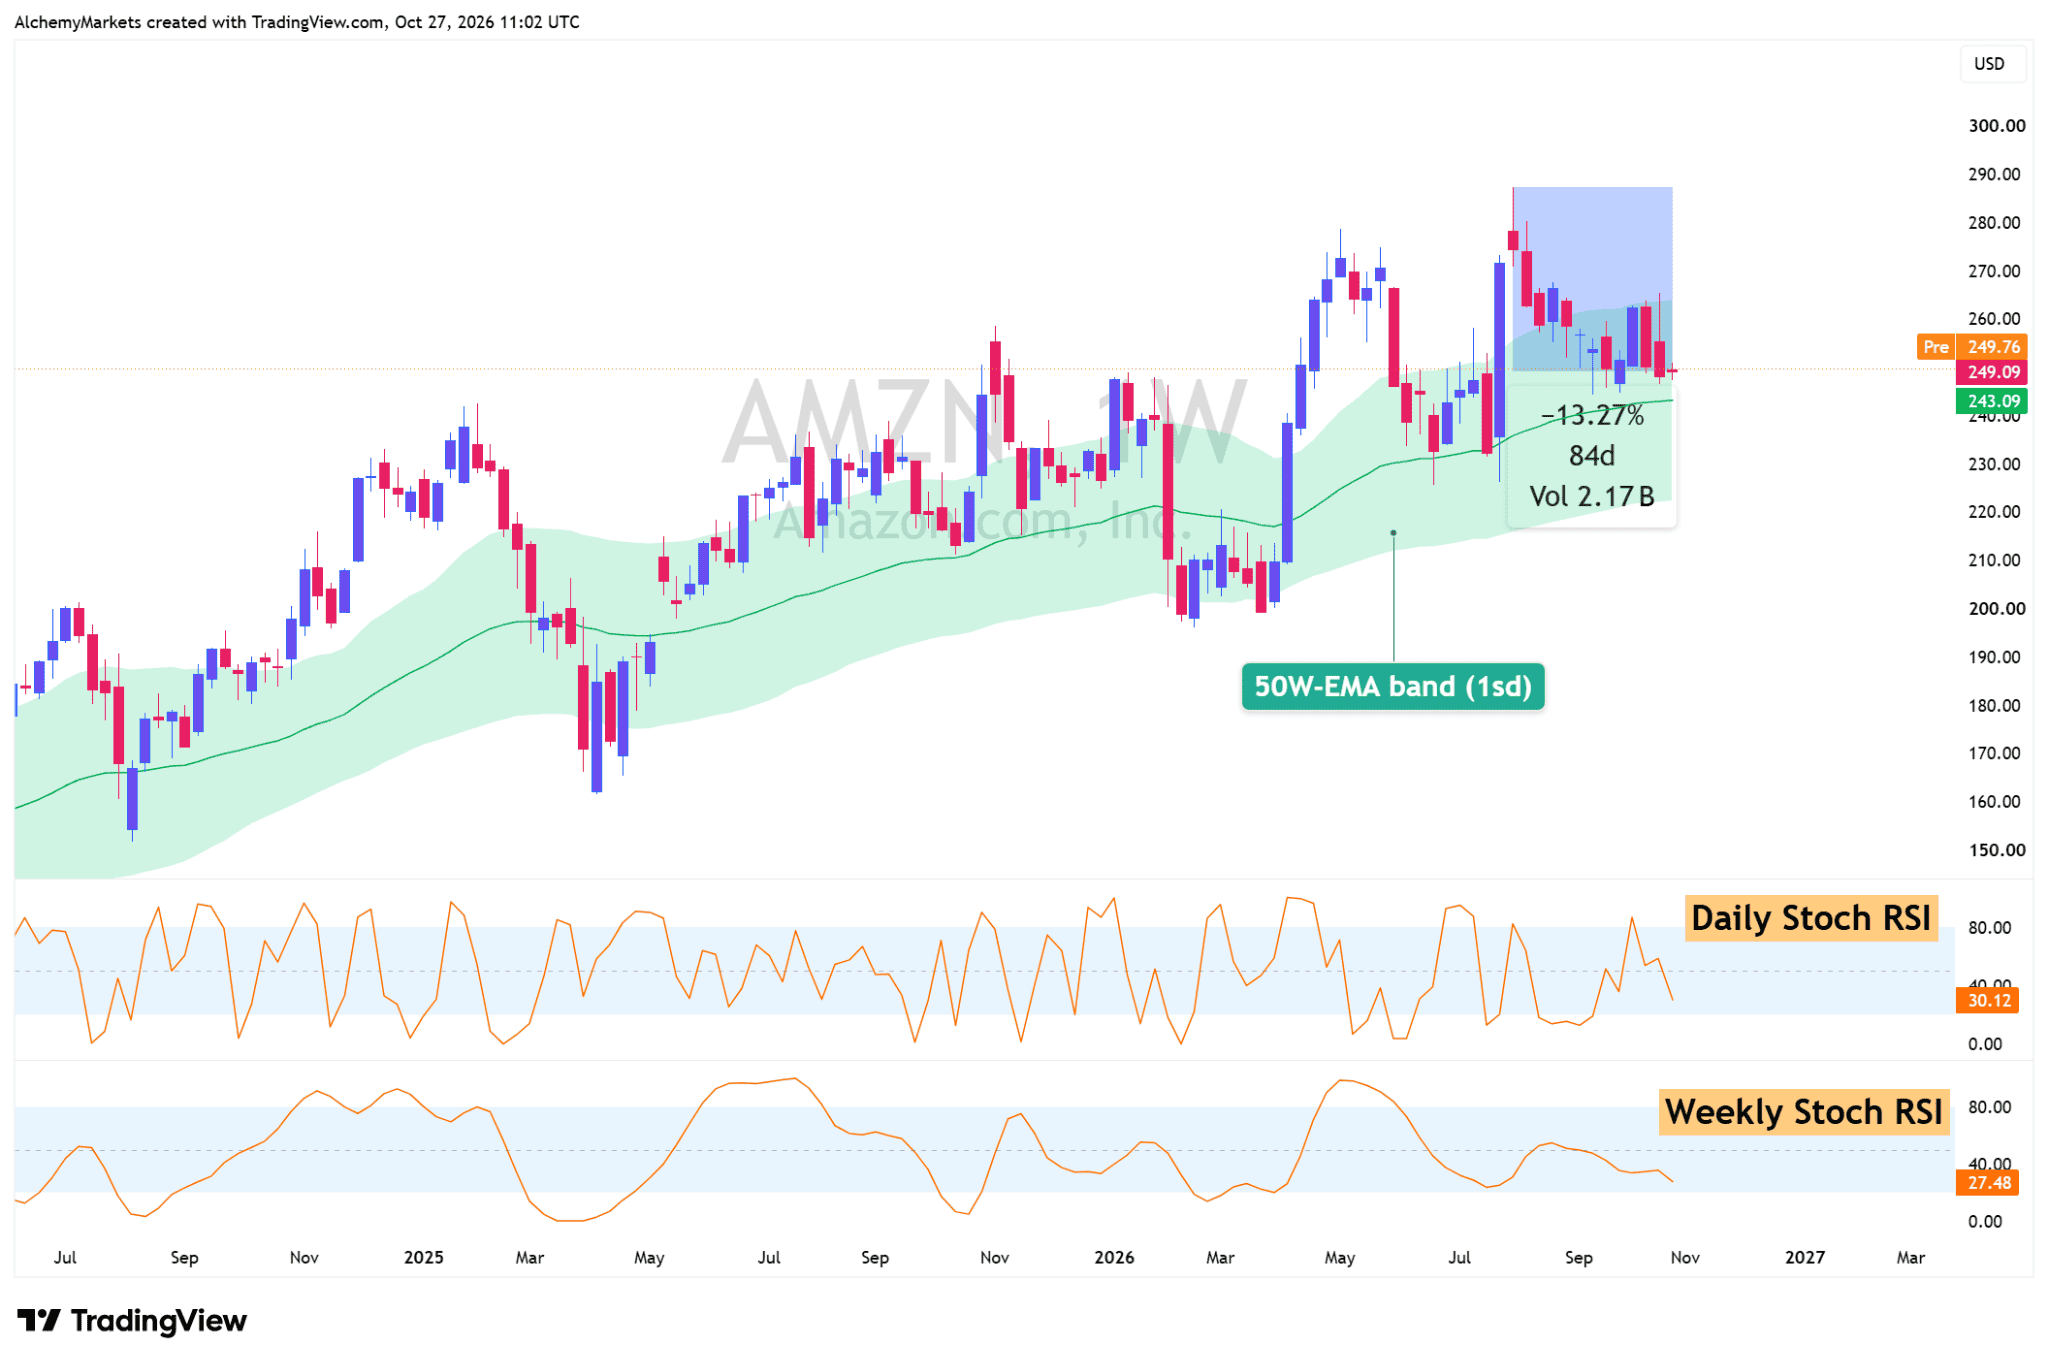
Amazon is currently not yet oversold, which can lend itself to more downside in the short term (even if earnings are good — just remember how many times prices have drastically shifted to the other side of a news event, then reversed).
Therefore, I think it’s prudent to look for near-term support. That for me would be the 50-weekly EMA at 243.09, which has demonstrated itself to be an area of interest in 2026.
Even if we do drop lower, the edge of the band at around 225 should prove interesting as another potential support level, as Amazon has been cleanly trending on the weekly timeframe, even if it momentarily breaks this band.
Are central banks more likely to hold or hike?
For the Fed, a hold is still the majority expectation after September’s rate hike to 3.75–4.00%. I think the bigger question is whether the guidance leaves December’s hike firmly on the table. A hawkish tone could limit any Nasdaq relief rally.
For the RBNZ, the setup is different. The cash rate sits at 2.75%, and several banks now expect a 25-basis-point hike to 3.00%, as higher oil prices and a weaker NZ dollar add to inflation pressure. That makes the tone of the statement just as important as the decision.
For the ECB, the deposit rate sits at 2.50% after September’s hike. A hold is the more widely expected outcome, so once again, the key question is whether policymakers sound comfortable waiting or leave another hike open.
Bottom Line
Ultimately, I think the real test will be whether Nasdaq can hold 28,867 through the Fed decision and earnings, giving the bullish divergence room to develop. If that support breaks, the thin volume profile below could quickly bring 26.8–27.4K back into view.
For Google and Amazon, I’m generally biased to the upside; but not first without seeing some turbulence to critical support levels.
For Microsoft specifically, I am wary because the stock has already climbed for about 9 weeks – that for me leaves it as a bearish reversal or leave it on the sidelines kind of play.