Written by:


- Opening Bell
- August 19, 2026
- 5 min read
EUR/GBP: Inflation Divergence Adds Fuel to the Bull Flag
EUR/GBP is pushing higher inside a short-term bull flag, and today’s inflation releases help explain why.
At first glance, the UK and the euro area do not look very different. Both are sitting at 2.9% annual inflation. But once you look beneath the headline, the story starts to favour the euro a little more than sterling.
In the UK, inflation rose from 2.6% to 2.9% in July, but the underlying detail was less worrying than the headline suggests. The main driver was the rise in household energy costs after the Ofgem price-cap increase. Core inflation held at 2.6%, while services inflation eased from 3.6% to 3.4%. That suggests inflation pressure in Britain is rising more from the external energy shock than from a fresh reacceleration in domestic inflation.
That matters because it gives the Bank of England more room to look through the move if it believes the pressure is not spreading meaningfully through the wider economy.
The euro-area picture is a little less comfortable.
Euro-area inflation was also confirmed at 2.9%, up from 2.8% previously. But the internal details show slightly firmer persistence. Energy remains a major driver, yet services inflation also edged higher and core inflation has shown less improvement than the UK equivalent. In other words, the euro area looks a touch stickier beneath the surface.
That leaves us with the key FX question:
Which side is seeing the more inflationary backdrop, and which central bank is likely to face the firmer policy pressure?
For now, the answer leans towards the euro area.
The bond market is starting to confirm it
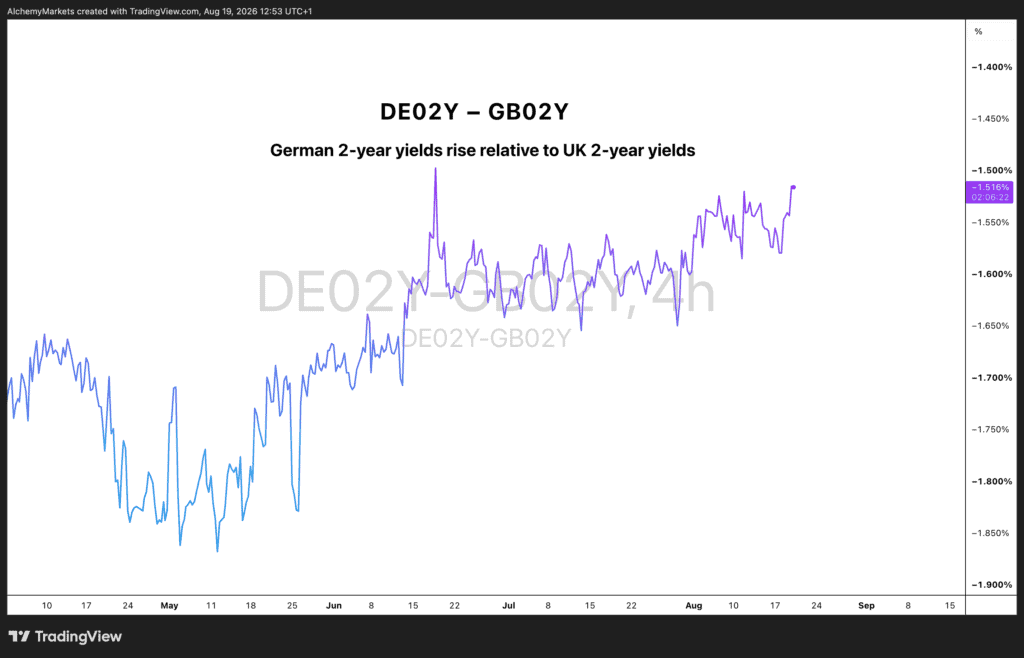
This is where our first chart becomes important.
The German 2-year minus UK 2-year yield spread has been trending higher. The spread is still negative, which means UK 2-year yields remain above German 2-year yields in absolute terms. But the direction is what matters most.
A move from around -1.85% towards -1.52% tells us that German 2-year yields are rising relative to UK 2-year yields.
That means the UK’s short-end yield advantage is narrowing.
For EUR/GBP, that is a useful confirmation signal because the 2-year maturity is much more sensitive to ECB versus BoE policy expectations than the 10-year end of the curve. So this chart is not just showing a general rates move. It is showing that markets are beginning to lean slightly more towards the euro on a relative policy basis.
That creates a cleaner cause-and-effect chain:
Euro-area inflation looks a little stickier than UK inflation
↓
Markets price relatively firmer ECB expectations
↓
German 2-year yields rise relative to UK 2-year yields
↓
Sterling’s rate advantage narrows
↓
EUR/GBP finds support
That is a much stronger macro narrative than simply saying “Europe CPI was hotter, so EUR/GBP should rise”.
What needs to happen next to keep the narrative alive?
For the bullish EUR/GBP view to continue, we would want the next batch of data to keep reinforcing the same divergence.
On the euro-area side, the bullish case is strengthened if:
- underlying inflation remains firm rather than easing quickly;
- activity data stay reasonably resilient;
- ECB expectations remain supported;
- German 2-year yields continue outperforming UK 2-year yields.
On the UK side, the bullish EUR/GBP case is strengthened if:
- services inflation keeps cooling;
- wage growth continues to moderate;
- UK activity data soften a little;
- BoE expectations fail to become more hawkish than ECB expectations.
So the market will now be watching whether this relative inflation gap keeps feeding into the short-end rate differential.
If it does, the fundamental story continues to support EUR/GBP upside.
If it does not, and UK data begin re-accelerating again, then sterling could quickly regain support.
That is the key risk to the idea.
If the next run of UK data shows that the energy shock is bleeding back into wages, services and broader domestic pricing pressure, markets could start re-pricing the BoE more aggressively again. In that case, UK 2-year yields could stabilise or outperform, and the EUR/GBP bullish narrative would weaken.
Technical picture: bull flag still in play
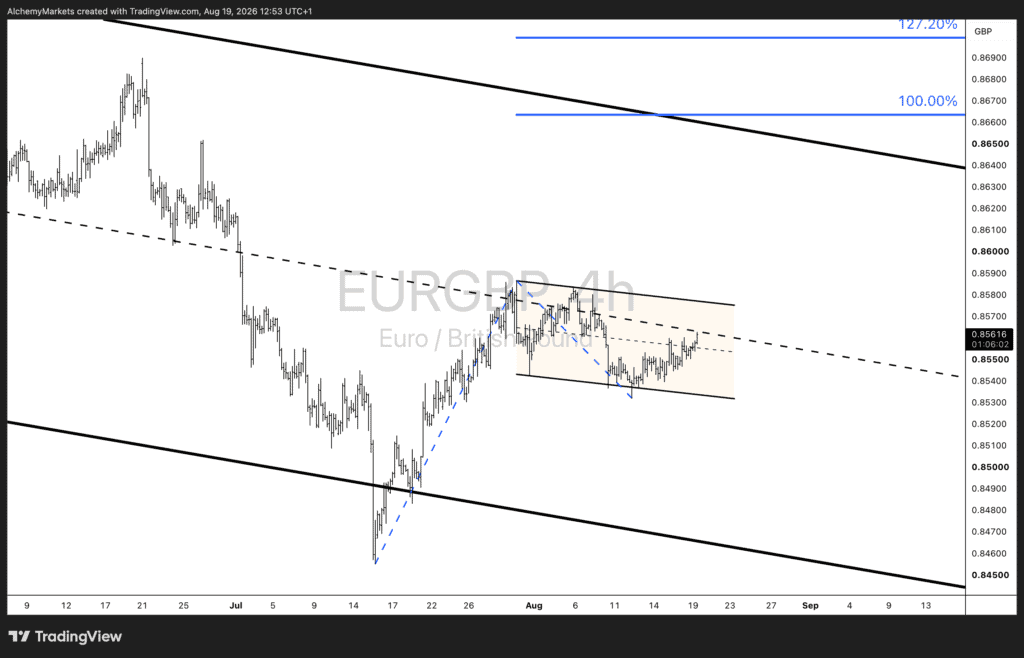
The price action is lining up with the macro story quite well.
On the 4-hour chart, EUR/GBP has been consolidating in what looks like a bull flag after its sharp rebound from the July lows. Price is now working its way back towards the upper boundary of that structure.
Momentum is also supportive. RSI is holding above 60, which suggests bullish momentum is still present without the pair being excessively stretched.
That matters because it tells us the market is not simply drifting higher. There is still some constructive momentum behind the move.
If EUR/GBP breaks above the flag, the next major level to watch is the 0.8660 resistance zone.
That level is important because it lines up with the resistance area marked on the chart and represents the next meaningful upside objective if the current consolidation resolves higher.
So the technical roadmap is fairly straightforward:
Bull flag holds
German 2-year yields continue outperforming UK 2-year yields
Relative inflation story stays more supportive for the euro
=
Pressure builds towards 0.8660
Opening Bell takeaway
Today’s inflation data did not deliver a simple “UK bad, Europe good” story. It was more nuanced than that.
The UK’s inflation rise looks more externally driven, with domestic persistence showing some improvement. The euro area, by contrast, still looks a little firmer underneath the headline. At the same time, the German 2-year minus UK 2-year spread has been rising, showing that rate markets are beginning to move in the euro’s favour on a relative basis.
That gives EUR/GBP a credible macro foundation just as the pair continues to trade inside a constructive bull flag.
If that relative-rates trend remains intact and the flag breaks higher, 0.8660 is the next upside level to watch.