Written by:

- Opening Bell
- October 9, 2026
- 4 min read
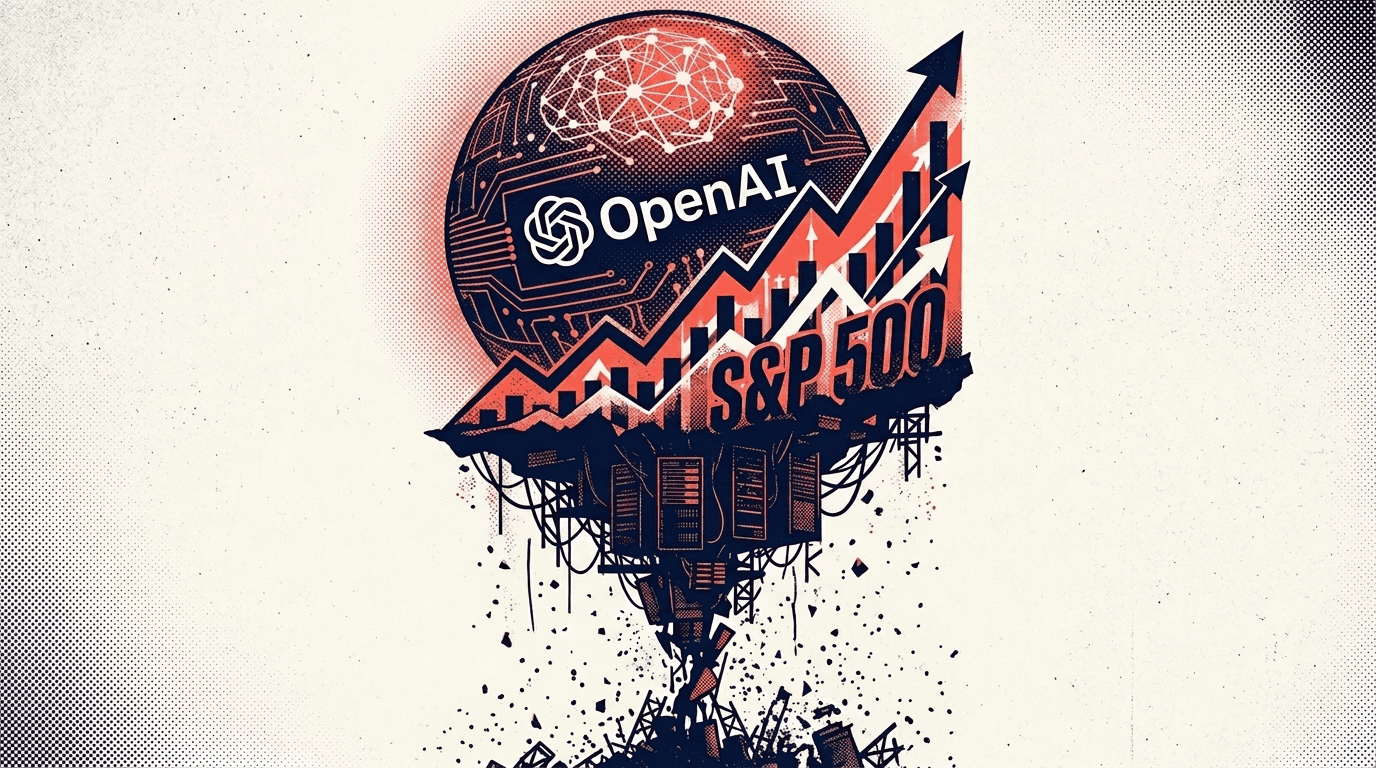
OpenAI’s $20B Revenue Gap: Warning Signs for US Stocks?
Are warning signs finally arriving in the AI-driven US equities market?
OpenAI just gave investors a scare. Reports on 8 October put its annualised revenue at nearly $50 billion, around $20 billion below the $70 billion figure reported earlier. Annualised revenue is the current pace of sales projected over a full year, not revenue already collected over 12 months.
But there is a catch. The two figures were not calculated in the same way. Some earlier estimates counted more sales made through cloud partners, while OpenAI’s reported figure left out the partners’ share of certain sales. So OpenAI has not been shown to have suddenly lost $20 billion in customer spending.
In fact, Bloomberg has since reported that OpenAI expects its annualised revenue to reach at least $70 billion by the end of 2026, helped by enterprise customers. That is still a target, not a completed result.
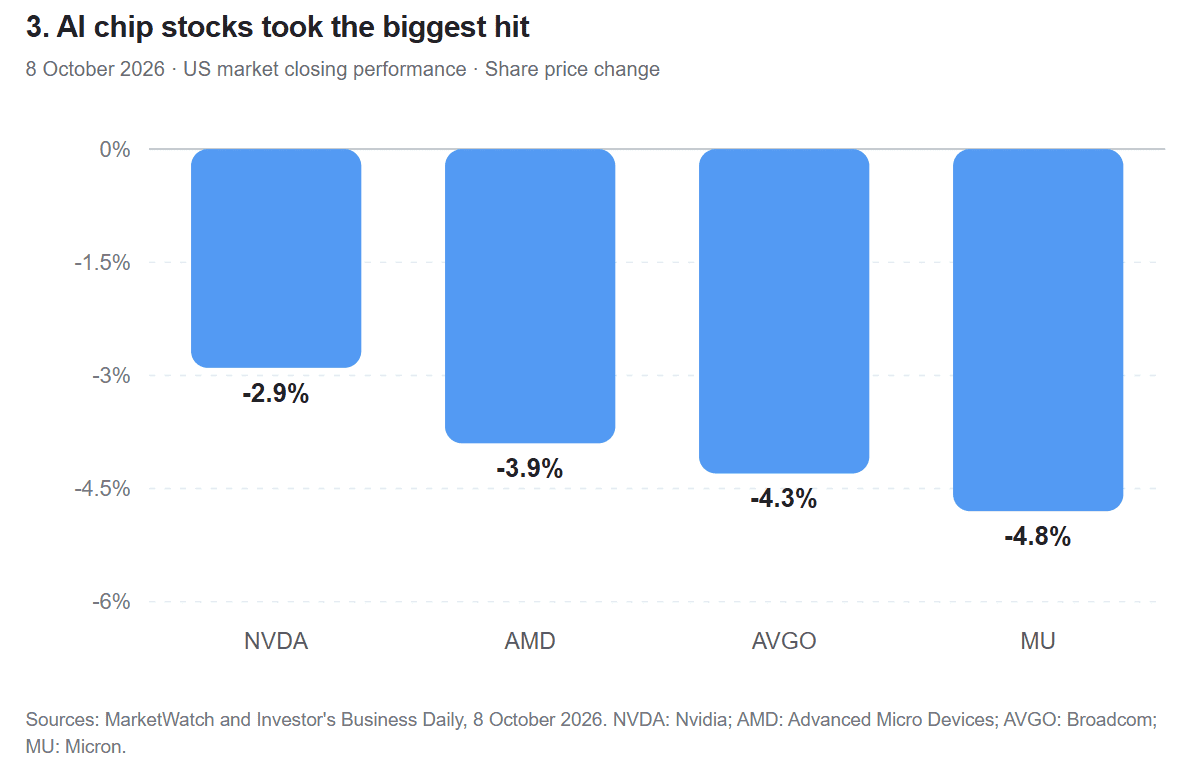
The report shook AI stocks on 8 October. The Nasdaq fell 1.3%, Nvidia lost 2.9%, AMD dropped 3.9%, and Oracle fell 5.5%. Investors questioned whether profits could catch up with AI spending.
Are We Still in an AI-Led Market?
For now, yes. AI companies are spending heavily on chips and data centres. Nvidia and other suppliers collect revenue today, while their customers still need to earn enough from AI services to pay for it.
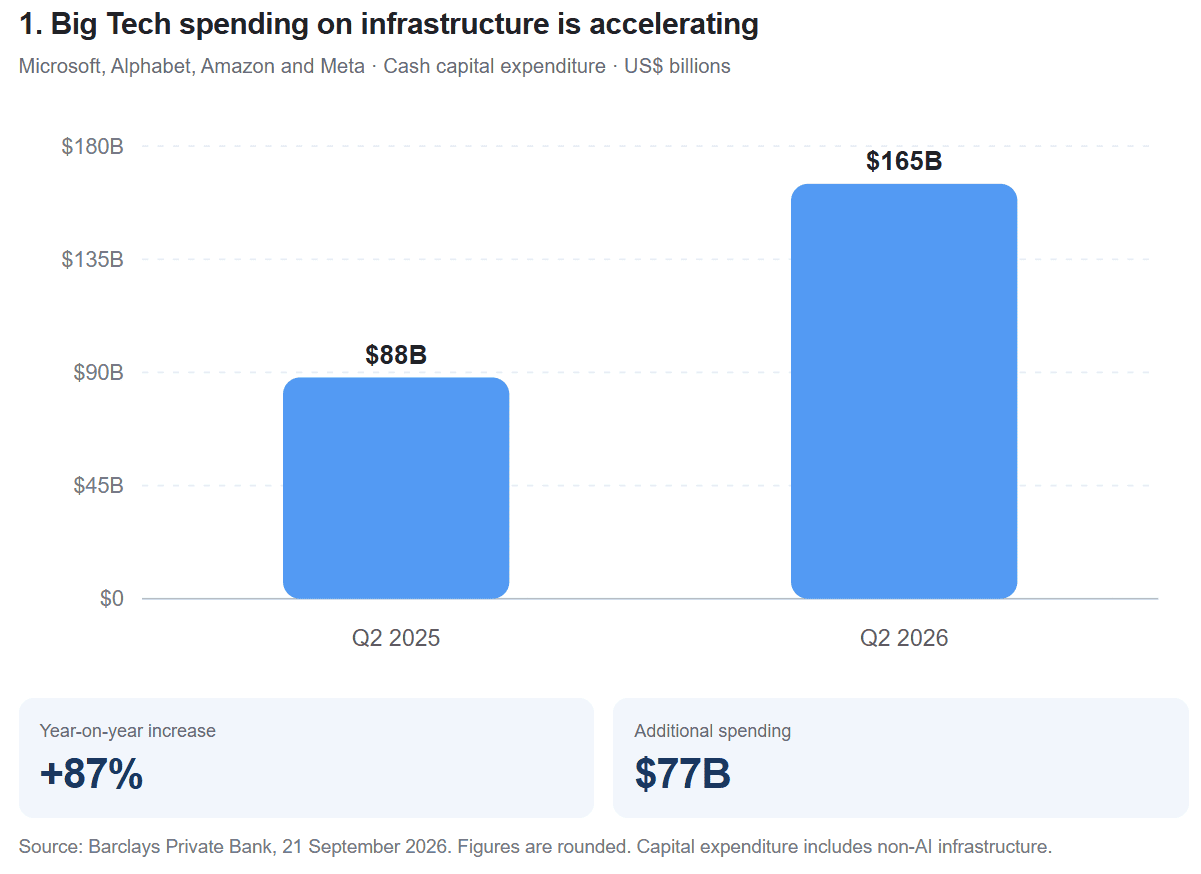
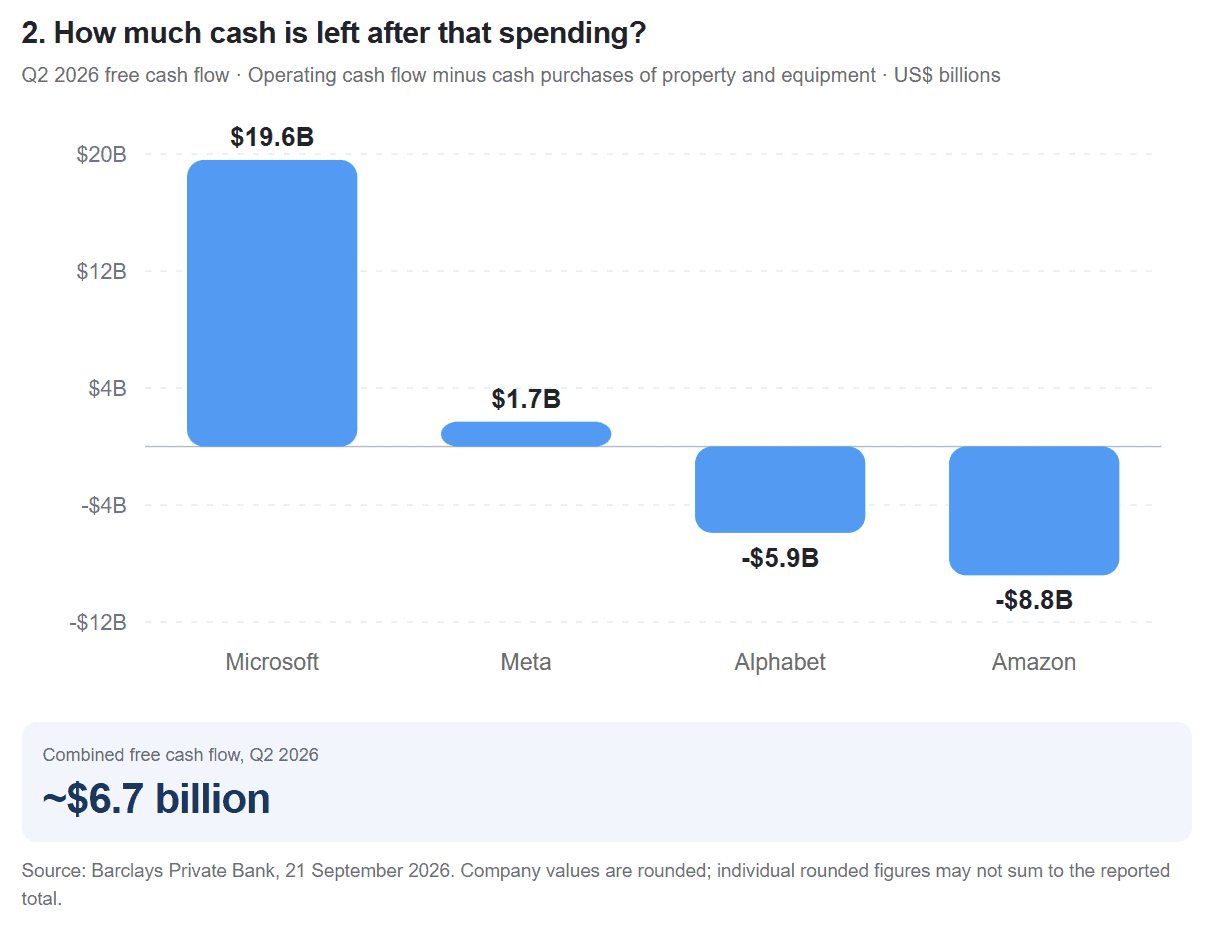
And the spending is enormous. According to Barclays, Microsoft, Alphabet, Amazon and Meta spent a combined $165 billion on capital equipment in Q2 2026, up from $88 billion a year earlier. After those purchases, the four had only about $6.7 billion in combined free cash flow. There is strong demand, but there is also far less cash left over.
Higher US Treasury yields make loans more expensive, while fast-growing AI companies can still attract investors. I am watching three things: AI customer revenue, cash left after spending, and whether chip orders keep growing. Weakness across all three would be a much stronger warning than one confused revenue headline.
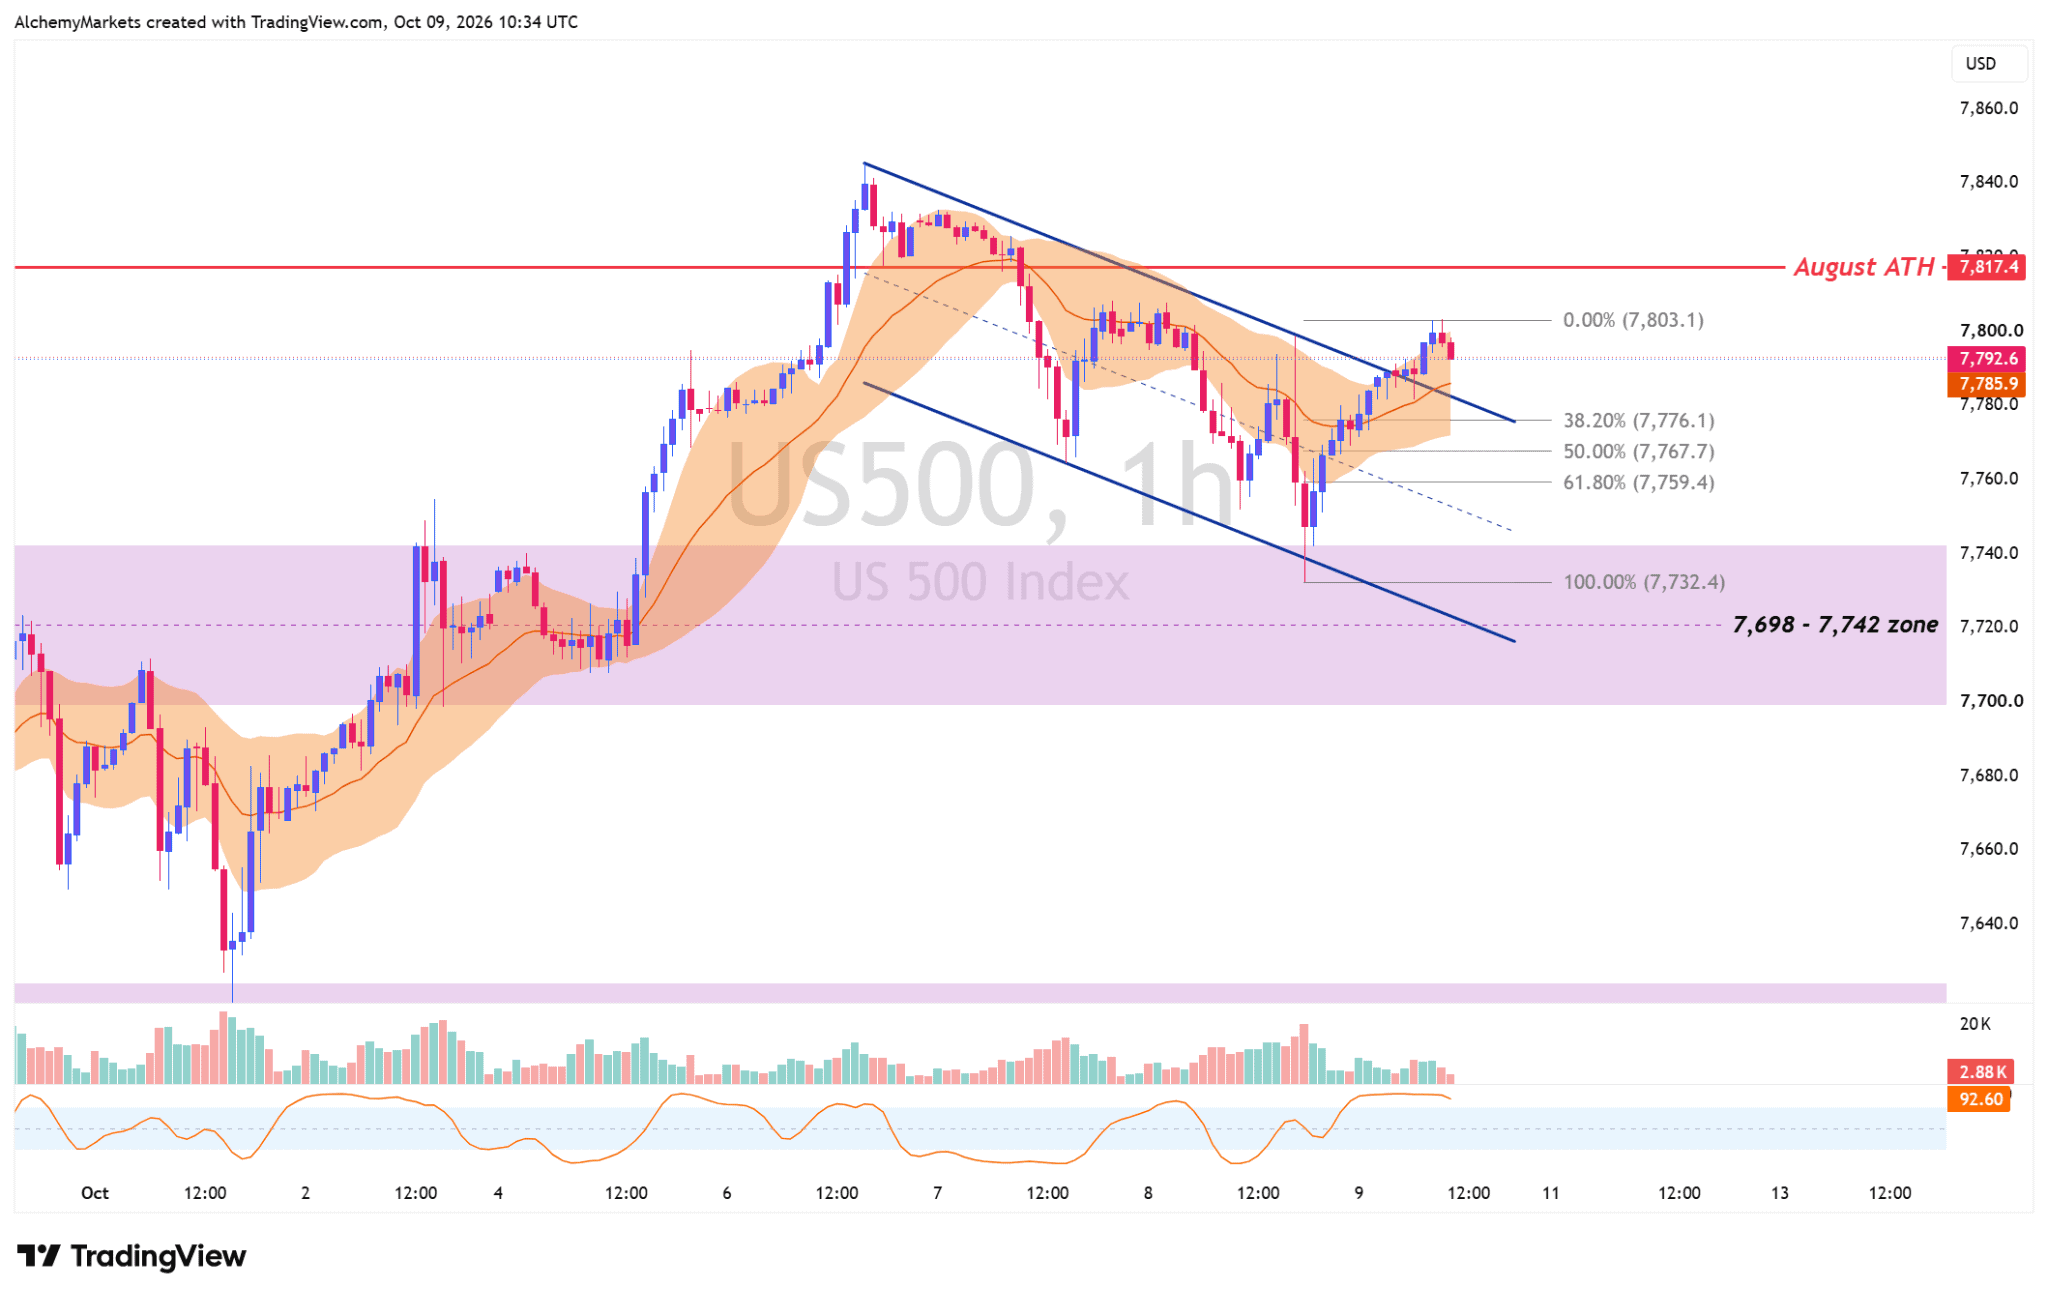
Going over the S&P 500 charts, we can see the short term is still positioned for more upside, with targets around the round 8,000 number. The warning from OpenAI has not broken the broader technical trend.
S&P 500 CFD Chart (US500) – 1H Timeframe
- Shows a bull flag which could be breaking out.
- Trending on the 20H-EMA Bollinger Bands® (1 standard deviation).
- Targets around 8,000, which also aligns with the top of the broader rising channel.
S&P 500 Cash Chart – Weekly Timeframe
- The S&P 500’s longer-term structure is still healthy, with price approaching its previous August highs.
- The triangle pattern’s target is around 7,950, near the top of the rising channel.
- The blue band is the 100W-EMA band at 0.5 standard deviation, an area I would watch if the S&P suffers a much harder decline.
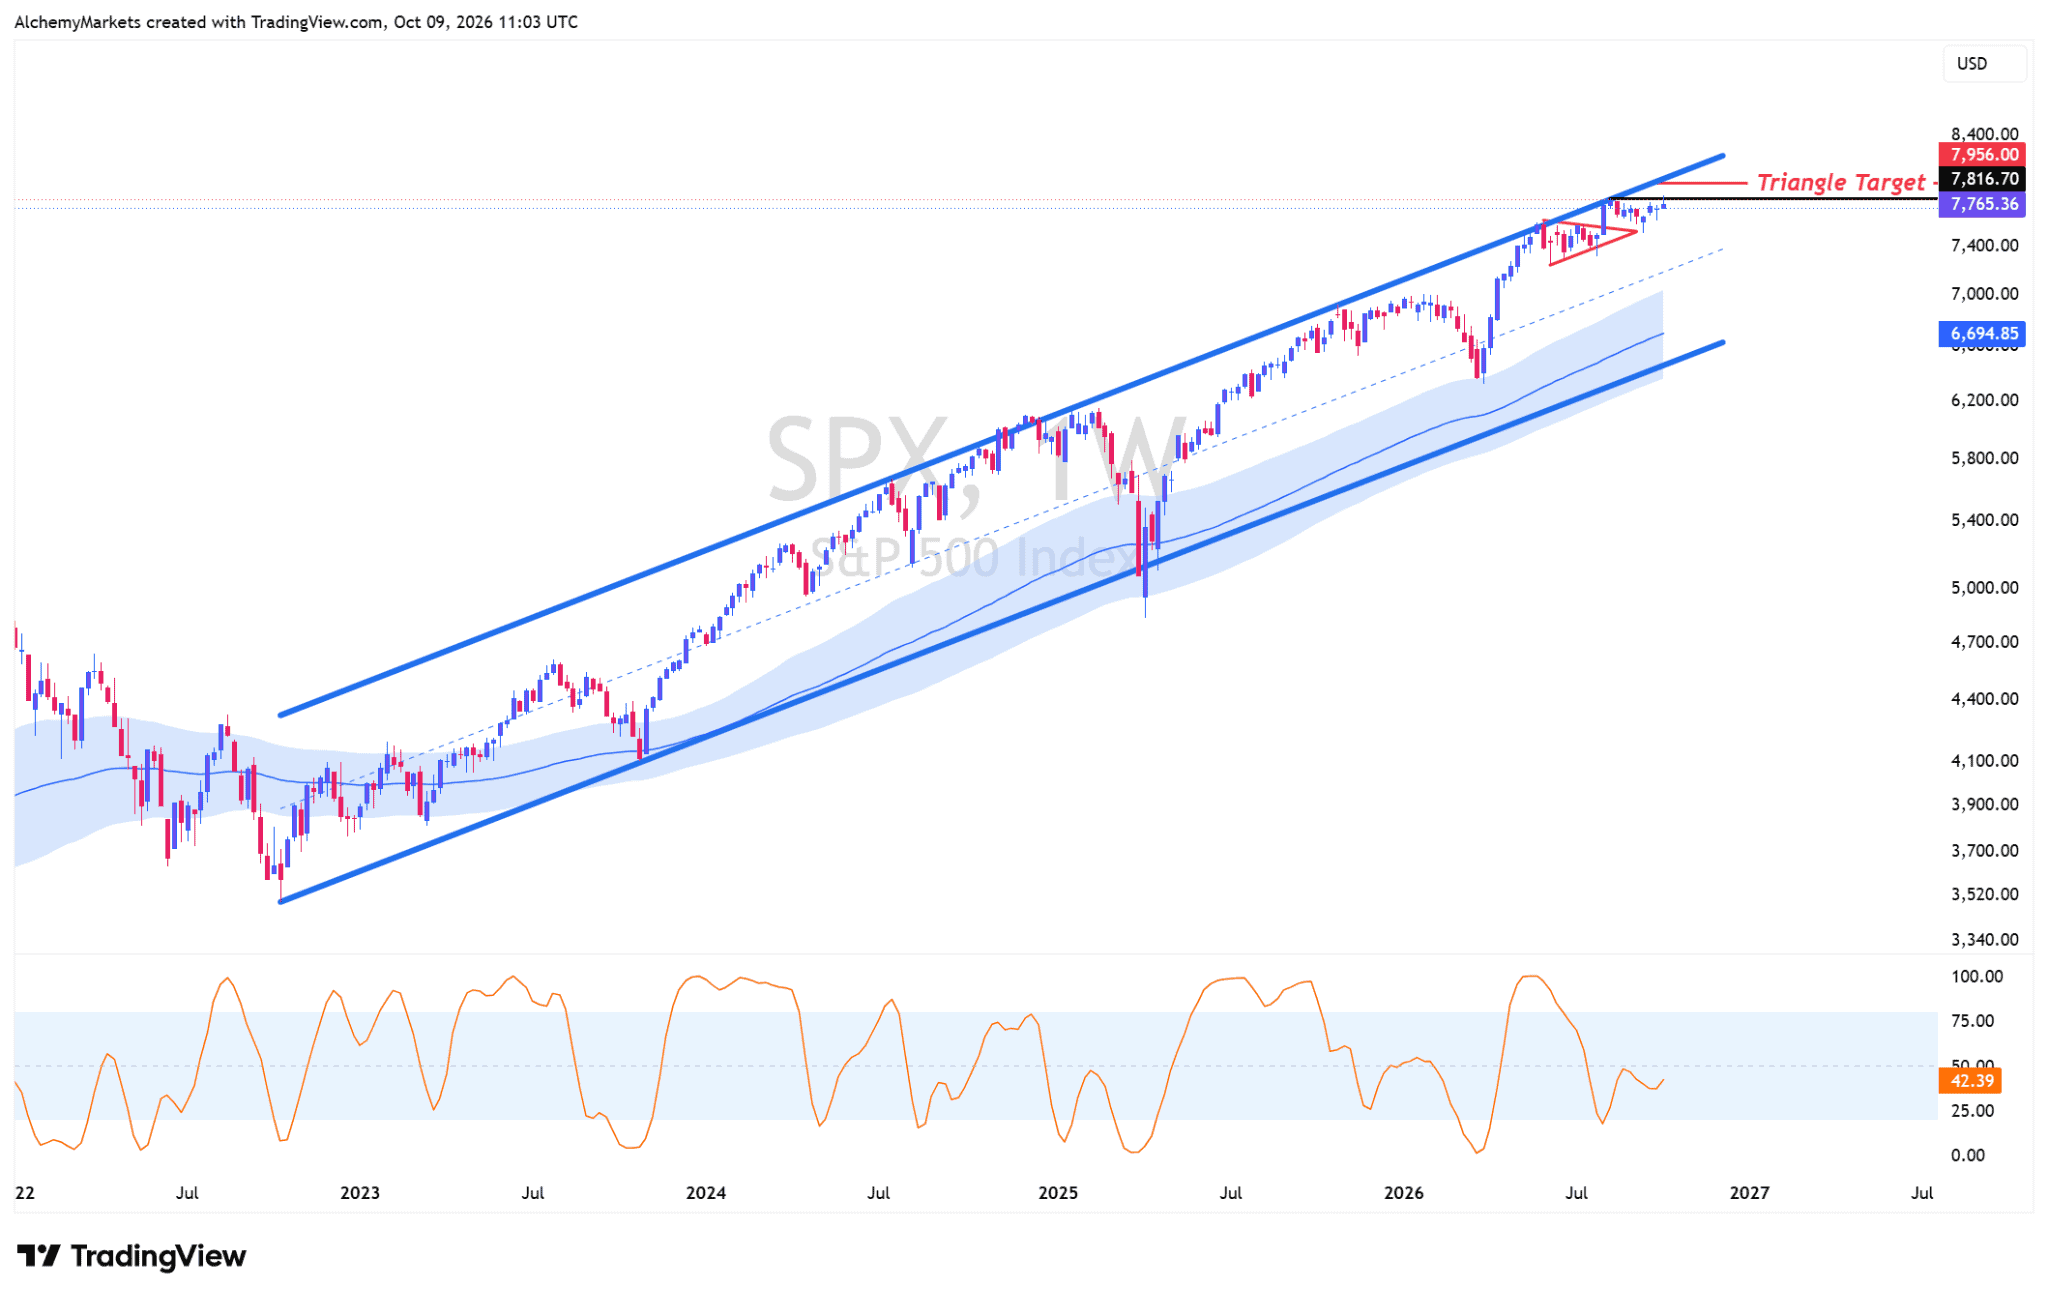
So yes, even though this is a warning sign, it is not a full-blown signal that demand for AI is dead, nor is it reason to abandon temporary upside on the S&P and Nasdaq.
RSP: The Rest of the Market Looks Less Convincing
The same cannot be said, however, for RSP, the equal-weighted S&P 500 ETF. Unlike the normal S&P 500, RSP gives each company the same weight. It shows whether other stocks are keeping up with AI giants.
We have broken below the 20D-EMA band (1 standard deviation), which keeps my daily-chart bias to the downside. RSP actually rose 0.6% on 8 October, but one good session does not erase the broader warning while price remains below the band.
Even if RSP grinds higher from here, I would expect the top of the band, or even an overshoot towards 214–216, to face selling pressure. My downside level remains around 207.
The Stochastic RSI is also approaching overbought territory after the rebound, despite RSP still trading well below its previous highs.
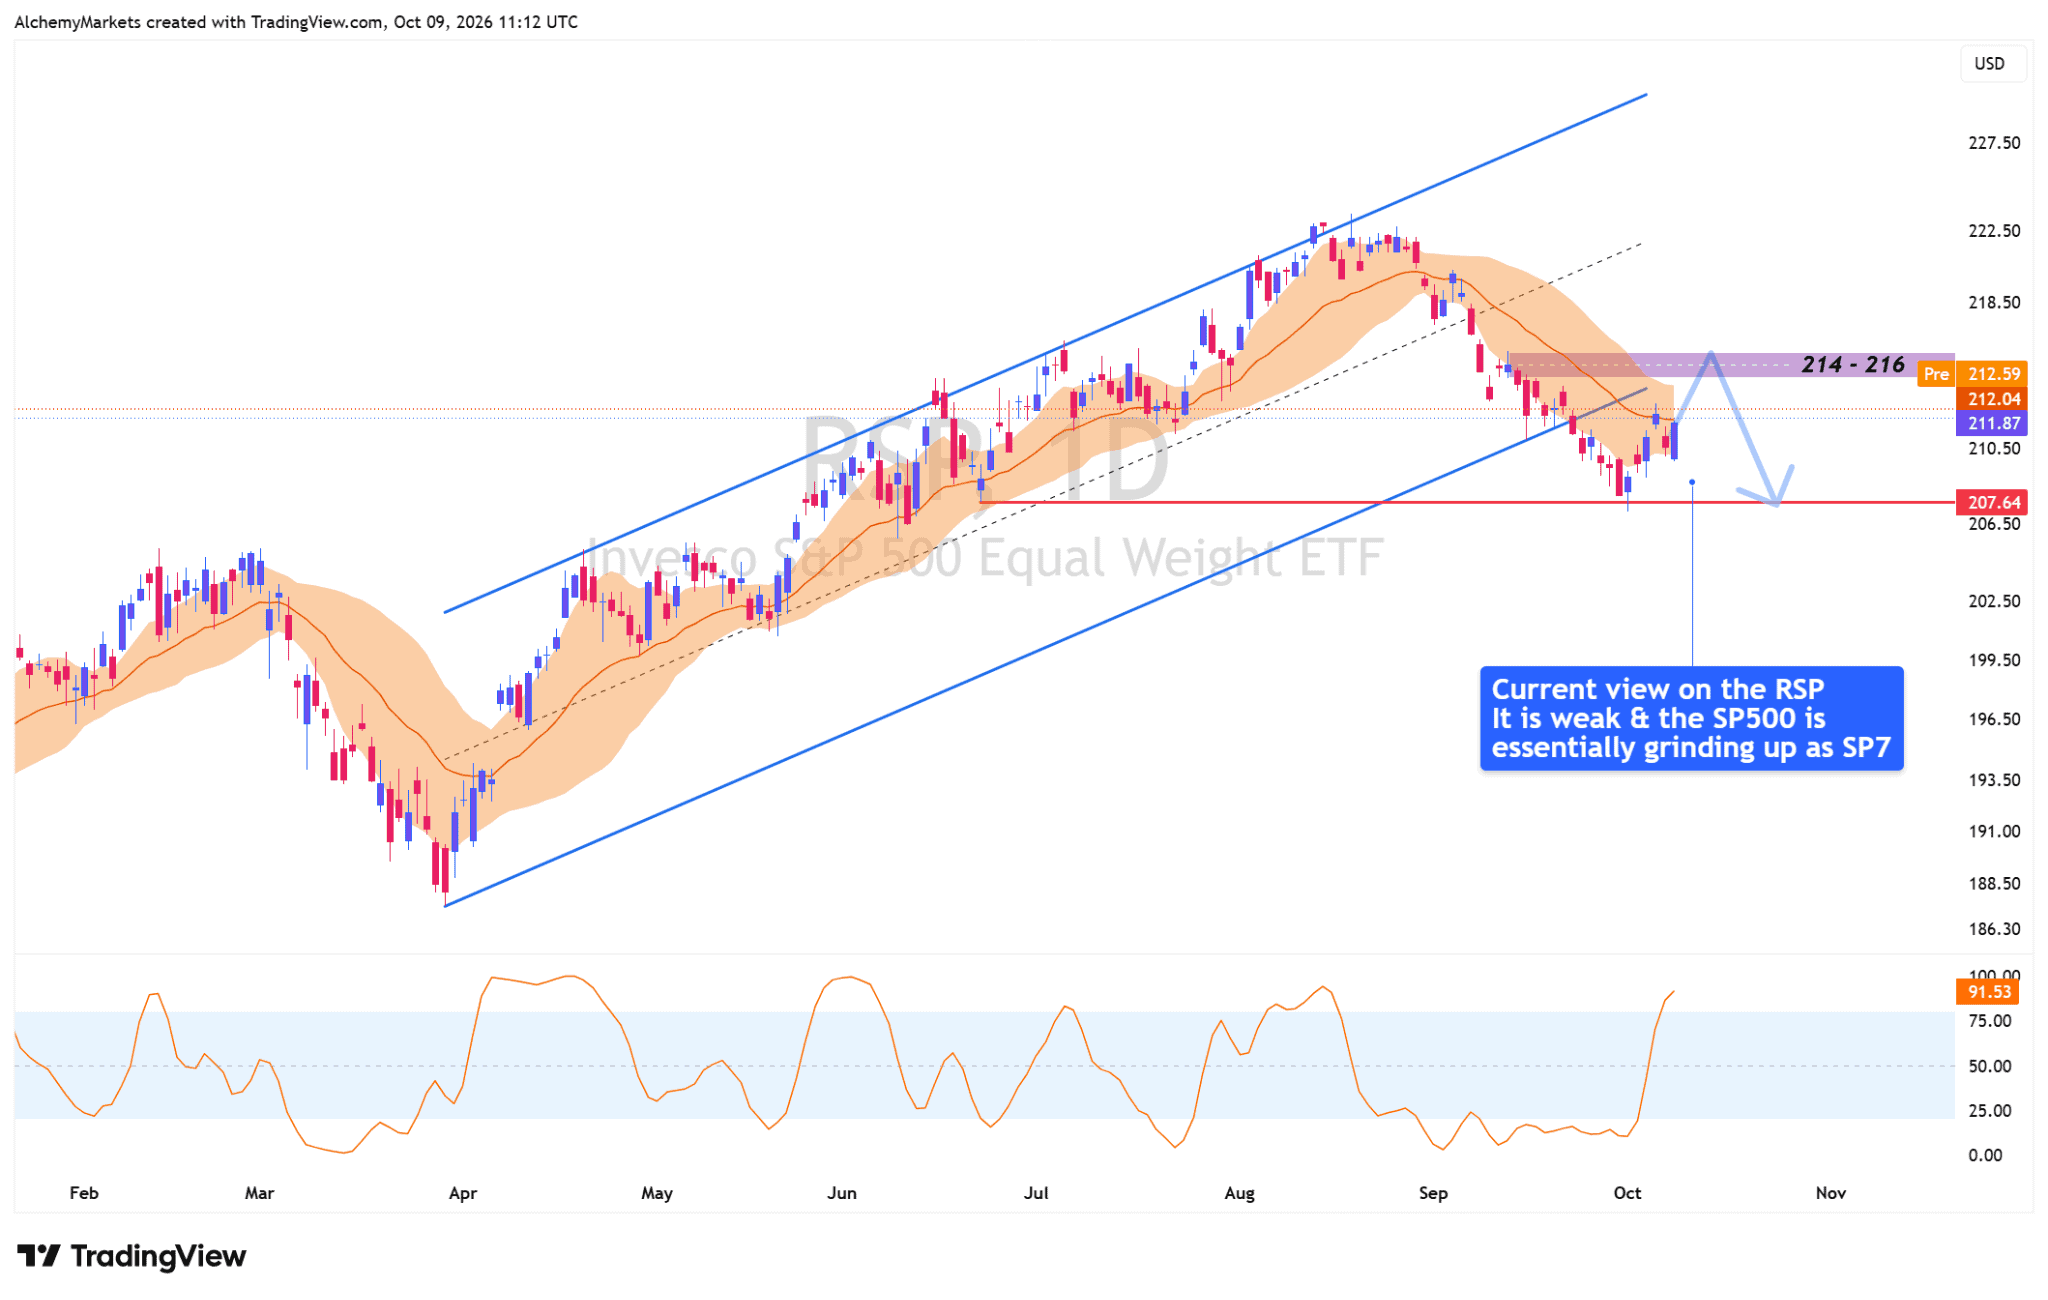
My position changes when RSP breaks and holds above the 20D-EMA band. Until then, the S&P can still rise towards 7,950–8,000 while the average stock struggles.
Bottom Line: We are still in an AI-led market regime. The OpenAI headline shows how easily confidence can wobble, but the reported $20 billion gap is not proof of collapsing demand. I would respect the S&P’s upside while watching RSP, AI profits and cash flow for signs that the spending boom is beginning to run out of support.