Written by:


- Opening Bell
- October 8, 2026
- 5 min read
TSMC Blowout Earnings: What This Means For Markets
TSMC has just reported a record third quarter and its strongest-ever September sales.
Yet its US-listed shares had already slipped from $487.47 on 5 October to $472.20 at Wednesday’s close.
Has the AI rally moved too far ahead of earnings?
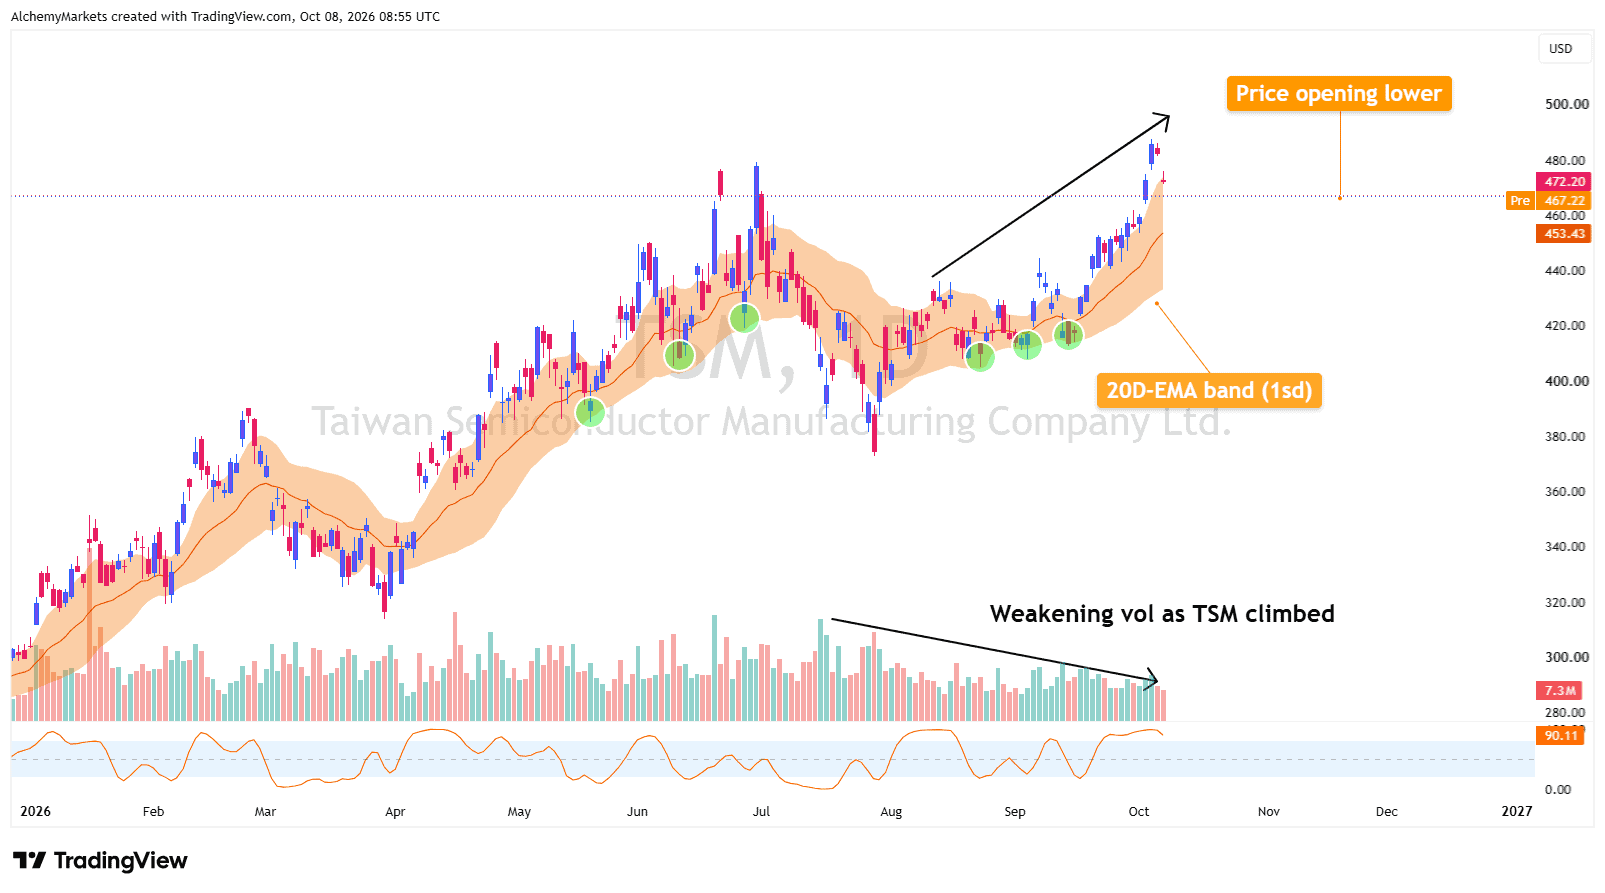
| TSMC daily chart from: The 20-day EMA near $453.43 and lower band near $433 reflect the supplied chart. |
Interestingly, the earnings have been anything but weak. TSMC’s third-quarter revenue hit $46.71 billion, up 50% from last year and above its $44.6 billion to $45.8 billion forecast. So why is the stock retreating?
Part of the answer is valuation. TSMC trades near 20–21x times forward earnings, against roughly 19 times for the S&P 500.
Attaining TSMC now is simply not a bargain relative to the S&P 500 and other stocks, so investors simply could be taking profit and rotating out.
That doesn’t mean that the AI market is in danger, because fundamentally, TSMC is doing really well. This price action is just a product of natural budget allocation by hedge funds and investors.
Nvidia, Apple and designers of custom AI chips are all reliant on TSMC’s advanced factories, so there is no shortage of high value customers for AI hardware.
The catch is that building more capacity is expensive, so margins must hold up; which they are.
Other AI Hardware Companies
Samsung’s latest numbers add to the case. Its preliminary third-quarter operating profit reached 107.4 trillion won, nearly 9x times last year’s level, helped by memory shortages. Yet Samsung shares still fell after the good news.
That’s why we could pullback on TSMC today without truly changing the broader uptrend.
Rotation plays, profit-taking, and simply just a perception of overextension can all play a role in a fundamentally bullish market’s decline.
Nvidia is near 17x forward earnings in one recent comparison, while Micron is around 6x and Samsung 4x, and they would be considered cheap by P/E ratio standards. Yet all of them are currently pulling back.
Nasdaq CFD Chart Analysis
The Nasdaq CFD (USTEC) weekly chart remains constructive for now; but as AI hardware begins to pull back, the risk of a retracement on the Nasdaq also increases.
Price is still inside a rising channel, with its 20-week EMA bollinger bands acting as support. So even if we have a pullback here, the broader uptrend isn’t finished.
In such an instance, Nasdaq could retest the bull flag or the 20W-EMA band (1 sd) as support, before continuing higher.
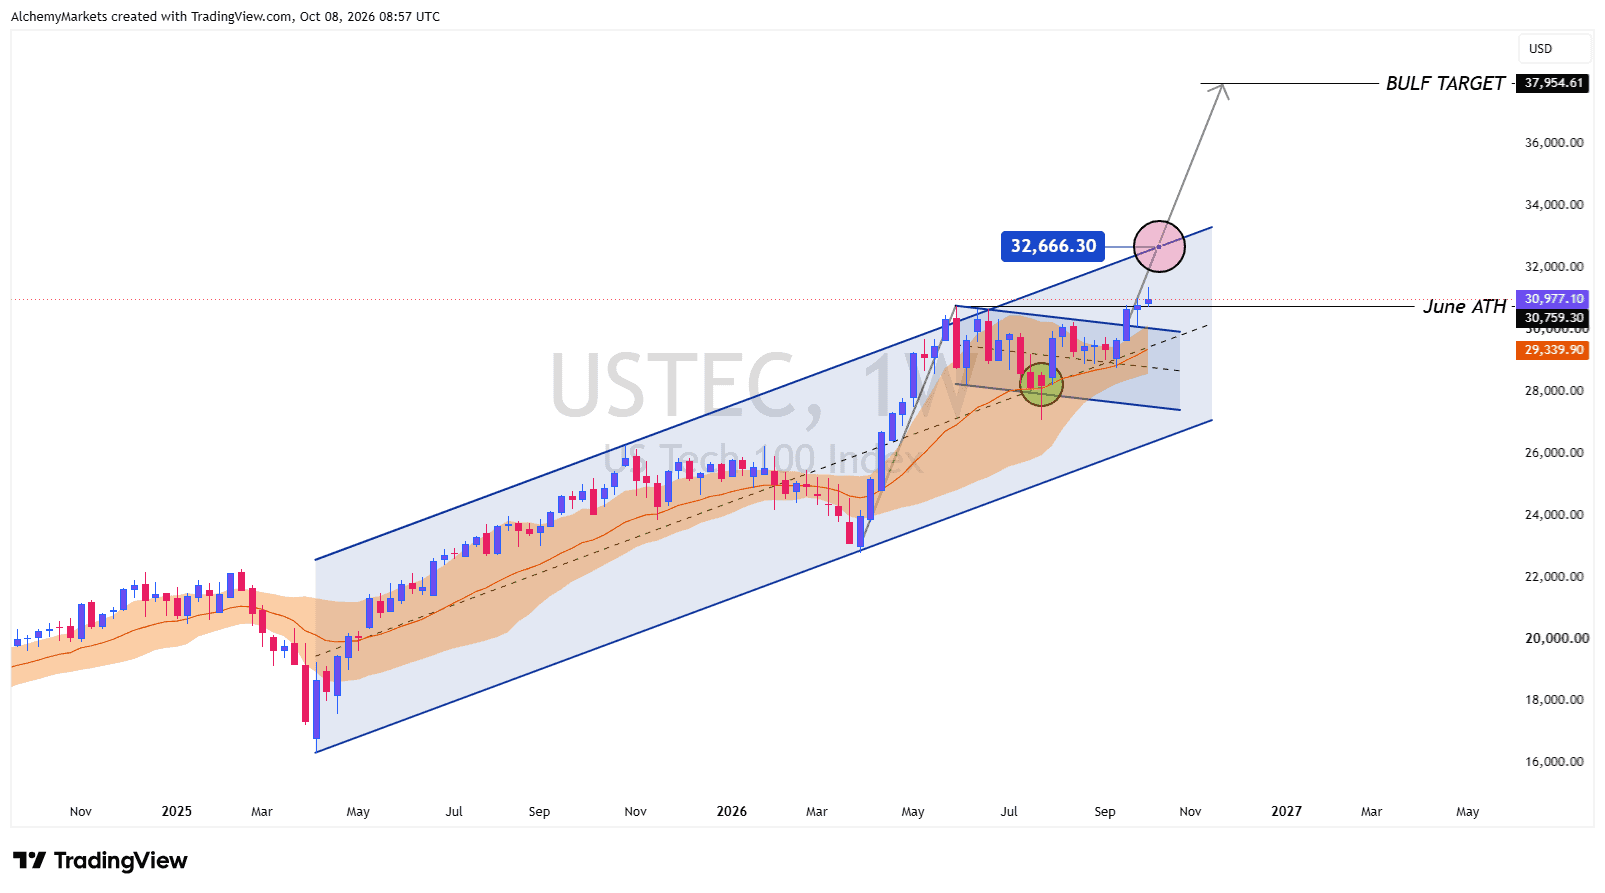
| USTEC weekly chart: The weekly rising channel remains the broad trend check. |
US Yields Pressure AI Borrowing Costs
Then we have Treasury yields. The US 10-year is near 5.27%, while the inflation-adjusted 10-year yield is around 2.91%. Higher real yields make future profits worth less today, putting pressure on the P/E investors will pay.
But a particular yield number is not the real breaking point. The bigger problem arrives when borrowing becomes too expensive for AI buyers to keep ordering new servers, chips and data centres.
Meta expects $130 billion to $145 billion in capital spending and finance-lease payments this year.
Its second-quarter free cash flow fell to just $784 million despite growing advertising revenue. Even profitable AI buyers are feeling the cost of expansion.
Others are using outside financing. Broadcom has agreed to lend Anthropic up to $42 billion for computing infrastructure, while SpaceX is reportedly seeking $40 billion in debt to buy Nvidia chips.
Companies building AI hardware (like Broadcom and Nvidia) are directly or indirectly lending money to the start-ups and tech firms buying their chips.
This creates a dangerous double risk (or feedback loop) for suppliers and lenders:
- Credit Risk: If Anthropic’s AI business doesn’t make enough money, it can’t pay back Broadcom’s $42 billion loan.
- Sales Risk: If Anthropic defaults, it also stops placing new orders for Broadcom’s hardware.
By financing their own buyers, chip suppliers are essentially manufacturing their own demand on credit.
If AI software fails to generate enough real-world profit to pay off these massive debts, two things happen at once: the loans default and the chip orders evaporate.
For TSMC, the main risk isn’t current demand. It just reported record Q3 revenue that topped expectations. The real warning sign would be downward revisions to 2027 earnings or shrinking margins as credit conditions tighten.
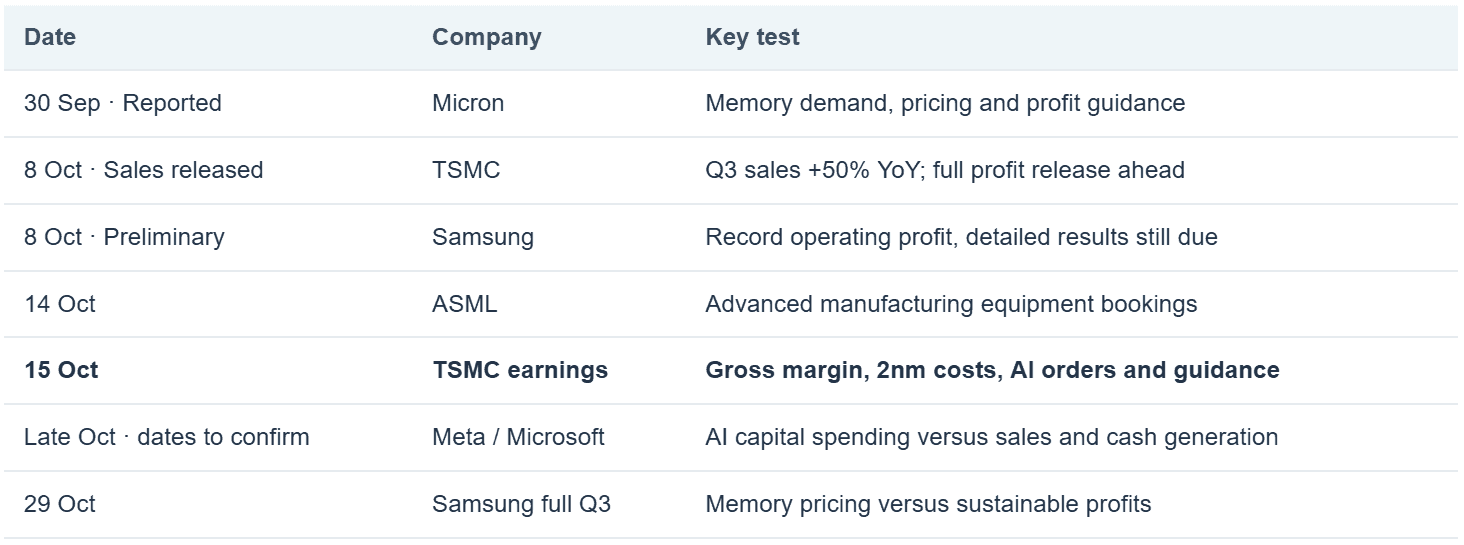
That shifts the focus to the October 15 earnings call 02:00 ET- one week from now.
Management aimed to keep about 65 to 67 cents of gross profit on every dollar made last quarter. But the big question now is whether TSMC can charge customers like Apple and Nvidia enough to cover its massive bills for new overseas factories and next-gen chip tech… without hurting its future earnings.
Tech Earnings to Watch
For now, holding the daily EMA band and USTEC’s weekly support would keep the broader uptrend intact.
A pullback towards $453.43, or even towards $433 – $440 currently seems more likely.
But as long as TSMC holds its daily EMA band and USTEC defends its weekly support, the broader bull trend remains intact.
A temporary dip toward $453.43 or even the 433 – 440 zone looks more like a healthy market breather than a structural reversal. If these key levels hold, it confirms that solid underlying earnings, not just hype, are still driving the AI rally.