Written by:

- Opening Bell
- July 20, 2026
- 5 min read
Can Alphabet Earnings This Week Save the AI Trade?
TSMC and Micron recently delivered powerful operating results, yet semiconductor shares continued to weaken.
That disconnect matters more than another headline beat. It suggests investors are looking beyond current demand and asking whether today’s AI spending boom can keep producing attractive returns.
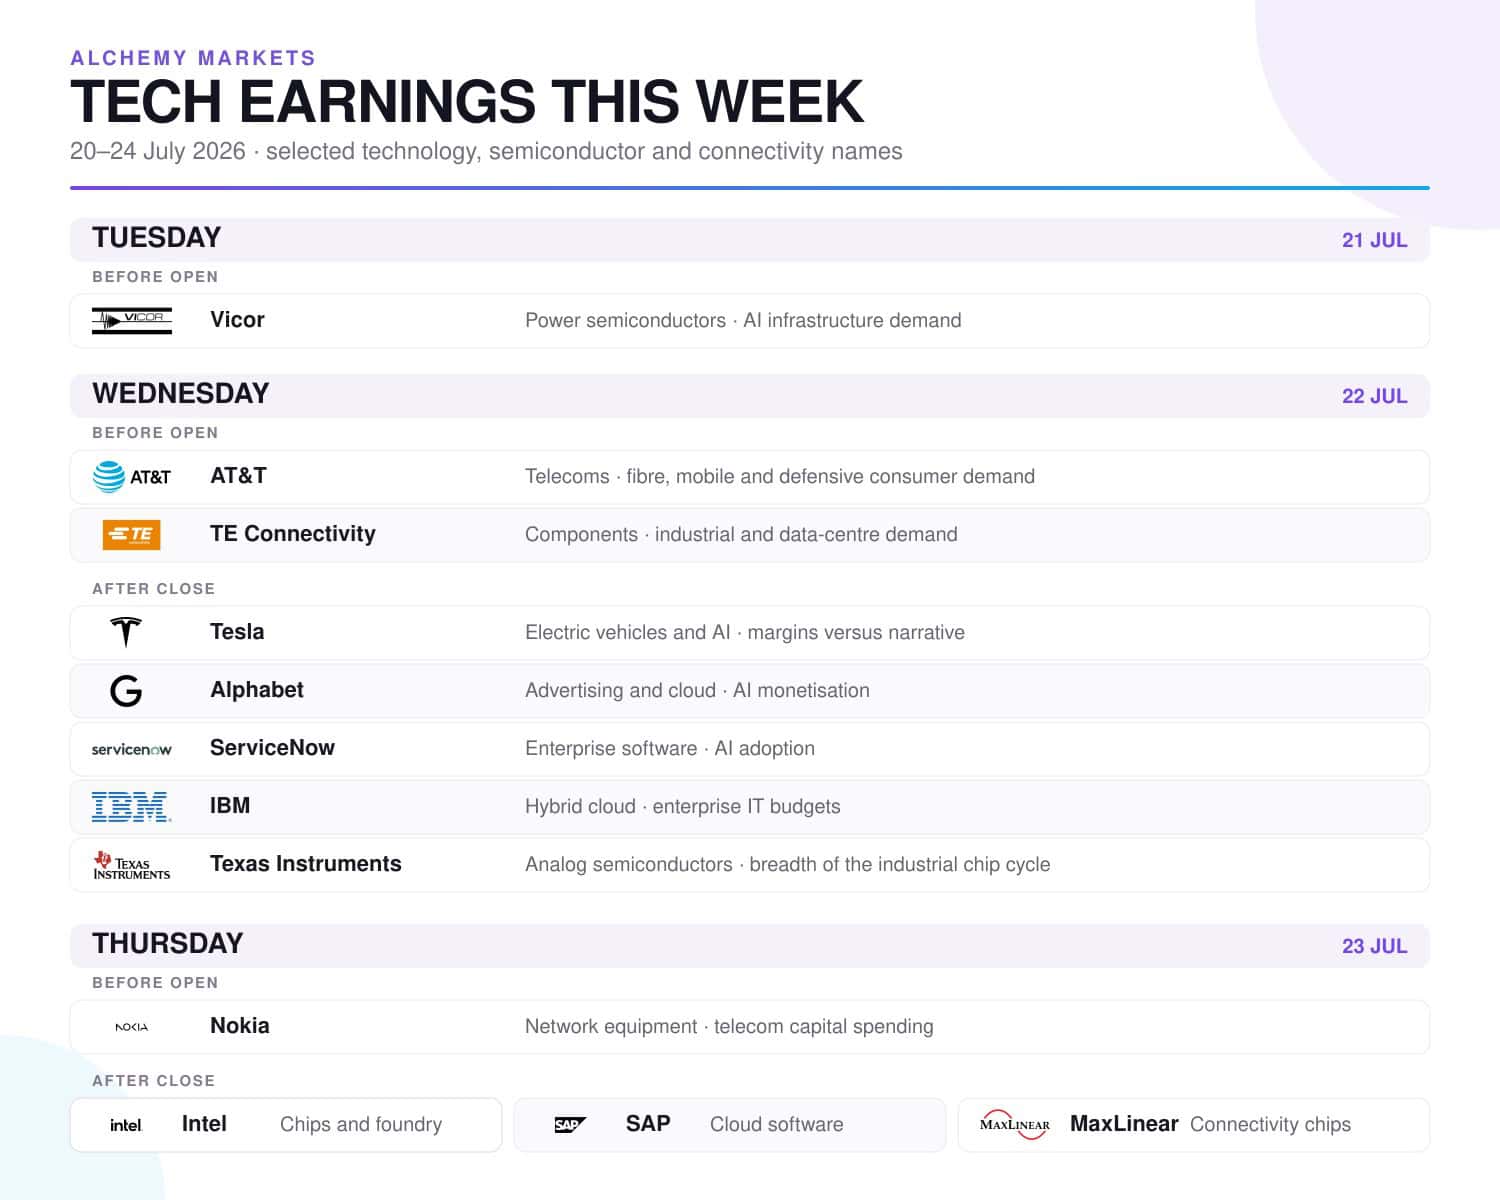
This week brings a broader test. Alphabet is the main event, while Vicor, Texas Instruments, ServiceNow, IBM and Intel provide different views of the same investment cycle. Tesla adds another high-valuation test, although its immediate debate is margins and cash flow rather than the health of semiconductors.
Why Alphabet matters most
Alphabet sits at the centre of the AI trade. It is both a major buyer of computing infrastructure and one of the companies expected to turn that investment into revenue through Google Cloud, Search, advertising and enterprise AI services.
That makes its report more important to the wider market than Intel’s. A strong update on cloud growth, AI monetisation and capital efficiency could support sentiment across data-centre suppliers. Weak guidance, slowing margins or another jump in spending without a matching revenue payoff would reinforce the concern that the AI build-out is becoming more expensive faster than it becomes profitable.
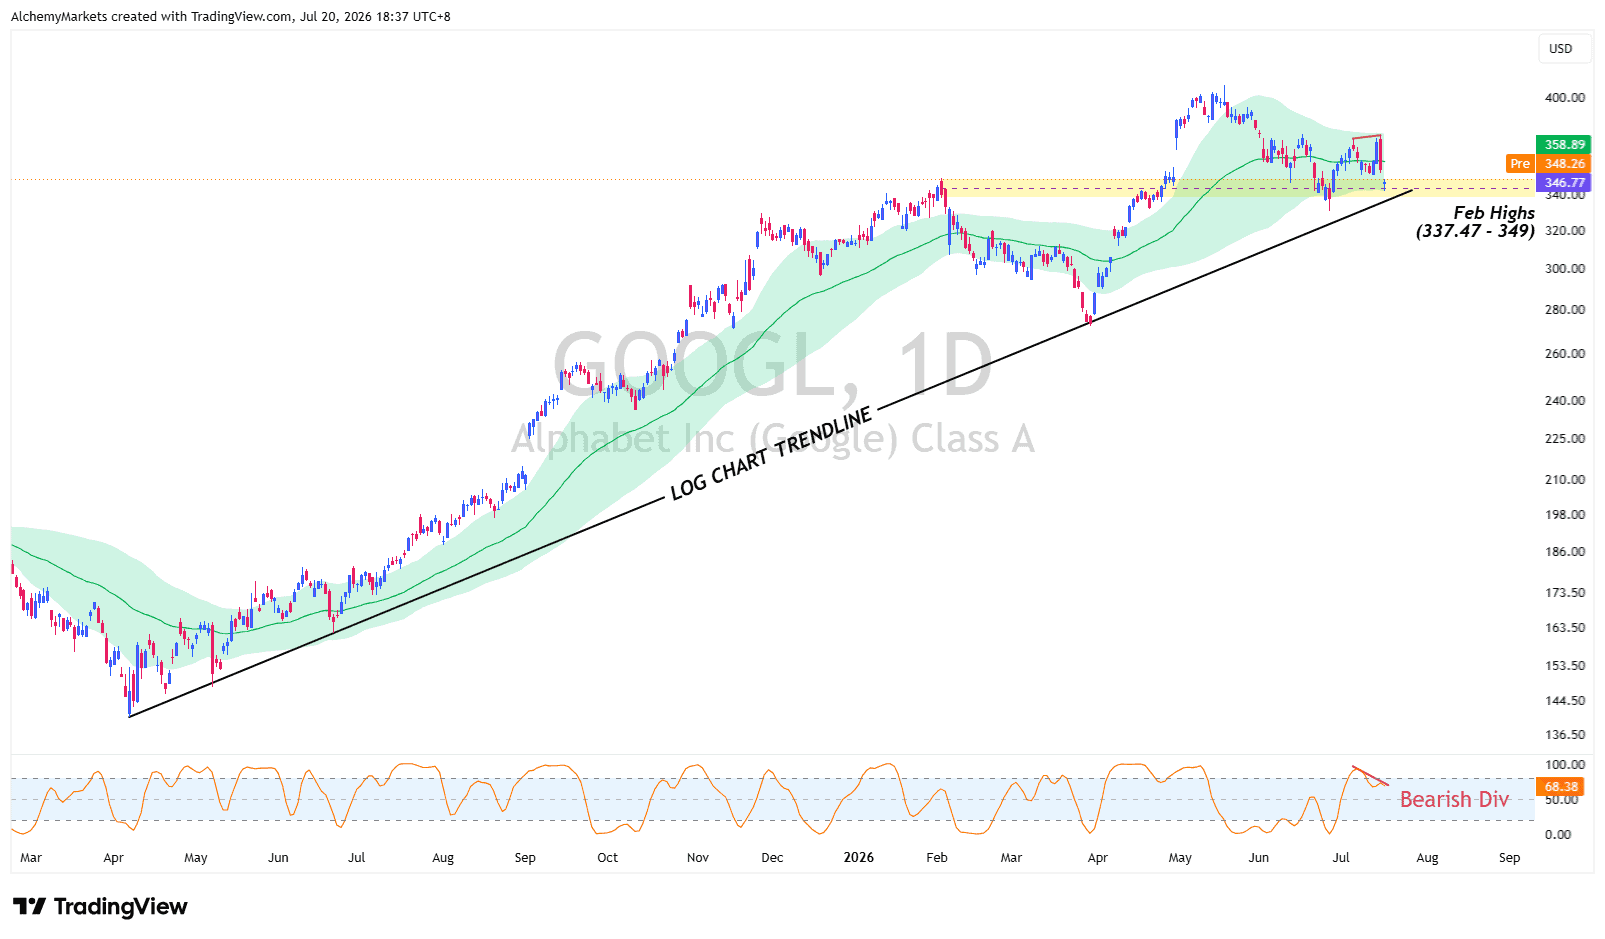
The chart reflects that uncertainty.
Alphabet has rejected the 373.52–378.56 neckline area and fallen back into the 337.47–349.00 support zone around February’s highs. Price is also testing the lower edge of its daily 50-period band and a longer-term logarithmic trendline.
The bearish divergence in Stochastic RSI warns that momentum weakened during the latest rebound. However, a momentum warning is not a sell signal by itself. Traders can use the Stochastic RSI together with price behaviour around support rather than assuming an oversold or diverging reading must reverse immediately.
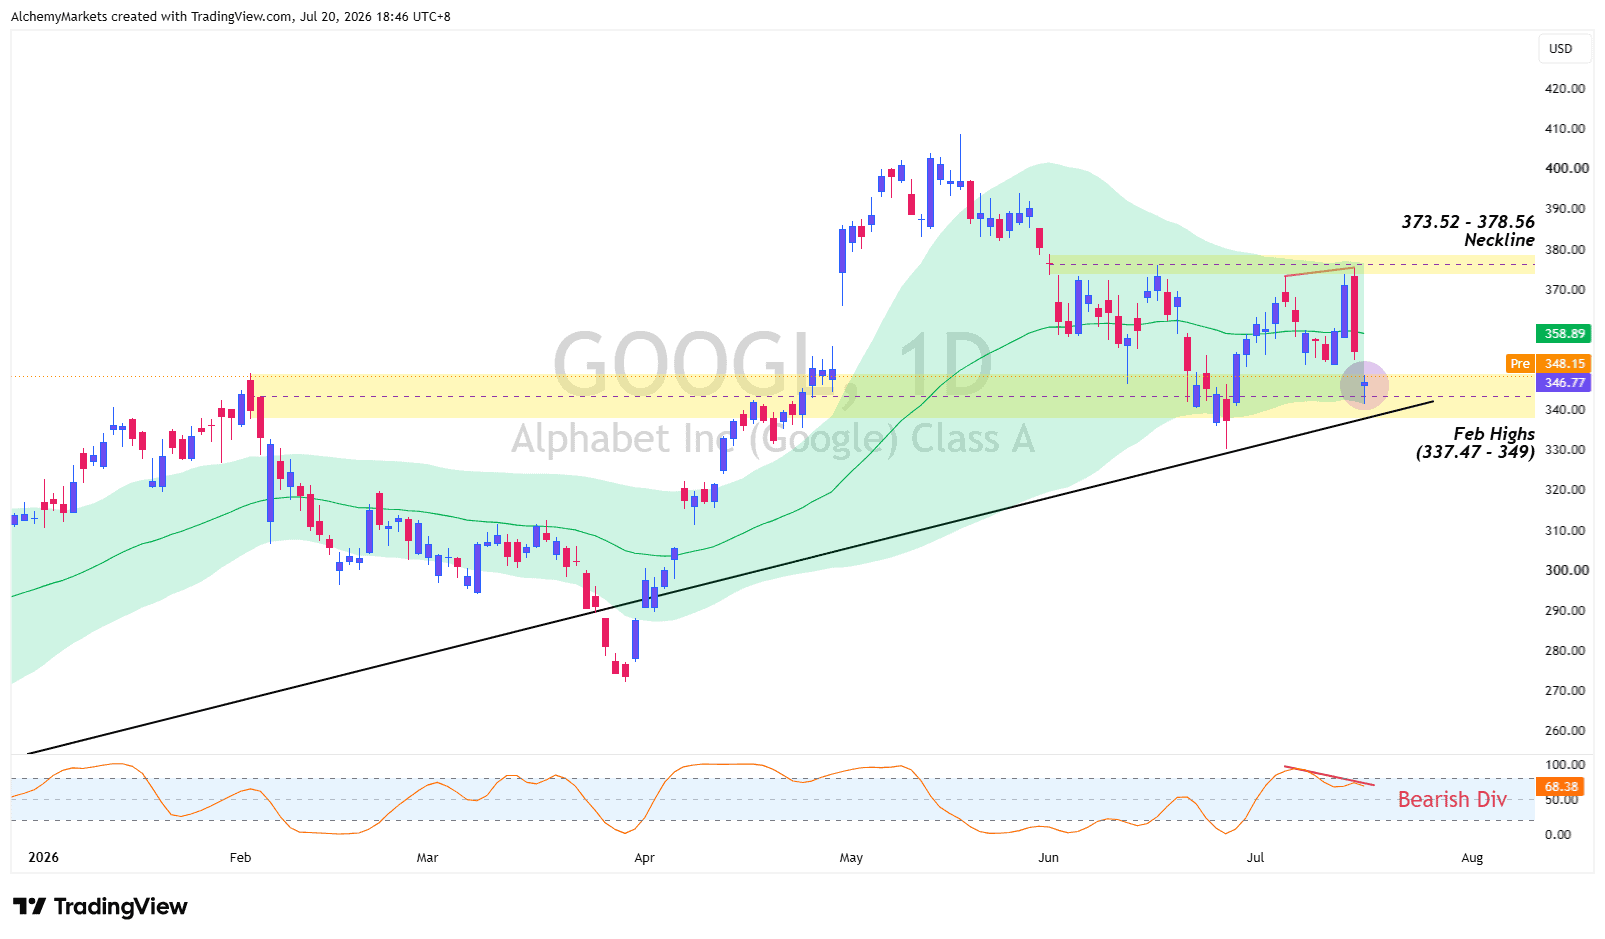
For bulls, holding this zone and reclaiming the 50-period average near 359 would improve the case for another attempt at 373.52–378.56. A confirmed break above that neckline would remove the immediate ceiling.
For bears, a daily close below 337.47 and the rising trendline would weaken the medium-term structure. The earnings reaction matters more than the first move. A gap that quickly reverses would show that the market still does not trust the headline result.
The Nasdaq is already at the decision point
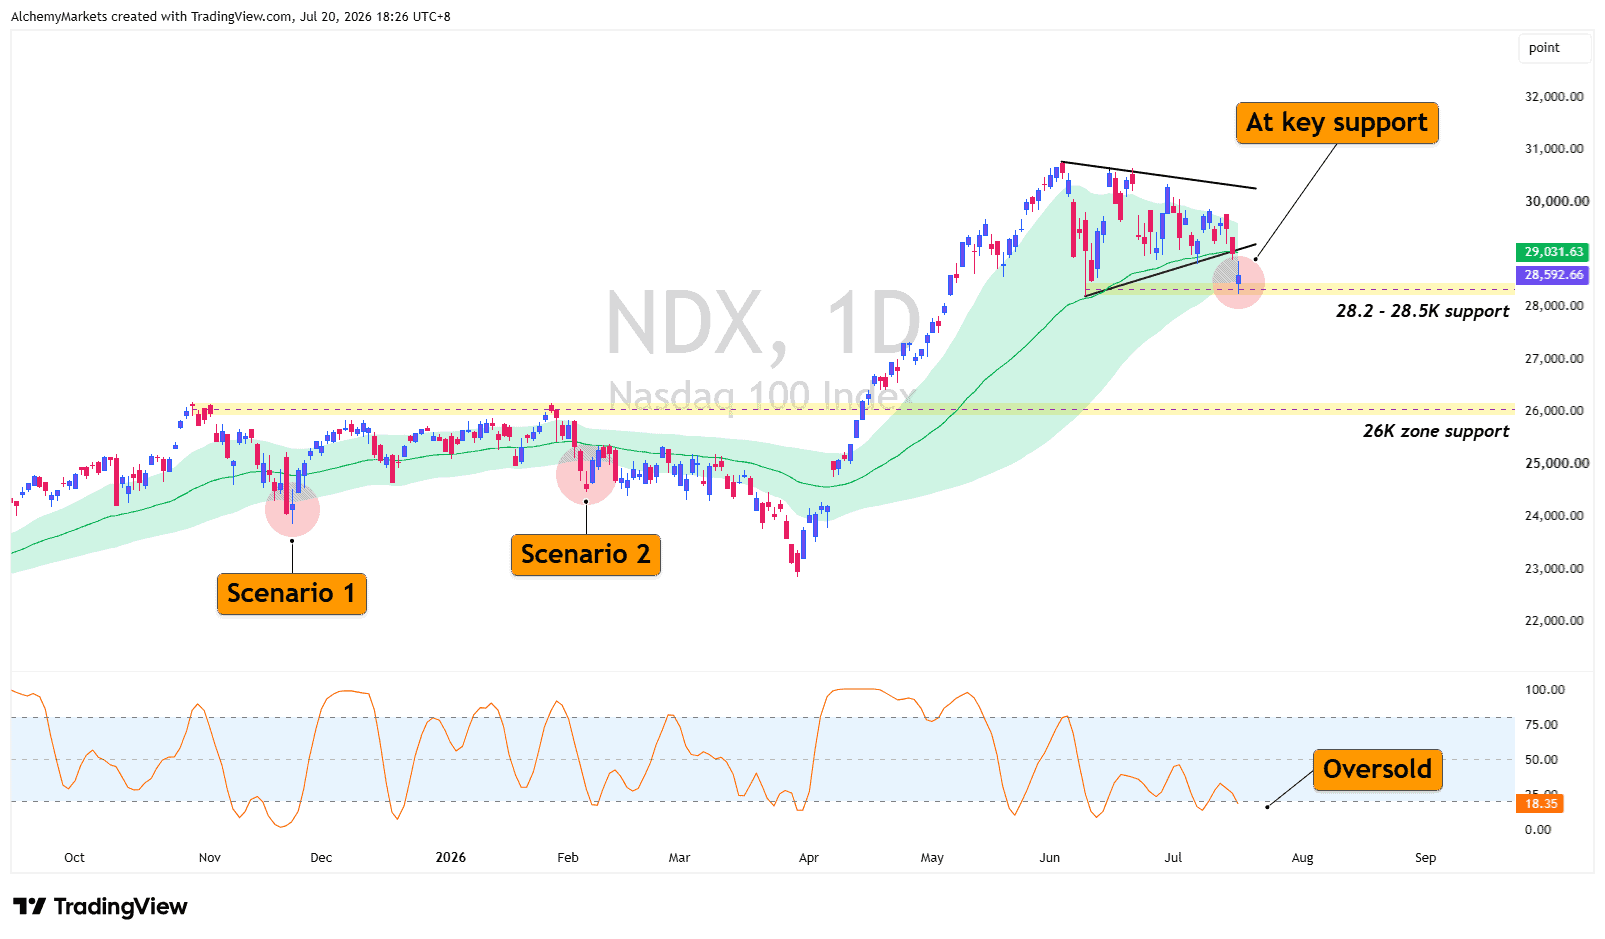
The Nasdaq 100 has slipped below its short-term consolidation and is pressing into the 28,200–28,500 support area.
Stochastic RSI is oversold, but price is also below the centre of the 50-period EMA band. That average, close to 29,000, has shifted from support into resistance.
This is why Alphabet’s report has the potential to affect more than one stock. A rebound from support followed by a recovery above the exponential moving average would suggest the earnings week has stabilised risk appetite. Continued rejection beneath the average would leave the index vulnerable to the next support zone near 26,000.
Intel and Vicor answer different questions
Intel is important, but it is not the company most likely to save the wider market. Its report is a focused test of execution: can improving data-centre demand and manufacturing progress begin to offset the cost of its foundry strategy?
A disappointing report would hurt semiconductor sentiment, but investors may still treat the weakness as company-specific.
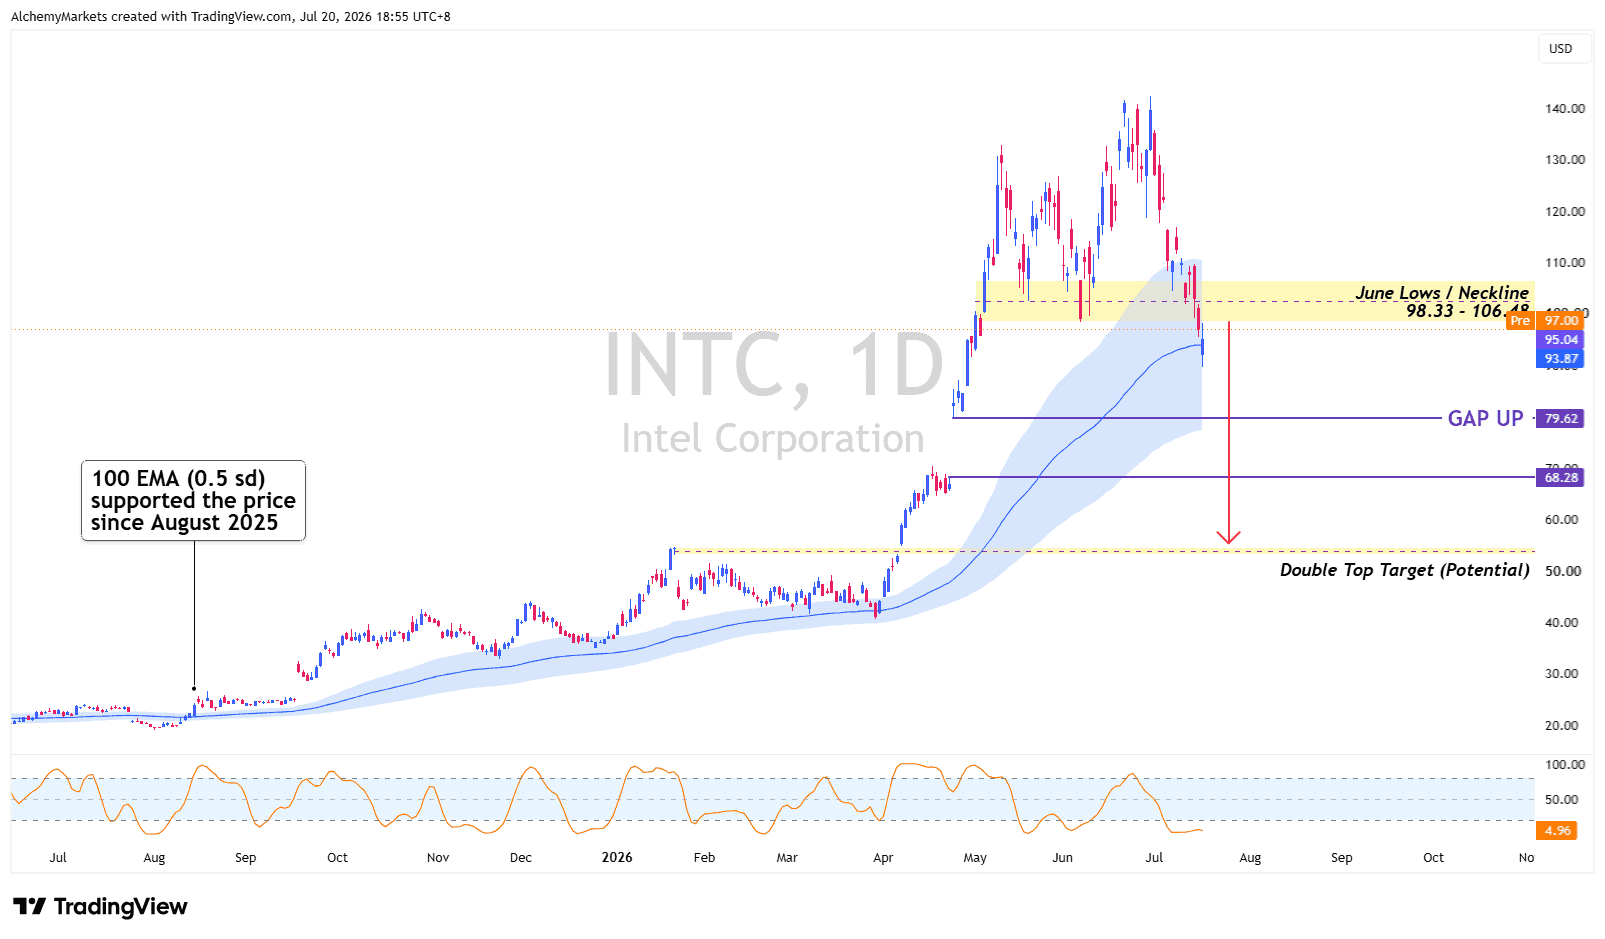
Technically, Intel has fallen through the June-low neckline at 98.33–106.46 and is testing the centre of its daily 100-period EMA band near 93.87. That band has supported the broader advance since August 2025, making the earnings reaction around 90–95 more useful than the first headline.
If the 100-period band holds and price reclaims 98.33–106.46, the breakdown would look less convincing. A sustained loss of the band would expose the gap area near 79.62.
The projected move toward the mid-50s is a double-top scenario, not a forecast, and would require a confirmed neckline break plus continued follow-through.
Vicor offers the more original read-through. The company supplies power-conversion systems used around high-performance processors and data-centre infrastructure. Its results arrive before the larger names, so orders, backlog conversion and guidance can provide an early indication of whether demand for AI power architecture remains strong.
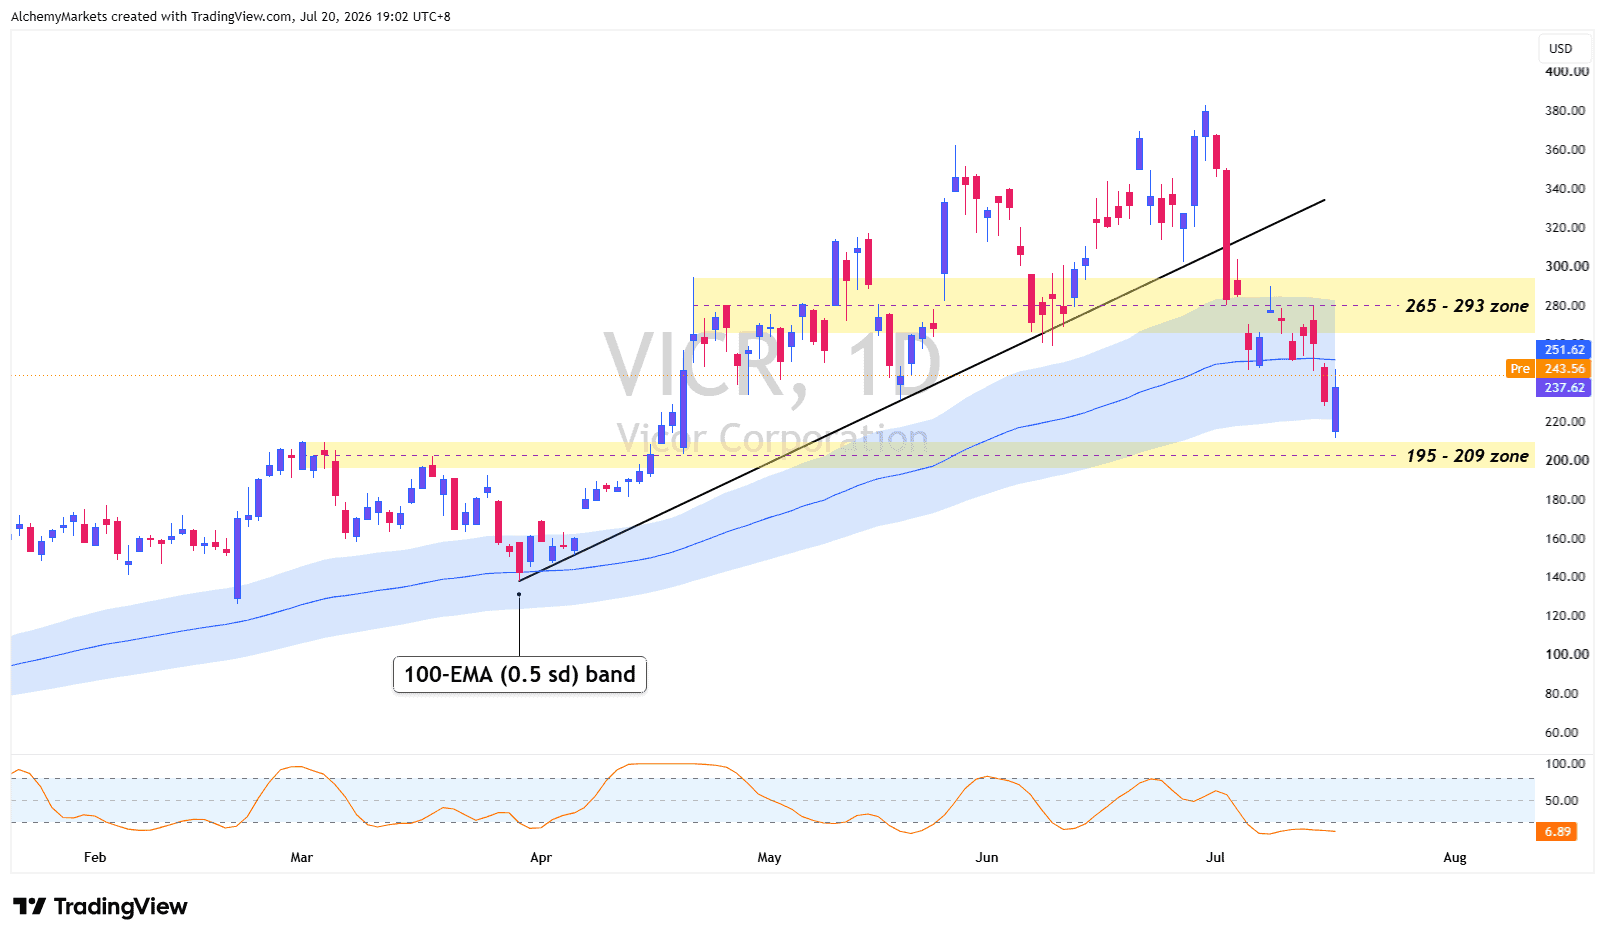
The stock has already broken beneath its 100-period band and the former 265–293 support zone. It is now trying to stabilise above the 195–209 area while momentum is deeply oversold. That can support a sharp rebound, but oversold conditions do not repair the broken trend by themselves. A recovery through 265–293 would be needed to show that buyers have regained meaningful control.
Where oil fits without repeating last week’s story
Oil should remain a backdrop rather than the lead. Higher energy prices can raise inflation expectations and bond yields, which increases the valuation hurdle for long-duration technology shares. They can also pressure consumer demand and corporate margins. That means even good earnings may receive a colder response if the macro environment keeps becoming less supportive.
For traders who want the broader mechanics, Alchemy Markets’ guide to oil CFDs explains how crude exposure is traded. In this article, however, oil matters mainly because it changes how much investors are willing to pay for future growth.
What traders should watch
| Test | Bullish confirmation | Bearish warning |
| Alphabet | Holds 337.47–349.00 and reclaims the 50-period average | Closes below support and the rising trendline |
| Nasdaq 100 | Recovers above the 50-period average near 29,000 | Loses 28,200 and fails to reclaim it |
| Intel | Reclaims the 98.33–106.46 neckline zone | Sustained break beneath the 100-period band |
| Vicor | Re-enters the 265–293 zone | Breaks the 195–209 support area |
Bottom line
Alphabet is the week’s clearest test of whether AI investment is producing enough revenue to justify its cost.
Intel will show whether the chip sell-off is also punishing company-specific execution risk, while Vicor offers an earlier check on power demand inside the AI infrastructure chain.
The key signal will not be whether these companies beat expectations. It will be whether investors reward the results.
If strong numbers cannot lift Alphabet or push the Nasdaq back above resistance, the market may be signalling that the hurdle for the AI trade has moved higher again.