Written by:


- Opening Bell
- September 23, 2026
- 5 min read
The Rally Has One Problem: Rates Haven’t Broken Yet
Stocks are still behaving like the worst of the latest macro shock may be passing. Oil has retreated from its September spike, long-end yields have eased from their extremes, and AI and semiconductor leadership remains intact.
But the rally has reached a more difficult point. USTEC (Nasdaq CFD) is sitting at all-time-high resistance while its one-hour trend is weakening, and the part of the Treasury market closest to Federal Reserve policy still has not broken lower.
That keeps the regime selectively bullish, but fragile. Equities do not need an outright dovish Fed to keep rising. They need the dollar and short-term yields to stop tightening financial conditions.
Tech is bullish, but the short-term trend is being tested
USTEC is testing short-term trend support at all-time highs while WTI reacts around $90-$92 support.
That makes a rejection here reasonable to expect since both assets inversely correlate (when one of them goes up, the other goes down).
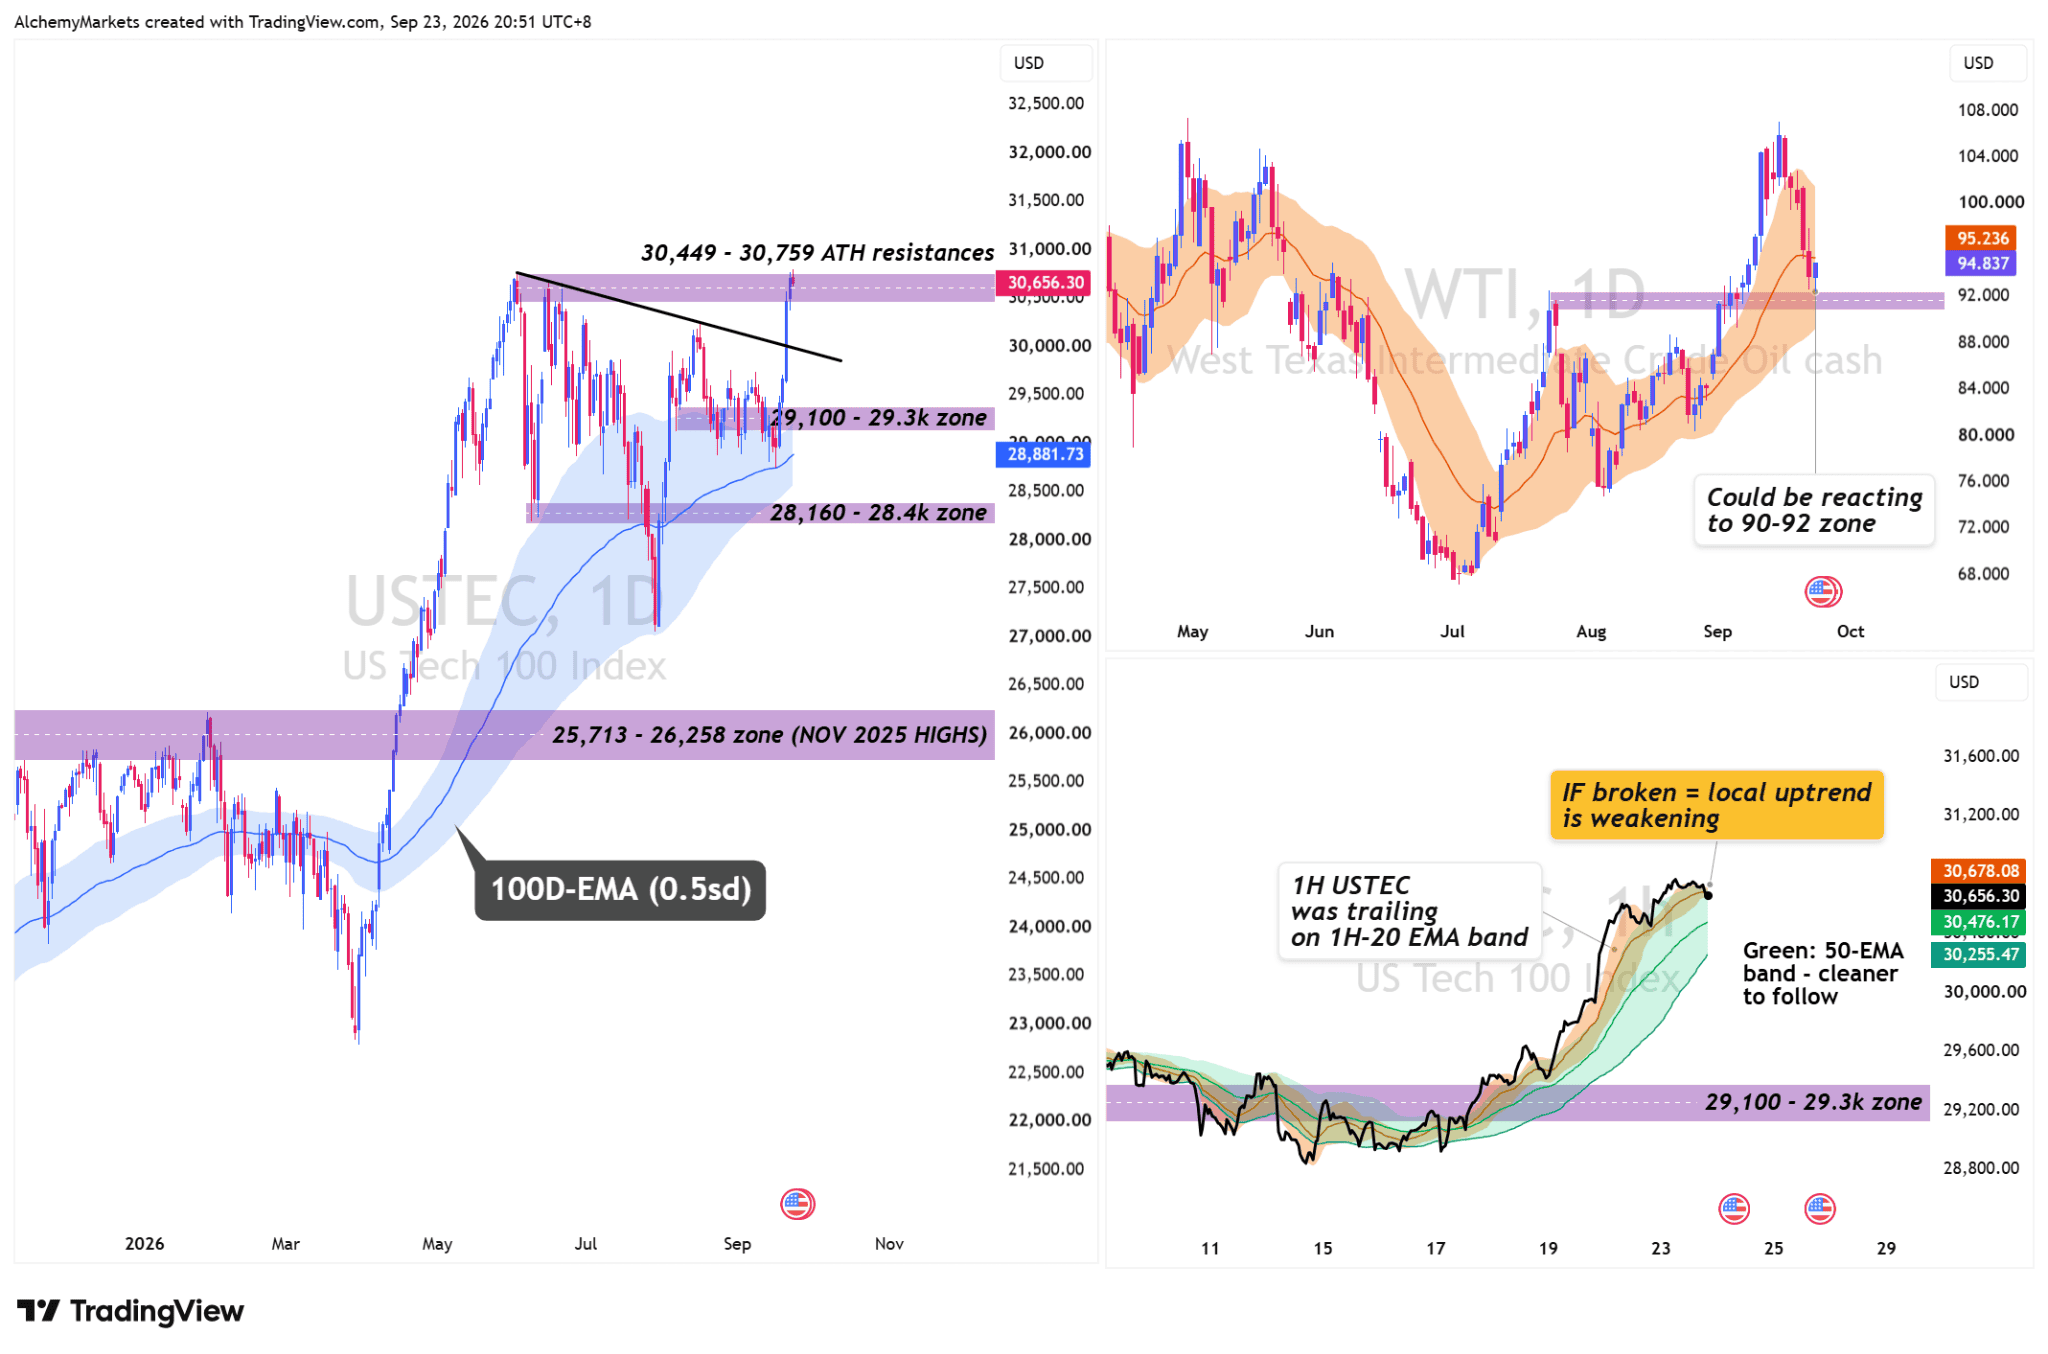
USTEC has pushed back into the 30,449-30,759 all-time-high resistance area, but the one-hour chart on the bottom right is now testing the lower edge of its 20-EMA trend.
That creates the first immediate test for the rally. If the 20-EMA bollinger bands fail, the cleaner trend to watch becomes the one-hour 50-EMA band. Note: both are set to have one standard deviation.
Around 30,255 is the lowest point I would want USTEC to hold to preserve the local bullish structure.
That brings us to another risk… the index is holding up better than the market underneath it. While weak breadth does not end the rally by itself, it also means fewer stocks are carrying more of the load.
If USTEC loses its 50-EMA structure while participation stays weak, the pullback becomes harder to dismiss as a simple reset.
In other words, a rejection from all-time highs does not automatically end the rally.
A controlled pullback that holds the 50-EMA trend can reset momentum without changing the broader direction.
Oil may be finding support again
WTI adds another complication. Crude has fallen sharply from its September highs, but it is now reacting around the $90-$92 support zone while the daily 20-EMA band is also nearby.
If that support holds and oil begins to bounce, the disinflationary relief that helped long-end yields and growth stocks could become less powerful.
Rates have eased, but they have not broken
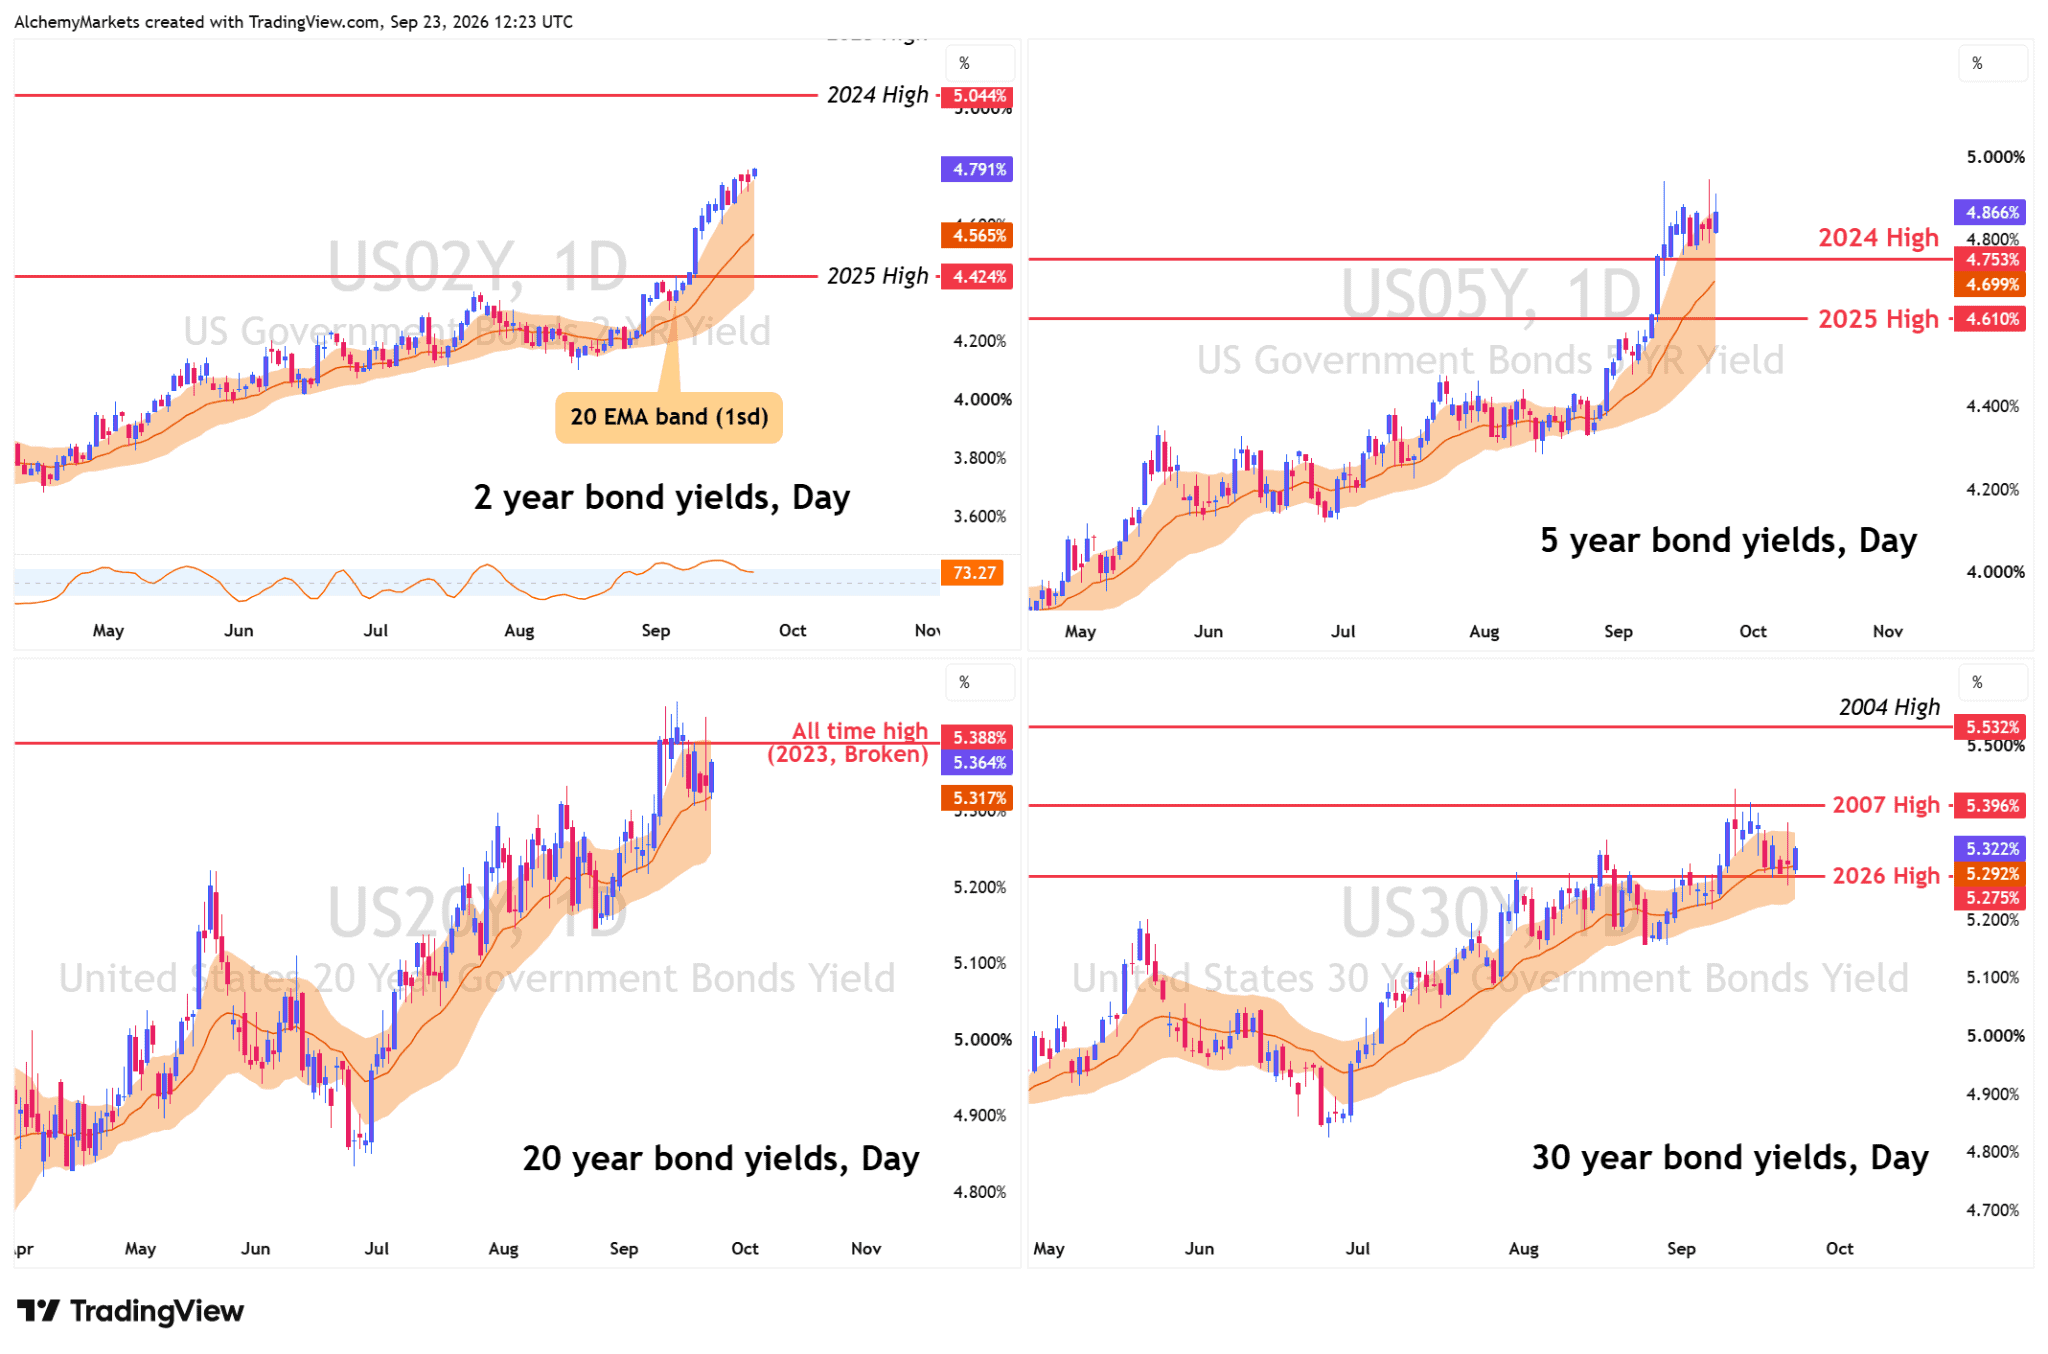
The Treasury market still remains the central macro check. And currently, it’s telling us that yield associated risks for equities and gold are still not off the table.
The US 2-year yield is still supported by its rising 20-day EMA band. And so is the 5-year, 20-year, and 30-year.
What this tells me is that rates have eased without actually breaking the trend.
If the 2-year stays elevated even as oil cools, the Fed constraint is still in place. That keeps pressure on long-duration equities, supports the dollar and limits how cleanly gold can recover.
So even if October hike expectations cool at the margin (roughly at a 50% rate hike expectation), the technical trend has not yet confirmed an easier front-end regime.
The caveat for bulls is this: yields do not need to collapse. They just need to stop making fresh highs and, ideally, the 2-year needs to lose its 20-day EMA band.
Until that happens, the rally remains more dependent on earnings, AI leadership and positioning than on broad macro relief.
DXY is the confirmation layer
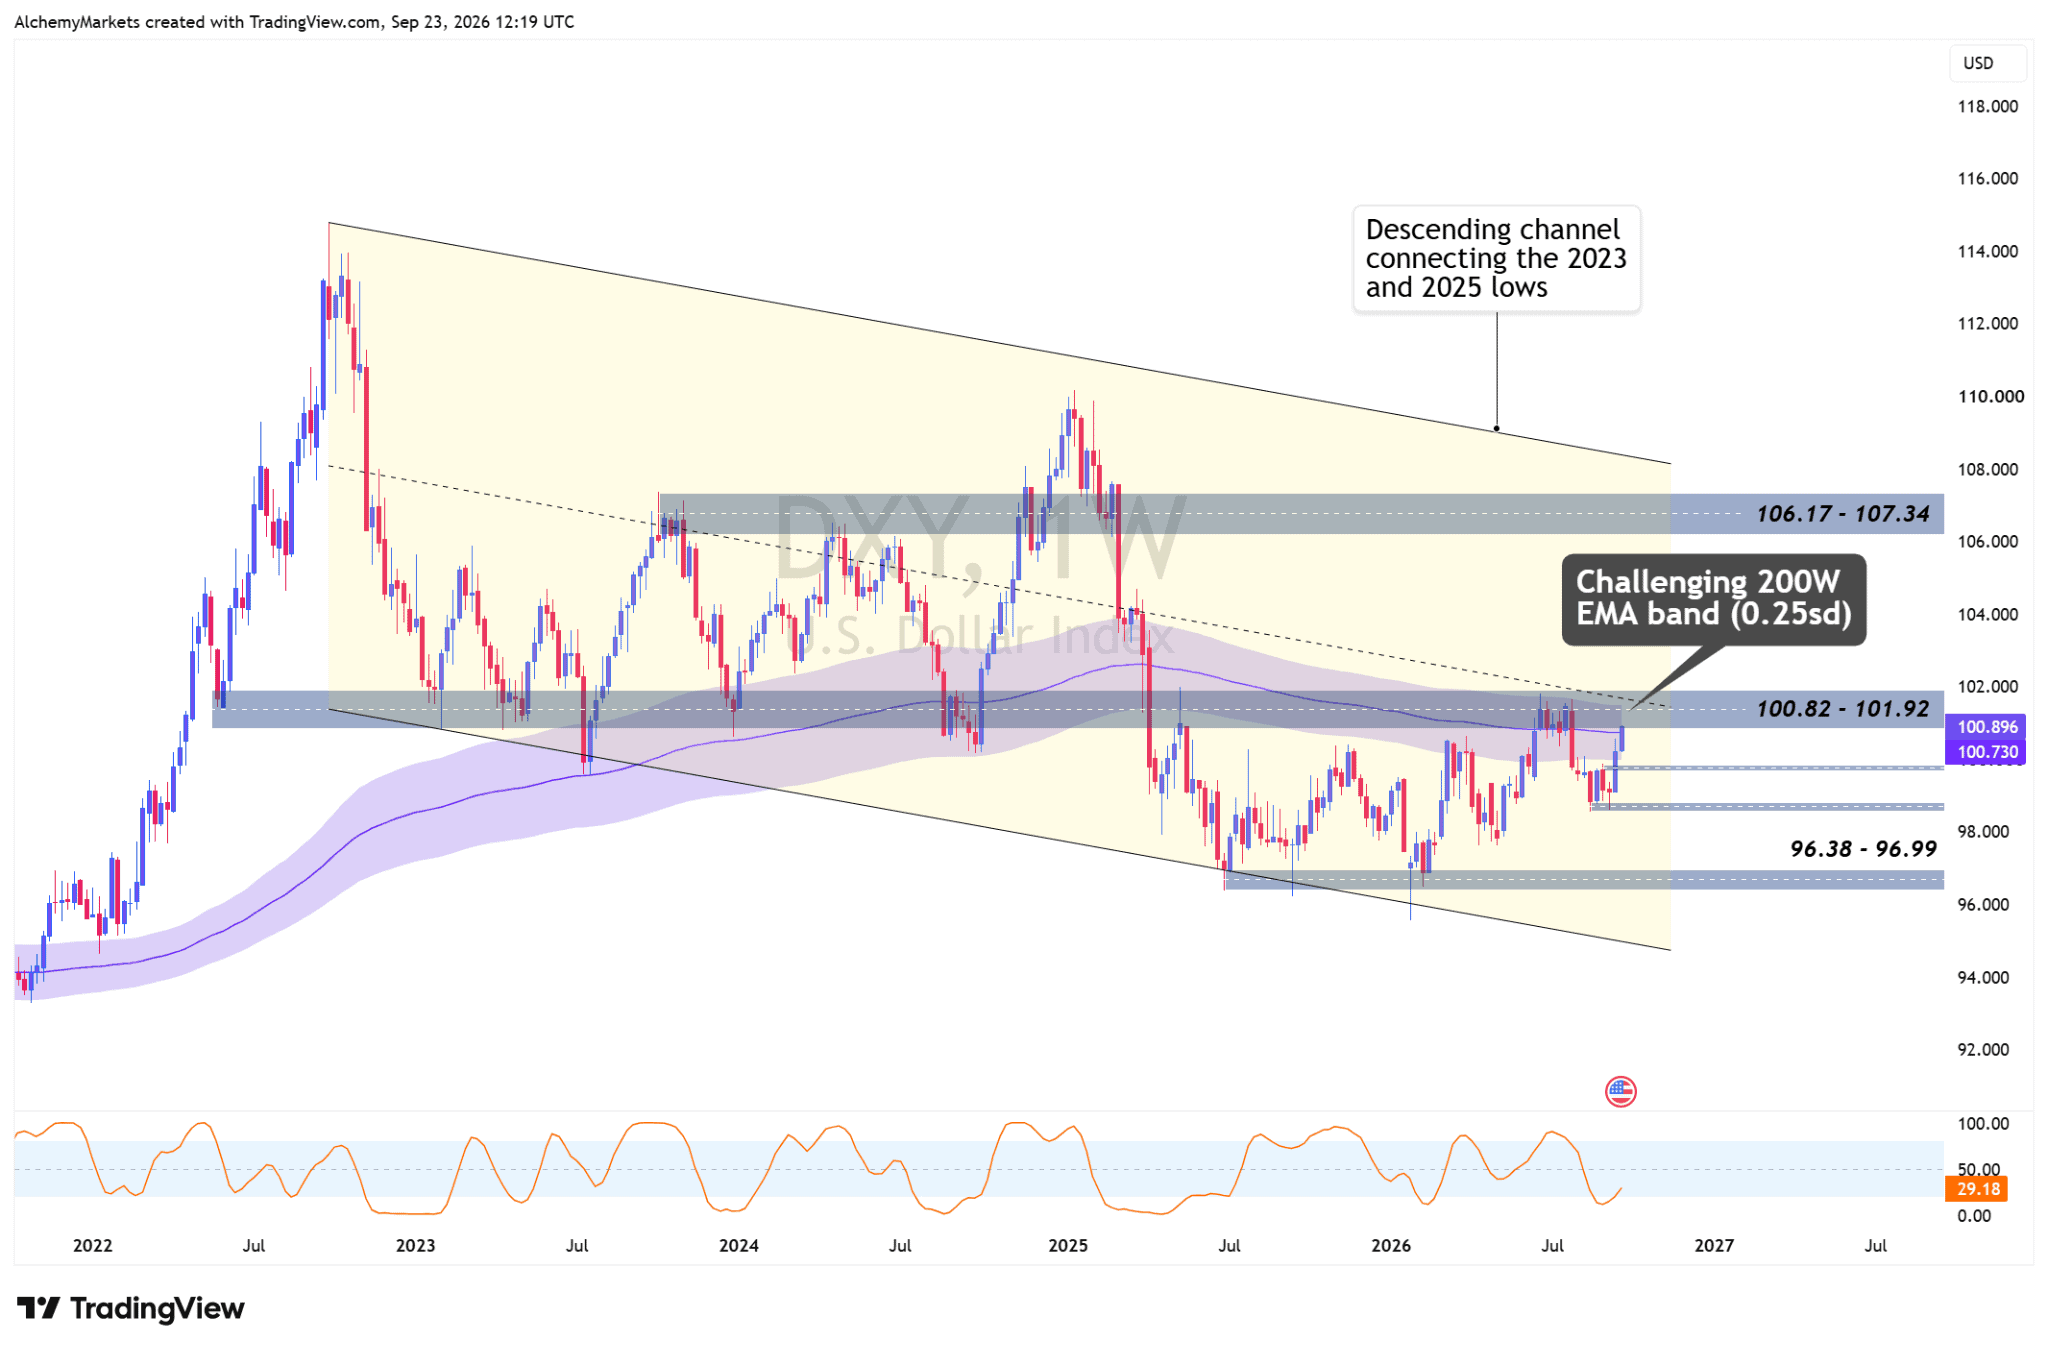
The dollar is challenging its weekly 200-EMA band, which remains an important regime boundary.
A rejection keeps 99.7 and then 98.5 in view and would be constructive for equities and gold. A clean weekly break higher would instead warn that financial conditions are tightening again.
The key combination is therefore simple: USTEC holds its local trend while DXY fails at weekly resistance and the 2-year finally rolls over. That would materially improve the quality of the rally.
AI is still working, but capital is becoming selective
The latest stress in AI financing should not automatically be read as an AI demand collapse.
Project Jupiter financing linked to Oracle’s data-centre buildout has traded at stressed discounts, while other large infrastructure projects have faced tougher funding conditions. Yet AI equities and semiconductor demand remain firm, at least for now.
The message is that investors are separating funded demand, cash flow and real backlog from projects that require repeated access to expensive capital.
That is still compatible with higher AI equities. The risk grows if credit stress starts spreading from project finance into the listed leaders themselves.
Gold has a clear trigger
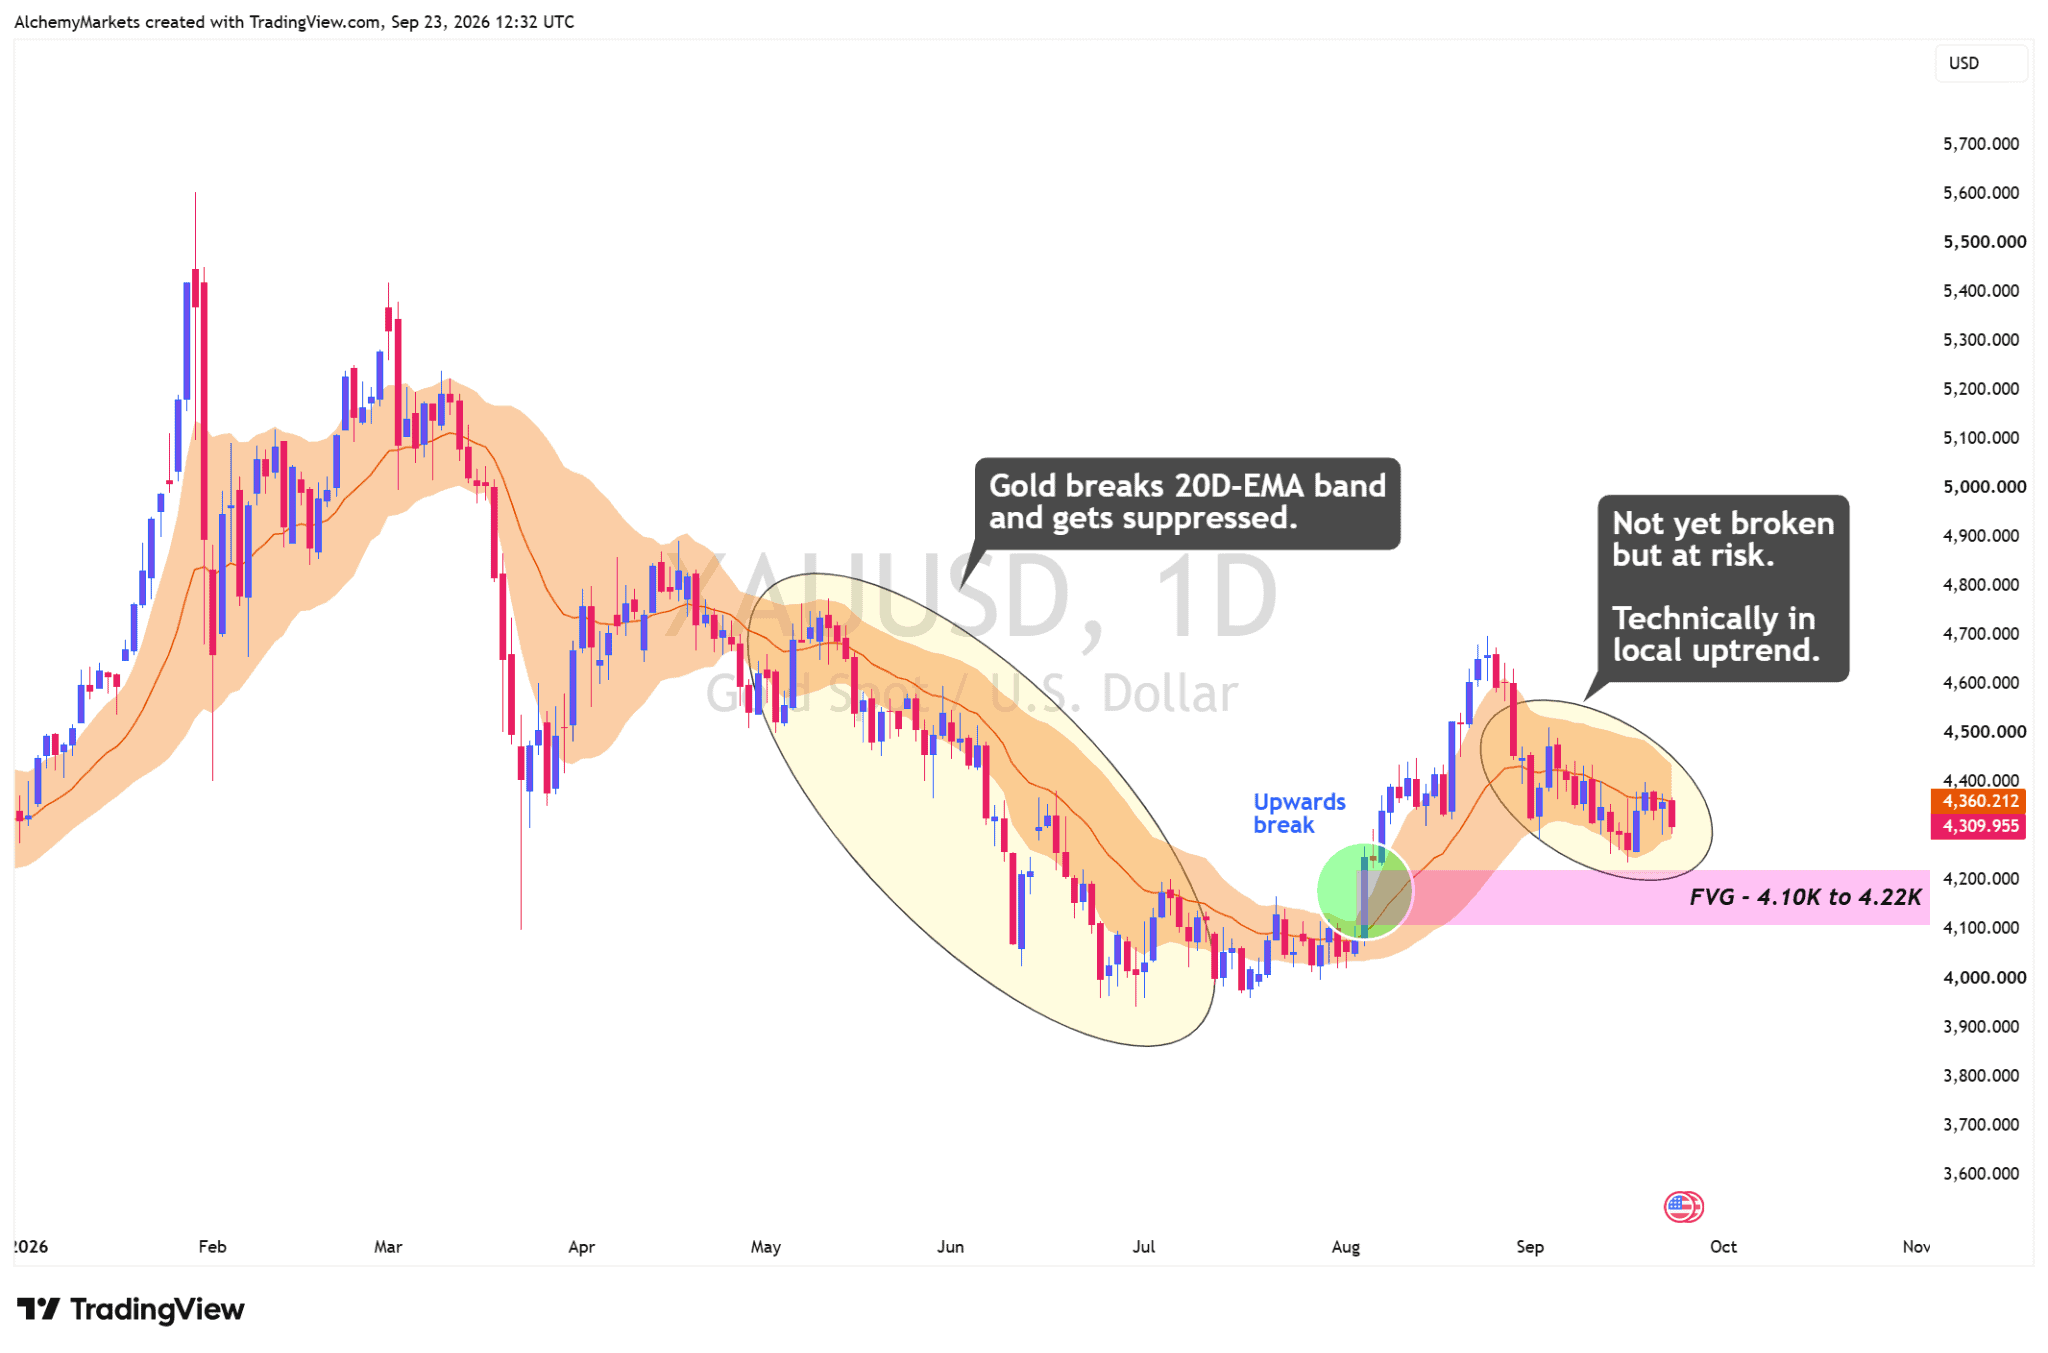
Gold remains caught between lower long-end pressure and a still-firm dollar and front end yields.
The cleaner technical confirmation remains the daily 20-EMA band. A daily close above roughly $4,430 would materially improve the setup and suggest that the market is beginning to look through the current rate pressure.
If gold moves lower first, the $4,100-$4,220 fair-value-gap area is worth watching, with roughly $4,000 acting as the deeper speculative reversal zone.
What matters now
The rally remains locally bullish while USTEC holds the one-hour 50-EMA structure and the 30,266 area. A rejection from all-time highs can still be constructive if that support survives.
However…
The risk case is that oil rebounds, DXY breaks higher, the 2-year stays supported and USTEC loses its 50-EMA trend. That would turn today’s fragile risk-on regime into something much harder to trust.
For now, the market is bullish enough to respect, but not loose enough to chase blindly.